

Salinity as a major influence on groundwater microbial communities in agricultural landscapes
Tess Nelson A , Grant C. Hose A * , Jodie Dabovic B and Kathryn L. Korbel A
A
B
Abstract
Understanding the impacts of salinity on groundwater microbial communities is imperative, because these communities influence groundwater chemistry, quality, and its suitability for use by humans and the environment.
To assess groundwater salinisation and its influence on groundwater microbial communities within the Murray–Darling Basin (MDB), Australia.
Alluvial aquifers were sampled from 41 bores, within the Lachlan, Murrumbidgee and Murray catchments. Environmental DNA (eDNA), microbial activity and water-quality variables were measured to evaluate microbial communities, which were then correlated with electrical conductivity (EC) and other environmental variables.
Our results indicated widespread groundwater salinisation within the MDB, with EC ranging from 63 to 51 257 μS cm−1. The highest EC values were recorded in the Murray catchment; however, mean EC values did not differ significantly among catchments (P > 0.05). The composition of microbial communities differed significantly between sites with low (<3000 μS cm−1) and high (>3000 μS cm−1) EC. Microbial activity, richness and abundances were all greater at low- than high-EC sites.
Changes to microbial communities as demonstrated here may have impacts on biogeochemical cycling and ecosystem resilience.
The detrimental ecological impacts of salinity are not limited to groundwater microbes, but present a larger ecological issue affecting all groundwater-dependent ecosystems.
Keywords: 16S rRNA, agricultural landscape, aquifer, groundwater quality, microbial community, Murray–Darling Basin, salinisation, subterranean ecosystems.
Introduction
Salinisation is the accumulation of salts within an environment and can be both from natural mineral weathering or induced by land-use practices (Halse et al. 2003). Salinisation degrades the health of freshwater and soil ecosystems and poses a substantial threat to water resources globally (Ghassemi 1995; Halse et al. 2003; Li et al. 2020). Australia has the highest proportion of salt-affected soils in the world, with dryland salinity threatening up to 5.7 × 10⁶ ha of Australia’s cultivatable land (Cartwright et al. 2007). Alongside climate change, salinisation is arguably the most serious long-term environmental issue in inland Australia (Cartwright et al. 2004) and poses a major threat to the Murray–Darling Basin (MDB), Australia’s largest river system and most productive agricultural region (Holland et al. 2015).
Salinity in the MDB is, in part, due to numerous marine inundations of the Australian continent over geological time, which have resulted in a hypersaline geology and naturally saline aquifers (Herczeg et al. 2001), and has been exacerbated since European settlement by land clearing for agriculture and rising water tables as a result of reduced evapotranspiration (Coram et al. 2000; Hart et al. 2020). Irrigation and river regulation further contribute to dryland salinity by raising water tables, which transport dissolved salts from deeper geological layers to the surface (Cartwright et al. 2007; Li et al. 2020). Many soils in the MDB are naturally susceptible to leaching of salts, and the likelihood of salt mobilisation into groundwater is directly related to the vegetation and soil types (Humphreys 2009; Lamontagne et al. 2014).
Salinisation is a major threat to the biodiversity and integrity of Australia’s inland freshwater ecosystems (Halse et al. 2003; James et al. 2003; Jolly et al. 2008) and is largely attributable to human activities (Holland et al. 2015; Hart et al. 2020). However, although salinisation in aquifers is recognised as a major threat to water quality, the effects on groundwater ecosystems and ecosystem services (Griebler et al. 2019) have only recently been identified as being of major concern (Bennetts et al. 2006; Shapouri et al. 2016). The impacts of salinity on groundwater microbial communities (Tian et al. 2005; Korbel and Hose 2015) are poorly understood, despite their importance to biogeochemical processes, including nutrient and carbon cycling, and water purification (Griebler and Lueders 2009; Sang et al. 2018; Hofmann et al. 2020). Previous studies have indicated that groundwater microbial communities vary with increasing aquifer salinity (Chen et al. 2016; Sang et al. 2018), and in response to saltwater intrusion (Bouvier and del Giorgio 2002; Héry et al. 2014), with increases in salinity being linked to a decline in species abundance and richness (Beyer et al. 2016). Korbel and Hose (2015) identified salinity as a primary correlate of microbial activity in shallow aquifers of the northern MDB. However, the impact of salinity on individual microbial taxa and community structure within aquifers remains largely unknown.
Our hypothesis is that microbial communities will vary in composition, richness and activity with salinity. Accordingly, the aims of this study were to (1) determine the current extent of aquifer salinisation, (2) characterise the prokaryote communities, and (3) use hydro-chemical data to evaluate relationships between microbial communities and salinity within groundwaters of the MDB. By understanding these interactions and the consequences of increasing aquifer salinisation on biota, land managers may be able to mitigate impacts from future salinisation threats, such as groundwater abstraction, river regulation and climate change, so as to improve sustainable management of groundwater.
Materials and methods
Study area
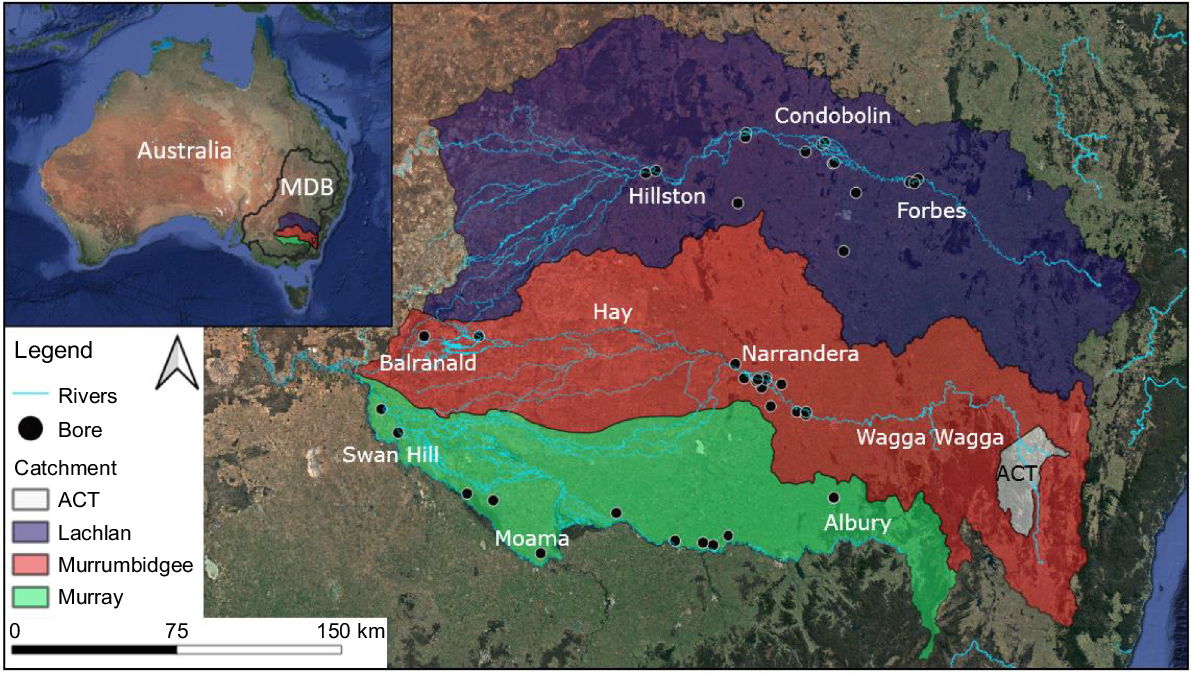
This study was conducted in lowland areas of the Murray, Murrumbidgee and Lachlan River catchments of the Murray–Darling Basin, New South Wales (NSW), Australia (Fig. 1). The shallow alluvial aquifers in these adjacent catchments share similar geological formations and complexity (Kingham 1998). All bores sampled accessed the Coonambidgal Formation alluvial aquifers (<45 m deep), consisting of layers of gravels, sands and silts (Kumar 2010). Bores at 41 sites were sampled twice between March and July 2019, ~5 months apart. A total of 14 sites were sampled in the Murrumbidgee, 12 in the Murray and 15 in the Lachlan catchments. However, one site each within the Murray and Murrumbidgee catchments were inaccessible during the March sampling trip (totalling 80 sites over the two time periods). All bores were selected on the basis of accessibility and depth (5–45 m), and restricted to those owned and managed by Water NSW. Bores were constructed of 50 mm (diameter) PVC casings, completely enclosed, except for discrete sections ~1 m long, with vertical slots that allow the entrance of groundwater from the aquifer.
The MDB is an intensive agricultural region dominated by dryland cropping, irrigated mixed farming, intensive irrigated agriculture, cattle grazing and horticulture (Ross 2012). The MDB has a semi-arid climate, with an average rainfall of ~500 mm year−1 (Bureau of Meterology 2022), predominantly received in winter. The flux between drought and flood occurs approximately every 9 years (Leblanc et al. 2012), with the region experiencing drought conditions at the time of the study (Department of Primary Industry and Environment 2019). Severe droughts are common and water insecurity is the largest recurring issue in the region (Barbieri et al. 2023). Water for irrigation is drawn from both surface and groundwater sources, with the current groundwater abstraction volumes expected to double by 2030 (CSIRO 2008; Ross 2012).
Sample collection
Prior to sampling, the bore standing water level (SWL) was measured and then bores were purged by pumping 180 L of water by using a motorised inertia pump (Waterra Power pump II, Waterra, Mississauga, ON, Canada). This volume exceeded three bore volumes as recommended for purging (Sundaram et al. 2009) and ensured that water-quality and microbial samples were representative of the surrounding alluvial aquifer and not the stagnant water within the bore (Korbel et al. 2017). The interior and exterior of the pump tubing was sterilised with sodium hypochlorite and rinsed with distilled water between samples to eliminate cross-contamination (Dickie et al. 2018).
After purging, groundwater was pumped into a 10-L container, and electrical conductivity (EC), pH, temperature and dissolved oxygen (DO) were measured using a YSI ProPlus water-quality probe (YSI, Yellow Springs, OH, USA). A 200-mL sample of groundwater was collected in a sterile plastic container and immediately frozen at −30°C, with an additional 60 mL filtered (0.2 μm, sterile membranes; Sartorius, Germany) and fixed with hydrochloric acid and transported on ice. Water samples were analysed for total nitrogen (total N), total phosphorus (total P), nitrate (NO3−), ammonia (NH4+), sulfate (SO42−), dissolved organic carbon (DOC), manganese (Mn) and total dissolved ferrous iron (Fe2+) concentrations at Sydney Analytical Laboratory (Seven Hills, Sydney, NSW, Australia) by using standard methods (see Supplementary Table S1).
Environmental attributes including sediment volume, sediment type (following Wentworth 1922), tree cover (calculated as number of trees >5 m tall within a 50-m radius from bore) and land use (e.g. cropping, grazing, conservation land) were recorded at each site (see Supplementary Table S2). With few grazing and conservation sites across the study area, land use was reduced to a comparison of sites with and without irrigation infrastructure, of which the latter included a small number of grazing sites and one conservation site.
Water samples for environmental DNA (eDNA) analysis were collected after purging, by pumping an additional 2 L of groundwater directly into a sterile container, which was stored on ice in the dark until processing. Samples were processed within 7 h of sampling by vacuum filtration (in duplicate) through sterile 0.2-μm mixed cellulose-ester membranes (Pall Corporation, Port Washington, NV, USA). Samples were thoroughly shaken before filtering to resuspend sediments in the sample and ensure both sediment-attached and free-living microbes were incorporated in the filtered sample. The volume of filtered groundwater varied between 0.25 and 1.75 L per replicate, dependent on the quantity of fine sediment within the sample. Filters were transferred into sterile Petri dishes and stored at −20°C until DNA extraction occurred. All filtration equipment was sterilised using ethanol and flaming between samples. For quality assurance, trip blanks (filter sealed for the entire trip) and field blanks (a filter processed with 1 L of DNA-free water in the field) were prepared on or before each trip (Dickie et al. 2018). These blanks were stored and transported with other field-collected samples.
Sample processing
Filters were thawed and then aseptically cut into small pieces (~3 mm2) and 0.35–1.5 g of filter paper and sediment were added to an extraction vial. DNA was extracted using the DNeasy Power Soil Kit (Qiagen, Hilden, Germany) (Zhou et al. 2012), following the amended protocol for low biomass water, which included prolonged incubation periods and repetition of ethanol rinses (Korbel et al. 2017). DNA samples were stored at −40°C for further analysis. Two laboratory blanks consisting of no filter or sediment were also processed.
Quantitative polymerase chain reaction (qPCR) was undertaken on a subset of eDNA samples on a Roche Light Cycler 480 using non-tagged primers, to assess for PCR inhibition and confirm DNA amplification. PCR was performed to amplify the V4 region of the 16S region of the rRNA gene for prokaryotes by using the primers 501FB – GTGYCAGCMGCCGCGGTAA and 809RB – GGACTACNVGGGTWTCTAAT (Júlio et al. 2019). A 96-well plate with DNA samples and controls (seven blanks, two PCR negative controls and two PCR positive controls) was established where samples were arranged with a blank well in each column, and random interspersed positive (synthetic bacterial DNA) and negative (DNA-free H2O) controls to ensure that there was no systematic bias. PCRs were completed using a Master cycler X50s (Eppendorf, Germany), with the following conditions: initial denaturation at 95°C (10 min), followed by 35 cycles of denaturing (94°C for 45 s), annealing (50°C for 60 s), extension (72°C for 90 s) and final extension period of 72°C for 10 min (Caporaso et al. 2012). After PCR, products were visualised on an agarose gel electrophoresis to determine success of amplification against a 100-bp size ladder (Qiagen Australia) (Van Bekkum et al. 2006). A PicoGreen double-stranded DNA quantitation assay (Life Technologies, Australia) and a PHERAstar FSX plate reader (BMG Labtech, Germany) were used to quantify the concentration of extracted DNA (Van Bekkum et al. 2006). DNA from each sample was pooled in equimolar concentrations and amplicons were purified with AMPure XP DNA purification beads (Beckman Coulter Life Sciences). The final library was sequenced at the Ramaciotti Centre (University of New South Wales, Australia) on an Illumina MiSeq (ver. 2, see https://sapac.illumina.com/systems/sequencing-platforms/miseq.html) 2 × 250-bp sequencing run.
Metabarcoding results were processed using the Greenfield Hybrid Analysis Pipeline (GHAP, ver. 2.2, created by CSIRO, Australia, see https://doi.org/10.4225/08/59f98560eba25). The GHAP pipeline uses USearch tools (ver. 11, see http://drive5.com/usearch/; Edgar 2013), along with additional taxonomic classification tools, to cluster and classify sequences, such as the Ribosomal Database Project (RDP) Classifier (Wang et al. 2007). The pipeline generates an operational taxonomic unit (OTUs) table with taxonomic classifications and closest species assignments, along with specified read counts for each sample. Within the GHAP pipeline, data were rarefied and cleaned by a series of steps that demultiplexed, trimmed poor-quality reads, merged overlapping areas of paired reads, clustered sequences into OTUs (97% similarity threshold), filtered and removed non-target OTUs as well as PCR artefacts and classified OTUs (RDP). OTUs were normalised against the positive controls, low-abundant OTUs were removed (<10), organelles were removed, unassigned taxa at kingdom level were removed and rarefaction completed.
To measure total microbial activity, a sterilised 4- × 20-cm cotton strip was deployed in each bore after water and eDNA sampling was completed (Lategan et al. 2010). This method assesses the degradation of cotton strips as a surrogate measure for microbial activity (Lategan et al. 2010; Korbel et al. 2013). Cotton was enclosed in a plastic mesh and left suspended in the water column for 6 weeks, then air dried and treated by removing 3 mm of threads from each side (to remove edge effect). The cotton strips were then cut into three sections (top, middle and bottom), and tensile strength was measured using a pneumatic tensiometer Universal Testing Machine (UTM Instron 6022 10-kN load frame) with 2.5-cm2 flat plate grips (Lategan et al. 2010). Tensile strength (MPa) was recorded for each triplicate. Two cotton strips, placed in sterile water at 18°C for a 6-week period, were processed as controls. Cotton strips indicating cementation, a microbial process where the cotton threads cement together, increasing the overall strength, were excluded from analyses.
Statistical analysis
The plotted distribution of EC values among all sites had a break at ~3000 μS cm−1 (Supplementary Fig. S1). Accordingly, we defined EC categories as high when >3000 μS cm−1 and low when ≤3000 μS cm−1 and used these groups as a factor in subsequent analyses. Further, we considered that samples collected from the same bore 5 months apart were temporally independent.
Water-quality analysis was performed on 30 samples from the Lachlan, 23 samples from the Murray and 27 samples from the Murrumbidgee catchments. Variables analysed were EC, total P, total N, NO3−, NH4+, SO42−, DOC, Fe2+, Mn and the site characteristic tree cover, land use and sediment type. The water-quality and site-attribute variables were analysed using three-factor general linear models (GLM), with catchments, sampling period and EC category all as fixed factors. Differences in EC within categorical variables were analysed using ANOVA. Relationships among continuous environmental variables were analysed using Pearson correlation. Highly correlated variables (r > 0.90) were excluded from multivariate analyses (Clarke and Ainsworth 1993).
Sequence data for the 16S rDNA gene were pooled by order then standardised per sample to transform read number per OTU to relative abundance per sample. Although we recognise the limitations of using amplicon sequence numbers as a surrogate for taxonomic abundance, there is currently no consensus for the best methodology for the analysis of such data (Deiner et al. 2017; Korbel et al. 2017; Thompson et al. 2017). Relative abundance data were square-root transformed (Hellinger transformation) and a similarity matrix was calculated using Bray–Curtis index (Clarke et al. 2006). Non-metric multi-dimensional scaling (nMDS) was used to visualise differences in microbial communities within and between catchments and EC groups. Permutational ANOVA (PERMANOVA) was used to compare microbial communities among catchments and between EC categories, with SIMPER analysis completed to identify microbial orders responsible for the dissimilarity among catchments and between EC categories. Distance-based linear modelling (DistLM) was run to examine the relationship between environmental variables and microbial communities across the region and in each catchment, with environmental and water-quality variables being normalised prior to analysis. Results were visualised on a distance-based redundancy analysis (dbRDA) to compare relationships between EC categories. Categorical and ordinal variables land use and sediment type were not included in the dbRDA analysis.
Order richness, Pielou’s evenness and Shannon’s diversity were calculated from the square root-transformed relative abundance data and analysed using three-factor GLM for differences among catchments, and between EC categories and sampling periods. Forty microbial orders ranked by highest relative abundance were analysed using a three-factor GLM to discern differences in abundance among catchments, and between EC categories and times of sampling. Where significant differences were observed in the GLM, post hoc analysis was conducted using a one-way ANOVA with Tukey’s post hoc analysis to determine where differences were observed at a factor or interaction level. Assumptions of ANOVA were assessed using plots of residuals (homogeneity of variance) and Q-Q plots (normality) and data were log10 transformed where necessary to meet assumptions.
ANOVA was used to determine whether there was a difference in tensile strength (microbial activity) among the top, middle and bottom sections of the cotton strips. No significant (P > 0.05) difference was recorded, so an average measure was calculated for each sample. Tensile strength of strips was compared among catchment, EC category and sampling period, by using a three-factor GLM as described above.
All univariate analyses were performed using Minitab (ver. 17, Minitab Inc, State College, PA, USA, see https://www.minitab.com/en-us/products/minitab/). Multivariate analyses (nMDS, PERMANOVA, dbRDA and DISTLM) were performed using PRIMER-E (ver. 7, Primer-E, Auckland, New Zealand, see https://www.primer-e.com/). The significance level (α) for all inferential analyses was 0.05.
Results
Electrical conductivity of the groundwater across the study region varied between 63 and 51 257 μS cm−1 (Fig. 2). The pH of the groundwater was circum-neutral, ranging from 6.0 to 7.7. Dissolved oxygen was below 4.5 mg L−1 at all sites and sampling times, except for Site 90029 in the Lachlan catchment, which had DO of ≥6.49 mg L−1 on both sampling occasions.
Electrical conductivity (EC) values of alluvial groundwater at sites across Lachlan, Murrumbidgee and Murray River catchments of the southern Murray–Darling Basin. ACT, Australian Capital Territory. Circle size reflects EC values at a site averaged across the two sampling periods.
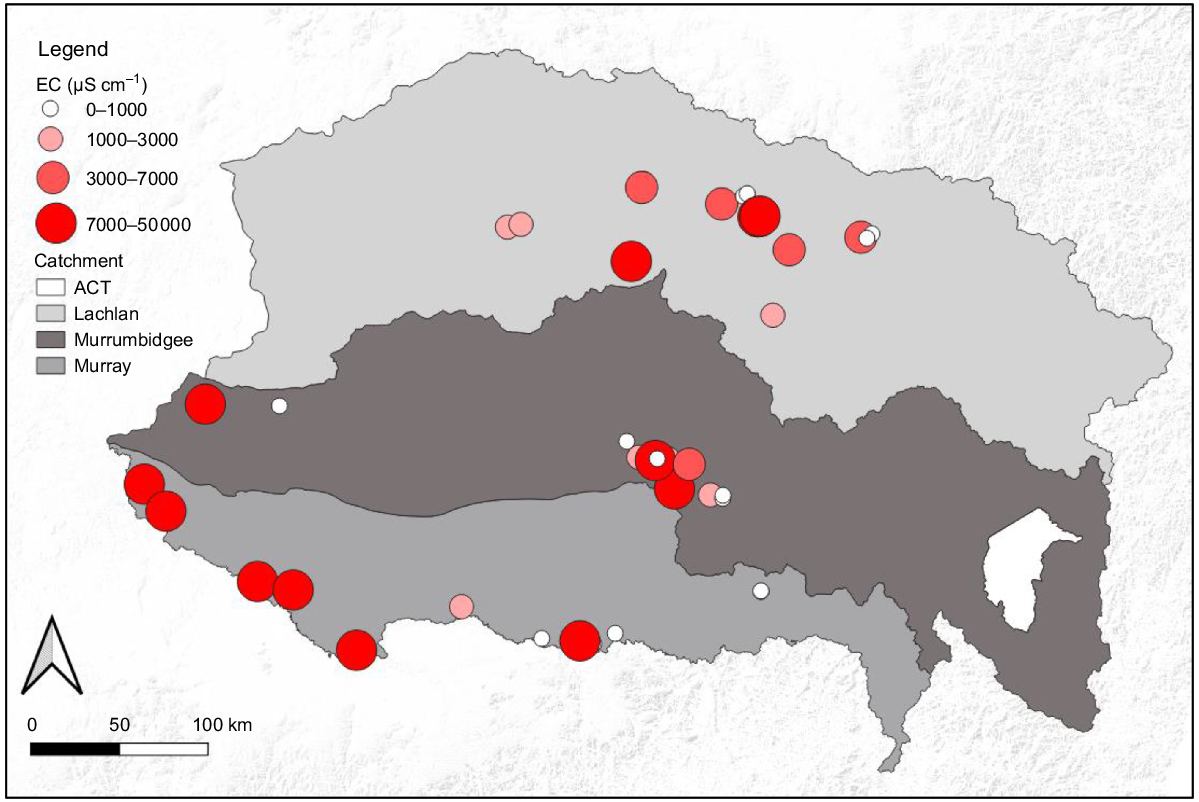
The highest EC values (up to 51 257 μS cm−1) were recorded in the Murray catchment. The Murrumbidgee and Lachlan catchments generally had lower EC values, with the Lachlan having only two sites with EC greater than 30 000 μS cm−1 (Fig. 2), and the Murrumbidgee having all samples below 14 000 μS cm−1 (Fig. 2). The mean (±s.d.) EC value in the Murray (15 652 ± 17 892 μS cm−1) was more than twice that of the Lachlan (6352 ± 10 816 μS cm−1) catchment and five times that of the Murrumbidgee (3079 ± 3697 μS cm−1) catchment. The standard deviations of those means reflect the large variability in values within each catchment, and hence the need to log10 transform those values prior to ANOVA. There was no significant difference in mean log10 EC values among catchments (P = 0.225) or between sampling periods (P = 0.938), and the catchment × sampling period interaction was also not significant (P = 0.662) (Supplementary Fig. S2). A clear spatial EC gradient, increasing from east to west was evident in the Murray catchment; however, a similar gradient was not clearly evident in the Murrumbidgee or Lachlan catchments (Fig. 2). There was a significant difference in EC values between tree-cover categories (P < 0.001); sites without trees had a significantly higher EC than did those with trees (P < 0.05).
Total P (log10) varied with catchment and sampling period (catchment × sampling period, ANOVA; F = 3.39, P = 0.039). The main effect of sampling period was also significant (F = 9.91, P = 0.002), but differences among catchments were not (F = 1.31, P = 0.275) (Fig. S2). Total P concentrations were significantly higher in the Murray catchment in March (Fig. S2) than in the other catchments and sampling periods. Total N concentrations (log10) were significantly higher in the Murray catchment than in the other catchments (F = 3.45, P = 0.037); there was no effect of sampling period, and the catchment × sampling period interaction was not significant (P > 0.05). The values of pH and log10-transformed Fe2+ concentrations differed significantly among catchments (P < 0.05), but were similar over time (P > 0.05), and neither variable had a significant (P > 0.05) temporal interaction (Fig. S2). The Murray catchment had significantly higher total dissolved Fe2+ concentrations than did the Lachlan, but not the Murrumbidgee, catchment (ANOVA: F = 3.56, P = 0.033) (Fig. S2). The Murray catchment had a significantly lower pH than did the Murrumbidgee and Lachlan catchments (ANOVA: F = 12.41, P < 0.001) (Fig. S2). Last, no significant differences were found in SO42− and NO3− concentrations among catchments or between sampling periods (Fig. S2). All other water-chemistry variables, including NH4+, DOC and Mn, did not differ significantly among catchments and between sampling periods, and relevant interactions were not significant (P > 0.05) (data not shown).
Microbial communities
The final data set contained 79 samples and ~2.62 million reads containing 13 190 OTUs from 166 identified orders; one sample was removed owing to low read count. All sites supported between 27 and 94 orders. The orders with the highest relative abundance included Acidobacteria, Anaerolineales, Betaproteobacteria, Deltaproteobacteria, Desulfobacterales, Firmicutes, Nitrosopumilales, Nitrososphaerales, Proteobacteria, Rhodospirillales and Woesearchaeota.
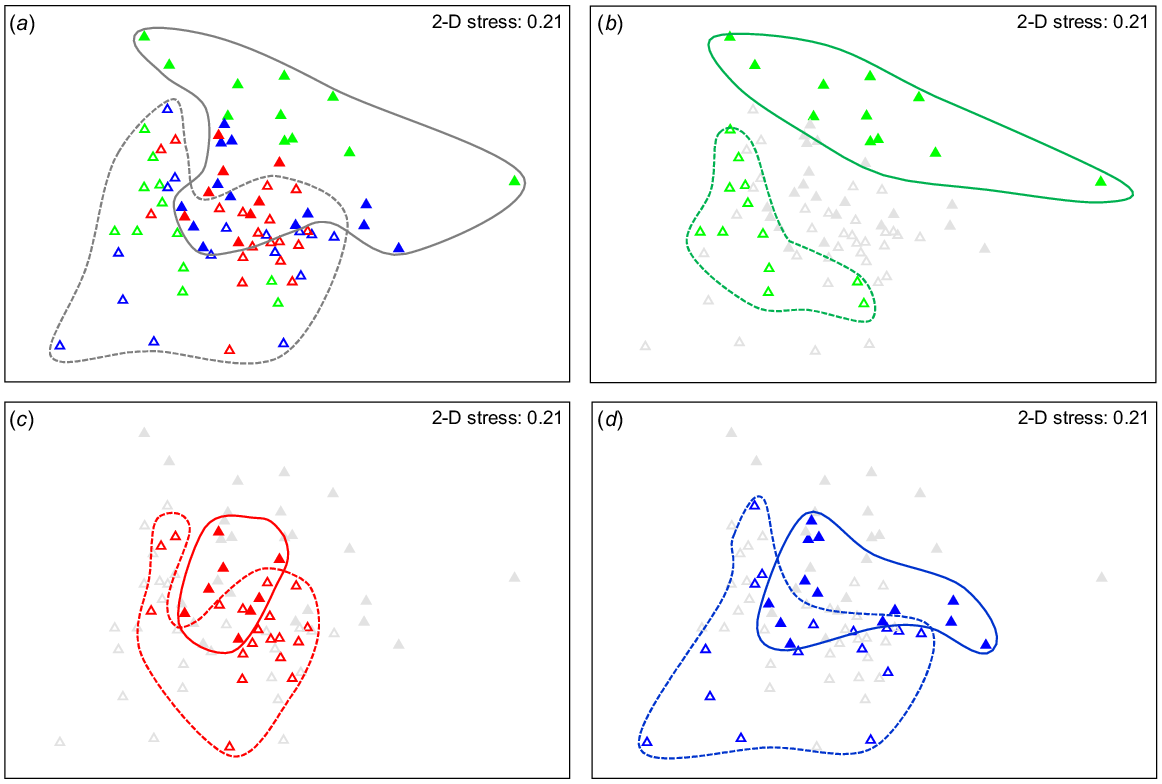
The composition of the microbial communities differed significantly among catchments (PERMANOVA: F = 2.38, P = 0.001) and between EC categories (PERMANOVA: F = 3.53, P = 0.001). The catchment × EC interaction was also significant (PERMANOVA: F = 1.54, P = 0.006), indicating that the variation between high- and low-EC categories was not the same within each catchment. This interaction is evident in Fig. 3a–d, in which there is a distinct separation between low-EC (open symbols) and high-EC (closed symbols) sites in the Murray catchment (green triangles), with little spatial overlap (Fig. 3b), but the separation among samples from the other catchments was less obvious (Fig. 3c, d). Overall, there was a general trend of samples from high-EC sites grouping towards the top and right of the ordination, and those from low-EC sites towards the bottom left (Fig. 3a).
Non-metric multi-dimensional scaling (nMDS) ordination plot of the 16S rDNA-derived microbial groundwater communities. (a) Similarities among samples across catchments and EC categories, (b) samples from the Murray catchment in the same ordination, (c) samples from the Murrumbidgee catchment in the same ordination, and (d) samples from the Lachlan catchment in the same ordination. Low EC (≤3000 μs cm−1, open triangles) and high EC (>3000 μS cm−1, closed triangles). Solid lines outline high-EC (>3000 μS cm−1) samples, dashed lines outline low-EC (≤3000 μS cm−1) samples. Catchments: Lachlan (blue), Murrumbidgee (red) and Murray (green).
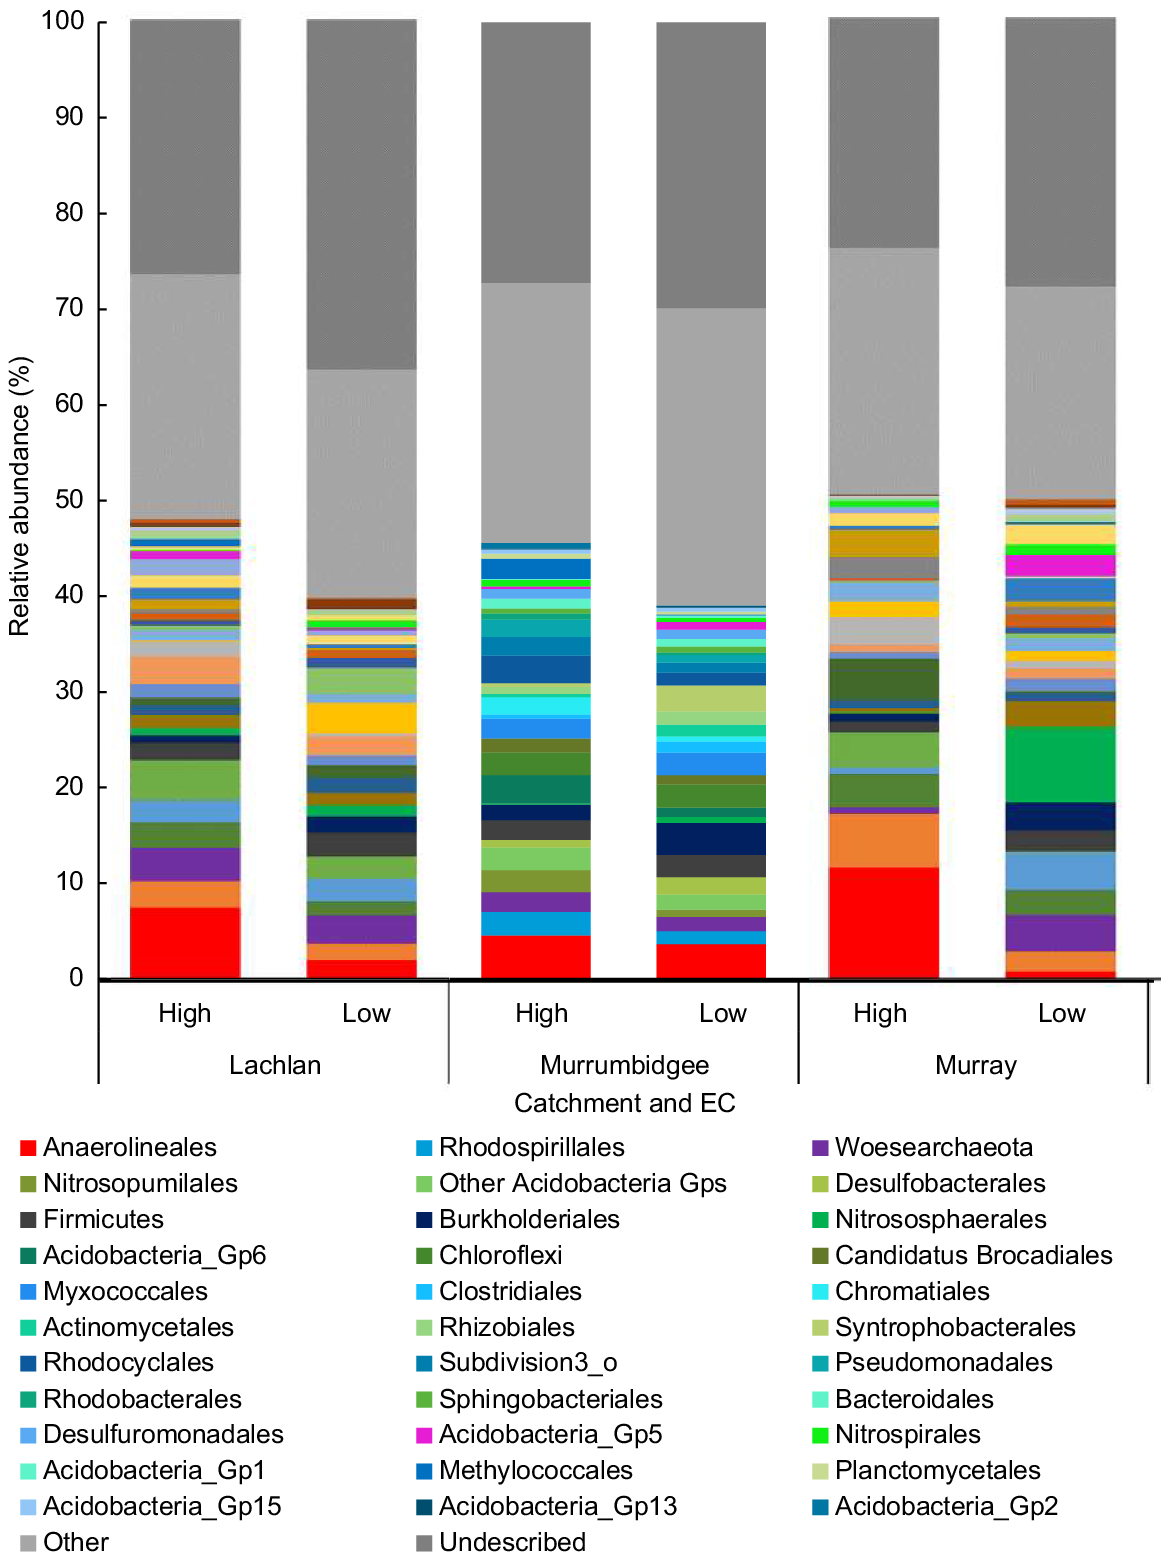
There were clear similarities in microbial communities among sites within each EC category (Fig. 4a–d). The classes and orders contributing most to the dissimilarity among catchments and between EC categories were Deltaproteobacteria, Proteobacteria, Anaerolineales, Rhodospirillales, Firmicutes, Woesearchaeota, Desulfobacterales, Chromatiales, Myxococcales, Gammaproteobacteria, Rhizobiales, Chloroflexi, Nitrosopumilales, candidatus Brocadiales and Pacearchaeota. The relative abundance of orders Woersearchaeota (Archaea), Nitrososphaerales, Acidobacteria and Desulfobacterales had significant interactions between catchment and EC category (Supplementary Table S3). The orders Rhodospirillales, Chromatiales, Anaerolineales had significantly higher abundance within the high-EC sites, whereas Burkholderiales had a significantly higher abundance within the low-EC sites (Table S3). In addition, Betaproteobacteria abundance was significantly higher in the Murrumbidgee than in the Murray and Lachlan catchments (Table S3). The relative abundance of Chloroflexi and Myxococcales were also significantly higher within the Murrumbidgee catchment than in the Murray catchment, whereas their relative abundances in the Lachlan catchment were similar to that in both the Murray and Murrumbidgee catchments (Table S3). The relative abundance of order Rhodospirillales was significantly higher within the Murray than the Lachlan catchment, whereas its relative abundance in the Murrumbidgee catchment was not significantly different from that in either the Murray or Lachlan catchments. Many of these differences are evident in Fig. 4.
Graphical comparison of microbial relative abundance per catchment and EC group. ‘Other’ refers to orders that each contribute <2% of the total abundance. ‘Undescribed’ refers to the proportion of prokaryotes that were taxonomically unassigned at order level.
Together, all environmental variables explained 13% of the total variation in the microbial communities across the three catchments (DistLM). EC, NH4+, total P, SO42−, Fe2+ and Mn independently explained a significant proportion of the biotic variation (DistLM: P < 0.05). The stepwise analysis identified that EC explained the largest portion of the variation in the microbial assemblage (P = 0.001, R2 = 8.08%), followed by total P (P = 0.002, R2 = 1.09%), NH4+ (P = 0.020, R2 = 1.37%), Fe2+ (P = 0.009, R2 = 1.60%) and DOC (P = 0.024, R2 = 1.81%).
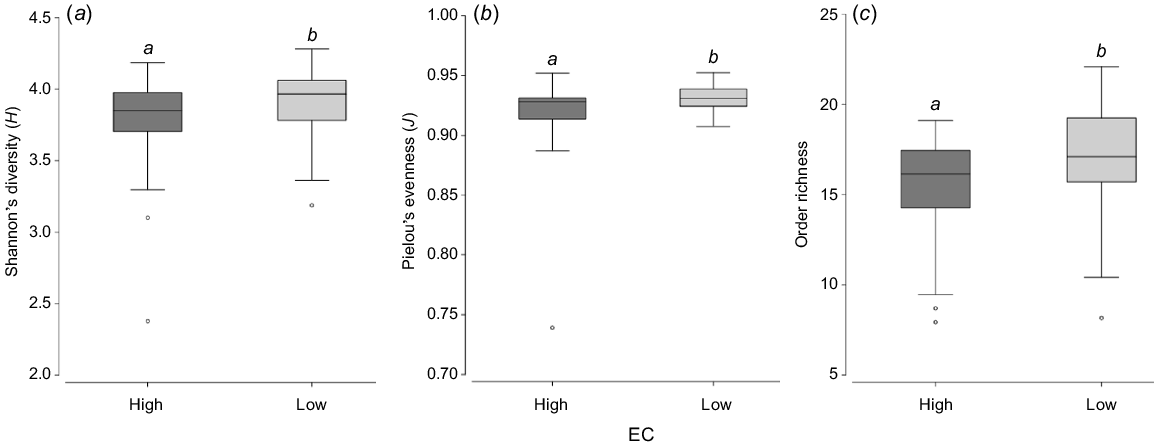
There were significant differences in mean microbial order richness, Pielou’s evenness and Shannon’s diversity between EC categories (ANOVA: P < 0.05) (Fig. 5). High-EC sites had a significantly lower order richness (ANOVA: F = 5.00, P = 0.028), evenness (ANOVA: F = 5.00, P = 0.028), and diversity (ANOVA: F = 4.68, P = 0.034) than did low-EC sites (Fig. 5a–c). However, there were no significant (P > 0.05) interactions between EC and sampling period.
(a) Shannon’s diversity (H), (b) Pielou’s evenness (J), and (c) order richness in high (>3000 μS cm−1) and low (≤3000 μS cm−1) electrical-conductivity (EC) categories. Boxes show the median and 25–75th percentile. Error bars indicate quartiles 1 and 4. Within each plot, boxes with different letters are significantly different (P < 0.05).
Individual catchment analysis
Environmental variables explained 23.9% of the fitted variation of microbial community structure in the Lachlan catchment (DISTLM, Fig. 6a). Variables NO3−, EC, DOC, NH4+ and Mn were independently correlated with microbial assemblage structure in the Lachlan catchment (P < 0.05). The stepwise DistLM identified NO3− as describing the largest portion of variation within the microbial community (P = 0.003, R2 = 9.6%), followed by EC (P = 0.004, R2 = 6.6%), DOC (P = 0.012, R2 = 6.2%), DO (P = 0.05, R2 = 5.2%) and Mn (P = 0.046, R2 = 4.9%). The dbRDA ordination showed some separation of samples on the basis of EC; however, there was a large cluster of similar sites with both high and low salinity (Fig. 6a).
Distance-based redundancy analysis (dbRDA) ordination plot indicating the relationships between the microbial community structure and electrical conductivity (EC) in the (a) Lachlan, (b) Murrumbidgee, and (c) Murray catchments. Low EC (≤3000 μS cm−1, open triangles) and high EC (>3000 μS cm−1, closed triangles). DO, dissolved oxygen; total N, total nitrogen (N); total P, total phosphorus (P); NO3-N, nitrate (NO3−); NH4-N, ammonia (NH4+); SO4, sulfate (SO42−); DOC, dissolved organic carbon (DOC); Mn_D, total dissolved manganese (Mn); Fe++, total dissolved ferrous iron (Fe2+).
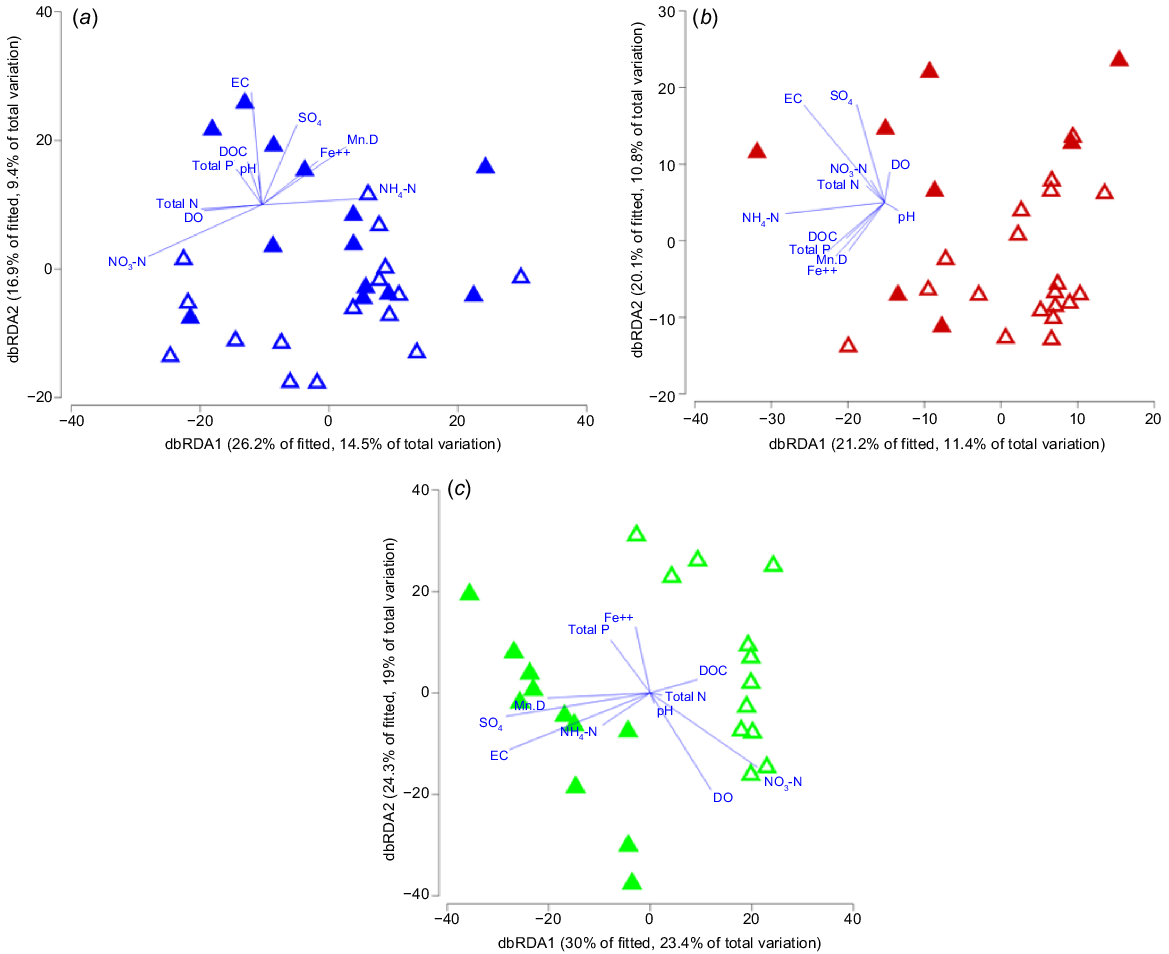
The DistLM for environmental variables described 22.2% of the variation in the microbial community structure in the Murrumbidgee catchment (Fig. 6b). Variables EC, NH4+, SO42− and Fe2+ each independently explained a significant proportion of the variation in the microbial communities. The stepwise DistLM analysis indicated that EC was the variable explaining the most variation in the microbial community (P = 0.006, R2 = 8.4%), followed by NH4+ (P = 0.008, R2 = 7.3%). There was a clear distinction in microbial community assemblage between high- and low-EC sites, with a minimal overlap (Fig. 6b).
Environmental variables explained 42.4% of the total variation in microbial community structure in the Murray catchment (Fig. 6). Variables EC, total P, pH, NO3−, SO42−, Fe2+, Mn and tree cover all independently accounted for a significant proportion of the variation in the microbial community structure (P < 0.05). Sequential tests identified EC as the variable describing the largest portion of variation (P = 0.001, R2 = 19.3%), followed by NO3− (P = 0.001, R2 = 13.5%), total N (P = 0.004, R2 = 9.6%), Mn (P = 0.002, R2 = 7.0%), total P (P = 0.014, R2 = 6.0%), NH4+ (P = 0.016, R2 = 5.6%), and SO42− (P = 0.011, R2 = 4.8%). Within the Murray catchment, there was a clear relationship between microbial community structure and EC groups (Fig. 6c). Tree cover was also significantly negatively correlated with EC (R = −0.60, and P = <0.0001). Neither of the other catchments displayed this significant result (P > 0.05).
Microbial activity
Microbial activity, measured by tensile strength of cotton strips, varied widely among catchments and between EC categories. Activity differed significantly among catchments (P < 0.01) and was overall lower in high-EC than low-EC sites (P = 0.02) but did not differ significantly with sampling period (P > 0.05). Interactions between catchment, EC group and sampling period were not significant (P > 0.05). Within individual catchments, microbial activity was overall higher (mean tensile strength lower) at sites with low EC, although this was statistically significant only in the Murrumbidgee catchment (P < 0.01).
Discussion
Our central hypothesis that salinity (measured as EC) is an important factor influencing the structure and activity of microbial communities in shallow aquifers of the central-southern MDB cannot be disproven. As found in previous studies, water quality strongly influenced the distribution of groundwater microbial communities (e.g. Korbel and Hose 2015; Smith et al. 2018); however, of the water variables analysed in this study, EC had the greatest influence on microbial community structure in all catchments. Electrical conductivity varied spatially across each catchment (Fig. 2), and microbial diversity and activity were lowest at sites with high EC (>3000 μS cm−1).
Extent of salinity
Our study confirms that salinity in the MDB remains an environmental concern, with groundwater salinities exceeding 39 000 μS cm−1 in both the Murray and Lachlan catchments. Electrical conductivity was highly variable across the catchments, ranging from 63 to 51 257 μS cm−1, although the mean electrical conductivity among catchments was similar.
Salinity has been a concern in the MDB since the 1960s (Hart et al. 1991). These issues are primarily caused by the combination of intensive irrigation schemes, river regulation and the removal of native vegetation, and compounded by the naturally high salinity in the regional groundwater (Hart et al. 2020; Pollino et al. 2021). Salinity in western NSW typically results in EC values increasing downstream from east to west (Bennetts et al. 2006; Cartwright and Simmonds 2008). This trend was evident in the Murray catchment, where salinities ranged from 63 μS cm−1 in the eastern-most site, to 51 257 μS cm−1 in the west of the catchment. In comparison, neither the Murrumbidgee nor Lachlan catchment had evidence of east–west salinity gradients; however, the uneven spread of sites evident in each catchment may not truly reflect the overall salinity patterns. The pattern of increasing salinity from east to west also reflects the climate gradient consistent across the basin (Leblanc et al. 2012), with rainfall decreasing and temperature and evaporation increasing from east to west (Bureau of Meterology 2022), potentially also contributing to increasing groundwater salinity gradient. In contrast to Korbel et al. (2013) who studied groundwater ecosystems in the northern MDB, we found no significant differences in the EC of groundwater with land use, specifically between irrigated and non-irrigated sites, although this may be caused by the uneven distribution of sites in the present study or the widespread nature of salinity in the catchments.
Also of interest are the significantly higher EC values recorded at sites without large trees. The Murray catchment is the most heavily modified for agriculture of the three catchments, with only 0.5% of land area protected by nature reserves or national parks, which are generally restricted to riparian zones (Murray–Darling Basin Authority 2021). In contrast, the Lachlan and Murrumbidgee catchments have ~13 and 6% of protected natural vegetation or minimal-use land respectively (Department of Primary Industries 2018a, 2018b). It is likely that the widespread removal of deep-rooted vegetation for agriculture has contributed to salinisation across these catchments (Leblanc et al. 2012; Holland et al. 2015). However, the density of large trees may naturally decrease with an increasing aridity from east to west (Vandandorj et al. 2017), although our observations at field sites suggest that human activities have reduced tree density. The relationship between tree cover and groundwater salinity emphasises the value of protected areas and the importance of maintaining deep-rooted vegetation for managing salinity in groundwater (Jolly et al. 2008; Li et al. 2020) and supports calls for the protection and re-establishment of native vegetation across the MDB. Our study suggests the potential importance of native vegetation to groundwater salinity, and, consequently, the need for holistic landscape-scale management, including the protection and re-establishment of native vegetation, to preserve and protect all groundwater-dependant ecosystems from the threats of salinity.
Prokaryote communities
There was a high diversity of microbial taxa in groundwaters throughout all catchments, with order richness ranging from 27 to 94 per site. Several taxa were present in a high relative abundance across all catchments, including Acidobacteria, Anaerolineales, Betaproteobacteria, Deltaproteobacteria, Desulfobacterales, Firmicutes, Nitrosopumilales, Nitrososphaerales, Proteobacteria, Rhodospirillales and Woesearchaeota. These results provided further evidence of the widespread distribution of these orders in alluvial aquifers of the MDB (Korbel et al. 2017, 2022a) and highlighted the considerable diversity of microbial communities within groundwaters (Griebler and Lueders 2009; Gregory et al. 2014). Although not optimised for Archaea, metabarcoding of the 16S rDNA gene does detect some archaeal taxa, and Hathaway et al. (2021) identified that generic 16S rDNA primers, such as the EMP primers (Júlio et al. 2019) used in this study, are better than domain-specific primers at capturing total diversity and, overall, have better coverage of microbial community structure. Consistent with studies elsewhere in the MDB (Korbel and Hose 2015), a large proportion of the Bacteria and Archaea detected in this study were undescribed. Bacteria and Archaea within groundwater play significant roles not only in biogeochemical cycling, but also as the basis of the ecosystem’s food web, providing biofilms on which protozoans and stygofauna graze (Foulquier et al. 2010; Griebler et al. 2019; Weitowitz et al. 2019); however, the large proportion of undescribed taxa limits our ability to infer function at the community level.
Our study, which has been the first extensive study of groundwater microbial communities in the central-southern MDB, has highlighted the many potential functions of microbes within these shallow alluvial aquifers. Taxa within the orders found are associated with both anaerobic and aerobic processes, as well as a variety of biogeochemical functions such as sulfur and iron reduction, nitrification, denitrification and carbon cycling. The influence of spatial-scale, particularly micro-scale variability, on biotic distribution within shallow alluvial aquifers was evident, because taxa requiring both anaerobic and aerobic properties were recorded within the same sample (Schmidt et al. 2017).
Microbial communities were influenced by several water-quality variables, of which EC was the primary influence. These findings are consistent with studies in the northern MDB (Korbel and Hose 2015), elsewhere in Australia (Smith et al. 2018) and internationally (Héry et al. 2014; Chen et al. 2016; Sang et al. 2018; Li et al. 2020) and have important consequences for biogeochemical processes within groundwater (Griebler and Lueders 2009; Flynn et al. 2013; Sang et al. 2019). Interestingly, these findings contrast to a recent study in a coastal aquifer, which concluded that salinity was not a primary driver of microbial abundance and diversity (Zhang et al. 2021). However, in the case of Zhang et al. (2021), the magnitude of the salinity gradient across the study area (~300–38 000 μS cm−1) was slightly smaller than in our study, and potentially microbiota within those coastal aquifers were more tolerant to salinity because of the natural fluxes of sea-water intrusion and sea-level fluctuations over time.
Dissolved oxygen, DOC and nutrients (e.g. NO3−) also influenced microbial community structure in the studied catchments. These environmental variables have previously been linked with changes in groundwater microbial communities in the MDB (Korbel et al. 2022a, 2022b) as well as functional roles (Hofmann and Griebler 2018), particularly under irrigated lands where DOC, oxygen and nutrient concentrations can be higher as a result of increased infiltration and connectivity with the surface (Brown et al. 2011; Korbel et al. 2022a, 2022c). The number of factors influencing the microbial communities reflects the complexity of groundwater ecosystems, and the common, yet challenging, scenario of understanding multi-stressed systems (Chariton et al. 2016; Castaño-Sánchez et al. 2020a).
Microbial responses to salinity
Our results have indicated that not only is there a difference between the diversity and activity of microbes under different salinity conditions, but also in the types of microbes and their putative functions. The impacts of salinity on freshwater surface ecosystems (Halse et al. 2003; James et al. 2003; Nielsen et al. 2003; Kefford et al. 2007), soil microbiomes (Chen et al. 2016; Zhang et al. 2019) and groundwater invertebrates (Castaño-Sánchez et al. 2020b) have been well documented and typically attributed to the direct or indirect effects of the increased osmolarity in the external environment (Grant 2004). However, there is a lack of data on the impact of salinty on natural groundwater microbial communities.
Microbial activity and richness at sites with high EC were significantly lower than at low-EC sites, which is consistent with reports from elsewhere (e.g. Foulquier et al. 2011). When faced with increased salinity or EC, microbial cells produce osmolytes within their cytoplasm to maintain homeostasis, cellular structural integrity, and prevent dehydration (Sleator and Hill 2002; Grant 2004). In some instances, the combined effect of prolonged osmotic stress and the production of osmolytes can result in microbial inactivity and death (Burg and Ferraris 2008). Here, we expect that EC may be acting as a stressor reducing the richness and abundance of microbes within groundwater (Elmajdoub et al. 2014). Both microbial activity and richness are fundamentally linked to ecosystem resilience (Elmqvist et al. 2003) and stress responses (Wang et al. 2011), and both were affected by high EC in this study. A decrease in community resilience can affect the provision of ecosystem services and functions (Walker 1992; Oliver et al. 2015) and, in groundwaters, this may be evident as a decline in the microbial functions that maintain water quality (Chapelle 2000). For example, Rudd et al. (1988) showed that decreased resilience affected nitrogen cycling in freshwater.
Although the differences in microbial community structure in response to EC were most obvious in the Murray catchment, differences in community structure between high- and low-EC groundwaters were apparent across the region. Taxa from the orders Anaerolineales, Rhodospirillales, Firmicutes, Woesearchaeota, Desulfobacterales, Chromatiales, Myxococcales, Rhizobiales, Chloroflexi and Nitrosopumilales were more abundant in high- than low-EC sites. Several of these taxa are known to have some natural halotolerance (Grant 2004). In particular, the higher relative abundances of Rhodospirillales (family Rhodospirillacea) in groundwaters with >3000 μS cm−1 is not surprising. Taxa from this family are known as both halophilic (requiring saline environments for growth) and halotolerant (capable of surviving in a wide range of salinities) (Imhoff et al. 2021) and are often present in high abundances in both shallow unconfined aquifers (Smith et al. 2012), and extreme alkaline–saline soils (e.g. EC 159 000 μS cm−1 and pH 10.02; Valenzuela-Encinas et al. 2009). The greater abundances of Chloroflexi, Nitrosopumilales, Anaerolineales at high-EC sites contradicts a recent study in which abundances of these taxa were greatest in low-salinity soils in the Yellow River Delta, China (Zhao et al. 2020). This illustrates the complexity of microbial responses, and the heterogeneity of groundwater and soil environments.
Interestingly, the relative abundances of Bacteria and Archaea orders capable of denitrification, such as Sphingobacteriales, Chromatiales, Rhizobiales, Rhodocyclales, Sphingobacteriales, Pseudomondales, Anaerolineales, Chromatiales and Rhodospirillales (Korbel and Hose 2017; Wang et al. 2017; Júlio et al. 2019), and sulfur-reducing Desulfobacterales were often greater at sites with high EC. Denitrifying bacteria and Archaea are essential for the cycling of nitrogen within groundwater (Meng et al. 2018; Korbel et al. 2022a). Previous studies have demonstrated that excessive salinity can hamper denitrification processes and reduce the function of anaerobic ammonium oxidation bacteria (Zhao et al. 2013; Meng et al. 2018; Zeng et al. 2020) because of osmotic pressure and inhibition of various enzymes (Zhao et al. 2013; Meng et al. 2018). Although our study is not consistent with these findings, we note that higher EC was broadly correlated with intensive agriculture, which is often associated with nitrogen contamination (Hansen et al. 2011; Korbel et al. 2013, 2022a). This may suggest that the increased abundance of denitrifying bacteria may be responding to land-use practises more so than to EC (Nielsen et al. 2003). This is supported by the fact that nitrate explained a significant proportion of the variation in the microbial community structure in both the Murray and Lachlan catchments.
Burkholderiales was present in greater relative abundances at low- than high-EC sites, which suggests sensitivity to salinity. This finding is consistent with reports from soil studies (Zhao et al. 2020), and more global analyses showing that species of beta-Proteobacteria (including Burkholderiales) dominate in freshwater and pristine groundwater environments (Bouvier and del Giorgio 2002; Sang et al. 2018; Yavari-Bafghi et al. 2023). Burkholderiales species are known to inhabit groundwater in eastern Australia (Korbel et al. 2017); however, their functional roles within groundwaters are largely unknown.
Groundwater microbial communities shift rapidly in response to environmental change, including salinity, often by increases in the abundance of species tolerant to the disturbance or species that can utilise the disturbance to metabolic advantage (Hemme et al. 2010; Mouser et al. 2010). Owing to these rapid responses, microbes are ideal bioindicators of groundwater health (Fillinger et al. 2019). As such, the order Burkholderiales may have potential as a bioindicator of low-salinity groundwater environments because of its significantly higher abundance in low-salinity sites; however, further research is necessary to confirm this suggestion.
Our study clearly indicated that microbial composition, richness and activity are affected by EC. However, it remains unclear how these changes relate to ecosystem function, since species that change along the gradient may be replaced by halotolerant species with a similar ecological role (Anneser et al. 2010; Griebler et al. 2014; Saccò et al. 2019). Cotton strip decomposition was correlated with more general measures of microbial activity (Lategan et al. 2010); hence, our observation of greater tensile strength (lower activity) at high-EC sites suggests that some ecological functions may not be maintained across the salinity gradient. Further characterisation of microbial communities and their functions using metagenomics may provide additional detail on the abundance of functional genes and may reduce the proportion of undescribed bacteria within this study, and thus is recommended in future studies (Broman et al. 2021).
We recognise that our use of eDNA to characterise microbial communities, particularly with inferring function and activity of the taxa identified, is not without limitations (Morey et al. 2017; Griebler et al. 2022). Taxa identified using eDNA may be remnant or inactive, and eRNA may be more appropriate for indicating functions occurring at the time of sampling (Yates et al. 2021). However, our recent work has highlighted the challenges of using eDNA to characterise communities in groundwater where only low concentrations of RNA are present (Korbel et al. 2022c) and showed that eDNA was similar to eRNA in its ability to discriminate among sample groups (Korbel et al. 2022c).
As hypothesised, salinity (as EC) was high in places and varied spatially throughout the MDB. Both microbial richness and activity decreased with higher salinity, and, importantly, we noted a shift in community compositions, with likely flow-on effects to key biogeochemical processes and ecosystem functions within aquifers. We expect that detrimental ecological impacts of salinity are not limited to microbes, but also affect stygofauna (Castaño-Sánchez et al. 2020a, 2020b), and other groundwater-dependent ecosystems, such as wetlands, marshes and rivers (Halse et al. 2003), and that the ionic composition of the saline waters is a significant factor determining the ecological response (Zalizniak et al. 2006). With climate change being likely to further exacerbate salinity issues because of decreased recharge and increased irrigation (Holland et al. 2015), understanding the consequences of groundwater salinity on microbes and groundwater quality is essential for the protection of both groundwater-dependent ecosystems and the industries that rely on this water source.
Data availability
Data are available on the Macquarie University Research Data Repository (doi:10.25949/21728318).
Declaration of funding
This work was supported financially by the NSW Department of Planning, Industry and Environment and Macquarie University. Tess Nelson was supported by a Macquarie University research training scholarship.
Author contributions
Tess Nelson contributed methodology, formal analysis, investigation and writing of the original draft. Grant Hose added conceptualisation, validation, investigation, and review and editing of the written text. Jodie Dabovic provided conceptualisation, investigation, and review and editing of the written text. Kathryn Korbel supplied conceptualisation, methodology, investigation, and review and editing of the written text.
Acknowledgements
This research was undertaken on the traditional lands of the Wiradjuri, Nari Nari, Madi Madi, Wadi Wadi, Wemba Wemba, Baraba Baraba, Yorta Yorta and Dharug peoples. We acknowledge the ownership and custodianship of those lands by those peoples. The authors acknowledge Water NSW for access to bores and Jaymee Lennon for assistance in data collection.
References
Anneser B, Pilloni G, Bayer A, Lueders T, Griebler C, Einsiedl F, Richters L (2010) High resolution analysis of contaminated aquifer sediments and groundwater – what can be learned in terms of natural attenuation? Geomicrobiology Journal 27(2), 130-142.
| Crossref | Google Scholar |
Barbieri M, Barberio MD, Banzato F, Billi A, Boschetti T, Franchini S, Gori F, Petitta M (2023) Climate change and its effect on groundwater quality. Environmental Geochemistry and Health 45, 1133-1144.
| Crossref | Google Scholar |
Bennetts DA, Webb JA, Stone DJM, Hill DM (2006) Understanding the salinisation process for groundwater in an area of south-eastern Australia, using hydrochemical and isotopic evidence. Journal of Hydrology 323(1-4), 178-192.
| Crossref | Google Scholar |
Beyer A, Burow K, Büchel G, Kothe E (2016) Bacterial communities in marine salt evaporate rocks and Pristine Zechstein aquifers. Geomicrobiology Journal 33(9), 774-778.
| Crossref | Google Scholar |
Bouvier TC, del Giorgio PA (2002) Compositional changes in free-living bacterial communities along a salinity gradient in two temperate estuaries. Limnology and Oceanography 47(2), 453-470.
| Crossref | Google Scholar |
Broman E, Bonaglia S, Norkko A, Creer S, Nascimento FJA (2021) High throughput shotgun sequencing of eRNA reveals taxonomic and derived functional shifts across a benthic productivity gradient. Molecular Ecology 30(13), 3023-3039.
| Crossref | Google Scholar | PubMed |
Brown KB, McIntosh JC, Rademacher LK, Lohse KA (2011) Impacts of agricultural irrigation recharge on groundwater quality in a basalt aquifer system (Washington, USA): a multi-tracer approach. Hydrogeology Journal 19(5), 1039-1051.
| Crossref | Google Scholar |
Bureau of Meterology (2022) National Water Account 2019. Murray–Darling Basin: key findings. For the water account period 1 July 2018–30 June 2019. (BOM) Available at http://www.bom.gov.au/water/nwa/2019/mdb/index.shtml [Verified 19 December 2023]
Burg MB, Ferraris JD (2008) Intracellular organic osmolytes: function and regulation. Journal of Biological Chemistry 283(12), 7309-7313.
| Crossref | Google Scholar | PubMed |
Caporaso JG, Lauber CL, Walters WA, Berg-Lyons D, Huntley J, Fierer N, Owens SM, Betley J, Fraser L, Bauer M, Gormley N, Gilbert JA, Smith G, Knight R (2012) Ultra-high-throughput microbial community analysis on the Illumina HiSeq and MiSeq platforms. The ISME Journal 6(8), 1621-1624.
| Crossref | Google Scholar | PubMed |
Cartwright I, Simmonds I (2008) Impact of changing climate and land use on the hydrogeology of southeast Australia. Australian Journal of Earth Sciences 55(8), 1009-1021.
| Crossref | Google Scholar |
Cartwright I, Weaver TR, Fulton S, Nichol C, Reid M, Cheng X (2004) Hydrogeochemical and isotopic constraints on the origins of dryland salinity, Murray Basin, Victoria, Australia. Applied Geochemistry 19(8), 1233-1254.
| Crossref | Google Scholar |
Cartwright I, Weaver TR, Stone D, Reid M (2007) Constraining modern and historical recharge from bore hydrographs, 3H, 14C, and chloride concentrations: applications to dual-porosity aquifers in dryland salinity areas, Murray Basin, Australia. Journal of Hydrology 332(1-2), 69-92.
| Crossref | Google Scholar |
Castaño-Sánchez A, Hose GC, Reboleira ASPS (2020a) Ecotoxicological effects of anthropogenic stressors in subterranean organisms: a review. Chemosphere 244, 125422.
| Crossref | Google Scholar | PubMed |
Castaño-Sánchez A, Hose GC, Reboleira ASPS (2020b) Salinity and temperature increase impact groundwater crustaceans. Scientific Reports 10(1), 12328.
| Crossref | Google Scholar | PubMed |
Chapelle FH (2000) The significance of microbial processes in hydrogeology and geochemistry. Hydrogeology Journal 8(1), 41-46.
| Crossref | Google Scholar |
Chariton AA, Sun M, Gibson J, Webb JA, Leung KMY, Hickey CW, Hose GC (2016) Emergent technologies and analytical approaches for understanding the effects of multiple stressors in aquatic environments. Marine and Freshwater Research 67(4), 414-428.
| Crossref | Google Scholar |
Chen L-J, Feng Q, Li C-S, Song Y-X, Liu W, Si J-H, Zhang B-G (2016) Spatial variations of soil microbial activities in saline groundwater-irrigated soil ecosystem. Environmental Management 57(5), 1054-1061.
| Crossref | Google Scholar | PubMed |
Clarke KR, Ainsworth M (1993) A method of linking multivariate community structure to environmental variables. Marine Ecology Progress Series 92, 205-219.
| Crossref | Google Scholar |
Clarke KR, Somerfield PJ, Chapman MG (2006) On resemblance measures for ecological studies, including taxonomic dissimilarities and a zero-adjusted Bray–Curtis coefficient for denuded assemblages. Journal of Experimental Marine Biology and Ecology 330(1), 55-80.
| Crossref | Google Scholar |
Deiner K, Bik HM, Mächler E, Seymour M, Lacoursière-Roussel A, Altermatt F, Creer S, Bista I, Lodge DM, de Vere N, Pfrender ME, Bernatchez L (2017) Environmental DNA metabarcoding: transforming how we survey animal and plant communities. Molecular Ecology 26(21), 5872-5895.
| Crossref | Google Scholar | PubMed |
Dickie IA, Boyer S, Buckley HL, Duncan RP, Gardner PP, Hogg ID, Holdaway RJ, Lear G, Makiola A, Morales SE, Powell JR, Weaver L (2018) Towards robust and repeatable sampling methods in eDNA-based studies. Molecular Ecology Resources 18, 940-952.
| Crossref | Google Scholar |
Edgar RC (2013) UPARSE: highly accurate OTU sequences from microbial amplicon reads. Nature Methods 10(10), 996-998.
| Crossref | Google Scholar | PubMed |
Elmajdoub B, Barnett S, Marschner P (2014) Response of microbial activity and biomass in rhizosphere and bulk soils to increasing salinity. Plant and Soil 381(1-2), 297-306.
| Crossref | Google Scholar |
Elmqvist T, Folke C, Nyström M, Peterson G, Bengtsson J, Walker B, Norberg J (2003) Response diversity, ecosystem change, and resilience. Frontiers in Ecology and the Environment 1(9), 488-494.
| Crossref | Google Scholar |
Fillinger L, Hug K, Trimbach AM, Wang H, Kellermann C, Meyer A, Bendinger B, Griebler C (2019) The D-A-(C) index: a practical approach towards the microbiological-ecological monitoring of groundwater ecosystems. Water Research 163, 114902.
| Crossref | Google Scholar | PubMed |
Flynn TM, Sanford RA, Ryu H, Bethke CM, Levine AD, Ashbolt NJ, Santo Domingo JW (2013) Functional microbial diversity explains groundwater chemistry in a pristine aquifer. BMC Microbiology 13(1), 146.
| Crossref | Google Scholar |
Foulquier A, Simon L, Gilbert F, Fourel F, Malard F, Mermillod-Blondin F (2010) Relative influences of DOC flux and subterranean fauna on microbial abundance and activity in aquifer sediments: new insights from 13C-tracer experiments. Freshwater Biology 55(7), 1560-1576.
| Crossref | Google Scholar |
Foulquier A, Malard F, Mermillod-Blondin F, Montuelle B, Dolédec S, Volat B, Gibert J (2011) Surface water linkages regulate trophic interactions in a groundwater food web. Ecosystems 14(8), 1339-1353.
| Crossref | Google Scholar |
Grant WD (2004) Life at low water activity. Philosophical Transactions of the Royal Society of London – B. Biological Sciences 359(1448), 1249-1267.
| Crossref | Google Scholar |
Gregory SP, Maurice LD, West JM, Gooddy DC (2014) Microbial communities in UK aquifers: current understanding and future research needs. Quarterly Journal of Engineering Geology and Hydrogeology 47(2), 145-157.
| Crossref | Google Scholar |
Griebler C, Lueders T (2009) Microbial biodiversity in groundwater ecosystems. Freshwater Biology 54(4), 649-677.
| Crossref | Google Scholar |
Griebler C, Malard F, Lefébure T (2014) Current developments in groundwater ecology – from biodiversity to ecosystem function and services. Current Opinion in Biotechnology 27, 159-167.
| Crossref | Google Scholar | PubMed |
Griebler C, Fillinger L, Karwautz C, Hose GC (2022) Knowledge gaps, obstacles, and research frontiers in groundwater microbial ecology. Encyclopedia of Inland Waters 3, 611-624.
| Crossref | Google Scholar |
Halse SA, Ruprecht JK, Pinder AM (2003) Salinisation and prospects for biodiversity in rivers and wetlands of south-west Western Australia. Australian Journal of Botany 51(6), 673-688.
| Crossref | Google Scholar |
Hansen B, Thorling L, Dalgaard T, Erlandsen M (2011) Trend reversal of nitrate in Danish groundwater – a reflection of agricultural practices and nitrogen surpluses since 1950. Environmental Science & Technology 45, 228-234.
| Crossref | Google Scholar | PubMed |
Hart BT, Bailey P, Edwards R, Hortle K, James K, McMahon A, Meredith C, Swadling K (1991) A review of the salt sensitivity of the Australian freshwater biota. Hydrobiologia 210, 105-144.
| Crossref | Google Scholar |
Hart B, Walker G, Katupitiya A, Doolan J (2020) Salinity management in the Murray–Darling Basin, Australia. Water 12(6), 1829.
| Crossref | Google Scholar |
Hathaway JJM, Moser DP, Blank JG, Northup DE (2021) A comparison of primers in 16S rRNA gene surveys of bacteria and archaea from volcanic caves. Geomicrobiology Journal 38(9), 741-754.
| Crossref | Google Scholar |
Hemme CL, Deng Y, Gentry TJ, Fields MW, Wu L, Barua S, Barry K, Tringe SG, Watson DB, He Z, Hazen TC, Tiedje JM, Rubin EM, Zhou J (2010) Metagenomic insights into evolution of a heavy metal-contaminated groundwater microbial community. The ISME Journal 4(5), 660-672.
| Crossref | Google Scholar | PubMed |
Herczeg AL, Dogramaci SS, Leaney FWJ (2001) Origin of dissolved salts in a large, semi-arid groundwater system: Murray Basin, Australia. Marine and Freshwater Research 52(1), 41-52.
| Crossref | Google Scholar |
Hofmann R, Griebler C (2018) DOM and bacterial growth efficiency in oligotrophic groundwater: absence of priming and co-limitation by organic carbon and phosphorus. Aquatic Microbial Ecology 81(1), 55-71.
| Crossref | Google Scholar |
Hofmann R, Uhl J, Hertkorn N, Griebler C (2020) Linkage between dissolved organic matter transformation, bacterial carbon production, and diversity in a shallow oligotrophic aquifer: results from flow-through sediment microcosm experiments. Frontiers in Microbiology 11, 543567.
| Crossref | Google Scholar | PubMed |
Holland JE, Luck GW, Max Finlayson C (2015) Threats to food production and water quality in the Murray–Darling Basin of Australia. Ecosystem Services 12, 55-70.
| Crossref | Google Scholar |
Humphreys WF (2009) Hydrogeology and groundwater ecology: does each inform the other? Hydrogeology Journal 17(1), 5-21.
| Crossref | Google Scholar |
Héry M, Volant A, Garing C, Luquot L, Elbaz Poulichet F, Gouze P (2014) Diversity and geochemical structuring of bacterial communities along a salinity gradient in a carbonate aquifer subject to seawater intrusion. FEMS Microbiology Ecology 90(3), 922-934.
| Crossref | Google Scholar | PubMed |
Imhoff JF, Rahn T, Künzel S, Keller A, Neulinger SC (2021) Osmotic adaptation and compatible solute biosynthesis of phototrophic bacteria as revealed from genome analyses. Microorganisms 9(1), 46.
| Crossref | Google Scholar |
James KR, Cant B, Ryan T (2003) Responses of freshwater biota to rising salinity levels and implications for saline water management: a review. Australian Journal of Botany 51(6), 703-713.
| Crossref | Google Scholar |
Jolly ID, McEwan KL, Holland KL (2008) A review of groundwater–surface water interactions in arid/semi-arid wetlands and the consequences of salinity for wetland ecology. Ecohydrology 1(1), 43-58.
| Crossref | Google Scholar |
Júlio ADL, de Cássia Mourão Silva U, Medeiros JD, Morais DK, dos Santos VL (2019) Metataxonomic analyses reveal differences in aquifer bacterial community as a function of creosote contamination and its potential for contaminant remediation. Scientific Reports 9(1), 11731.
| Crossref | Google Scholar | PubMed |
Kefford BJ, Fields EJ, Clay C, Nugegoda D (2007) Salinity tolerance of riverine microinvertebrates from the southern Murray–Darling Basin. Marine and Freshwater Research 58(11), 1019-1031.
| Crossref | Google Scholar |
Korbel KL, Hose GC (2015) Habitat, water quality, seasonality, or site? Identifying environmental correlates of the distribution of groundwater biota. Freshwater Science 34(1), 329-343.
| Crossref | Google Scholar |
Korbel KL, Hose GC (2017) The weighted groundwater health index: improving the monitoring and management of groundwater resources. Ecological Indicators 75, 164-181.
| Crossref | Google Scholar |
Korbel KL, Hancock PJ, Serov P, Lim RP, Hose GC (2013) groundwater ecosystems vary with land use across a mixed agricultural landscape. Journal of Environmental Quality 42(2), 380-390.
| Crossref | Google Scholar | PubMed |
Korbel K, Chariton A, Stephenson S, Greenfield P, Hose GC (2017) Wells provide a distorted view of life in the aquifer: implications for sampling, monitoring and assessment of groundwater ecosystems. Scientific Reports 7(1), 40702.
| Crossref | Google Scholar |
Korbel KL, Rutlidge H, Hose GC, Eberhard SM, Andersen MS (2022a) Dynamics of microbiotic patterns reveal surface water groundwater interactions in intermittent and perennial streams. Science of The Total Environment 811, 152380.
| Crossref | Google Scholar | PubMed |
Korbel KL, Greenfield P, Hose GC (2022b) Agricultural practices linked to shifts in groundwater microbial structure and denitrifying bacteria. Science of The Total Environment 807, 150870.
| Crossref | Google Scholar | PubMed |
Korbel K, McKnight K, Greenfield P, Angel B, Adams M, Chariton A, Hose GC (2022c) Bioassessment of groundwater ecosystems. I. Sampling methods and analysis of eDNA for microbes and stygofauna in shallow alluvial aquifers. Report prepared for the Independent Expert Scientific Committee on Coal Seam Gas and Large Coal Mining Development through the Department of Climate Change, Energy, the Environment and Water.
Lamontagne S, Taylor AR, Cook PG, Crosbie RS, Brownbill R, Williams RM, Brunner P (2014) Field assessment of surface water-groundwater connectivity in a semi-arid river basin (Murray–Darling, Australia). Hydrological Processes 28(4), 1561-1572.
| Crossref | Google Scholar |
Lategan MJ, Korbel K, Hose GC (2010) Is cotton-strip tensile strength a surrogate for microbial activity in groundwater? Marine and Freshwater Research 61(3), 351-356.
| Crossref | Google Scholar |
Leblanc M, Tweed S, Van Dijk A, Timbal B (2012) A review of historic and future hydrological changes in the Murray–Darling Basin. Global and Planetary Change 80-81, 226-246.
| Crossref | Google Scholar |
Li C, Gao X, Li S, Bundschuh J (2020) A review of the distribution, sources, genesis, and environmental concerns of salinity in groundwater. Environmental Science and Pollution Research International 27(33), 41157-41174.
| Crossref | Google Scholar | PubMed |
Meng Y, Yin C, Zhou Z, Meng F (2018) Increased salinity triggers significant changes in the functional proteins of ANAMMOX bacteria within a biofilm community. Chemosphere 207, 655-664.
| Crossref | Google Scholar | PubMed |
Morey KC, Bartley TJ, Hanner RH (2017) Key limitations to aquatic eDNA metabarcoding: a cautionary case study from a diverse public aquarium. Genome 60(11), 881-1019.
| Crossref | Google Scholar |
Mouser PJ, Rizzo DM, Druschel GK, Morales SE, Hayden N, O’Grady P, Stevens L (2010) Enhanced detection of groundwater contamination from a leaking waste disposal site by microbial community profiles. Water Resources Research 46(12), W12506.
| Crossref | Google Scholar |
Murray–Darling Basin Authority (2021) Central Murray Snapshot. (MDBA) Available at https://www.mdba.gov.au/water-management/catchments/central-murray [Verified14 February 2021]
Nielsen DL, Brock MA, Rees GN, Baldwin DS (2003) Effects of increasing salinity on freshwater ecosystems in Australia. Australian Journal of Botany 51(6), 655-665.
| Crossref | Google Scholar |
Oliver TH, Heard MS, Isaac NJB, Roy DB, Procter D, Eigenbrod F, Freckleton R, Hector A, Orme CDL, Petchey OL, Proença V, Raffaelli D, Suttle KB, Mace GM, Martín-López B, Woodcock BA, Bullock JM (2015) Biodiversity and resilience of ecosystem functions. Trends in Ecology & Evolution 30(11), 673-684.
| Crossref | Google Scholar | PubMed |
Ross A (2012) Easy to say, hard to do: integrated surface water and groundwater management in the Murray–Darling Basin. Water Policy 14(4), 709-724.
| Crossref | Google Scholar |
Rudd JWM, Kelly CA, Schindler DW, Turner MA (1988) Disruption of the nitrogen cycle in acidified lakes. Science 240(4858), 1515-1517.
| Crossref | Google Scholar | PubMed |
Saccò M, Blyth A, Bateman PW, Hua Q, Mazumder D, White N, Humphreys WF, Laini A, Griebler C, Grice K (2019) New light in the dark: a proposed multidisciplinary framework for studying functional ecology of groundwater fauna. Science of The Total Environment 662, 963-977.
| Crossref | Google Scholar | PubMed |
Sang S, Zhang X, Dai H, Hu BX, Ou H, Sun L (2018) Diversity and predictive metabolic pathways of the prokaryotic microbial community along a groundwater salinity gradient of the Pearl River Delta, China. Scientific Reports 8(1), 17317.
| Crossref | Google Scholar | PubMed |
Sang S, Dai H, Hu BX, Hao Y, Zhou T, Zhang J (2019) The study of hydrogeochemical environments and microbial communities along a groundwater salinity gradient in the Pearl River Delta, China. Water 11(4), 804.
| Crossref | Google Scholar |
Schmidt SI, Cuthbert MO, Schwientek M (2017) Towards an integrated understanding of how micro scale processes shape groundwater ecosystem functions. Science of The Total Environment 592, 215-227.
| Crossref | Google Scholar | PubMed |
Shapouri M, Cancela da Fonseca L, Lepure S, Stigter T, Ribeiro L, Silva A (2016) The variation of stygofauna along a gradient of salinization in a coastal aquifer. Hydrology Research 47(1), 89-103.
| Crossref | Google Scholar |
Sleator RD, Hill C (2002) Bacterial osmoadaptation: the role of osmolytes in bacterial stress and virulence. FEMS Microbiology Reviews 26, 49-71.
| Crossref | Google Scholar | PubMed |
Smith RJ, Jeffries TC, Roudnew B, Fitch AJ, Seymour JR, Delpin MW, Newton K, Brown MH, Mitchell JG (2012) Metagenomic comparison of microbial communities inhabiting confined and unconfined aquifer ecosystems. Environmental Microbiology 14(1), 240-253.
| Crossref | Google Scholar | PubMed |
Smith RJ, Paterson JS, Wallis I, Launer E, Banks EW, Bresciani E, Cranswick RH, Tobe SS, Marri S, Goonan P, Mitchell JG (2018) Southern South Australian groundwater microbe diversity. FEMS Microbiology Ecology 94(10), fiy158.
| Crossref | Google Scholar |
Thompson LR, Sanders JG, McDonald D, Amir A, Ladau J, Locey KJ, Prill RJ, Tripathi A, Gibbons SM, Ackermann G, et al. (2017) A communal catalogue reveals Earth’s multiscale microbial diversity. Nature 551(7681), 457-463.
| Crossref | Google Scholar | PubMed |
Tian Y-J, Yang H, Wu X-J, Li D-T (2005) Molecular analysis of microbial community in a groundwater sample polluted by landfill leachate and seawater. Journal of Zhejiang University – B. Science 6(3), 165-170.
| Crossref | Google Scholar | PubMed |
Valenzuela-Encinas C, Neria-González I, Alcántara-Hernández RJ, Estrada-Alvarado I, Zavala-Díaz de la Serna FJ, Dendooven L, Marsch R (2009) Changes in the bacterial populations of the highly alkaline saline soil of the former lake Texcoco (Mexico) following flooding. Extremophiles 13(4), 609-621.
| Crossref | Google Scholar | PubMed |
Van Bekkum M, Sainsbury JP, Daughney CJ, Chambers GK (2006) Molecular analysis of bacterial communities in groundwaters from selected wells in the Hutt Valley and the Wairarapa, New Zealand. New Zealand Journal of Marine and Freshwater Research 40(1), 91-106.
| Crossref | Google Scholar |
Vandandorj S, Eldridge DJ, Travers SK, Delgado-Baquerizo M (2017) Contrasting effects of aridity and grazing intensity on multiple ecosystem functions and services in Australian woodlands. Land Degradation & Development 28(7), 2098-2108.
| Crossref | Google Scholar |
Walker BH (1992) Biodiversity and ecological redundancy. Conservation Biology 6, 18-23.
| Crossref | Google Scholar |
Wang Q, Garrity GM, Tiedje JM, Cole JR (2007) Naïve Bayesian classifier for rapid assignment of rRNA sequences into the new bacterial taxonomy. Applied and Environmental Microbiology 73(16), 5261-5267.
| Crossref | Google Scholar | PubMed |
Wang J, Yang D, Zhang Y, Shen J, van der Gast C, Hahn MW, Wu Q (2011) Do patterns of bacterial diversity along salinity gradients differ from those observed for macroorganisms? PLoS ONE 6(11), e27597.
| Crossref | Google Scholar | PubMed |
Wang J, Wang Y, Bai J, Liu Z, Song X, Yan D, Abiyu A, Zhao Z, Yan D (2017) High efficiency of inorganic nitrogen removal by integrating biofilm-electrode with constructed wetland: autotrophic denitrifying bacteria analysis. Bioresource Technology 227, 7-14.
| Crossref | Google Scholar | PubMed |
Weitowitz DC, Robertson AL, Bloomfield JP, Maurice L, Reiss J (2019) Obligate groundwater crustaceans mediate biofilm interactions in a subsurface food web. Freshwater Science 38(3), 491-502.
| Crossref | Google Scholar |
Wentworth CK (1922) A scale of grade and class terms for clastic sediments. The Journal of Geology 30, 377-392.
| Google Scholar |
Yates MC, Derry AM, Cristescu ME (2021) Environmental RNA: a revolution in ecological resolution? Trends in Ecology & Evolution 36(7), 601-609.
| Crossref | Google Scholar | PubMed |
Yavari-Bafghi M, Rezaei Somee M, Amoozegar MA, Dastgheib SMM, Shavandi M (2023) Genome-resolved analyses of oligotrophic groundwater microbial communities along phenol pollution in a continuous-flow biodegradation model system. Frontiers in Microbiology 14, 1147162.
| Crossref | Google Scholar | PubMed |
Zalizniak L, Kefford BJ, Nugegoda D (2006) Is all salinity the same? I. The effect of ionic compositions on the salinity tolerance of five species of freshwater invertebrates. Marine and Freshwater Research 57, 75-82.
| Crossref | Google Scholar |
Zeng D, Liang K, Guo F, Wu Y, Wu G (2020) Denitrification performance and microbial community under salinity and MIT stresses for reverse osmosis concentrate treatment. Separation and Purification Technology 242, 116799.
| Crossref | Google Scholar |
Zhang K, Shi Y, Cui X, Yue P, Li K, Liu X, Tripathi BM, Chu H (2019) Salinity is a key determinant for soil microbial communities in a desert ecosystem. mSystems 4(1), e00225–18.
| Crossref | Google Scholar | PubMed |
Zhang X, Qi L, Li W, Hu BX, Dai Z (2021) Bacterial community variations with salinity in the saltwater-intruded estuarine aquifer. Science of The Total Environment 755, 142423.
| Crossref | Google Scholar | PubMed |
Zhao W, Wang Y, Liu S, Pan M, Yang J, Chen S (2013) Denitrification activities and N2O production under salt stress with varying COD/N ratios and terminal electron acceptors. Chemical Engineering Journal 215–216, 252-260.
| Crossref | Google Scholar |
Zhao Q, Bai J, Gao Y, Zhao H, Zhang G, Cui B (2020) Shifts in the soil bacterial community along a salinity gradient in the Yellow River Delta. Land Degradation & Development 31(16), 2255-2267.
| Crossref | Google Scholar |
Zhou Y, Kellermann C, Griebler C (2012) Spatio-temporal patterns of microbial communities in a hydrologically dynamic pristine aquifer. FEMS Microbiology Ecology 81(1), 230-242.
| Crossref | Google Scholar | PubMed |