

Sustainability of beef production from brigalow lands after cultivation and mining. 1. Sown pasture growth and carrying capacity
Colin J. Paton A E , Jeffrey F. Clewett B , Alice R. Melland B , Tom Newsome C , Jochen Eberhard B , John McL Bennett D and Craig P. Baillie B
A EcoRich Grazing, PO Box 284, Goombungee, Qld 4354, Australia.
B Centre for Agricultural Engineering, University of Southern Queensland, 437–535 West Street, Toowoomba, Qld 4350, Australia.
C Outcross Pty Ltd, PO Box 1668, Armidale, NSW 2350, Australia.
D Centre for Sustainable Agricultural Systems, University of Southern Queensland,437–535 West Street, Toowoomba, Qld 4350, Australia.
E Corresponding author. Email: colin@ecorichgrazing.com.au
Animal Production Science 61(12) 1246-1261 https://doi.org/10.1071/AN20135
Submitted: 9 April 2020 Accepted: 5 March 2021 Published: 14 May 2021
Journal Compilation © CSIRO 2021 Open Access CC BY-NC
Abstract
Context: New Acland coal mine in south-eastern Queensland is seeking to rehabilitate mined land to pastures that are safe, stable and sustainable for beef production. Little is known of the productivity and sustainability of grazing previously mined land in the Darling Downs study region. Additionally, information is required to specify management guidelines for sustainable grazing of regional land types retired from cultivation.
Aims: Identify pasture growth characteristics, rainfall use efficiencies and long-term carrying capacities of subtropical sown pastures established on lands rehabilitated after open-cut coal mining in comparison to sown pastures established on un-mined but previously cultivated lands.
Methods: Pasture growth and quality (% nitrogen) were observed using the Swiftsynd methodology in ungrazed exclosures with three sites on rehabilitated lands of the Acland Grazing Trial over a 5-year period (2014–2018), and 13 sites on unmined lands over periods of 2–5 years providing data for modelling pasture growth.
Key results: Peak pasture yield (TSDM for autumn harvests) averaged for 2017 and 2018 was greater (P < 0.1) on rehabilitated sites than unmined Poplar Box land type sites (5957 and 2233 kg/ha respectively) but similar to Brigalow Uplands and Mountain Coolibah land type sites (3946 and 3413 kg/ha respectively). Pasture rundown was evident, with pasture N uptake decreasing over 5 years at some sites. Soil mineral N supply (potentially mineralisable N and mineral N) in spring was a useful indicator of N uptake over the following growing season. Simulations using the GRASP pasture growth model for the grazing trial period predicted rainfall use efficiencies of 12.0, 7.0, 9.1 and 4.8 kg/ha.mm rainfall for rehabilitated sites and unmined sites on Brigalow Uplands, Mountain Coolibah and Poplar Box land types respectively. Long-term carrying capacities based on estimates of long-term median pasture growth and 30% utilisation were 4.39, 3.58 and 5.92 ha/adult equivalent respectively for the unmined land types, and 2.45 ha/adult equivalent for the rehabilitated lands.
Conclusions: Rehabilitated land can be as productive as unmined but previously cultivated land.
Implications: Grazing management plans for sustainable management of mined and unmined lands can be developed using data from the present study. The plans will assist with the transition of rehabilitated lands to commercial agriculture.
Keywords: GRASP, land type, LTCC, nitrogen, pasture quality, pasture rundown.
Introduction
A key principle for ensuring that grazing lands are managed sustainably is to set stocking rates so that they are responsive to seasonal conditions and management requirements but also match long-term carrying capacity (LTCC) when averaged over periods of 20–30 years or more (Johnston et al. 1996; Hall et al. 1998; Hunt 2008; McKeon et al. 2009; O’Reagain et al. 2014; Walsh and Cowley 2016). Carrying capacity is defined as ‘the number of stock that can be sustainably carried in a paddock or on a property over a defined period of time’ (Alexander et al. 2018, p. 135) and, thus, LTCC is the average number of animals a paddock can be expected to safely support over a planning horizon of 20–30 years, without any decline in land condition. Consequently, on novel grazing land (Hobbs et al. 2006; Buisson et al. 2019), there is some uncertainty in calculating LTCC because pastures have only existed for a short period of time and there is a period of transience until stability is achieved. Determining LTCC requires knowledge of the average annual growth of pastures and their safe annual utilisation rates by herbivores (Ash et al. 2002; Chilcott et al. 2005; Hunt 2008; McKeon et al. 2009). These factors will vary by land type, land condition and local climatic conditions.
The combination of field data collection using the Swiftsynd process (Day and Philp 1997; Day et al. 1997) with modelling and long-term simulation (McKeon et al. 2010) for determining LTCCs is a well documented process. Seasonal pasture growth is measured in relation to soil type, fertility, depth, moisture holding characteristics and daily rainfall, for a minimum of 1 year. Data are used to calibrate the GRASP pasture growth model (McKeon et al. 2000, 2010; Clewett et al. 2021) for a land type and climate location, and the model is then run using long-term historical weather data to generate average annual pasture growth, rainfall use efficiencies (RUE) and safe utilisation rates necessary for calculating LTCC.
Land disturbed by mining activities in Australia is legally required to be suitably rehabilitated (Queensland Government 2014; Butler and Anderson 2018). The New Acland coal mine in south-eastern Queensland is undertaking a program to rehabilitate its mined land to support pastures for grazing (SKM 2013). Previously mined and rehabilitated land is usually different in structure and profile from the original pre-mined soil. These Anthroposols and some land types of the Darling Downs lacked supporting data to enable the calculation of LTCC, and thus, lacked a mechanism for setting stocking rates for sustainable grazing.
The open-cut coal mining process at Acland continuously moves forward by sequentially removing soil and the sandstone and mudstone overburden (mine spoil) from new sections of the mine to a depth of some 60 m. The argillaceous mine spoil is used to progressively refill older sections of the mine which are then top dressed with freshly removed top soil to a depth of ~45 cm. Newly formed sections are rehabilitated by progressively sowing a mix of tropical pasture species to establish pastures, constructing fences, supplying water and, subsequently, grazing the land for beef production. Rehabilitation of the land in this way is known and referred to by industry and the community as either rehab land or rehab pasture.
The research reported here is integral to the Acland Grazing Trial (Bennett et al. 2021; Clewett et al. 2021; Melland et al. 2021) established in 2013. The aim was to assess the sustainability and economic viability of beef cattle production from lands that were rehabilitated after open-cut coal mining, compared with surrounding unmined lands (Newsome et al. 2014). The trial was established on undulating Brigalow lands that were mainly used for dairying, beef and crops before open-cut coal mining began in 2002. These lands were developed for agriculture and underground coal mining in the 1920s. Native pastures of the region originally consisted of the preferred species kangaroo grass (Themeda triandra), Queensland bluegrass (Dichanthium sericeum), common wheatgrass (Elymus scaber) and wallaby grasses (Austrodanthonia spp.; Silcock and Scattini 2007), but with overgrazing became dominated by pitted bluegrass (Bothriochloa decipiens), green couch (Cynodon dactylon) and wiregrasses (Aristida spp.). The mainly clay soils have been derived from sandstones or overlying basalt flows. The mosaic of soils varied in depth and fertility and were well suited to grazing but marginal for cropping (McKenzie et al. 2017). Spatial differences in pasture productivity should be expected when these soils are used for mine site rehabilitation.
While rehab pastures at Acland were accepted as meeting rehabilitation standards in 2018 by the Queensland Government (New Hope 2018), the productivity of pastures on Anthroposols for beef production had not been previously published. Productivity of sown rehab pastures is likely to decline with time due to decreasing levels of nitrogen (N) availability after disturbance (Graham et al. 1985; Robbins et al. 1987; Myers and Robbins 1991; Peck et al. 2011). Furthermore, while there are recommended stocking rates for the soils and land types of the Darling Downs (Stone et al. 1999) derived from experienced operators, there is a dearth of information on the productivity of pastures for the grazing lands of the Darling Downs that have been established after a long period of cultivation for cropping (State of Queensland 2014), with an estimated 76 000 ha of cropping land in the Condamine catchment being retired to pastures (Biggs 2007). Information on the productivity of these pastures is critical for determining LTCCs of properties and paddocks and developing grazing management plans.
The objective of the present paper is to identify the pasture growth characteristics and LTCC of sown pastures that have been established on rehabilitated mining lands, in comparison to sown pastures established on un-mined but previously cultivated lands. RUE for calculating pasture growth, and effects of land type on estimates of long-term mean annual pasture productivity and livestock carrying capacity are addressed.
Materials and methods
Observations of pasture growth, quality and composition were made using the Swiftsynd methodology (Day and Philp 1997) at 16 sites on the Darling Downs of southern Queensland between 2012 and 2018, with all sites sown to pastures on lands with a history (often >50 years) of cultivation. Each observation site was a 12 × 12 m exclosure within a paddock grazed by cattle and clear of trees. Three sites on commercial beef properties (Colliery Park and Roundview) were measured for 3 years (2013–2015) and 13 sites were associated with the Acland coal mine as follows: (1) five sites adjacent to the mine were in paddocks used for the Acland Grazing Trial and were measured each year for the 5-year period 2014–2018, and (2) eight sites known as the benchmark sites (BMK) were on unmined lands within 7 km of the mine and were measured for 2 years (2017–2018). Data from the Swiftsynd observations together with additional soil, pasture and cattle data associated with the grazing trial and BMK sites (Bennett et al. 2021; Melland et al. 2021) were then used to calibrate the GRASP model (McKeon et al. 2010; Clewett et al. 2021), assess the effects of climate and derive estimates of long-term (60-year) mean annual pasture growth, RUE and LTCC.
Swiftsynd pasture observation sites
The Swiftsynd pasture observation sites located within the Acland Grazing Trial were in three paddocks that had been rehabilitated after coal mining and in one paddock that had not been mined, referred to in this paper as Control paddock. The trial was located within the Acland Land system (Vandersee 1975) near the town of Acland in southern Queensland (–27.30 latitude, 151.69 longitude) and adjacent to the New Acland coal mine (Fig. 1). As the open-cut mining process advanced across the previously farmed and grazed landscape the topsoil and underlying spoil from the leading edge of the mine were relocated to the mine’s trailing edge to achieve a continual land rehabilitation process of ~15 ha/year. The clay textured topsoil derived from vertosols and chromosols was briefly stockpiled (<6 months) and spread to an average depth of 45 cm after the mine spoil had been levelled and ripped. Pastures were established without fertiliser, using a mix of tropical grasses, including Rhodes (Chloris gayana), Bisset creeping blue (Bothriochloa insculpta cv. Bisset), green and Gatton panic (Megathyrsus maximus, formerly named Panicum maximum), silk sorghum (Sorghum spp. hybrid), and the native Queensland blue grass (Dichanthium sericeum), and legumes, including narrow-leaf vetch (Vicia sativa var. angustifolia), medics (Medicago spp.) and lucerne (Medicago sativa). Hexham scent (Melilotus indica) was not sown but was naturalised in pastures.

|
The rehabilitated land used for the Acland Grazing Trial was subdivided into the following three paddocks: Rehab 1 (22 ha), Rehab 2 (32 ha) and Rehab 3 (22 ha), with one Swiftsynd site located within each paddock, ensuring the site location was representative of each paddock. The date of pasture establishment completion for each paddock was as follows: Rehab 1 (established by 2007); Rehab 2 (established by 2010); and Rehab 3 (established by 2012). Rehab pastures grew vigorously before first grazing in 2013 and dry-matter (DM) yields in Rehab paddocks 1 and 2 reached total standing DM yields (TSDM) of ~15 000 kg/ha following exceptionally high rainfall in 2010–2011. The unmined control paddock (21 ha) with two Swiftsynd sites (Control 1 and Control 2) was sown at the same time as Rehab 3, with the above pasture mix in 2012. It was cultivated in the years up to the time of sowing and was a Brigalow Uplands land type as described below.
The eight BMK sites on unmined lands surrounding the mine and grazing trial were located in paddocks used for commercial beef production by the mining company, on the following three land types: Mountain Coolibah, Brigalow Uplands and Poplar Box (State of Queensland 2019). Land condition was assessed at each site as the product of soil condition based on soil surface attributes and pasture composition as described by Quirk and McIvor (2007) and Alexander et al. (2018), with ratings from good condition (A) to very poor condition (D). Pasture condition ratings at all sites were the same as the land condition ratings. Prior changes to land condition via soil erosion and nutrient depletion from previous land use for cultivation and annual cropping were considered as permanent changes to productivity and, thus, not included in field assessments. The location, topography, land type, soil attributes, land condition, year of pasture establishment and pasture composition at each of the BMK sites are shown in Fig. 1 and Tables 1 and 2. Further details of soil physical and chemical properties are given in Bennett et al. (2021).

|

|
Exclosures for the three Swiftsynd sites on commercial beef properties were constructed in October 2012. Two exclosures were on a Mountain Coolibah land type with a relatively fertile but shallow clay soil at Colliery Park, Clifton (77 km to the south of Acland). The two paddocks containing the Colliery Park exclosures were successfully under-sown to an annual oats crop by using coated seed with several grasses at 10 kg/ha of coated seed (Rhodes, Gatton panic, Bissett creeping blue grass, Premier digit grass (Digitaria eriantha) and bambatsi (Panicum coloratum)) and 1 kg/ha of Flaredale lucerne (Medicago sativa). Following more than 30 years of cropping, the Colliery Park 1 and 2 sites were sown to pasture in 2007 and 2012 respectively. The third exclosure was on a Brigalow Uplands land type at Roundview, Bell (52 km to the north-west of Acland), on a degraded couch grass pasture that had been cultivated for more than 40 years and originally sown to dairy pastures of unknown species in the 1970s. The soil at this site was a medium clay formed from sandstone. The latitude and longitude of all sites are shown in Table 2.
Swiftsynd methodology
The net primary production of pastures in ungrazed exclosures was measured using the Swiftsynd methodology (Day and Philp 1997) so that pasture growth could be measured without confounding losses from grazing and detachment. The 12 m × 12 m Swiftsynd exclosures were mown to 5 cm height or less before the onset of the growing season in spring and litter was removed so that subsequent pasture growth was measured as TSDM over the ensuing summer growing season. The exclosure was subdivided into four quarters, with a single 0.5 × 0.5 m area (quadrat) being randomly selected from each quarter (excluding previously harvested quadrats) to harvest, bag and measure pasture yield (TSDM). This gave four quadrats per plot at each harvest. Each quadrat was photographed, assessed for pasture composition (major species present), pasture height, estimated cover of green, dead, litter, bare ground and rocks, and then harvested with pasture yield fresh weight being recorded. TSDM was recorded after samples were dried in a forced draught dehydrator at 80°C for 48 h, and samples were separated into grasses, forbs and legumes. Three harvests were made during the growing season, including the first at the beginning of the growing season (in spring to mid-December), the second in summer (February) and third at the end of the growing season in autumn (April or May). Periods of pasture observation (first to last harvest) were as follows: Rehab 1, 2, 3 and Control 1 (17 February 2014 to 16 April 2018), Control 2 (17 December 2014 – 16 April 2018), BMK sites (8 February 2017 – 16 April 2018), and Colliery Park and Roundview (13 February 2013 – 18 February 2015). This gave 103 harvests at the Acland sites and 11 harvests on commercial properties.
Subsamples were taken from each quadrat after drying and bulked by pasture type (grass, forbs, legumes) for each exclosure before chemical analysis for N by SGS Australia Pty Ltd, by using NIRS techniques. Harvests in December were to assess initial N uptake and yield (the product of pasture DM N concentration and yield). Harvests in mid-growing season, February, and at the end of the growing season were timed to observe growth rates and peak DM and N uptake yields.
Soil N
Across the four Acland Grazing Trial paddocks (Rehab 1, Rehab 2, Rehab 3 and the Control) in which Swiftsynd sites were located, soil core samples to 1 m depth were collected in spring and late summer–early autumn each year for 5 years, beginning in spring 2013, by using a hydraulic rig. Five soil cores were collected and bulked at 10 and 20 cm depth intervals along five transects in each paddock. The samples were dried at 40°C, sieved to <2 mm and analysed for mineral N (KCl-extractable, Method 7C2, Rayment and Lyons 2011) and potentially mineralisable N (hot KCl-extractable mineral N, Method 7D1, Rayment and Lyons 2011). Soil mineral N supply, that is, soil N that was potentially available for uptake by plants and/or subsequent immobilisation by soil microbes, was defined as potentially mineralisable N plus mineral N. By accounting for the soil bulk density, and by assuming that the soil mineral N supply in the unmeasured depth of 20–40 cm was the average of values from the layers immediately above and below, total soil mineral N supply to 60-cm depth was expressed in kg/ha. The soil N data were used for comparison with uptake of N by pasture. More detail on the soil sampling is given in Bennett et al. (2021).
Modelling and simulation
The GRASP model (McKeon et al. 1990, 2000) modified for sown pastures (Clewett 2015; Clewett et al. 2021) was used to estimate daily changes in the soil water balance, pasture growth, N uptake and TSDM of pasture for all pastures where Swiftsynd exclosure sites were located. The model was first calibrated to the field observations of TSDM in the Swiftsynd exclosures by using the root mean-square of differences (RMSD) between model estimates and observed values as the objective function. The model was further calibrated to soil, pasture and cattle observations recorded for the Acland Grazing Trial and this resulted in some very minor changes to the model’s pasture parameters (Clewett et al. 2021). It was concluded that the Swiftsynd sites adequately represented pastures in the surrounding grazed paddocks. The calibrated model was used to estimate pasture growth rates and RUE (kg/ha pasture growth per millimetre of rainfall) between Swiftsynd harvests, with rainfall being calculated (to overcome errors in RUE caused by soil water storage) as the sum of evapotranspiration, runoff and deep drainage estimates. The calibrated model was also used in a long-term (60-year) simulation experiment to estimate the mean and frequency distribution of annual pasture growth (kg/ha DM) and RUE. This long-term simulation assumed a commercially relevant cattle-growing operation that adjusted stocking rates each year on 30 June to provide a long-term mean annual utilisation of 30% of pasture growth. This required a trial-and-error adjustment of stocking rates based on TSDM present at the end of the growing season (1 May) for each paddock or site in a series of simulation runs until the target of 30% utilisation was achieved. Daily weather data (rainfall, temperature, pan-evaporation, radiation and vapour pressure) from the SILO database (Jeffrey et al. 2001; Stone et al. 2019) on the LongPaddock website (www.longpaddock.qld.gov.au/silo/) was used for input to the GRASP model for the 60-year period from July 1958 to June 2018. While gridded data at latitude –27.30 and longitude 151.70 (near the Acland township) was used for the Acland Grazing Trial and BMK sites, data for the Colliery Park and Roundview sites were from the 0.05-degree grid points closest to their latitude–longitude (see Table 2). Data for the Acland Grazing Trial and BMK sites was supplemented with daily rainfall and temperature data for the 2014–2018 trial period from the New Hope automatic weather station at the Acland mine office (latitude –27.267, longitude 151.698).
Long-term carrying capacity
Long-term carrying capacity is calculated from mean expected annual long-term pasture growth for a land type, its safe utilisation rate and is expressed in adult equivalents (AE) where an AE is a 450 kg Bos taurus steer consuming 9 kg DM/day. This intake was based on results from the above GRASP simulations, which gave a mean of 8.6 kg/AE.day (the range was 8.4–9.0; Clewett et al. 2021) and is also equivalent to the rating of Holechek (1988) used in deriving the GRASP intake equations, but marginally different to the recent assessment of McLennan et al. (2020) of 8.0 kg/day.
A generic equation for calculating LTCC, also used in this paper, is
Error: Incorrect filename or format (AN20135_E1a.gif). Please check out
Modelled output is used in these calculations for land types reported in the present paper and for comparisons with similar land types in other regions. The safe utilisation rate used for all trial calculations was estimated as 30% and, thus, is in agreement with other studies (Clewett et al. 2021).
Statistical analyses
All statistical analyses were conducted using Genstat software (19th edn, VSN International Ltd, Hemel Hempstead, UK). Differences among land types in mean TSDM and pasture N yield for the 2017 and 2018 mid-autumn harvests were predicted by repeated-measures REML analysis using sites as replicates, assuming unstructured correlation between years within sites and fixed model terms of Land Type and Years. TSDM data were first transformed using a natural logarithm to equalise variance of residuals. The year effect and its interaction with land type was not significant (P > 0.1) for either TSDM or pasture N yield.
Regression analysis was used to assess trends over time (using the age of pasture in months since sowing) in pasture N yields (excluding legumes, kg/ha) measured in summer and mid-autumn each year for the five Swiftsynd sites in the Acland Grazing Trial paddocks. Regression analysis was also used to assess a linear relationship between pasture N yield (excluding legumes, kg/ha) and soil mineral N supply.
Results
Rainfall
Annual rainfall (July to June) for the trial period at Acland was variable with totals of 564, 476, 600, 695 and 478 mm for the 5 years from July 2013 to June 2018. The mean of 562 mm was 13% less than the long-term (1898–2018) mean of 642 (±154 s.d.) mm. Rainfall in late spring and early summer promoted pasture growth in all years, and late summer–autumn rains also extended the opportunity for pasture growth to late autumn in 2014, 2016 and, particularly, in 2017. However, late summer and autumn rains failed in 2015 and 2018 and annual rainfall to June in these years was 26% below the long-term mean. Rainfall was also below average to average each year at Colliery Park and Roundview and for the 3-year observation period (July 2012 to June 2015) was respectively 13% and 14% below the long-term means of 683 and 658 mm.
Pasture TSDM
Peak pasture yields were observed at the end of the growing season in mid-autumn with TSDM in early and mid-summer at 34% and 65% respectively, of the mean peak yield across all sites of 3819 kg/ha (Table 3). The unreplicated trial design of the Acland Grazing Trial, BMK and commercial property sites limited the types of statistical analyses that could be made. A repeated-measures analysis of the last two autumn harvests among land types in 2017 and 2018 showed, for those 2 years, that the Rehab land type peak yield (mean TSDM 5957 kg/ha) was significantly (P < 0.1) greater than Poplar Box Walloons peak yield (mean TSDM 2233 kg/ha) but was not significantly different from the Brigalow Uplands (mean TSDM 3946 kg/ha) and Mountain Coolibah (mean TSDM 3413 kg/ha) peak yields.

|
Over the 5 years of the trial (2013–2018), mean peak yield of the three Rehab sites was 5644 kg/ha (Table 3). Mean peak yield (weighted for observation numbers) of the 13 unmined sites on Mountain Coolibah, Brigalow Uplands and Poplar Box land types was 3210 kg/ha. Land type means (weighted for observation numbers) including Roundview and Colliery Park were 4006, 3393 and 2233 kg/ha respectively (Table 3).
Pasture growth over the trial duration was consistently highest in Rehab 1 and 2 sites, with mean peak yields of 5816 and 7400 kg/ha respectively, growth rates of 25.5 and 34.1 kg/ha.day respectively, and RUE of 11.9 and 16.0 kg/ha.mm respectively. Peak yields, growth rates and RUE were least on sites in C and D condition and were equal to or less than 2537 kg/ha, 16.4 kg/ha.day and 5.2 kg/ha.mm respectively (Table 3). These pastures in C and D condition were the oldest pastures observed and had probably been subjected to over-grazing.
Although no significance test could be applied, mean peak pasture yield of the youngest rehab site (Rehab 3, sown in 2012) of 3716 kg/ha was consistently less than were peak yields of Rehab sites 1 and 2 (sown in 2007 and 2010 respectively) but similar to those of the unmined sites of Control 1 (3890 kg/ha) and Control 2 (2810 kg/ha) also sown in 2012. Mean peak yield of the last two harvested years (2017–2018) for the Brigalow Uplands land type, which included the Control 1 and Control 2 sites, was similar (P > 0.1) to those of Mountain Coolibah and Poplar Box Walloon sites, which included the eight BMK sites near Acland (Table 3). The mean growth rate and RUE of Rehab 3 (16.6 kg/ha.day and 8.1 kg/ha.mm respectively) were more similar to the mean growth rate and RUE of unmined sites (18.4 kg/ha.day and 7.4 kg/ha.mm) than to the growth rates and RUE for Rehab 1 and Rehab 2 described above.
Peak yields (weighted for observations) at Acland Grazing Trial and BMK Swiftsynd sites averaged 3117 kg /ha, 3350 kg/ha and 5644 kg/ha of TSDM for the BMK, Control and Rehab sites respectively, over the duration of the trial from 2014 to 2018.
Pasture peak yields for mid-autumn harvests averaged 2537 kg/ha, 3470 kg/ha and 5548 kg/ha for Roundview, Colliery Park 2007 and Colliery Park 2012 sites respectively.
Swiftsynd sites in the Acland Grazing Trial were initially dominated by Rhodes grass, with Bisset creeping bluegrass being subdominant in all but Rehab 1 where Queensland bluegrass was subdominant (Table 2). At the completion of the trial in April 2018, Bisset creeping bluegrass dominated Swiftsynd sites in Rehab 2, and Controls 1 and 2, was co-dominant with Rhodes grass in Rehab 3 and a minor component of Rehab 1 where Rhodes grass remained dominant.
GRASP modelled predictions
Estimates of annual growth from GRASP simulations gave reasonable agreement with observed values during the Acland Grazing Trial period (Fig. 2). Minimum RMSD values for the 13 Swiftsynd exclosures in the trial and BMK sites ranged from 113 kg/ha for the BMK 11 site (6% of the mean observed yield) to 897 kg/ha for the Rehab 2 exclosure (16% of observed mean yield). Several outliers occurred and were possibly caused by spatial variability of rainfall. The regression of predicted versus observed pasture yield for all Swiftsynd sites at Acland gave a slope near unity (0.93) and an R2-value of 0.80. Similarly, predicted and observed pasture N uptake and yields were plotted. The fitted line slope was 0.91, close to 1:1, and R2 was 0.53.

|
The mean annual pasture growth estimated by GRASP over the trial period for the rehab paddocks (5951 kg/ha) was substantially greater than the mean annual production from pastures on unmined land (3008 kg/ha). GRASP estimates of both the rehab and unmined exclosures showed a large variation between the sites: 5478–8542 kg/ha TSDM for the rehab paddocks, and 1369–4690 kg/ha TSDM for the unmined land. Differences in soil fertility and pasture condition were probably the main causes of this variability. The mean of control exclosures (3598 kg/ha) fits with the continuum of the BMK unmined sites (Fig. 3). RUE ranged from 3.3 to 16.0 kg/ha.mm rainfall (Table 3) for the Swiftsynd sites and when averaged across land types were 12.0, 7.0, 9.1 and 4.8 kg/ha.mm rainfall for Rehab, Brigalow Uplands, Mountain Coolibah and Poplar Box land types respectively.

|
Pasture N concentrations and yields
Overall mean pasture N yields for early and mid-summer harvests were 44% and 75% respectively, of mid-autumn harvest mean N yield (19.24 kg/ha; Table 4). Mean yields of N in pasture for mid-autumn harvests in the last 2 years (2017 and 2018) were similar (P > 0.05) across all land types (Table 4). However, mean autumn yields of N varied among sites from 7.51 kg/ha (BMK 11) to 40.62 kg/ha (Rehab 2).

|
Statistical comparisons of mean seasonal N yields for the duration of the trial (5 years) and from the commercial grazing properties (all data given in Table 4) could not be made for the following two reasons: the BMKs were harvested only in the last 2 years of the grazing trial and Clifton and Bell were harvested at times different from Rehab, Control and BMK sites.
Pasture N yields peak in summer and autumn. Nitrogen yields averaged across summer and autumn harvests were 11.1 kg/ha, 11.4 kg/ha and 27.2 kg/ha for the BMK, Control, and Rehab sites respectively, over the 5 years of the trial (2017 and 2018 only for BMKs). Mean pasture N yields in mid-autumn were 39.5 and 40.6 kg/ha for Rehabs 1 and 2 respectively, twice as much as for Rehab 3 and almost three times the N yield in both Control sites (Table 4). Mean N yield at mid-autumn harvests for Roundview was 32.8 kg/ha and for Colliery Park 2012 it was 33.7 kg/ha, compared with that for Colliery Park 2007, the older pasture, which was 16.1 kg/ha. Mean N yield in mid-autumn averaged across Rehab sites was 33.4 kg/ha, almost twice those of the Brigalow Uplands and Mountain Coolibah land types (Table 4), and more than twice the yield of the Poplar Box land type.
Pasture N yields were plotted against pasture age in months since sowing. Pasture N yield data were transformed using a natural logarithm to equalise variance of residuals. A model including all five sites identified that slopes for Control 1 and Rehab 1 were not significant (P < 0.05); so, the sites were removed from the model. A model of the remaining three sites explained 78.9% of the variance in pasture N yield as pastures age by grouping Rehab 3 and Control 2 together because their constants were significantly different (P < 0.001) from zero but were not significantly different (P > 0.05) from each other, and by adopting a common slope (P < 0.001) between the combined Rehab 3 and Control 2 dataset and Rehab 2. The back-transformed relationships described exponential decline (Fig. 4).
|
Soil and pasture N relationships
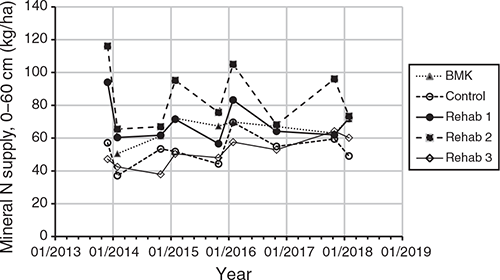
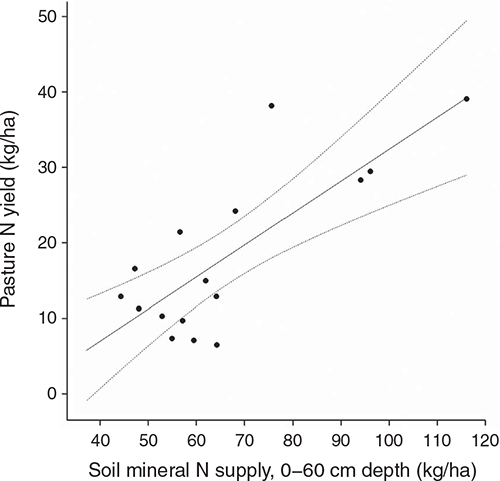
In the Acland Grazing Trial and BMK site paddocks, the soil mineral N supply was consistently highest in Rehab 2, followed usually by Rehab 1 and the BMK sites, and was almost always lowest in the Control and Rehab 3 over the 5 years of observation (Fig. 5). Trends over time in soil mineral N supply, tested using regression analysis, indicated that there was a small and similar increase across the four trial sites (i.e. excluding the BMK sites) and the percentage variance accounted for by time of sampling was 42.3% (Bennett et al. 2021). Pasture N yields in both summer and autumn were compared with total soil mineral N supply in spring and summer. The variance in pasture N yield was best explained by the relationship between pasture N uptake in mid-summer (February) and total soil mineral N supply measured in spring (November–December; Fig. 6). The linear slope estimate suggested that pasture N uptake was 42% of total soil mineral N supply.
|
|
GRASP estimates of long-term average pasture growth
Long-term estimates for RUE and pasture productivity derived via 60-year simulations showed a pattern similar to that of the trial period. Stratifying pasture production on the basis of land type showed the following order of productivity (high to low): Rehab sites (RUE 7.8 kg/ha.mm rainfall), unmined sites on Mountain Coolibah (RUE 5.2 kg/ha.mm rain), unmined sites on Brigalow Uplands (RUE 4.4 kg/ha.mm rain), and, last, unmined sites on the Poplar Box (RUE 3.2 kg/ha.mm rain; Table 5).

|
Seasonal growth patterns of pasture were strongly spring and summer dominant, irrespective of land type, with RUE being 59% and 56% higher respectively, than the mean annual RUE. RUE in autumn and winter were 70% and 15% respectively, of mean annual RUE. These values will be useful for calculating pasture growth from rainfall received at different times of the year when performing forage budgets in this region.
Long-term carrying capacity
The mean LTCC for the Rehab land type was the highest at 2.45 ha/AE, being more than twice the mean LTCC of the Poplar Box land type (Table 5). Rehab 2 gave the highest potential LTCC of 1.86 ha/AE.
Discussion
Observed and predicted TSDM
The observed data and estimates of mean annual pasture growth from GRASP showed that previously mined and rehabilitated land can be as productive as unmined land. Mean peak pasture TSDM, determined by autumn harvests and averaged over the last two harvests (2017 and 2018), for rehabilitated and unmined land were 5957 and 3914 kg/ha respectively. The peak TSDM for rehabilitated land was significantly (P < 0.1) greater than the peak TSDM observed on the unmined Poplar Box land type of 2233 kg/ha, but was similar to that of the Mountain Coolibah and Brigalow Uplands land types, with means of 3413 kg/ha and 3946 kg/ha respectively. GRASP estimates of the long-term mean annual pasture growth for the rehab and unmined lands were also substantially different and were 4959 and 2989 kg/ha respectively.
Mean observed TSDM of peak yield (autumn harvests) for the 2 years of 2017 and 2018 were 5440 kg/ha for Control 1, similar to BMK 18 (5605 kg/ha) and were at the upper end of the range for unmined sites. The remaining BMK sites averaged 2761 kg/ha (range 1605–3750 kg/ha), compared with 2350 kg/ha for Control 2, indicating that pasture productivity in the Control sites was within the range of unmined sites and was representative of unmined land. However, productivity has to be viewed in the context of land condition of these sites. Land in poor condition (C) is less than half as productive as land in good condition (A; McIvor et al. 1995; Ash et al. 2002; Alexander et al. 2018). All rehab and control sites were in A condition throughout the trial. Five of the BMK sites were in A condition, one in B, one in C and another in D condition. Poorer condition reduced average production of the BMK sites relative to their potential if in A condition. Bennett et al. (2021) found that the control paddock was at the lower end of the fertility spectrum for mineral N and plant-available phosphorus (Colwell P) when compared with 18 BMK sites that included the eight BMK sites studied for TSDM in the present study. Thus, productivity of the Swiftsynd BMK sites should average higher than that of the control sites, both in A condition, but average TSDM of the two control sites was either higher than, or similar to, that of the BMK sites as poor pasture species composition (and consequent poor land condition) was affecting productivity more than were soil attributes. Further supporting the importance of pasture species composition relative to soil fertility on productivity was that there was no significant difference in soil Colwell P among BMK sites of land condition A, B or C (Bennett et al. 2021). The poor land condition of several BMK sites, such as, for example, BMKs 11 and 10, is likely to be a carryover from their time under commercial crop production and heavy grazing, as was typical in the region (McKenzie et al. 2017).
Rehab productivity differences and pasture rundown
Although not tested for significance, observed TSDM means in autumn for Rehab 2 and, to some extent, Rehab 1, were consistently higher than those for unmined sites (Table 3), which suggests that they may consist of a soil type different from that of Rehab 3 and the Control. Land Resource Area mapping of the area before mining indicates that Land Resource Area 6a, Brigalow Uplands, covers the entire area that was later mined (Maher et al. 1998). However, soil and vegetation maps at a finer scale (Sattler and Williams 1999; SKM 2013) of the original vegetation and published before mining these sites, show a band of soil described as ‘Rainforest and scrubs’ derived from basalt (Regional Ecosystem 11.8.3) that could have been replaced into parts of Rehabs 1 and 2 post-mining. These soils, referred to as Softwood Scrub, are naturally more fertile with higher P and N than are the surrounding Brigalow and Poplar Box land types that are derived from Walloon sandstones (Biggs et al. 1999). This theory is consistent with the generally higher mineral N supply in Rehabs 1 and 2 than in Rehab 3, the Control and the BMK sites. Bennett et al. (2021) also found high mean Colwell P concentrations in Rehabs 1 and 2 (29 and 35 mg/kg respectively) at 0–60-cm depth over eight sample times in 5 years, and that Colwell P was lower in Rehab 3 (12 mg/kg), the Control (5 mg/kg) and BMK (23 mg/kg) paddocks. Also, it is likely the Swiftsynd site in Rehab 1 was situated on soil from this higher-fertility land type and a high proportion of the remaining paddock was on soil from Brigalow Uplands derived from Walloon sandstone.
Thus, differences in productivity (TSDM) among Rehab paddocks can be explained by their inherent soil properties and plant tissue chemical analyses. Nitrogen uptake by pasture in Rehab 2 was initially relatively high but declined with time (Fig. 4). Rehabs 1 and 2 were sown in 2007 and 2010 respectively; so, they are older pastures and would be expected to have less plant-available N in the soil than would a younger pasture such as that in Rehab 3 (Graham et al. 1985; Robbins et al. 1987; Myers and Robbins 1991). Mean N yields for the last two autumn harvests from Rehabs 1 and 2 were 46.1 and 23.5 kg/ha respectively, compared with means of 14.5 and 12.2 kg/ha in the Control and BMK sites respectively (Table 4). This indicates that the inherently higher soil fertility of Rehabs 1 and 2 was driving higher pasture growth and quality at the Swiftsynd sites. The soil N data given in Fig. 5, showing potentially available soil N, supports this theory. Cattle production (mean cumulative liveweight gain) from Rehab 2 was also higher (P < 0.05) than from Rehab 3 and Rehab 1, which were similar (Melland et al. 2021).
Soil mineral N supply helps explain the differences in the uptake of N among sites and the consequent productivity, and has potential as a predictor of N uptake in these pastures. Despite a general positive relationship between soil mineral N supply and N yields in pasture across a 2.5-fold range of soil N fertility levels (Fig. 6), the soil N indicator was not sensitive enough to reflect declines within individual paddocks over time in observed pasture TSDM and N uptake (Bennett et al. 2021; Melland et al. 2021). Rehab 2 had the highest mineral N supply, highest N yields in pasture and, also, higher cattle production (Clewett et al. 2021; Melland et al. 2021). This indicated, first, that rehabilitated mining land can be as productive as unmined land and, second, that Rehab 2 soil is likely to be composed of inherently higher-fertility soil than are other sites, as described above.
Rundown is an issue for all sown grass pastures and is characterised by an initial lift in productivity in the first year or so after pasture establishment, followed by a rapid, and then slower exponential decline in productivity with time from sowing, that is, age of pasture (Radford et al. 2007; Peck et al. 2011). Rehab 1 was the oldest pasture, sown in 2007, where expected productivity decline should be greatest but appeared stable over the 5 years of the trial, with a higher productivity and N yields than in Rehab 3 and Control sites (Figs 4, 5). Rehab 2 was also an older pasture than the Control and Rehab 3 but was more productive with higher N yields.
When comparing the trends of change in pasture N yield as the time since sowing of pastures increased (Fig. 4), there was no significant change in the Control 1 or Rehab 1 sites. Pasture in Rehab 1 was sown 7 years before the start of the trial and, so, may have approached a stable productivity level during the 5-year trial. The lack of change in the younger Control 1 site remains unexplained. Trends in the remaining three paddocks took the form of an exponential decline, as expected, and with a common slope. However, Rehab 2 had a significantly higher constant than did Rehab 3 and Control 2. Two exponential decline models, therefore, described the trends in the three paddocks and reflected the land type from which the soil was likely to be derived, i.e. the Softwood Scrub site (Rehab 2) and the Brigalow Uplands sites (Rehab 3 and Control 2). The common slope for the two models meant that the decline in pasture N yield was similar in the Softwood Scrub and Brigalow Uplands sites, but due to their inherently higher-fertility soils, the mean N yields of autumn harvests in 2017–2018 in the Softwood Scrub soils (34.8 kg/ha) about 9 years after sowing were twice those in the Brigalow soils about 6 years after sowing (14.4 kg/ha, Table 4).
Additionally, grass pastures exhibit preferences for soil types and fertility levels (Partridge et al. 2009). Rhodes grass, a high N-demanding pasture species, dominated Rehab and Control site plots in 2014, while Bissett creeping blue grass, a lower-fertility succession grass (Partridge 2003; Partridge et al. 2009) was subdominant, a reflection of high available soil N at the commencement of the trial. At the completion of the trial in May 2018 and in the absence of grazing, Bissett creeping blue dominated both of the Control and the Rehab 2 Swiftsynd sites, being a further indication of the extent of pasture rundown, without any potential influence of selective grazing affecting this change.
Symptoms of rundown in grass pastures include declining N yields, pasture growth and animal productivity (Robbins et al. 1987). While declining N yields were evident in Swiftsynd exclusion areas of this trial, no significant (P < 0.05) pattern of declining pasture productivity was detected, other than in grazed pasture assessments in the Control and Rehab 3 paddocks (Melland et al. 2021), possibly for several reasons. First, at the commencement of the trial, the Rehab 1 and 2 pastures were in their 8th and 5th seasons of growth respectively. The rundown process was very close to complete for Rehab 1 and more than half complete for Rehab 2 and, thus, lack of any clear evidence in the field observations of rundown in TSDM was to be expected. The expected duration of rundown to 5% of the initial lift was estimated to be 6 and 9 years after the establishment year for Rehab 1 and 2 (Clewett et al. 2021) and less (5 and 4 years) for Rehab 3 and Control paddocks respectively, because of their lower fertility (N uptake). TSDM observations on Rehab 3 and Control 2 started in the 3rd and 4th years of growth and TSDM declined over time (Fig. 2) but the declines were not significant (P < 0.05). No decline of TSDM was evident in Control 1. It was likely to have been affected by a local rainfall event in Year 5 (i.e. the 7th year of growth) and the same event probably affected BMK 18 (Fig. 2, open triangles). Simulation results from the GRASP modelling following calibration of the GRASP model to the Swiftsynd pasture data in the present paper and the Botanal pasture data in Melland et al. (2021) suggested a marginal elevation of pasture growth during the trial period due to the typical short-term increases in productivity shown by sown pastures. The GRASP analyses suggested that the 5-year means of annual pasture growth for the Rehab 1, 2 and 3 and Control paddocks were elevated by 1%, 16%, 17% and 14% respectively, during the trial period (Clewett et al. 2021). It is likely that higher values of TSDM would have been observed if observations had commenced when pastures were first established.
Second, variation in seasonal conditions combined with differences in soil types between Rehabs 1 and 2 (higher fertility) and Rehab 3 and the Control plots (lower fertility) were likely to have masked the expression of rundown. In their work on rundown, Robbins et al. (1987) had pastures of differing ages in each year growing on the same soil type, that is, pastures that were 1, 2, 3, 4 and 5 years old in any year, allowing valid comparisons each year irrespective of season. That was not possible in the Acland trial where soils differed in their fertility levels, which confounded the pasture age effect for comparisons in any single year. Thus, while rundown was evident in pasture N uptake data, not all symptoms of rundown were expressed clearly in this trial.
The trends in N yield decline in Rehab and Control sites pose the questions ‘How much more will rundown reduce the productivity of rehabilitated land?’ and ‘Where will productivity stabilise?’. The productivity of the older pasture site at Colliery Park is a likely indication of stable pastures. The initial lift in productivity associated with subsequent pasture rundown was estimated to have increased mean annual pasture growth over the 5 years of the Acland Grazing Trial by 12%, with the greatest lift of 41% occurring in Year 1 in the Rehab 3 and Control paddocks (Clewett et al. 2021). This compares with an estimated reduction in productivity of 37% at the Colliery Park site where a legume (lucerne) was contributing some N to available soil pools.
GRASP predicted pasture productivity, RUE and LTCCs
The level of agreement between observed and predicted TSDM (Fig. 2) was assessed as sufficient to warrant the use of modelled outputs to assess RUE and long-term pasture productivity in simulation experiments using the GRASP pasture growth model.
These estimates are useful in defining the LTCC of pastures (Hunt 2008; Hunt et al. 2014; Walsh and Cowley 2016; Alexander et al. 2018), and as a basis for informing grazing management decisions via feed budgeting calculations for short-term stocking rates. However, there are several important assumptions made in using the model to estimate LTCC. For example, it is assumed that the pasture observations in the present study were sufficient to adequately parameterise the model for use in simulations with long-term (60-year) weather data containing a wider range of weather conditions than observed. It is also assumed that many components in GRASP that were not observed as part of the Acland Grazing Trial (such as animal intake) are robust across a range of environments, and, furthermore, that the simulation results of pasture production will not be unduly perturbed by ecological processes that potentially occur over long periods of time, causing incremental changes in pasture condition, composition and productivity. The above assumptions cause some uncertainty in the estimates of LTCC, but attempts to quantify this uncertainty have not been made. The GRASP estimates of pasture growth were greatest in Rehab 2, with an estimated mean annual growth and RUE of 6528 kg/ha and 10.3 kg/ha.mm rainfall respectively (Table 5). This equates to a LTCC of 1.86 ha/AE (Table 5), which is by far the highest LTCC of the land types within the trial. This compares favourably with a similar land type in the Burnett (Softwood Scrub) that had a RUE of 11.5 kg/ha.mm rain (State of Queensland 2014; Bath 2016). The next-highest was the Mountain Coolibah land type, followed by Brigalow Uplands and then Poplar Box (Table 5). The RUEs of the Mountain Coolibah and Brigalow Uplands land types were similar to the 4.5 kg/ha.mm RUE of native black spear grass (Heteropogon contortus) pastures in the Burnett (McKeon et al.1990). Sites with low TSDM and very low RUE (2.9 kg/ha.mm) were also pastures in poor condition, such as BMK 11, that would likely have lower infiltration rates (Fraser and Stone 2016). It is surprising that productivity of the Brigalow Uplands land type was lower than that of the Mountain Coolibah, as the current estimate of median annual pasture growth for Brigalow Uplands at Bowenville (~23 km from the trial site) is 5640 kg/ha, whereas Mountain Coolibah for the same climate centre has been given as 4660 kg/ha (State of Queensland 2014) on the basis of field observations throughout northern Australia and modelled estimates of pasture growth (Day et al. 1997; Stone et al. 2019). In the neighbouring Burnett region, RUE of a Brigalow Belah land type was 11.5 kg/ha.mm rain (State of Queensland 2014), compared with 4.5 kg/ha.mm from Brigalow Uplands in the present paper. The lower RUE reported in the present paper is likely to be due to soil erosion, soil structural decline and nutrient depletion from years of grain and forage cropping and heavy grazing, with near zero nutrient return to the soil (Heijnen et al. 1999; Biggs 2007; McKenzie et al. 2017). The level of rundown in the Burnett study was not stated by the authors (State of Queensland 2014), but it is likely that the predicted annual production of the Brigalow Belah land type in the Burnett is before N rundown has reached its full extent. Similarly, the basaltic soils, Mountain Coolibah from this trial and Silver-leaved Ironbark from the Burnett, have RUEs of 5.5 and 6.3 kg/ha.mm respectively, the former having a history of cropping and rundown. Erosion and nutrient depletion can result in changes to the original land type that preclude returning it to its original soil profile, nutrient status and level of productivity (Buisson et al. 2019). Thus, it would be useful to add a postscript to land type names that indicates previous land use history such as ‘Brigalow Uplands, Old cultivation’ and, consequently, in practice it becomes a new land type.
Results from the present work have highlighted the importance of identifying the history of a parcel of land from two aspects. First, do the predicted production and RUE figures represent old cultivations with a history of nutrient depletion and heavy grazing or are they for lands that have been maintained in good condition throughout their cropping and grazing history? Second, what stage of N rundown do the stated production figures represent? End users of predicted pasture growth data need this information to make well informed and better decisions regarding LTCCs and performing forage budgets. Knowing the range of production from peak productivity on newly developed country through to productivity of the country at equilibrium once rundown has occurred will better inform decisions around sustainable grazing management.
Forage budgets for determining seasonal pasture availability relative to the number of stock being carried have been employed in the rangelands of northern Australia (Taylor and Paton 2016), with escalating interest due to satellite imagery facilitating the determination of biomass remotely (P. Tickle, pers. comm.). Mean daily growth rates of pastures on Rehab and Mountain Coolibah land types were similar to each other and twice that of the Poplar Box land type, with Brigalow Uplands of intermediate values. Long-term simulations (60 years) showed that seasonal growth patterns varied from 15% of the mean annual RUE in winter to 159% of the mean in spring and 156% in summer. These data will be useful for calculating ‘in grazing’ pasture growth at other sites on these land types for forage budgets in different seasons.
Swiftsynd methodology
Swiftsynd provides a valuable method for observing the net primary production of pastures, and particularly, as a data collection method for calibrating the GRASP pasture growth model. However, there are several drawbacks. First, clipping the pasture quadrats with shears is time consuming and, thus, the number and size of samples is usually small (4 quadrats of 0.25 m2 per exclosure at each harvest in the present study) and this restricts the capacity to measure spatial variability and leads to higher levels of variability in the measurement of TSDM. The estimated average time required for two experienced operators was 1.25 h per exclosure per harvest in the present study, with the largest proportion of time (90%) spent measuring pasture height, recording cover, cutting the four quadrats and separating into grasses, forbs and legumes. In total, there were 103 Swiftsynd harvests across the 5 years and 13 sites at Acland. While the mean yield of these harvests was 2879 kg/ha, the average standard deviation of the four quadrats at each harvest was 1002 kg/ha and the average coefficient of variation was 33%. This variability in field data was marginally greater than the differences between the GRASP and observed estimates of TSDM. The RMSD was 793 kg/ha or 28% of the mean. The destructive process used in Swiftsynd harvests is a further limitation of the methodology as the same location cannot be repeatedly measured. Non-destructive imaging methods are available, such as near-infrared and terrestrial laser scanning by LiDAR (light detection and range), and are capable of rapidly estimating TSDM, height, volume, cover and potentially species over large and spatially diverse areas with a useful accuracy (Schaefer and Lamb 2016; Anderson et al. 2018; Schulze-Brüninghoff et al. 2019). Inclusion of these methods within the Swiftsynd methodology would help improve the accuracy of field observations, while reducing labour and time inputs. The entire area of the exclosure could be measured at each harvest, and more frequently (e.g. to capture the effects of species differences at the start of each growing season when mowing and raking is used to reset the pasture). This would shift the emphasis of cutting quadrats towards verification of optically based estimates of pasture attributes and collection of samples for chemical analysis. Time saved in sampling might allow more exclosures to be sampled, giving greater coverage of variability across paddocks and land types. A review of the Swiftsynd methodology is recommended.
Conclusions
Data from the Swiftsynd sites showed pastures on rehabilitated and previously mined areas can be as productive, or better, than are pastures on unmined soils. These data have been successfully employed in the GRASP model to determine the long-term productivity, sustainability and viability of these Anthroposols relative to surrounding unmined land and found rehabilitated land to be as productive and viable as surrounding unmined land. While results suggest a rundown in pasture productivity of 30–40% over 6 years, the full extent of productivity decline as pastures age is unknown at this stage. It is possible that pasture species in the rehab paddocks may continue to change with pasture age as a result of rundown. For example, Rhodes grass and panic species may be replaced in time with grasses such as creeping bluegrass and Queensland bluegrass that tolerate and persist in lower N conditions.
The RUE and long-term pasture productivity data will enable the development of grazing management plans for the sustainable management of both mined and unmined lands. These plans will allow mining operators to sustainably manage towards the transition of rehab paddocks to commercial agriculture. The data also provide critical information (LTCC, RUE) to allow development of similar grazing management plans for land types on commercial enterprises elsewhere on the Darling Downs.
Conflicts of interest
The authors declare no conflicts of interest.
Declaration of funding
Research funding support is acknowledged from the New Hope Corporation concerning the Acland Grazing Trial, and the Australian Government through the Condamine Catchment Natural Resource Management Corporation for financial support of the on-farm studies.
Acknowledgements
The authors acknowledge the staff of New Hope and Acland Pastoral for providing field support for the Acland Grazing Trial (mustering, fencing, water), particularly Ben Muirhead and Tom Sheppard for providing advice and data on the pasture species sown into rehab and control paddocks, time of sowing and weather observations for the trial period. We also sincerely thank the co-operators and property owners Lleyton Free (Clifton) and John and Bevan Walker (Bell) for providing parts of their properties and support for the on-farm studies.
References
Alexander J, Paton C, Milson J (2018) ‘Grazing Fundamentals EDGE: Foundations for grazing production. Workshop notes.’ (Meat and Livestock Australia)Anderson KE, Glenn NF, Spaete LP, Shinneman DJ, Pilliod DS, Arkle RS, McIlroy SK, Derryberry DR (2018) Estimating vegetation biomass and cover across large plots in shrub and grass dominated drylands using terrestrial lidar and machine learning. Ecological Indicators 84, 793–802.
| Estimating vegetation biomass and cover across large plots in shrub and grass dominated drylands using terrestrial lidar and machine learning.Crossref | GoogleScholarGoogle Scholar |
Ash A, Corfield J, Ksiksi T (2002) ‘The Ecograze project: developing guidelines to better manage grazing country.’ (CSIRO Sustainable Ecosystems, Davies Laboratories: Aitkenvale, Qld, Australia; and Queensland Department of Primary Industries: Charters Towers, Qld, Australia)
Bath G (2016) FutureBeef Stocktake Plus app: Beyond Development: Extension and strategy. Qld Department of Agriculture & Fisheries. Final report on project EIFL1501. Meat and Livestock Australia.
Bennett JMcL, Melland AR, Eberhard J, Paton C, Clewett JF, Newsome T, Baillie C (2021) Rehabilitating open-cut coal mine spoil for a pasture system in south east Queensland, Australia: abiotic soil properties compared with unmined land through time. Geoderma Regional 25, e00364
Biggs A (2007) The landscape and marginal cropping lands: inherent and induced. Tropical Grasslands 41, 133–138.
Biggs AJW, Coutts AJ (1999) Land resources. In ‘Central Darling Downs land management manual: resource information book’. pp 27–80. (Eds PS Harris, AJW Biggs, BJ Stone, LN Crane, NJ Douglas) (Queensland Government, Department of Natural Resources: Brisbane, Qld, Australia)
Biggs AJW, Coutts AJ, Harris PS (Eds) (1999) ‘Central Darling Downs land management manual: soil chemical data book.’ DNRQ990102. (Queensland Government, Department of Natural Resources, Brisbane, Qld, Australia)
Buisson E, Le Stradic S, Silveira FAO, Durigan G, Overbeck GE, Fidelis A, Fernandes GW, Bond WJ, Hermann J-M, Mahy G, Alvarado ST, Zaloumis NP, Veldman JW (2019) Resilience and restoration of tropical and subtropical grasslands, savannas, and grassy woodlands. Biological Reviews of the Cambridge Philosophical Society 94, 590–609.
| Resilience and restoration of tropical and subtropical grasslands, savannas, and grassy woodlands.Crossref | GoogleScholarGoogle Scholar | 30251329PubMed |
Butler AR, Anderson TR (2018) Reassessing rehabilitation objectives and targets for mature mining operations in Queensland. In ‘In From start to finish: a life-of-mine perspective’. Spectrum Series 24. (Ed. AusIMM) pp. 233–242. (Australasian Institute of Mining & Metallurgy: Australia)
Chilcott CR, Quirk MF, Paton CJ, Nelson BS, Oxley T (2005) Development of a grazing land management education program for northern Australia’s grasslands and grassy woodlands. In ‘Proceedings of 20th International Grassland Congress: Offered Papers’. (Eds FP O’Mara, RJ Wilkins, L ’t Mannetje, DK Lovett, PAM Rogers, TM Boland) p. 793. (Wageningen Academic Publishers: Wageningen, The Netherlands)
Clewett JF (2015) Pasture measurements and bio-economic analyses to assess the effects of climate, grazing pressure and pasture rundown on soil carbon and returns from legume-based sown pastures in the Condamine region of southern Queensland. Final report to Condamine Alliance on project AOTGR1-137 ‘Increasing Soil Carbon in Degraded Cropping and Grazing Land’, Agroclim Australia, Toowoomba, Qld, Australia.
Clewett J, Newsome T, Paton C, Melland A, Eberhard J, Bennett J, Baillie C (2021) Sustainability of beef production from brigalow lands after cultivation and mining. 3. Effects of climate variability, pasture rundown and grazing pressure. Animal Production Science.
| Sustainability of beef production from brigalow lands after cultivation and mining. 3. Effects of climate variability, pasture rundown and grazing pressure.Crossref | GoogleScholarGoogle Scholar |
Day KA, Philp MW (1997) Swiftsynd: a methodology for measuring a minimum data set for calibrating pasture and soil parameters of the pasture growth model GRASP. Appendix 3 on project DAQ124A, Evaluating the Risks of Pasture and Land Degradation in Native Pastures in Queensland. Final report to Rural Industries and Research Development Corporation.
Day KA, McKeon GM, Carter JO (1997) Evaluating the risks of pasture and land degradation in native pasture in Queensland. Project DAQ124A. Final report. Rural Industries and Research Development Corporation.
Fraser GW, Stone GW (2016) The effect of soil and pasture attributes on rangeland infiltration rates in northern Australia. The Rangeland Journal 38, 245–259.
| The effect of soil and pasture attributes on rangeland infiltration rates in northern Australia.Crossref | GoogleScholarGoogle Scholar |
Graham T, Myers R, Doran J, Catchpoole V, Robbins G (1985) Pasture renovation: the effect of cultivation on the productivity and nitrogen cycling of a buffel grass (Cenchrus ciliaris) pasture. In ‘Proceedings of XV International Grassland Congress’, 24-31 August 1985, Kyoto, Japan. (Eds H Kirita, N Kitahara, N Koyama, M Nashiki, K Ochiai, T Okubo, M Shiyomi, K Sugawara, A Tajimi, H Yamaguchi) pp. 640–642. (Science Council of Japan: Nishi-Nasuno, Japan)
Hall WB, McKeon GM, Carter JO, Day KA, Howden SM, Scanlan JC, Johnston PW, Burrows WH (1998) Climate Change and Queensland’s grazing lands: II. An assessment of the impact on animal production from native pastures. The Rangeland Journal 20, 177–205.
| Climate Change and Queensland’s grazing lands: II. An assessment of the impact on animal production from native pastures.Crossref | GoogleScholarGoogle Scholar |
Heijnen E, Hodgson P, Lawrie B, Lee L, Stone B (1999) Land and environmental degradation. In ‘Central Darling Downs land management manual; resource information book. (Eds PS Harris, AJW Biggs, BJ Stone, LN Crane) pp. 143–162. (Queensland Government, Department of Natural Resources: Brisbane, Qld, Australia)
Hobbs RJ, Arico S, Aronson J, Baron JS, Bridgewater P, Cramer VA, Epstein PR, Ewel JJ, Klink CA, Lugo AE, Norton D, Ojima D, Richardson DM, Sanderson EW, Valladares F, Vilà M, Zamora R, Zobel M (2006) Novel ecosystems: theoretical and management aspects of the new ecological world order. Global Ecology and Biogeography 15, 1–7.
| Novel ecosystems: theoretical and management aspects of the new ecological world order.Crossref | GoogleScholarGoogle Scholar |
Holechek J (1988) An approach for setting the stocking rate. Rangelands Archives 10, 10–14.
Hunt LP (2008) Safe pasture utilisation rates as a grazing management tool in extensively grazed tropical savannas of northern Australia. The Rangeland Journal 30, 305–315.
| Safe pasture utilisation rates as a grazing management tool in extensively grazed tropical savannas of northern Australia.Crossref | GoogleScholarGoogle Scholar |
Hunt LP, McIvor JG, Grice AB, Bray SG (2014) Principles and guidelines for managing cattle grazing in the grazing lands of northern Australia: stocking rates, pasture resting, prescribed fire, paddock size and water points: a review. The Rangeland Journal 36, 105–119w.
Jeffrey SJ, Carter JO, Moodie KB, Beswick AR (2001) Using spatial interpolation to construct a comprehensive archive of Australian climate data. Environmental Modelling & Software 16, 309–330.
Johnston PW, McKeon GM, Day KA (1996) Objective ‘safe’ grazing capacities for southwest Queensland Australia: development of a model for individual properties. The Rangeland Journal 18, 244–258.
| Objective ‘safe’ grazing capacities for southwest Queensland Australia: development of a model for individual properties.Crossref | GoogleScholarGoogle Scholar |
Maher JM, Harris PS, Biggs AJW (1998) Central Darling Downs land resource areas map (1 : 250 000) 97-MCD-I-P3107. Queensland Government, Department of Natural Resources, Brisbane Australia.
McIvor JG, Ash AJ, Cook GD (1995) Land condition in the tropical tallgrass pastures: 1) effects on herbage production. The Rangeland Journal 17, 69–85.
| Land condition in the tropical tallgrass pastures: 1) effects on herbage production.Crossref | GoogleScholarGoogle Scholar |
McKenzie N, Hairsine P, Gregory L, Austin J, Baldock J, Webb M (2017) ‘Priorities for improving soil condition across Australia’s agricultural landscapes.’ (CSIRO Agriculture and Food: Canberra, ACT, Australia)
McKeon GM for the GRASP Modelling Team (2010) Improving Grazing Management Using the GRASP Model. Final report by Queensland Department of Environment and Resource Management on Project NBP.338. Meat and Livestock Australia, Sydney, NSW, Australia.
McKeon G, Day K, Howden S, Mott J, Orr D, Scattini W, Weston E (1990) Northern Australia savannas: management for pastoral production. Journal of Biogeography 17, 355–372.
| Northern Australia savannas: management for pastoral production.Crossref | GoogleScholarGoogle Scholar |
McKeon GM, Ash AJ, Hall WB, Stafford-Smith M (2000) Simulation of grazing strategies for beef production in north-east Queensland. In ‘Applications of Seasonal Climate Forecasting in Agricultural and Natural Ecosystems: the Australian Experience’. (Eds GL Hammer, N Nicholls, C Mitchell) pp. 227–252. (Kluwer Academic Press: The Netherlands)
McKeon GM, Stone GS, Syktus JI, Carter JO, Flood NR, Ahrens DG, Bruget DN, Chilcott CR, Cobon DH, Cowley RA, Crimp SJ, Fraser GW, Howden SM, Johnston PW, Ryan JG, Stokes CJ, Day KA (2009) Climate change impacts on northern Australian rangeland livestock carrying capacity: a review of issues. The Rangeland Journal 31, 1–29.
| Climate change impacts on northern Australian rangeland livestock carrying capacity: a review of issues.Crossref | GoogleScholarGoogle Scholar |
McLennan S, McLean I, Paton C (2020) Re-defining animal unit equivalence (AE) for grazing ruminants and its application for determining forage intake, with particular reference to the northern Australian grazing industries. Project B.GBP.0036. Final report to Meat and Livestock Australia, Sydney, NSW, Australia.
Melland A, Clewett J, Newsome T, Paton C, Bennett J, Eberhard J, Baillie C (2021) Sustainability of beef production from brigalow lands after cultivation and mining. 2. Pasture and cattle performance. Animal Production Science.
| Sustainability of beef production from brigalow lands after cultivation and mining. 2. Pasture and cattle performance.Crossref | GoogleScholarGoogle Scholar |
Myers R, Robbins G (1991) Sustaining productive pastures in the tropics. 5. Maintaining productive sown grass pastures. Tropical Grasslands 25, 104–110.
New Hope (2018) Media release, 5 November. Available at https://www.newhopegroup.com.au/news/2018/new-acland-mine-boasts-largest-single-area-of-certified-rehabilitation-in-queensland
Newsome T, Melland A, Bennett J, Paton C, O’Rourke P, Armstrong J, Austin A (2014) Acland Grazing Trial. Annual report to New Hope Group and Acland Pastoral.
O’Reagain P, Scanlan J, Hunt L, Cowley R, Walsh D (2014) Sustainable grazing management for temporal and spatial variability in north Australian rangelands: a synthesis of the latest evidence and recommendations. The Rangeland Journal 36, 223–232.
| Sustainable grazing management for temporal and spatial variability in north Australian rangelands: a synthesis of the latest evidence and recommendations.Crossref | GoogleScholarGoogle Scholar |
Partridge I (2003) Pasture Picker. Bisset creeping bluegrass. Available at https://www.tropicalgrasslands.asn.au/pastures/creeping_bluegrass.htm
Partridge I, Cook S, Paton C, Johnson B, Lambert G (2009) ‘Pastures for Protection & Production on marginal cropping lands. PRO9-4474.’ (Department of Employment, Economic Development and Innovation)
Peck G, Buck S, Hoffman A, Holloway C, Johnson B, Lawrence D, Paton C (2011) ‘Review of productivity decline in sown grass pastures.’ (Meat and Livestock Australia)
Queensland Government (2014) ‘Rehabilitation requirements for mining resource activities EM1122: Guideline Resource Activities. 30.’ (Queensland Government, Department of Environment and Heritage)
Quirk M, McIvor J (2007) ‘Grazing Land Management Technical Manual.’ (Meat and Livestock Australia: Sydney, NSW, Australia)
Radford BJ, Thornton CM, Cowie BA, Stephens ML (2007) The Brigalow Catchment Study: III. productivity changes on brigalow land cleared for long-term cropping and for grazing. Australian Journal of Soil Research 45, 512–523.
| The Brigalow Catchment Study: III. productivity changes on brigalow land cleared for long-term cropping and for grazing.Crossref | GoogleScholarGoogle Scholar |
Rayment GE, Lyons DJ (2011) ‘Soil chemical methods: Australasia.’ (CSIRO Publishing: Melbourne, Vic., Australia)
Robbins G, Bushell J, Butler K (1987) Decline in plant and animal production from ageing pastures of green panic (Panicum maximum var. trichoglume). The Journal of Agricultural Science 108, 407–417.
| Decline in plant and animal production from ageing pastures of green panic (Panicum maximum var. trichoglume).Crossref | GoogleScholarGoogle Scholar |
Sattler P, Williams R (1999) ‘The conservation status of Queensland’s bioregional ecosystems.’ (Environmental Protection Agency: Qld, Australia)
Schaefer MT, Lamb DW (2016) A combination of plant NDVI and LiDAR measurements improve the estimation of pasture biomass in tall fescue (Festuca arundinacea var. Fletcher). Remote Sensing 8, 109–118.
| A combination of plant NDVI and LiDAR measurements improve the estimation of pasture biomass in tall fescue (Festuca arundinacea var. Fletcher).Crossref | GoogleScholarGoogle Scholar |
Schulze-Brüninghoff D, Hensgen F, Wachendorf M, Astor T (2019) Methods for LiDAR-based estimation of extensive grassland biomass. Computers and Electronics in Agriculture 156, 693–699.
| Methods for LiDAR-based estimation of extensive grassland biomass.Crossref | GoogleScholarGoogle Scholar |
Silcock RG, Scattini WJ (2007) The original native pasture ecosystems of the eastern and western Darling Downs: can they be restored? Tropical Grasslands 41, 154–163.
SKM (2013) ‘New Acland Coal Mine. Rehabilitation monitoring program and 2013 monitoring.’ QE06704. (Sinclair Knight Merz: Brisbane, Qld, Australia) [Commercial in confidence]
State of Queensland (2014) ‘Stocktake Plus pasture growth tables generated by GRASP pasture growth model.’ (Ed. J Carter) (Queensland Government, Department of Environment and Sciences: Brisbane, Qld, Australia)
State of Queensland (2019) ‘Land types of Queensland. Version 3.1.’ (Ed. G Whish) (Queensland Department of Agriculture and Fisheries: Brisbane, Qld, Australia)
Stone B, Douglas N, Hamilton A, Lawrie B, Reithmuller J, Crane L, Gray J, Hodgson P, Orlando Y, Voller P (1999) Land planning and management strategies for sustainability. In ‘Central Darling Downs land management manual: resource information book’. (Eds PS Harris, AJW Biggs, BJ Stone, LN Crane, NJ Douglas) pp. 163–196. (Queensland Government, Department of Natural Resources: Brisbane, Qld, Australia)
Stone G, Pozza RD, Carter J, McKeon G (2019) Long Paddock: climate risk and grazing information for Australian rangelands and grazing communities. The Rangeland Journal 41, 225–232.
| Long Paddock: climate risk and grazing information for Australian rangelands and grazing communities.Crossref | GoogleScholarGoogle Scholar |
Taylor S, Paton C (2016) Cowboys or grass farmers? In ‘Proceedings of the 10th International Rangeland Congress’, 16–22 July 2016, Saskatoon, Saskatchewan, Canada. (Eds A Iwaasa, HA Lardner, M Schellenberg, W Willms, K Larson) pp. 562–564.
Vandersee BE (1975) ‘Land Inventory and Technical Guide. Eastern Downs area, Queensland: land classification and land use. Vol 7.’ (Qld Department of Primary Industries, Division Land Utilisation: Brisbane, Qld, Australia)
Walsh D, Cowley R (2016) Optimising beef business performance in northern Australia: what can thirty years of commercial innovation teach us? The Rangeland Journal 38, 291–305.
| Optimising beef business performance in northern Australia: what can thirty years of commercial innovation teach us?Crossref | GoogleScholarGoogle Scholar |