

Comparing the use of chloroform to petroleum ether for Soxhlet extraction of fat in meat
Peter Watkins A *
A *
A CSIRO Agriculture and Food, 671 Sneydes Road, Werribee, Vic. 3030, Australia.
Animal Production Science 63(14) 1445-1449 https://doi.org/10.1071/AN23014
Submitted: 30 January 2023 Accepted: 19 June 2023 Published: 10 July 2023
© 2023 The Author(s) (or their employer(s)). Published by CSIRO Publishing. This is an open access article distributed under the Creative Commons Attribution-NonCommercial-NoDerivatives 4.0 International License (CC BY-NC-ND)
Abstract
Context: Soxhlet extraction is commonly used for determining fat content of meat, because it is the basis of the AOAC Final Action method for this analysis. Petroleum ether is used as an extraction solvent but other solvents, such as chloroform, can be used. Chloroform has been stated to be a safer solvent than petroleum ether and is used extensively for Soxhlet extraction for meat research in Australia; yet, there has been no report that validates its use for this purpose.
Aim: To compare the use of chloroform with that of petroleum ether as an extraction solvent for Soxhlet fat extraction in beef.
Methods: The fat content of six beef samples, reported as chemical lean (CL, 100 – %fat), was determined using Soxhlet fat extraction with chloroform (by two independent research providers) and petroleum ether (b.p. 40–60°C, using three commercial providers). Passing–Bablok regression and Bland–Altman plot analysis were used to identify any differences and bias between the methods respectively.
Key results: Passing–Bablok regression showed that there was no difference between the use of chloroform and the use of petroleum ether as a solvent for Soxhlet fat extraction in beef. Bland–Altman plot analysis indicated that there was no bias evident between the uses of each solvent. Thus, this would indicate that chloroform can be used as a solvent for Soxhlet fat extraction, providing equivalency to petroleum ether. While some minor differences were apparent, this is most likely attributable to sample heterogeneity.
Conclusions: Chloroform was found to provide equivalency to petroleum ether for fat extraction from meat. While some minor differences were apparent in the fat content of meat, this has been attributed to likely sample heterogeneity.
Implications: Chloroform can be used as an extraction solvent for Soxhlet fat extraction of beef.
Keywords: Bland–Altman, chemical lean, fat content, fat determination, meat quality, method comparison, Passing–Bablok, Soxhlet extraction.
Introduction
Emerging technologies are being developed that will allow objective, precise and accurate measurements to be made of intramuscular fat (IMF) in Australian beef and lamb and have potential to improve the prediction of meat-eating quality for the local industry (Stewart et al. 2021). However, the development of such technologies will require industry standards that can be used as reference methods. With respect to fat in meat, Soxhlet extraction is, and has been often, used as the method of choice for this analysis, because it is the basis of the AOAC Final Action method for fat determination in meat (Anonymous 1998, 2000). Petroleum ether is commonly used as the solvent for Soxhlet extraction, yet other solvents can also be used (Anonymous 1998, 2000). Chloroform is such a solvent and has been stated to be safer than petroleum ether, and has been extensively used for meat research in Australia (Perry et al. 2001). Perry et al. (2001) stated that chloroform was used due to ‘safety regulations’; yet, this solvent is a halogenated hydrocarbon, meaning that it is carcinogenic with an associated toxicity (Fang et al. 2008). Chloroform has been used as a replacement for petroleum ether in the extraction of fat from freeze-dried animal tissues (covering the range of 10–95% fat content) and has been found not to reproducibly extract fat for some samples (Firth et al. 1985). Given that, for the Australian meat industry, the fat content in beef and lamb ranges from 1% to 50% and 1% to 15% respectively, and chloroform is used as a solvent for Soxhlet fat extraction in beef, a comparison was made on the use of this solvent to petroleum ether. This is particular for an Australian context where fat content is reported as chemical lean (CL), calculated using 100 − fat (%) content. This paper presents the results of this study.
Methods
Meat samples
Six beef samples spanning approximately 10–35% fat were used for this study, spanning the approximate range of CL90–CL65, where CL = 100 − fat% (CL is the chemical lean content). These samples were prepared for an industry-supported survey and their preparation is detailed elsewhere (Watkins et al. 2021). Briefly, meat was acquired from two Australian meat-processing companies, with 2 × 27.2 kg cartons acquired for each sample. After storage at 4°C, the meat was homogenised by combining the two cartons which were passed through a Thompson 42 mincer with a 6 mm plate (Thompson Meat Machinery, Crestmead, Qld, Australia). The homogenised material was combined and re-passed through the mincer and mixed using a commercial food/meat mixer (RC-100, Mainca USA Inc., St Louis, Mo, USA). The homogenate was separated and weighed into separate 1 kg packages which were then vacuum sealed (Cryovac® Barrier Shrink, United Kingdom). These were stored at −20°C until needed for analysis. Sets of six beef (1 kg) packages were distributed to three commercial vendors as well as to two research providers that use chloroform for Soxhlet extraction.
Soxhlet fat extraction
A set of samples was forwarded to three different commercial providers, and the fat content was measured by Soxhlet extraction in duplicate by each provider, who utilise petroleum ether (PE) as the extraction solvent (b.p. range 40–60°C). The chemical lean (CL) content was calculated using 100 − fat content (%). For the purposes of this study, the results were aggregated together and used as reference values (i.e. n = 6). This method is the AOAC Final Action method for the determination of fat in meat (Anonymous 1998, 2000). The use of chloroform as an extraction solvent was completed at two different research providers where the samples were freeze-dried prior to Soxhlet extraction (Stewart et al. 2020). For the latter, one set of results consisted of five replicates, while the other consisted of six replicates.
Statistical analyses
ANOVA was used to identify differences between techniques on a sample-by-sample basis. Tukey’s range test was used to determine the associated P-values and an in-house R function (R Core Team 2022) was used to identify any significant differences among means, using either a letter or number summary (Table 1).
| Sample | P1A | P2A | P3A | C1B | C2C | PAB,D | |
|---|---|---|---|---|---|---|---|
| A | 64.4 ± 0.2b | 63.3 ± 0.3ab | 64.7 ± 0.8b | 64.0 ± 0.6bX | 62.7 ± 0.4aX | 64.1 ± 0.8Y | |
| B | 72.0 ± 0.4ab | 72.7 ± 0.4a | 75.1 ± 0.6c | 71.3 ± 0.4bX | 71.6 ± 0.4abY | 73.3 ± 1.5Y | |
| C | 79.9 ± 0.1a | 80.9 ± 0.2b | 83.7 ± 0.1c | 79.3 ± 0.4aX | 79.4 ± 0.3aY | 81.5 ± 1.7B | |
| D | 84.7 ± 0.3b | 85.6 ± 0.2bc | 85.8 ± 0.1c | 83.6 ± 0.3dX | 82.9 ± 0.3aY | 85.4 ± 0.6Y | |
| E | 87.4 ± 0.2ab | 88.3 ± 0.4bc | 88.5 ± 0.6c | 87.7 ± 0.3bcX | 86.7 ± 0.3aY | 88.1 ± 0.6X | |
| F | 86.9 ± 0.1a | 87.0 ± 0.1ab | 88.4 ± 0.1b | 87.5 ± 0.3ab | 87.1 ± 0.7a | 87.4 ± 0.8 |
Mean ± s.d. where, for n = 2, it is the average deviation or its usual meaning for n = 5 or 6.
Different lowercase letters (a, b, c) within a row denote a significant difference for P1, P2, P3, C1 and C2, while different uppercase letters (X, Y) within a row represent a significant difference among C1, C2 and PA (=aggregated petroleum ether results).
An = 2.
Bn = 6.
Cn = 5.
DPA = aggregated petroleum ether results (i.e. P1 + P2 + P3).
Passing–Bablok (PB) regression was used to compare each set of measurements on a sample-by-sample basis (Passing and Bablok 1983). The PB approach is robust, non-parametric, assumes that measurements are continuously distributed (covering a broad concentration range, Bilić-Zulle 2011). The methods are also assumed to be linearly related (Bilić-Zulle 2011). The regression calculates the coefficients for the linear equation (y = b0 + b1x) as well as the associated 95% confidence intervals (95% CI) for each coefficient, b0 and b1, which (if the linear relation were valid) would mean that b0 = 0 and b1 = 1. Thus, if the span of CI intervals for the intercept and the slope contains 0 and 1 respectively, then it is presumed that no difference exists between the methods (Bilić-Zulle 2011), and so they be regarded as equivalent. The analysis was performed using the ‘PBreg’ command available in the ‘MethComp’ package (Carstensen et al. 2020) in R (R Core Team 2022).
Bland–Altman plot analysis was used to assess the presence of any bias present between each method. In this case, a plot of the mean difference (or bias) between measurements from two methods is made against the mean of the measurements, along with the limits of the agreements associated with the differences (Kopp-Schneider and Hielscher 2019). The lines of agreement are calculated as ±1.96s, where s represents the standard deviation associated with the differences. Plots were using the ‘plot’ command, while estimates of the difference and associated limits of agreement were undertaken using ‘BA.est’, both available in the MethComp package (Carstensen et al. 2020) in R (R Core Team 2022).
Results and discussion
Table 1 shows the chemical lean (CL, 100 − fat%) content of six beef samples (A–F), as determined by Soxhlet fat extraction using either PE or chloroform as a solvent. The petroleum ether results are provided, based on the individual commercial providers (P1, P3 and P3) as well as the results aggregated together (PA, i.e. P1 + P2 + P3 combined). Two sets of comparisons are shown in Table 1; that is, between the individual sets of PE results and chloroform (P1, P2 and P3 vs C1 and C2, denoted as lowercase letters within a row) as well as the aggregated PE results and chloroform (C1 and C2 vs PA, denoted as uppercase letters within a row). Differences can be seen between each provider across the different samples. For example, mean PE results for Sample A range from 63.2% to 64.7%, with a similar span observable for chloroform. Similar trends were evident for the other beef samples. It is apparent that there are differences among providers for the ether results. Unpublished work has shown that differences existed in the fat content across the original 1 kg packages, which was also found in previous work (Watkins et al. 2021). It had been assumed that when these packages were originally produced that the meat had been extensively homogenised. This assumption would have meant that no differences would have been observed across the packages; however, as can be seen, this was not the case. Variation in the fat content in meat is also known to exist among samples (Vander Heyden and Smeyers-Verbeke 2007). The coefficients of variation (CV) for these results are generally very good and are less than 5%, which is regarded as an acceptable limit for precision (Gemperline 2006).
In relation to the aggregated PE results, differences are apparent across the samples, except for Sample F. The use of PE gave slightly higher results than those obtained using chloroform (P = 0.013, based on a paired Student’s t-test). If the results from PE are taken as the ‘true’ results, then the maximum relative difference of those obtained using chloroform are less than 3%. One reason for this discrepancy may be related to sample heterogeneity, as has been noted above. Other factors could also have an influence on the results. For example, in preparation for extraction by chloroform, the meat samples were freeze dried and ground prior to extraction, while those extracted using PE were heated at 102°C for 5 h, as prescribed by the AOAC method. It is feasible that these different steps may have affected the results. There are also differences between the solvent polarities and boiling points, which may also contribute. For the former, chloroform is more polar (index = 3.1) than is PE (0.1), meaning that more polar material could be extracted from meat, than with PE, possibly providing a higher value for the fat content. Additionally, chloroform has a higher boiling point (61.2°C) than does PE (b.p. range 40–60°C), which might have an effect as well. While these can be contributing factors, it is difficult to gauge their impact on the results and so, at this stage, this remains speculative. Further work would be required to determine what impact (if any) factors such as these would have on the extraction procedure/s. Additionally, no direct comparison was made using the two solvents at one facility, meaning that any solvent effect could (or would) be confounded with any effect associated with facilities. This is one aspect which would need to be addressed in any future work to ascertain whether this is a confounding factor or otherwise.
Table 2 shows the regression coefficients obtained from Passing–Bablok regression analysis of the CL content on a method versus method basis, along with the associated 95% confidence intervals (CIs). The column sample identification denotes the dependent variable, while the row sample identification denotes the independent variable for the non-parametric regression. As noted above, if the span of CI intervals for the intercept and the slope contains 0 and 1 respectively, it is presumed that no difference exists between the methods (Bilić-Zulle 2011). As can be seen, each intercept (b0) and slope (b1) CI intervals contain 0 and 1 respectively, indicating that no difference in the fat content existed when either PE or chloroform was used as as the extraction solvent (Bilić-Zulle 2011). Additionally, the use of Passing–Bablok regression is that it is less susceptible to non-normal variations that exist within the data. Fig. 1 suggests that this could be apparent with the result of this study, but the analysis indicates that this does not sufficiently affect the comparison.
| Solvent | Slope | Intercept | |
|---|---|---|---|
| C1A vs C2B | 1.00 (0.93, 1.03) | −0.40 (−2.44, 4.91) | |
| C1 vs PEC | 1.00 (0.95, 1.61) | −0.90 (−6.22, 2.57) | |
| C2 vs PE | 1.02 (0.97, 1.08) | −3.53 (−8.35, 0.99) |
An = 36, median: 81.4 (span: 63.3–88.0).
Bn = 30, median: 81.1 (span: 62.2–88.0).
Cn = 36, median: 84.1 (span: 63.3–88.9).
Scatterplot and Bland–Altman plots for chemical lean (100 − fat %) by Soxhlet fat extraction with chloroform (1 and 2) and petroleum ether (PA, aggregated results) as the extraction solvent. The central blue lines represent the mean difference between the result sets, while the upper and lower blue lines represent ±1.96 × s.d. associated with the difference. The black lines represent 1:1 correspondence between the result sets.
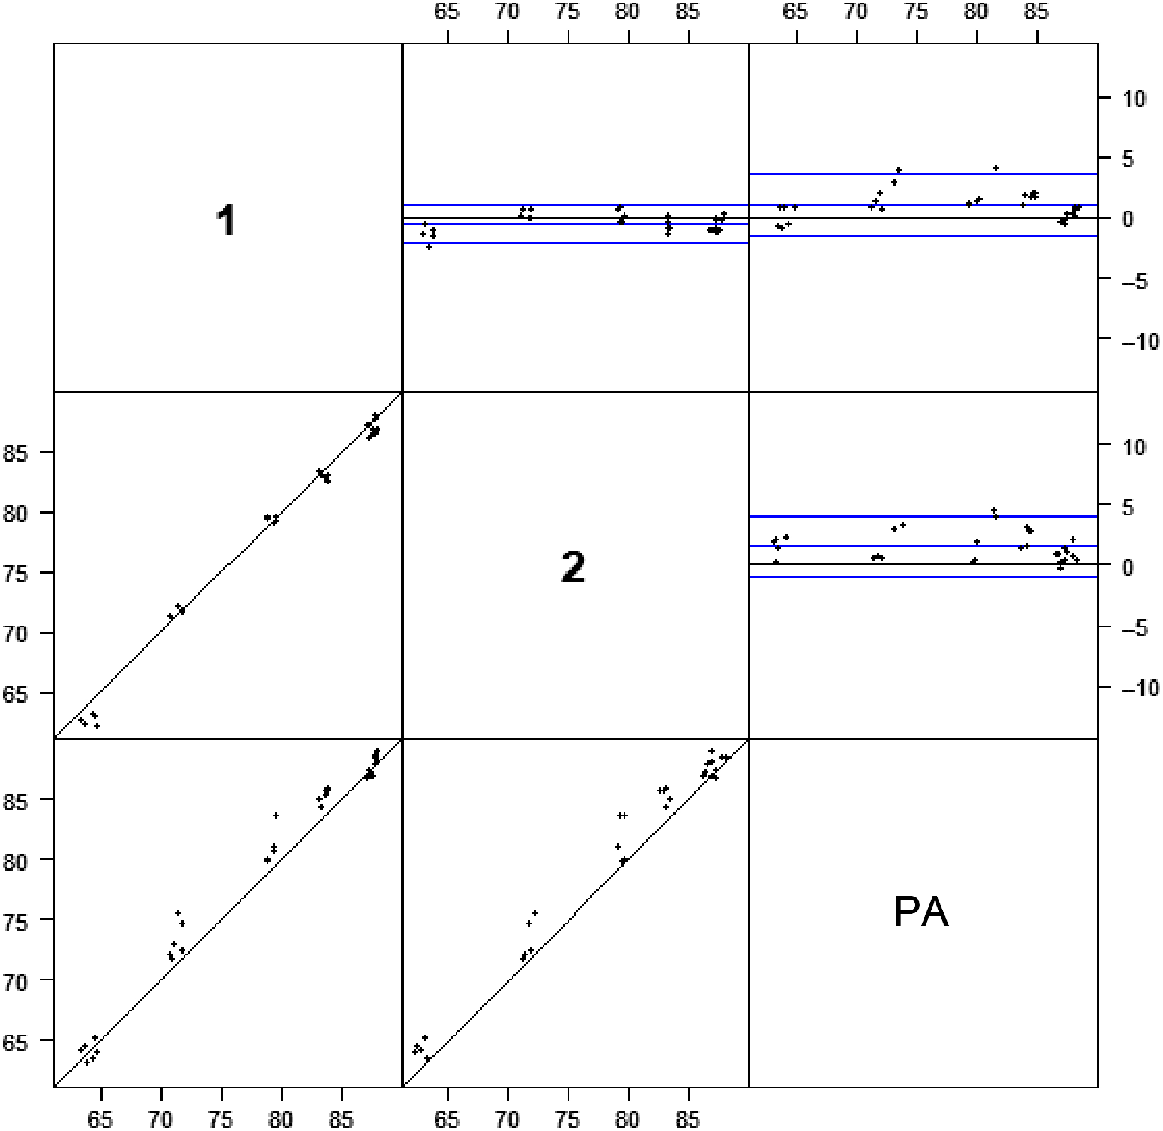
Fig. 1 shows a scatterplot of the meat sample CL contents with PA (aggregated PE) and chloroform as the solvent for Soxhlet extraction, along with the associated Bland–Altman (BA) plot. For the BA plots, the bold central line on the ordinate axis represents the mean difference between measurements, while the upper and lower lines represent the limits of agreement (LoAs) of the comparison, where the LoAs are ±1.96s, where s is the standard deviation associated with the differences. Where no bias is present between the methods, the points in a plot (such as Fig. 1) would be expected to be randomly distributed (scattered) above and below zero in the ordinate axis (Kalra 2017). With the alternative, where some bias is present between the methods, some structure (such as linearity in the plot) would be pronounced and evident. Inspection of Fig. 1 shows that, in the case of chloroform, there is not any strong evidence of structure within the plot, with most points being randomly scattered along the ordinate axes. In the case of PE, there does appear to be some structure evident, with most points being placed above the line for the comparison of PE to chloroform. Yet, there is no statistical evidence to support this observation (Table 3). Thus, it was concluded that there was no inherent bias between the methods.
| Solvent | Difference | LLoA | ULoA | Interval | |
|---|---|---|---|---|---|
| C1 vs C2 | −0.57 | −1.19 | 2.13 | 3.32 | |
| C1 vs PA | 1.06 | −1.90 | 4.02 | 5.92 | |
| C2 vs PA | 1.58 | −1.07 | 4.12 | 5.19 |
The statistics show the mean difference between the two methods, the values at 1.96 × s.d. above (upper limit of acceptance, ULoA) and below (lower LoA, LLoA) the mean difference value, and the interval between these two values (ULoA – LLoA).
Table 3 shows the differences, upper and lower LoAs and the interval between the upper and lower LoAs, calculated using Bland–Altman plot analysis (see above). The interval between the LoAs represents a 95% confidence level for the mean differences (Doğan 2018), ranging from 3 to 6, suggesting that consistency existed between the methods. A smaller interval range would be preferred because it would represent a narrower confidence level, also indicating closer agreement between the methods. Usually, increasing the number of replicate measurements results in narrower CI intervals for the mean difference and the agreement limits (Giavarina 2015), which would have been most likely for this study as well.
Conclusions
In summary, a comparison has been made on the use of PE and chloroform as solvents for Soxhlet fat extraction. This was undertaken using Passing–Bablok regression and Bland–Altman plot analysis. The former showed no difference between the methods, while the latter indicated that no bias was evident between the methods. Thus, this would suggest that the use of chloroform as a solvent for Soxhlet fat extraction provides equivalency to PE. While some minor differences were apparent, this has been attributed to be the likely sample heterogeneity.
Acknowledgements
The author acknowledges the two research providers who performed the Soxhlet fat extraction of the beef.
References
Anonymous (1998) Meat technology information sheet – crude fat determination – Soxhlet method. Available at https://meatupdate.csiro.au/infosheets/Crude%20Fat%20Determination%20-%20Soxhlet%20Method%20-%201998.pdf
Bilić-Zulle L (2011) Comparison of methods: Passing and Bablok regression. Biochemia Medica 21, 49-52.
| Crossref | Google Scholar |
Carstensen B, Gurrin L, Ekstrøm CT, Figurski M (2020) MethComp: analysis of agreement in method comparison studies. Available at https://CRAN.R-project.org/package=MethComp
Doğan NÖ (2018) Bland-Altman analysis: a paradigm to understand correlation and agreement. Turkish Journal of Emergency Medicine 18, 139-141.
| Crossref | Google Scholar |
Fang C, Behr M, Xie F, Lu S, Doret M, Luo H, Yang W, Aldous K, Ding X, Gu J (2008) Mechanism of chloroform-induced renal toxicity: non-involvement of hepatic cytochrome P450-dependent metabolism. Toxicology and Applied Pharmacology 227, 48-55.
| Crossref | Google Scholar |
Firth NL, Ross DA, Thonney ML (1985) Comparison of ether and chloroform for Soxhlet extraction of freeze-dried animal tissues. Journal of Association of Official Analytical Chemists 68, 1228-1231.
| Crossref | Google Scholar |
Gemperline P (Ed.) (2006) ‘Practical guide to chemometrics.’ (CRC Press) doi:10.1201/9781420018301
Giavarina D (2015) Understanding Bland Altman analysis. Biochemia Medica 25, 141-151.
| Crossref | Google Scholar |
Kalra A (2017) Decoding the Bland–Altman plot: basic review. Journal of the Practice of Cardiovascular Sciences 3, 36-38.
| Crossref | Google Scholar |
Kopp-Schneider A, Hielscher T (2019) How to evaluate agreement between quantitative measurements. Radiotherapy and Oncology 141, 321-326.
| Crossref | Google Scholar |
Passing H, Bablok W (1983) A new biometrical procedure for testing the equality of measurements from two different analytical methods. Application of linear regression procedures for method comparison studies in Clinical Chemistry, Part I. Clinical Chemistry and Laboratory Medicine 21, 709-720.
| Crossref | Google Scholar |
Perry D, Shorthose WR, Ferguson DM, Thompson JM (2001) Methods used in the CRC program for the determination of carcass yield and beef quality. Australian Journal of Experimental Agriculture 41, 953-957.
| Crossref | Google Scholar |
Stewart SM, Lauridsen T, Toft H, Pethick DW, Gardner GE, McGilchrist P, Christensen M (2021) Objective grading of eye muscle area, intramuscular fat and marbling in Australian beef and lamb. Meat Science 181, 108358.
| Crossref | Google Scholar |
Vander Heyden Y, Smeyers-Verbeke J (2007) Set-up and evaluation of interlaboratory studies. Journal of Chromatography A 1158, 158-167.
| Crossref | Google Scholar |
Watkins P, Stockham K, Stewart S, Gardner G (2021) Contemporary chemical lean determination used in the Australian meat processing industry: a method comparison. Meat Science 171, 108289.
| Crossref | Google Scholar |