
K’gari (Fraser Island) World Heritage Area: evaluating change in plant species richness and composition over two decades
Michael R. Ngugi A * , Victor J. Neldner A , Rhonda Melzer B , Linda Behrendorff C and William G. Dodt A
A Queensland Herbarium and Biodiversity Science, Department of Environment & Science, Mount Coot-tha Road, Toowong, Qld 4006, Australia.
B Queensland Parks and Wildlife Service & Partnerships, Department of Environment & Science, Rockhampton, Qld 4701, Australia.
C Queensland Parks and Wildlife Service & Partnerships, Department of Environment & Science, K’gari (Fraser Island), Qld 4581, Australia.
Abstract
K’gari (Fraser Island) World Heritage Area in eastern Queensland is the largest sand island in the world and is characterised by a diversity of landscapes, ecosystem types and cultural values. The biodiversity values are threatened by degradation associated with increasing visitor numbers, inappropriate fire regimes, invasive plants and animals, and climate change.
This study investigated changes in vegetation community attributes (species richness and composition) monitored for over two decades.
Twenty-two long-term vegetation monitoring sites established in 1995 were resurveyed in 2021 and analysed.
The sites experienced between one to five fire events in the period from 1994 to 2020. Species richness and the overall differences within regional ecosystems through time were not statistically significant at P ≤ 0.05. A comparison between observed species in the 2021 survey against a list of expected species within each regional ecosystem showed no statistically significant difference (t7 = 0.649, P = 0.268). Recently burnt sites showed the greatest degree of dissimilarity. Six invasive plant species that are known environmental weeds were recorded.
Our research suggests that most vegetation communities in K’gari are adversely affected by widespread, severe bushfire but are resilient; except for Casuarina equisetifolia subsp. incana communities on exposed frontal areas and dry peat swamps.
Targeted planned burning is a key management tool that aims to achieve fire regimes appropriate to the ecosystems and to mitigate risk of severe bushfires. Hence, timely implementation of the existing planned burn guidelines for the south-east Queensland Bioregion is imperative.
Keywords: biodiversity, bushfire, invasive species, long-term monitoring, planned burn, regional ecosystems, species diversity, wildfire, World Heritage Area.
Introduction
Natural World Heritage listed conservation sites contain some of the Earth’s most valuable natural assets of outstanding universal value (UNESCO 2022a). However, in the context of evolving threats associated with human activity, the challenge of ensuring that natural areas sustain their outstanding universal value in the protection and conservation of biodiversity is an increasingly difficult one. K’gari (formerly known as Fraser Island), in the subtropical eastern coast of Australia, is an area of outstanding universal value and was inscribed on the World Heritage Area (WHA) List in 1992 (UNESCO 1992). At 122 km long and 181 851 ha, K’gari is the largest sand island in the world (UNESCO 1992). It features a diversity of ecosystem types and cultural values and is an outstanding example of ongoing biological, hydrological and geomorphological processes (UNESCO 1992; Walker et al. 2022). During the 2020 World Heritage Conservation Outlook Assessment (IUCN 2020), K’gari was rated as ‘Good with some concern’ but its vulnerability to threats was rated as ‘High’. The major threats to conservation values in K’gari include predicted climate change, unsuitable fire regimes, increased tourism and associated impacts including pollution, erosion and siltation, disturbance, and the introduction of invasive species (IUCN 2020; UNESCO 2022b). These threats are consistent with a recent review of the ecological and cultural environmental values of K’gari, which suggested that K’gari is a contested space between tourist visitation and associated environmental impacts (Walker et al. 2022).
Since European settlement, human impacts on K’gari ecosystems have been significant (FIDO 2022). Cutting of Kauri pine (Agathis robusta) and white beech (Gmelina leichhardtii) started in 1863, followed by blackbutt (Eucalyptus pilularis) and satinay (Syncarpia hillii) and subsequent clearing of some native vegetation for establishment of plantations (FIDO 2022). Sand mining on the island also started in 1971 and involved clearing of vegetation in strips. It resulted in less than 1000 ha affected before the industry was closed. However, timber harvesting continued until 1991. K’gari was listed as a World Heritage Area in 1992 (Walker et al. 2022).
Vegetation associations occurring on K’gari display an unusual level of complexity, with major changes in floristic and structural composition occurring over very short distances (IUCN 2020; Neldner et al. 2021). The vegetation comprises over 830 vascular plants and 57 pteridophytes. Together these cover 407 genera in 173 families, which are found in 16 broad vegetation groups (Applegate 2020; Neldner et al. 2021). These vegetation complexes reflect the long successional processes of sand-dune development and are characterised by abrupt transitions from younger coastal dune systems supporting rainforest and wet sclerophyll vegetation communities, with trees up to 50 m tall, to dry sclerophyll vegetation such as heathlands on older dunes (Walker et al. 1981, 2022; Applegate 2020; Neldner et al. 2021). Vegetation associations on K’gari also depict specialised adaptations to low fertility, fire, waterlogging and aridity (IUCN 1992). However, some of these ecosystems are currently at threat from inappropriate fire regimes and visitation pressures from human activity such as increased erosion and soil compaction linked to significant vehicle activity and overuse of some sites, and risk of incursion of weed species (Walker et al. 2022).
Significant human and financial resources have been directed towards the management of these threats including regulation of visitation, pest control, planned burning and bushfire response, as well as the protection and monitoring of biodiversity in K’gari (Hockings and Hobson 2000; Environmental Protection Agency 2005; Behrendorff et al. 2019; Neldner and Ngugi 2021). Among these initiatives is a long-term vegetation assessment program consisting of 56 permanently marked biodiversity monitoring sites that were set up by the University of Queensland (UQ) and Queensland Parks and Wildlife Service (QPWS) in 1995 (Hockings and Hobson 2000) and re-measured annually, with some sites re-measured until 2003. This time series dataset provides an opportunity to investigate the cumulative impacts of drivers such as bushfire.
Fire is an important factor influencing vegetation community structure and composition in Australia. Between 1992 and 2020 there were 13 bushfires reported on K’gari occurring in the surveyed areas and with different causes (QPWS 2021). Most vegetation communities on K’gari are highly fire-adapted, having a range of survival and regenerative mechanisms including epicormic shoots and basal resprouts (Meiklejohn et al. 2021; Neldner and Ngugi 2021). Some, however, are fire sensitive including the foredune communities of Casuarina equisetifolia subsp. incana (State of Queensland (DES) 2022). These are killed by fire and show very poor regenerative capacity post-fire (Neldner and Ngugi 2021). Although this highlights the importance of managing bushfires and implementing appropriate fire regimes to maintain the integrity of the World Heritage values (Environmental Protection Agency 2005; Neldner and Ngugi 2021; State of Queensland (DES) 2022; UNESCO 2022b), it also raises the question of how these bushfire events have been affecting the vegetation communities.
In this study, we examine change in plant communities on K’gari World Heritage Area over two decades. The specific objectives were to determine: (1) whether any changes in plant species richness (number of species) and/or species composition had occurred at the regional ecosystem level over the monitoring period; and (2) the extent of infestation of invasive non-native plant species (weeds) over the monitoring period. Data from 22 permanently marked biodiversity monitoring sites established in 1995 were used in the study.
Materials and methods
Study area
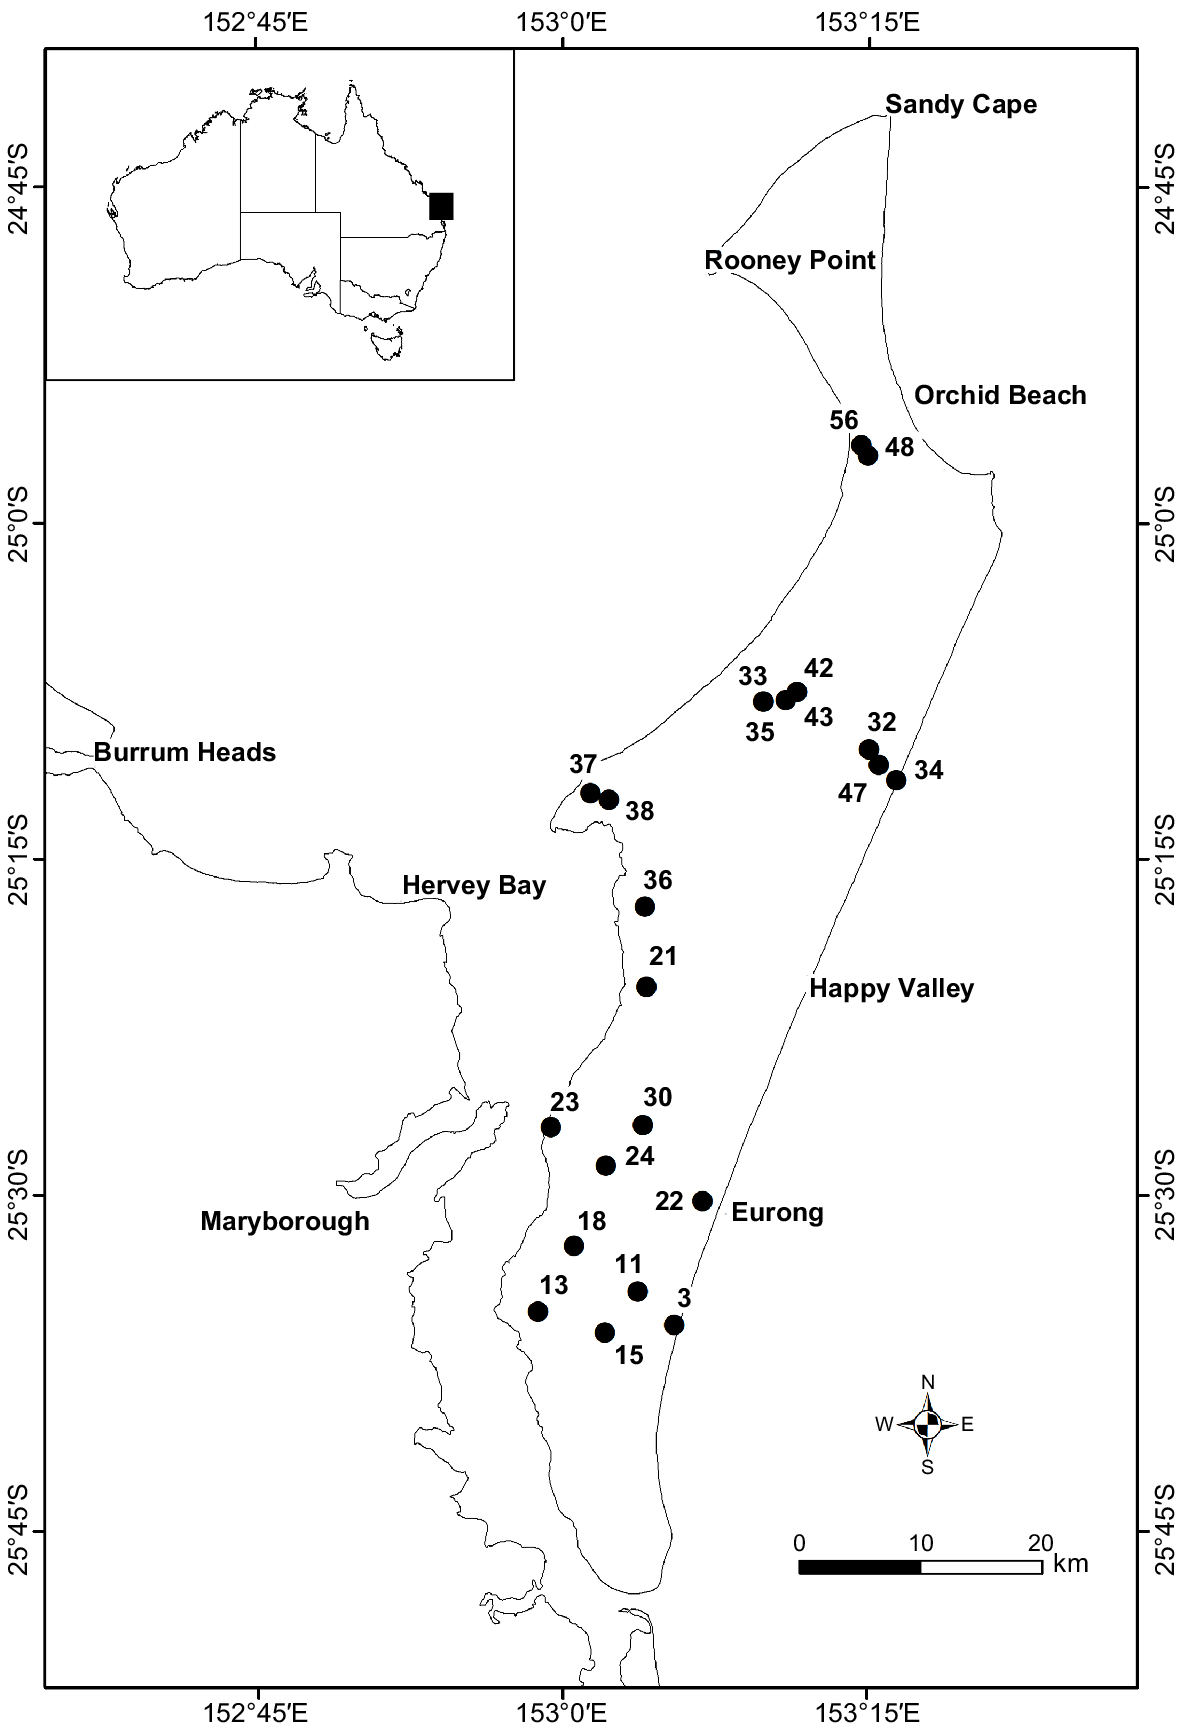
K’gari (Fraser Island) lies off the south-east coast of Queensland, Australia between latitude −24.6976° and −25.7982°, and longitude 152.9369° and 153.3546° (Fig. 1). The First Nations People, the Butchulla, have had a long and continuous connection with K’gari island and the surrounding waters (FIDO 2015; IUCN 2020; Walker et al. 2022). The climate for the region is characterised by warm humid summers and mild dry winters. The annual rainfall ranges from 879 mm to 2484 mm, with a mean of 1551 mm. Temperatures range from a mean minimum temperature of 13.0°C to a mean maximum temperature of 28.7°C (SILO climate 2022).
Vegetation types
The native vegetation of K’gari is mapped into regional ecosystems (RE). These are vegetation communities that are consistently associated with a particular combination of geology, landform and soil type (Sattler and Williams 1999). The regional ecosystems in the surveyed sites were on quaternary coastal sand deposits (sand dunes) in Land Zone 2 (Queensland Herbarium 2021a). Nine regional ecosystems were variously represented in the monitoring plots described in this study and are presented in Table 1.
| Regional ecosystem | Site ID | Monitoring year | Mean | |||
|---|---|---|---|---|---|---|
| 1997 | 1999 | 2021 | ||||
| 12.2.5 Corymbia intermedia ± Lophostemon confertus ± Banksia spp. ± Callitris columellaris open forest on beach ridges usually in southern half of bioregion | 38 | 22 | 26 | 33 | 27 | |
| 12.2.6 Eucalyptus racemosa subsp. racemosa open forest on dunes and sand plains. Usually deeply leached soils | 11 | 33 | 37 | 28 | 33 | |
| 22 | 27 | 24 | 23 | 23 | ||
| 24 | 36 | 36 | 31 | 34 | ||
| 33 | 25 | 22 | 18 | 22 | ||
| 36 | 27 | 25 | 23 | 25 | ||
| 42 | 27 | 24 | 18 | 23 | ||
| 43 | 35 | 35 | 20 | 30 | ||
| 47 | 21 | 22 | 23 | 22 | ||
| 12.2.7 Melaleuca quinquenervia or rarely M. dealbata open forest on sand plains | 23 | 27 | 25 | 30 | 27 | |
| 12.2.9 Eucalyptus pilularis open forest on parabolic high dunes | 18 | 25 | 22 | 24 | 24 | |
| 30 | 28 | 28 | 30 | 29 | ||
| 32 | 33 | 32 | 26 | 30 | ||
| 12.2.9 Banksia aemula low open woodland on dunes and sand plains. Usually deeply leached soils | 15 | 42 | 32 | 32 | 32 | |
| 12.2.11 Corymbia tessellaris ± Eucalyptus tereticornis, C. intermedia and Livistona decora woodland on beach ridges in northern half of bioregion | 13 | 38 | 35 | 40 | 38 | |
| 37 | 17 | 18 | 21 | 19 | ||
| 48 | 26 | 26 | 29 | 25 | ||
| 12.2.14 Foredune complex comprising Corymbia tessellaris, C. intermedia with Acacia leiocalyx, A. disparrima low open forest | 3 | 32 | 25 | 27 | 28 | |
| 12.2.14a Casuarina equisetifolia subsp. incana woodland to low open forest on exposed frontal areas | 34 | 26 | 24 | 18 | 23 | |
| 12.2.15g Swamps dominated by Empodisma minus, Gahnia sieberiana, other sedges and forbs and shrubs such as Leptospermum liversidgei | 21 | 13 | 14 | 22 | 16 | |
| 35 | 8 | 9 | 11 | 9 | ||
| 56 | 14 | 12 | 11 | 12 | ||
Long-term vegetation monitoring plots
Fifty-six long-term vegetation monitoring sites were established in 1995. They were distributed across the island to achieve a representative sampling of vegetation types and fire management regimes (Hockings and Hobson 2000). These square or rectangular plots varied in size and according to the site, and ranged from 25 m2 to 400 m2 in increments of 25 m2. The start point of each plot was marked with a star picket and an alignment star picket was placed at 5 m from the starting picket. This second picket also provided a reference for photographic monitoring (Hockings and Hobson 2000). The geo-location of each of the 56 sites was recorded using the global positioning system (GPS), but because of the relatively low accuracy of the system in the 1990s, plots were also marked with a white painted wooden marker peg inscribed with the plot number. The peg was placed at the edge of the nearest accessible forest trail at the closest point to the star picket that marked the start of each plot.
Species–area curves for each site were calculated and plot sizes selected to contain at least 90% of the total estimated number of species present (Hockings and Hobson 2000). Plots were resurveyed between August and November in 1996, 1997, 1999 and in some cases 2001 and 2003 when flowering aided species identification. Measurements involved collection of data on species composition, relative abundance based on Braun-Blanquet cover classes, and vegetation structure. The outer crown envelope of shrubs and trees (equivalent to canopy cover) was estimated using the Braun-Blanquet cover abundance ranking scale (Wikum and Shanholtzer 1978). The scale ranges from + (sparse and covering a small area) to 5 (covering more than 75% of the area). Species that could not be positively identified in the field were collected and specimens sent to the Queensland Herbarium for identification. Data that were collected pre-1997, when a field herbarium for K’gari specimens was not yet complete, had incomplete species lists and were not used for the analyses in this paper.
Resampling of sites, 2021
In May 2021, 22 of the 56 long-term vegetation monitoring sites were found and resurveyed to assess the vegetation condition. Unfortunately, by 2021 some of the wooden markers had been burnt by fire and some of the access tracks were overgrown and inaccessible by vehicle making it difficult to find plots and plot markers. When a start picket and the alignment picket of the historical plot were found, a 50 m tape was run along the diagonal direction of the plot and floristic assessment undertaken within 5 m from the centre tape on both sides. The sites were measured using BioCondition and standard vegetation survey methodologies (Eyre et al. 2015; Neldner et al. 2022). The BioCondition assessment framework for Queensland provides a measure of how well a terrestrial ecosystem is functioning as defined by a set of biodiversity values. It is a site-based, quantitative (using 10 structural and floristic attributes and three landscape attributes) and repeatable assessment procedure that can be used in any vegetative state. It provides a numerical score of the biodiversity condition by comparing the assessment site to a reference benchmark of the same vegetation type. At each site, vegetation was stratified into height layers, and canopy cover, stem density and diameter of tree species in each height layer were recorded. The crown cover of trees and shrubs was measured using the line-intercept method (Greig-Smith 1964) along the 50 m tape. A clinometer was used to ensure that the crown intercepts were vertically projected. The total length of crown was doubled to give an estimate of percentage crown cover. For ground layer species, projective foliage cover was estimated in each of five 1 m2 quadrats and averaged. The plots were permanently marked with steel star pickets at the start and end of the line transect for future monitoring.
Fire history
Data on historical fire events at each site were obtained from the Queensland Parks and Wildlife Service fire database (FLAME) (QPWS 2021) and are presented in Supplementary Table S1. The fire events include planned burns and bushfires. Planned burns are a controlled application of fire under specified environmental conditions to a predetermined area and at the time, intensity and rate of spread required to attain planned resource management objectives (Australian Fire and Emergency Services Authorities Council 2015). Hence a planned burn is characterised by low risk and low intensity. In contrast, bushfires are unplanned vegetation fires. Since 1992, the 13 bushfires reported on K’gari originated mainly from lightning strikes and human activity (FIDO 2014; QPWS 2021). Most sites in this study experienced between one to five fire events (planned burn and bushfire) between 1994 and 2020. The exception was site 24, which had not been burnt for 32 years (Table S1). The 2020 fire started from an illegal campfire in a remote area and impacted 75 110 ha (or 46%) of the K’gari section of Great Sandy National Park (Meiklejohn et al. 2021).
Data analysis
Data from the 22 sites revisited in 2021 were compared to the historical data collected pre-2003 to examine differences in species richness and species composition at regional ecosystem level. Changes in species richness were explored using graphical plots and those of species composition were examined using several diversity indices. Significant changes in species richness between measured dates were tested for statistical significance using a paired t-test at P ≤ 0.05. Mean species richness observed in each regional ecosystem in 2021 was also compared to the expected list of species contained in the regional ecosystem, also referred to as the technical description of that regional ecosystem (Queensland Herbarium 2022). Technical descriptions of the normal range in structure and floristic composition of remnant regional ecosystems and their component vegetation communities, derived from data covering the full spatial distribution of the RE, were used to obtain a list of expected species for each regional ecosystem.
Changes in species composition were investigated using data collected in 1999 and 2021. The 1997 dataset was not used for composition assessment because of some illegible handwritten cover records. The Jaccard similarity index was used to measure similarity between the two sets of data and to compare which species were shared and which were distinct (Stephanie 2022). The results of this test were then expressed on a percent scale:
where: J is the Jaccard index, X and Y are species richness of the two data sets, |X ∩ Y| is the number of species occurring in both sets and |X ∪ Y| total number of all the species recorded in both sets.
The Bray–Curtis dissimilarity index was used to quantify the differences in species composition between the two survey times using species cover data as measures of species abundance. The index is expressed as a percentage and calculated with the following formula (Gardener 2017):
where: BC is Bray–Curtis dissimilarity index, S1 and S2 are the two measure dates (S1 = 1999 and S2 = 2021), S1i is the cover of species i in set S1, S2i is the cover of the same species in set S2, abs(S1i − S2i) is the absolute value of the difference between S1i and S2i.
Species crown cover data collected pre-2003 using the Braun-Blanquet cover class were converted to a midpoint value for each class range and used as the estimated cover for each species (Matteodo et al. 2016). These cover estimates were compared with cover data collected in 2021 using Queensland Herbarium methodology (Neldner et al. 2022).
Differences in species composition within and among RE that had at least three monitoring sites resurveyed were compared using analysis of variance (ANOVA) in Microsoft Excel Data Analysis Toolpak. The Queensland Herbarium specimen database (HERBRECS) (Queensland Herbarium 2021b) was utilised to determine which of the species recorded at each site was native or non-native.
Results
Fire history
Fire history records for each of the 22 resurveyed sites showed that all but one site had experienced at least one fire event between 1994 and 2020 (26 years) but 83% of the sites had more than one bushfire. The inter-fire interval for these sites (n = 16) was approximately 13 years (Table S1).
Species richness between 1997 and 2021
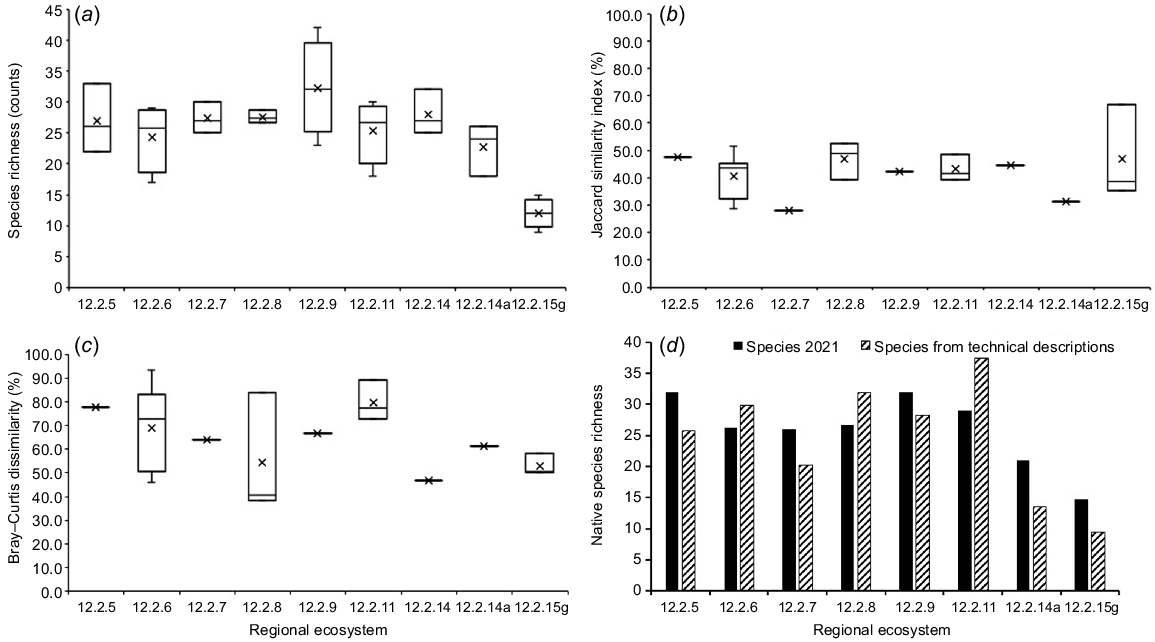
The distribution of species richness values among sites sampled within each RE, and among all the sampled REs, is presented using a boxplot in Fig. 2a. The highest species richness was recorded in RE 12.2.9 (Banksia aemula low open woodland), ranging from 23 to 42 species and a mean of 32 species (Table 1). Generally, there was greater variability in the number of species observed during surveys within each RE than between regional ecosystems, except for RE 12.2.15g (Fig. 2a). The median richness for most of the monitored REs was similar and ranged from 24 to 28 species. The lowest species richness (nine species) was recorded in RE 12.2.15g, which was characterised as closed sedgeland.
Plant species richness and composition for nine vegetation communities monitored over time in K’gari (Fraser Island) World Heritage Area. (a) boxplot of species richness. (b) boxplot of Jaccard similarity indices. (c) boxplot of Bray–Curtis dissimilarity indices comparing species composition in sites measured in 1999 and 2021. (d) is a comparison between native species richness derived from sites sampled in 2021 (black) and from technical descriptions of each regional ecosystem (hatched). Error bars show minimum and maximum values, X is the mean, and the middle bar is the median of richness values.
The results of the analysis of variance of species richness among all the REs showed highly significant differences (P < 0.001) but within each of the four regional ecosystems that had more than three sites, the differences were not statistically significant (Table S2). A paired samples t-test performed to compare species richness for all sites observed in 1999 and 2021, showed no significant difference in species richness between the two survey dates (t21 = 0.575, P = 0.286). Similar comparisons of species richness done among sites that were burnt and unburnt in 2021 against the 1999 observations showed no statistically significant differences among the burnt sites (t11 = 1.182, P = 0.131), nor among the unburnt sites (t9 = −0.569, P = 0.292).
Assessment of species composition using the Jaccard similarity index
Species composition similarity indices calculated using Jaccard’s method are presented in Fig. 2b using a boxplot to compare the variability within and among regional ecosystems. Similarity was highly variable among all the sites and ranged from 27.9 to 66.7% with a mean of 42.2% (Table 2). On average, 29% of species recorded in the 1999 surveys were not recorded in the 2021 surveys, and 28% of species recorded in the 2021 surveys were not recorded in the 1999 surveys. However, on average, 42% of the species were commonly recorded in the 1999 and 2021 surveys (Table 2).
| Regional Ecosystem (RE) | Site ID | Jaccard index (%) | Bray–Curtis Index (%) | Species found only in 1999 | Species found only in 2021 | Species found in 1999 and 2021 | 2020 fire status | Years since last fire | |
|---|---|---|---|---|---|---|---|---|---|
| 12.2.5 | 38 | 47.5 | 77.6 | 7 | 14 | 19 | Burnt | 1 | |
| 12.2.6 | 11 | 44.4 | 47.8 | 17 | 8 | 20 | Unburnt | 13 | |
| 22 | 51.6 | 58.3 | 8 | 7 | 16 | Unburnt | 4 | ||
| 24 | 36.7 | 46.0 | 18 | 13 | 18 | Unburnt | 32 | ||
| 33 | 42.9 | 74.2 | 10 | 6 | 12 | Burnt | 1 | ||
| 36 | 45.5 | 75.3 | 10 | 8 | 15 | Burnt | 1 | ||
| 42 | 44.8 | 71.6 | 11 | 5 | 13 | Burnt | 1 | ||
| 43 | 31.0 | 93.5 | 22 | 7 | 13 | Burnt | 1 | ||
| 47 | 28.6 | 85.5 | 12 | 13 | 10 | Burnt | 1 | ||
| 12.2.7 | 23 | 27.9 | 63.8 | 13 | 18 | 12 | Unburnt | 4 | |
| 12.2.8 | 18 | 39.4 | 83.9 | 9 | 11 | 13 | Unburnt | 2 | |
| 30 | 52.6 | 38.3 | 8 | 10 | 20 | Unburnt | 10 | ||
| 32 | 48.7 | 40.4 | 13 | 7 | 19 | Burnt | 1 | ||
| 12.2.9 | 15 | 42.2 | 66.4 | 13 | 13 | 19 | Unburnt | 5 | |
| 12.2.11 | 13 | 41.5 | 72.7 | 13 | 18 | 22 | Unburnt | 2 | |
| 37 | 39.3 | 77.2 | 7 | 10 | 11 | Burnt | 1 | ||
| 48 | 48.6 | 89.1 | 8 | 11 | 18 | Burnt | 1 | ||
| 12.2.14 | 3 | 44.4 | 46.9 | 9 | 11 | 16 | Unburnt | 25 | |
| 12.2.14a | 34 | 31.3 | 61.1 | 14 | 8 | 10 | Burnt | 1 | |
| 12.2.15g | 21 | 38.5 | 58.1 | 4 | 12 | 10 | Unburnt | 1 | |
| 35 | 66.7 | 50.7 | 1 | 3 | 8 | Burnt | 1 | ||
| 56 | 35.3 | 50.0 | 6 | 5 | 6 | Burnt | 1 |
The greatest variability in the Jaccard similarity index was in RE 12.2.6 (Eucalyptus racemosa open forest) (9.5–51.6%) and in RE 12.2.15g (closed sedgeland) (Fig. 2b). When the Jaccard indices obtained for the four regional ecosystems that had at least three monitoring sites (RE 12.2.11, RE 12.2.15g, RE 12.2.6 and RE 12.2.8) were analysed using ANOVA, the differences in average indices among these regional ecosystems were not statistically different (F3,14 = 0.7919, P = 0.5184). Furthermore, when the sites were segregated into burnt and unburnt sites the differences in the similarity indices for the burnt and unburnt sites were not statistically different (F1,20 = 0.0208, P = 0.8867).
Bray–Curtis species composition change between 1999 and 2021
Species indices calculated using the Bray–Curtis method for each of the sites and within each regional ecosystem are summarised in Fig. 2c using a boxplot. The variability in the indices among all the surveyed sites ranged from 38.3 to 93.5% with a mean dissimilarity index of 65.9% (Table 2). When differences among the regional ecosystems that were sampled using at least three sites were compared using analysis of variance, the differences were not statistically significant (F3,15 = 1.009, P = 0.4162). However, there were statistically significant differences in species composition between the burnt and unburnt sites (F1,22 = 5.4055, P = 0.0297) with recently burnt sites showing greater dissimilarity.
Comparison between observed and expected species richness for regional ecosystems
A chart showing mean species richness of native species derived from sites sampled in 2021 compared with that from the technical descriptions (Table 3) is provided in Fig. 2d. A paired samples t-test performed to compare species richness between the 2021 measure and those from the technical description showed no statistical significance difference (t7 = 0.649, P = 0.268).
| Regional ecosystem | 2021 sampling | Technical description | |||||
|---|---|---|---|---|---|---|---|
| No. of sites | Mean species richness | No. of invasive species | No. of sites | Mean species richness | No. of invasive species | ||
| 12.2.5 | 1 | 33 | 1 | 18 | 25.8 | 7 | |
| 12.2.6 | 7 | 26.3 | 0 | 49 | 29.8 | 2 | |
| 12.2.7 | 1 | 30 | 4 | 46 | 20.3 | 7 | |
| 12.2.8 | 3 | 26.7 | 0 | 31 | 31.9 | 2 | |
| 12.2.9 | 1 | 32 | 0 | 26 | 28.2 | 1 | |
| 12.2.11 | 3 | 30 | 1 | 19 | 37.5 | 5 | |
| 12.2.14a | 2 | 22.5 | 2 | 22 | 13.5 | 12 | |
| 12.2.15g | 3 | 14.7 | 0 | 15 | 9.4 | 7 | |
Threat of invasive plant species
Visitation data for K’gari in the 2021 calendar year showed that QPWS issued 56 440 vehicle permits, 39 892 camping permits for 95 524 adults and 17 384 children (Queensland Government 2022), demonstrating high potential vulnerability to the spread of invasive species. The list of all recorded invasive plants in the surveyed sites is presented in Table 4. These were corky stem passionflower (Passiflora pallida, spread by birds and water), glossy nightshade (Solanum americanum, dispersed by birds, mammals, water, soil and machinery), summer grass (Digitaria ciliaris, dispersed by humans), common sowthistle (Sonchus oleraceus, spread by humans and animals) and lantana (Lantana camara, spread by humans, birds and mammals). Apart from fire, all the sites had negligible human disturbance in the last two decades. All the observed invasive species are recognised as environmental weeds in Queensland, but lantana (L. camara) is also listed as a Weed of National Significance in Australia. The invasive species were only recorded at five sites in 2021, and at three sites the invasive species cover was greater than 7%. These species and their recorded foliage cover were corky stem passionflower (P. pallida) – 9.4% cover in site 34 (RE 12.2.14a) and 7.3% cover in site 23 (RE 12.2.7), and L. camara – 38% cover in site 23.
| Regional ecosystem | Non- native species | Cover (%) | Pest status | |
|---|---|---|---|---|
| 12.2.5 Corymbia intermedia ± Lophostemon confertus ± Banksia spp. ± Callitris columellaris open forest on beach ridges usually in southern half of bioregion | Passiflora pallida (corky stem passionflower) | 0.1 | EW | |
| 12.2.7 Melaleuca quinquenervia or rarely M. dealbata open forest on sand plains | Passiflora pallida (corky stem passionflower) | 7.3 | EW | |
| Digitaria ciliaris (couch grass) | 1.6 | EW | ||
| Sonchus oleraceus (common sowthistle) | 0.1 | EW | ||
| Lantana camara (lantana) | 38 | WONS | ||
| 12.2.11 Corymbia tessellaris ± Eucalyptus tereticornis, C. intermedia and Livistona decora woodland on beach ridges in northern half of bioregion | Passiflora pallida (corky stem passionflower) | 0.2 | EW | |
| 12.2.14 Fore dune complex comprising Corymbia tessellaris, C. intermedia with Acacia leiocalyx, A. disparrima low open forest | Passiflora pallida (corky stem passionflower) | 0.4 | EW | |
| 12.2.14a Casuarina equisetifolia subsp. incana woodland to low open forest on exposed frontal areas | Passiflora pallida (corky stem passionflower) | 9.4 | EW | |
| Solanum americanum (glossy nightshade) | 0.1 | EW |
EW, environmental weed; WONS, Weed of National Significance.
Discussion
Understanding how threats, and the management actions used to mitigate them, affect species richness and composition over time is important for the management of World Heritage Areas. In the K’gari World Heritage Area, visitor impacts, inappropriate fire regimes including lack of fire, invasive plants and animals, and climate change are known key threats (UNESCO 2022b; Walker et al. 2022). In this study, two primary components of species diversity were investigated: (1) species richness and (2) species composition. These were examined using data collected over 24 years (between 1997 and 2021) within the K’gari World Heritage Area. Despite observed fluctuations in species richness during site revisits, the overall differences within regional ecosystems were not statistically significant. There were, however, significant differences in species richness among regional ecosystems, which is consistent with differences in species assemblages that characterise regional ecosystem communities. This finding provided support for the use of regional ecosystems as a stratification criterion when assessing changes in the vegetation communities (Sattler and Williams 1999).
Fire is a major ‘tool’ in the management of biodiversity values of K’gari WHA (State of Queensland (DES) 2022). Although fire regimes that are not appropriate to the ecosystems are recognised as a ‘High Threat’ to the conservation values of the heritage listed area (IUCN 2020), fire is a critical and natural component of the ecology of most ecosystems on K’gari (Queensland Herbarium 2021c; State of Queensland (DES) 2022). Plant species in most of these ecosystems are highly adapted to fire, having one or more reproductive and or vegetative traits that enable them to survive and regenerate. These include seed banks in the soil (e.g. Acacia spp.) or canopy (e.g. Banksia spp. but not Banksia integrifolia), resprouting from epicormic shoots (e.g. eucalypts, B. aemula, Melaleuca quinquenervia) or an unharmed apical bud (e.g. Livistona decora) or a lignotuber (e.g. B. aemula, Banksia robur; most eucalypts but not E. pilularis) or other subterranean organs such as rhizomes, tubers and bulbs (Meiklejohn et al. 2021; Neldner and Ngugi 2021; State of Queensland (DES) 2022). There are relatively few obligate seed regenerators in these ecosystems. The reproduction method and the extent of recovery is influenced by the intensity and timing of the fire. In contrast the C. equisetifolia subsp. incana communities on frontal dunes are not adapted to fire and the species is readily killed by fire and has no canopy or soil stored seed (Meiklejohn et al. 2021).
All the sites in this study had experienced planned burn and/or bushfire events within the timeframe of this study, with most of the sites having had at least one fire event. Widespread intense bushfires tend to have the greatest impact on biodiversity as reported in K’gari WHA (Meiklejohn et al. 2021; Neldner and Ngugi 2021), New South Wales (Deb et al. 2020) and Victoria (Lindenmayer and Taylor 2020) in the 2019–2020 fires. This impact is exacerbated when they become too frequent.
Forest and woodland bushfires in south-eastern Australia have been relatively infrequent in the past and characterised by bushfire return intervals of >20 years (Williams et al. 2012; Murphy et al. 2013; Lindenmayer and Taylor 2020; Canadell et al. 2021). On North Stradbroke Island (Minjerribah), south-eastern Queensland and prior to 1996, a bushfire return interval of 30 years was recorded, but between 1996 and 2014 two bushfires were recorded (Kington et al. 2016; Williams et al. 2020). In south-eastern Queensland forests, a single bushfire in dry sclerophyll eucalypt forest was recorded between 1946 and 1996, a bushfire return interval of 50 years (Lewis 2020). In this study, the average bushfire return interval in our plots (Table 3) since 1994 was estimated at 13 years. This suggests that bushfire occurrence in the last two decades is more frequent than broader averages reported in south-eastern Queensland in the past.
In Victoria, Australia, of the 1.5 million ha burned during the 2019–2020 fire season, 600 109 ha have burned twice, and 112 957 ha have burned three times over the past 25 years; indicating a recurrence that is far shorter than the expected natural interval for these forest types of 75–150 years (Lindenmayer and Taylor 2020). These results are consistent with the finding of Dutta et al. (2016) that the frequency of bushfire is increasing significantly, and the finding of Canadell et al. (2021) that the mean number of years since the last bushfire in Australia has been decreasing consecutively in each of the past four decades. Further, Canadell et al. (2021) found that the frequency of very large bushfires has markedly increased since 2000 and is correlated with anthropogenic climate change.
In the 2021 K’gari post-fire recovery study (Neldner and Ngugi 2021), the extent of negative effects was dependent on vegetation type and the severity of the fire at the site and appeared to be short lived. Much of the vegetation was recovering by vegetative resprouting across the whole plant, or from the base of the stem for those that had been severely burnt (Meiklejohn et al. 2021; Neldner and Ngugi 2021). The regenerative adaptations are likely to explain why there is no statistical difference between the species richness reported on sites within the same regional ecosystem that had several bushfires versus those with few or no bushfires, in the last 26 years.
The Jaccard similarity indices enabled more detailed examination of the species composition. Although the differences in the Jaccard similarity indices within and among regional ecosystems were not statistically significant, the values were generally low as shown by an average value of 42%. A detailed examination of the species data used for the Jaccard analysis revealed that there were large differences in the list of unique species recorded at the two different primary sampling occasions (1999 and 2021). About 28% of the species observed during the 1999 visit were not recorded in the 2021 visit and vice versa (Appendix 2 (Ngugi et al. 2022)), and annuals contributed less than 10% of the total species richness. Although misidentification of species may have contributed to the discrepancy, differences originating from bushfire exposure cannot be excluded as a possible cause for the differences in observed species – especially as 57% of the sites in this study were burnt in the 2020 bushfire. The sites burnt in 2020 were in different stages of ecosystem recovery depending on their fire severity and vegetation type. Some sites were characterised by massive germination of seedlings from the soil seedbank for species such as Acacia (Meiklejohn et al. 2021; Neldner and Ngugi 2021).
Species composition results obtained using Bray–Curtis dissimilarity indices indicated high dissimilarity between 1999 and 2021 (average 65.9%). This is partly because plant cover was used as a surrogate for species abundance for this study and vegetation cover was adversely affected by the fire severity of the 2020 fire event in K’gari WHA. Species differ from one another in their environmental tolerances, resource use, and interactions with other species, and hence their abundance has a major influence on ecosystem functioning and stability (Cleland 2011). In K’gari, the differences in species responses to fire were evident in the recovery of different regional ecosystems following the 2020 fires (Meiklejohn et al. 2021; Neldner and Ngugi 2021).
Species richness across the eight regional ecosystems sampled in 2021 on K’gari was very similar to the overall species richness recorded for a larger pool of sites upon which the regional ecosystem technical descriptions are based. Mean native species richness of 26 species observed in 2021 was also very similar to 25 species obtained from the technical description for the regional ecosystems (Queensland Herbarium 2022). These results suggested that species richness rebounded over time as sites recovered from fire events.
The use of historical monitoring data to assess vegetation change over time is not without its challenges. Firstly, the two monitoring programs used different plot sizes. The 1995 monitoring program used variable plot sizes ranging from 25 to 400 m2 (Hockings and Hobson 2000) which were considerably smaller than the 500 m2 standard plot used by the Queensland Herbarium in 2021. Despite the differences in plot size, the analysis of variance results comparing species richness data collected using the two methods did not show statistically significant differences. It is recommended that the Queensland Herbarium methodology be used for future monitoring.
Secondly, two different methodologies were used for estimating species cover: the Braun-Blanquet method that used cover class to estimate the cover of each species, and the Queensland Herbarium methodology that estimated the cover of each species to the nearest one percent. It is therefore likely that species cover estimates based on the conversion of Braun-Blanquet scale to a single value (Matteodo et al. 2016) may have underestimated or overestimated cover values, and hence contributed to the greater dissimilarity obtained between survey events. Thirdly, it is possible there were discrepancies in species identification between the two survey events. However, in both programs, where a species could not be positively identified in the field, specimens were collected and taken to the Queensland Herbarium for identification. In a few cases, in the absence of flowers or fruit, identification to species level was not possible.
Increased tourism in K’gari has been recognised as acting as a driver for the introduction of invasive species (IUCN 2020; Walker et al. 2022). This study recorded only six invasive plant species in the 22 sites sampled. Most of these invasive species are not widespread over K’gari except lantana and the corky stem passionflower, which is becoming widespread in human-use areas. A comprehensive survey of invasive flora was not conducted as part of this study, but the Queensland Herbarium database (HERBRECS) has specimens of 109 naturalised non-native (invasive) plant species that have been collected on K’gari (Queensland Herbarium 2021b). Hence the results are encouraging compared to those from other frequently visited Parks in the south-east Queensland region (Ngugi et al. 2014) and more remote areas such as protected areas of the Cape York Peninsula (Ngugi and Neldner 2017), which have much greater numbers of recorded invasive species. Once invasive species become widespread, their control can be very protracted. The successful removal of bitou bush (Chrysanthemoides monilifera subsp. rotundata) from K’gari required a 35-year period of collaborative annual surveys and control efforts (Behrendorff et al. 2019). Vigilance will always be required on K’gari because of the continuous potential source of new propagules associated with the dispersal capacity of birds and wind, the high volume of vehicles, campers and bushwalkers to the island and the residents and visitors of the permanent townships.
Conclusion
This study investigated changes in species richness and composition among vegetation communities on K’gari (Fraser Island) over two decades. In addition to the ongoing threats of climate change, increasing tourism is acting as a driver for several threats to the WHA, which include fire ignition, pollution, erosion, siltation, disturbance, and the introduction of invasive species (IUCN 2020). Widespread, frequent, and severe bushfire is also a threat to the conservation of biodiversity on the Island.
Vegetation changes were investigated using time series data from monitoring sites established in 1995 soon after the declaration of the World Heritage status of the island. Species richness and composition recorded from these monitoring sites were compared with data collected from the same sites in 2021. Although there were fluctuations in species richness within regional ecosystems over time, there were no statistically significant differences in species richness over the monitoring period. Species canopy cover was adversely affected by the 2021 fire events and resulted in statistically significant differences (P = 0.0298) between dissimilarity indices of burnt and unburnt sites, with recently burnt sites showing greater dissimilarity. There was a large discrepancy in the list of species that were observed in 1999 and those observed in 2021. Although the overall richness was similar, only 42% of the species were common between these survey events. The extent to which this difference in unique species was related to exposure to recent bushfires could not be ascertained. Hence the possible impacts of fires on the species that were recorded in 1999 but not recorded in 2021 and vice versa should be investigated. The results suggest that most vegetation communities on K’gari, although adversely affected by intense bushfire in the short-term, were resilient and demonstrated adaptations to survival and recovery. An exception was C. equisetifolia subsp. incana woodland to low open forest on exposed frontal areas, which were killed by fire and not regenerating. Targeted planned burning is a key management tool aimed to achieve fire regimes that are appropriate to the ecosystems and to mitigate risk of severe bushfires. We recommend continued implementation of the existing planned burn guidelines for the south-east Queensland Bioregion (State of Queensland (DES) 2022).
Acknowledgements
We thank K’gari rangers: Garry Usher, Barry Taylor, Sven Lavender, Russ Simkins and Megan Wilson for their assistance in the field assessments in 2021. The contribution of past and current staff from QPWS&P (Queensland Parks and Wildlife Service and Partnerships) and the University of Queensland, who participated in the establishment, maintenance and remeasure of the Hockings and Hobson monitoring sites in K’gari Island since 1995, are acknowledged. The contributions of Dale Richter in producing technical descriptions for the Regional Ecosystems and fire records in K’gari, and Jiaorong Li for GIS support and for producing maps are acknowledged with thanks. We acknowledge the Butchulla Traditional Custodians of the lands where these assessments were conducted. We also acknowledge with much thanks very helpful comments provided by three journal reviewers and the Associate Editor.
References
Behrendorff L, Harris SM, Muirhead IF (2019) Towards eradication: the history and management of Bitou Bush on K’gari-Fraser Island, Australia. Ecological Management & Restoration 20, 92-100.
| Crossref | Google Scholar |
Canadell JG, Meyer CP(Mick), Cook GD, Dowdy A, Briggs PR, Knauer J, Pepler A, Haverd V (2021) Multi-decadal increase of forest burned area in Australia is linked to climate change. Nature Communications 12, 6921.
| Crossref | Google Scholar |
Cleland EE (2011) Biodiversity and ecosystem stability. Nature Education Knowledge 3, 14.
| Google Scholar |
Deb P, Moradkhani H, Abbaszadeh P, Kiem AS, Engström J, Keellings D, Sharma A (2020) Causes of the widespread 2019–2020 Australian bushfire season. Earth’s Future 8, e2020EF001671.
| Crossref | Google Scholar |
Dutta R, Das A, Aryal J (2016) Big data integration shows Australian bush-fire frequency is increasing significantly. Royal Society Open Science 3, 150241.
| Crossref | Google Scholar |
Eyre TJ, Kelly AL, Neldner VJ, Wilson BA, Ferguson DJ, Laidlaw MJ, Franks AJ (2015) BioCondition assessment manual: a condition assessment framework for terrestrial biodiversity in Queensland assessment manual. Version 2.2. Queensland Herbarium, Department of Science, Information Technology, Innovation and Arts, Brisbane.
FIDO (2015) A history of aborigines of Fraser Island. Fraser Island Defenders Organisation. Available at https://fido.org.au/a-history-of-aborigines-of-fraser-island/
FIDO (2022) History of Fraser Island (K’gari). Fraser Island Defenders Organisation. Available at https://fido.org.au/about-fraser-island/history-of-fraser-island-kgari/
Gardener M (2017) ‘Statistics for ecologists using R and excel.’ (Pelagic publishing). Available at https://www.dataanalytics.org.uk/abundance-based-dissimilarity-metrics/
IUCN (1992) Fraser Island nomination. Available at https://whc.unesco.org/en/list/630/documents/
Lewis T (2020) Very frequent burning encourages tree growth in sub-tropical Australian eucalypt forest. Forest Ecology and Management 459, 117842.
| Crossref | Google Scholar |
Lindenmayer DB, Taylor C (2020) New spatial analyses of Australian wildfires highlight the need for new fire, resource, and conservation policies. Proceedings of the National Academy of Sciences of the United States of America 117, 12481-12485.
| Crossref | Google Scholar |
Matteodo M, Ammann K, Verrecchia EP, Vittoz P (2016) Snowbeds are more affected than other subalpine–alpine plant communities by climate change in the Swiss Alps. Ecology and Evolution 6, 6969-6982.
| Crossref | Google Scholar | PubMed |
Meiklejohn AM, Melzer RI, Hines HB, Laidlaw MJ, Toyne M, McPherson K, Behrendorff L, MacDonald S (2021) Post-fire assessment report – natural values: 2020 Duling bushfire, K’gari (Fraser Island), Great Sandy National Park, South East Queensland Bioregion. Department of Environment and Science, Queensland Government, Brisbane.
Murphy BP, Bradstock RA, Boer MM, Carter J, Cary GJ, Cochrane MA, Fensham RJ, Russell-Smith J, Williamson GJ, Bowman DMJS (2013) Fire regimes of Australia: a pyrogeographic model system. Journal of Biogeography 40, 1048-1058.
| Crossref | Google Scholar |
Neldner VJ, Wilson BA, Dillewaard HA, Ryan TS, Butler DW, McDonald WJF, Richter D, Addicott EP, Appelman CN (2022) Methodology for survey and mapping of regional ecosystems and vegetation communities in Queensland. Version 6.0. Queensland Herbarium, Queensland Department of Environment and Science, Brisbane.
Ngugi MR, Neldner VJ (2017) Assessing the invasion threat of non-native plant species in protected areas using Herbarium specimen and ecological survey data. A case study in two rangeland bioregions in Queensland. The Rangeland Journal 39, 85-95.
| Crossref | Google Scholar |
Ngugi MR, Neldner VJ, Dowling R (2014) Non-native plant species richness adjacent to a horse trail network in seven National Parks in southeast Queensland, Australia. Australasian Journal of Environmental Management 21, 413-428.
| Crossref | Google Scholar |
QPWS (2021) Fire history – Queensland Parks and Wildlife Service. Queensland spatial information. Available at https://www.data.qld.gov.au/dataset/fire-history-queensland-parks-and-wildlife-service/resource/658e1e88-e828-4868-9837-e3d2d5bc610a
Queensland Government (2022) Camping and vehicle permits. Available at https://www.data.qld.gov.au/dataset/camping-and-vehicle-permits
SILO climate (2022) SILO: Scientific Information for Landowners. Department of Environment and Science, Queensland government. Open data portal. Available at https://www.data.qld.gov.au/dataset/silo-climate-api
Stephanie G (2022) Bray Curtis Dissimilarity. StatisticsHowTo.com: elementary statistics for the rest of us. Available at https://www.statisticshowto.com/bray-curtis-dissimilarity/
UNESCO (1992) K’gari (Fraser Island). World Heritage Convention: Dossier:630. Available at https://whc.unesco.org/en/list/630/
UNESCO (2022a) K’gari (Fraser Island) Outstanding Universal Value. Available at https://whc.unesco.org/en/list/630/
UNESCO (2022b) Threatened paradise. Natural World Heritage: nature’s most precious gifts to humanity. Available at https://whc.unesco.org/en/natural-world-heritage/#threatened-paradise
Walker J, Thompson CH, Fergus IF, Tunstall BR (1981) Plant succession and soil development in coastal sand dunes of eastern Australia. In ‘Forest succession: concepts and application’. (Eds DC West, HH Shugart, DB Botkin) pp. 107–131. (Springer: New York, NT, USA) 10.1007/978-1-4612-5950-3_9
Walker KE, Baldwin C, Conroy GC, Applegate G, Archer-lean C, Arthington AH, Behrendorff L, Gilby BL, Hadwen W, Henderson CJ, Jacobsen C, Lamb D, Lieske SN, Ogbourne SM, Olds AD, Ota L, Ribbe J, Sargent S, Schaffer V, Schlacher TA, Stevens N, Srivastava SK, Weston MA, Ellison AM (2022) Ecological and cultural understanding as a basis for management of a globally significant island landscape. Coasts 2, 152-202.
| Crossref | Google Scholar |
Wikum DA, Shanholtzer GF (1978) Application of the Braun-Blanquet cover-abundance scale for vegetation analysis in land development studies. Environmental Management 2, 323-329.
| Crossref | Google Scholar |
Williams P, Kington D, Collins E (2020) Vegetation change over 50 years in eucalypt forest on north Stradbroke Island. The Proceedings of the Royal Society of Queensland 128, 49-58.
| Crossref | Google Scholar |