

Career profile and pattern of racing for Thoroughbred jumps-racing horses in New Zealand
M. J. Gibson A * , K. A. Legg A , E. K. Gee A , Y. Y. Chin A and C. W. Rogers A B
A
B
Abstract
Racing structure and focus for racehorses differs across jurisdictions and is poorly described. In New Zealand and Australia, jumps racing accounts for a small proportion of total Thoroughbred races each year, as opposed to the larger jumps-racing (National Hunt) industry with purpose-bred horses found in the UK and Ireland.
This study aimed to describe the career profile and pattern of racing for Thoroughbred jumps-racing horses in New Zealand.
Metrics from every horse with a full jumps-racing career (n = 1276, 89% geldings) between the 2005/06 and 2021/22 racing seasons (n = 40,302 starts) were examined. Descriptive statistics, box plots and heat maps were used to describe the data, by using horse age as a proxy for career progression.
Jumps-racing horses had a median of 17 flat starts (IQR 9–30) before their first jumps-racing start. The median career of a jumps-racing horse was 3.7 years (IQR 2.3–5.2) and 29 starts (IQR 16–44). Older horses had a decreasing number of flat-racing starts and an increasing proportion of steeplechase-racing starts. However, the majority of horses still had at least one flat-race start per calendar year, often prior to the first jumps race. Most horses had one spell each season (length 194 days, IQR 124–259), and a condensed preparation length over the winter months, with a median of 14 days (IQR 10–21) between starts.
The career pattern for jumps-racing horses in New Zealand reflects the industry retention of horses with a prior career in flat racing into a secondary jumps-racing career. Successful horses have increased focus on preparation for the winter jumps-racing season.
Jumps racing provides a secondary racing career for some flat-racing horses, particularly geldings. This strategy reduces wastage of horses from the industry.
Keywords: hurdle, jumps racing, periodicity, secondary career, steeplechase, sustainability, Thoroughbred racing, wastage.
Introduction
In New Zealand, the Thoroughbred racing industry is divided into flat racing and jumps racing. Jumps races are run over a longer distance than flat races and include obstacles, either hurdles or steeplechase jumps (Bolwell et al. 2014). The median race distance in New Zealand for a flat race is 1400 m (Bolwell et al. 2014), whereas the median race distance for a hurdle or steeplechase race is 3000 m and 4000 m respectively (Gibson et al. 2023b). Hurdle races have a minimum of eight removable padded fences that are 1.2 m high, whereas steeplechase races have a minimum of 10 permanent or removable timber and brush fences with a height of 1.2–1.5 m (NZTR 2019). Although the official Thoroughbred racing season is from 1 August to 31 July, the jumps-racing season runs during the wetter months of late autumn to early spring (April–September). These wetter months generally provide softer ground conditions, which are reported to be a reduced risk factor for horse falls and injuries (Legg et al. 2020; Gibson et al. 2022). Most races in New Zealand are handicap races (including maidens) where horses with a greater merit are assigned higher weights. Horses are assigned a rating for each race type they participate in, which is calculated on the basis of their performance in that race type and is recalculated within 2 days of their most recent start.
Jumps racing makes up 3% of all Thoroughbred racing starts in New Zealand (Legg et al. 2020), 0.3% of all racing starts in Australia (Flash et al. 2023) and 38% of all racing starts in Great Britain (Balendra et al. 2008). The difference in the proportion of jumps-racing starts reflects differences in the racing structure and focus between jurisdictions. In the southern hemisphere, jumps-racing horses are commonly recruited from a pool of flat-racing horses that are often too slow to be competitive to continue a flat-racing career. In contrast, jumps-racing horses in the northern hemisphere (i.e. Great Britain and Ireland) are typically bred specifically for the purpose of jumps racing (National Hunt) (Ruse et al. 2015).
Jumps racing typically has a higher risk of horse injury and fatality than has flat racing because of longer race distances and the inclusion of obstacles (Parkin et al. 2004b; Boden et al. 2006; Gibson et al. 2023b). Increasing race distance and the inclusion of obstacles in jumps racing increases the exposure time for injury and fatality, as well as the likelihood of fatigue-related accidents such as horse falls (Gibson et al. 2022; Legg et al. 2022).
In New Zealand, horses have to be a minimum of 3.5 years old to start in a hurdle race and 4 years old to start in a steeplechase race (NZTR 2023). Because of these minimum age requirements, jumps-racing horses are typically older than horses racing in flat races, which has been suggested as an additional risk factor for their higher injury and fatality rates (Bailey et al. 1998; Ruse et al. 2015; Hitchens et al. 2019; NZTR 2023). The limbs, and joints in the distal limb in particular, of New Zealand jumps-racing horses may have accumulated more load cycles and microdamage than those of jumps-racing horses in other jurisdictions as a result of having a previous flat-racing career prior to starting their jumps-racing career. However, the incidence of musculoskeletal injuries in New Zealand jumps racing is similar to that in other racing jurisdictions (Gibson et al. 2023b). A contributing factor to this may be the effect of early exercise in racehorses improving musculoskeletal adaptation to future loading, consequently reducing subsequent risk of musculoskeletal injury (Parkin et al. 2004a; Rogers et al. 2012). In other jurisdictions, horses that are bred for jumps racing are often brought into training at an older age, missing the essential developmental window to prime the musculoskeletal system for the future loading during racing (Ely et al. 2009).
There are differences in jurisdiction structure and focus of racing that determine the training, racing career profile and pattern. Subsequently, this can have an influence on the risks of falls and injury. Therefore, descriptive statistics to characterise the pattern of racing specific to New Zealand jumps racing can be valuable to industry management and horse welfare. Although Australia has a similar method for sourcing horses into jumps racing, direct comparisons are difficult, because of the restriction of jumps racing to only two states (Ruse et al. 2015). The population of Thoroughbreds partaking in both flat and jumps racing in the 2005–2011 New Zealand racing seasons has been previously described in Bolwell et al. (2014). However, the Bolwell et al. (2014) study was simply descriptive and did not describe the career of the jumps-racing horse or the pattern of jumps racing. Career profiles and the pattern of racing for jumps-racing horses is necessary to provide baseline data for future longitudinal studies examining the impact of the pattern of racing on injury risk. Therefore, the aim of this study was to describe the career profile and pattern of racing of Thoroughbreds participating in jumps racing in New Zealand.
Materials and methods
Data acquisition
Data for all flat and jumps-racing starts for the 2005/06–2021/22 racing seasons were obtained from New Zealand Thoroughbred Racing (NZTR, the official governing body for racing in New Zealand). These data contained the official race-start records, including horse name, age, race date, race type, flat and jumps rating.
Statistical analyses
A jumps-racing horse was defined as any horse that had at least one start in either a hurdle or steeplechase race during its racing career. All analyses were restricted to jump racing horses who had a complete racing career between the years 2005/06 and 2021/22. A complete race career was defined as any horse that did not have a race start in the 2005/06 and/or 2021/22 race seasons, indicating that their first and last races (complete career) were within the 2005/06 and 2021/22 racing periods. A hurdle career was defined as a horse career that had more than one or more starts in a hurdle race and no steeplechase starts. Horses with one or more steeplechase starts were defined as having a steeplechase career.
Normality of data was tested using an Anderson–Darling test. Descriptive statistics (median and interquartile range [IQR]) were used to describe the data at race and start level, with differences between race types examined using a Kruskal–Wallis test for non-parametric data.
The number of days between races and spell length were calculated for each horse by calculating the number of days between consecutive race dates. A racing preparation was defined as fewer than 60 days between two consecutive racing starts for a horse. If the interval between races for a horse was equal to or greater than 60 days, the horse was considered to have had a rest period from active training (‘spell’).
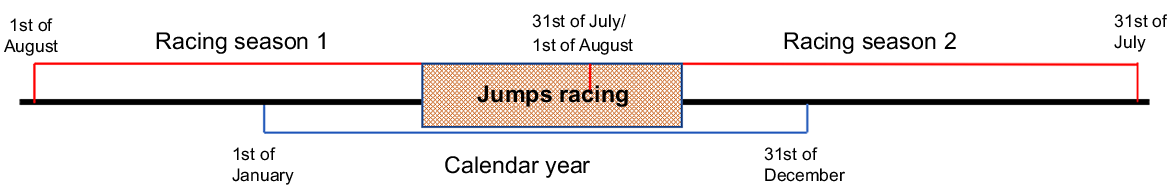
Data were examined by calendar year (and age of horse at the beginning of the calendar year), rather than racing season (Fig. 1). The New Zealand jumps-racing season (April–October) overlaps two consecutive racing seasons (1August−31 July). Therefore, by analysing the data using calendar year (1st of January−31st of December), an entire jumps-racing season was encapsulated. Conversely, spell length was calculated by racing season, as horses were unlikely to have a long spell during the short jumps-racing season.
Diagram showing the timing measures of ‘calendar year’ (blue line) and ‘racing season’ (red line), with the period of jumps racing being highlighted.
All statistical analyses were conducted using RStudio (version 3.5. 1, 2018; R Foundation for Statistical Computing, Vienna, Austria) with a level of significance set at P < 0.05.
Results
During the 2005/06–2021/22 race seasons, 1276 horses had a complete race career, including at least one jumps race. This cohort was made up of mainly geldings (n = 1120, 87.8%), followed by mares (n = 152, 11.9%) and stallions (n = 4, 3.1%). These horses had 40,302 race starts, of which 31,297 (78%) were flat races, 5644 (14%) were hurdle races and 3361 (8%) were steeplechase races. Geldings accounted for most (89%) of the racing starts (Table 1).
| Age (years) | Number of horses with a start at these ages | Total | Total number of starts | Total | |||||
|---|---|---|---|---|---|---|---|---|---|
| Colt/Stallion | Filly/Mare | Gelding | Colt/Stallion | Filly/Mare | Gelding | ||||
| 2 | 9 | 21 | 115 | 145 | 20 | 29 | 235 | 284 | |
| 3 | 9 | 74 | 630 | 713 | 39 | 399 | 3231 | 3669 | |
| 4 | 19 | 118 | 887 | 1024 | 121 | 873 | 6699 | 7693 | |
| 5 | 7 | 126 | 961 | 1094 | 29 | 1129 | 7911 | 9069 | |
| 6 | 4 | 120 | 844 | 968 | 32 | 858 | 6563 | 7453 | |
| 7 | 2 | 82 | 666 | 750 | 8 | 561 | 4756 | 5325 | |
| 8 | 1 | 58 | 478 | 537 | 6 | 312 | 3137 | 3455 | |
| 9 | 1 | 20 | 298 | 319 | 3 | 110 | 1773 | 1886 | |
| 10 | 0 | 9 | 178 | 187 | 0 | 46 | 835 | 881 | |
| 11 | 0 | 3 | 81 | 84 | 0 | 11 | 382 | 393 | |
| 12 | 0 | 2 | 32 | 34 | 0 | 6 | 127 | 133 | |
| 13 | 0 | 1 | 12 | 13 | 0 | 3 | 49 | 52 | |
| 14 | 0 | 0 | 3 | 3 | 0 | 0 | 9 | 9 | |
| Total | 52 | 634 | 5185 | 258 | 4337 | 35,707 | 40,302 | ||
Over half of jumps-racing horses were 2–3 years old at their first flat-race start (n = 715, 56.0%), followed by 4–5 years (n = 473, 37.1%) and 6+ years (88, 6.9%). Only 26 (2.1%) horses did not have a flat race as their first career start (17 hurdle and 9 steeplechase starts). Horses had a median of 17 [IQR 9–30] flat starts prior to their first career jumps start and a median flat rating of 58 [IQR 50–66] before their first jumps-racing start. Most (92%, 1155/1260) horses first start in a jumps race was in a hurdle race, with only a small number of horses (8%, 105/1260) starting their jumps-racing career with a steeplechase race. A hurdle-racing career was the most common jumps career, with 746/1276 (59%) horses competing only in flat and hurdle races and 530/1276 (41%) horses competing in at least one steeplechase start. Steeplechase horses that started their jumps career with a hurdle race competed in a median of four [IQR 2–7] hurdle starts before their first steeplechase start.
Horses started in their first hurdle and steeplechase races at an older age than horses starting in their first flat races (P < 0.05, Table 2). The total number of starts a horse had per calendar year was greater for hurdle-racing horses than horses racing in only flat races or steeplechase-racing horses (P < 0.05). Steeplechase-racing horses had the least number of flat starts in a calendar year.
| Item | Flat | Hurdle | Steeple | Total | |
|---|---|---|---|---|---|
| Age at first start (years) | 3 [2–4]a | 5 [5–6]b | 6 [5–7]c | – | |
| Age at last start (years) | 7 [5–8]a | 6 [5–8]b | 7 [6–9]c | – | |
| Age of starter (years) | 5 [4–6]a | 6 [7–8]b | 8 [6–9]c | – | |
| Number of starts per flat-racing calendar year | 6 [3–10] | – | – | 6 [3–10] | |
| Number of starts per hurdle-racing calendar year | 5 [3–7] | 2 [1–4] | – | 8 [5–10] | |
| Number of starts per steeplechase-racing calendar year | 2 [1–4] | 2 [1–4] | 3 [1–5] | 7 [5–9] |
Different letters in the same row indicate significant (P < 0.001) differences among the race types.
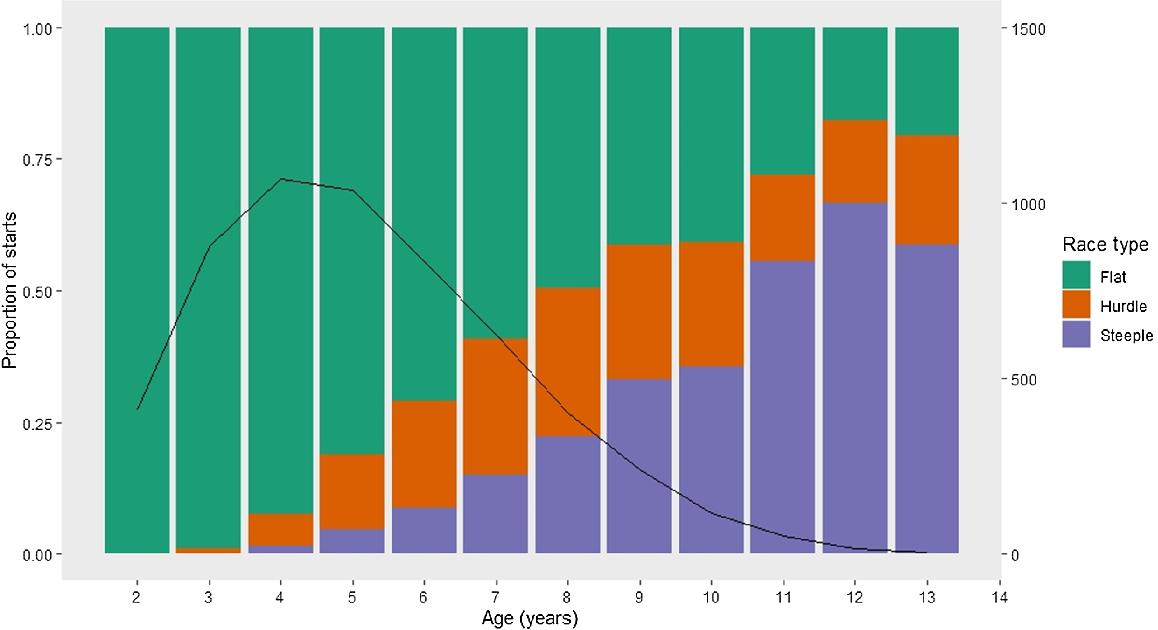
The median career length for a jumps-racing horse was 3.7 years (IQR 2.3–5.2) with a median of 29 [IQR 16–44] career starts. Horses participating in a hurdle career had a shorter career length (3.2 years, IQR 1.9–4.5, P < 0.05) than had horses participating in a steeplechase career (4.6 years, IQR 2.9–6.2). Seven horses (0.6%) had only one jumps-racing start in their career, and the maximum number of starts for one horse was 160 (12 years). As a horse age increased, the proportion of steeplechase-racing starts for that age group also increased, with a concurrent decrease in flat-racing starts (Fig. 2).
Proportion of flat-, hurdle- and steeplechase-race starts with respect to horse age (calculated by calendar year) for jumps-racing horses during the 2005/06–2021/22 Thoroughbred racing seasons in New Zealand. Line plot and secondary axis describe the numbers of horses racing.
Each year, jumps-racing horses had a median of one spell [IQR 1–1] with a median spell length of 194 days [124–259] between starts. Within a racing preparation, horses had a median of 14 days (IQR 10–21 days) between races. As horses aged, spell length increased (Table 3), with most of the racing starts occurring just prior to and during the jumps-racing season (Fig. 3). In all, 403 (32%) horses had a spell that was longer than 365 days, of which 46 had two spells longer than 365 days and eight had three spells longer than 365 days. The median spell length exceeding 365 days was 560 days [428–663]. The median age for a horse to have a spell for longer than 365 days was 5 years [IQR 4–6]. Jumps-racing horses participated in more flat races in April and May (the start of the jumps-racing season). The peak number (2475/5644, 43.9%) of hurdle-racing starts was in June and July, and steeplechase-racing starts (844/3361 starts, 25.1%) in August.
| Age (years) | Number of horses | Number of starts | Time between races (days) | Preparation length | Number of preparations | Number of spells | Spell length (days) | |
|---|---|---|---|---|---|---|---|---|
| 3 | 713 | 6 [3–9] | 15 [10–21] | 58 [34–100] | 1 [1–2] | 1 [1–2] | 146 [96–196] | |
| 4 | 1024 | 8 [5–11] | 15 [11–21] | 91 [47–140] | 1 [1–2] | 1 [1–1] | 162 [108–238] | |
| 5 | 1094 | 8 [5–11] | 15 [10–21] | 105 [59–155] | 1 [1–1] | 1 [1–1] | 182 [117–250] | |
| 6 | 968 | 8 [4–11] | 14 [10–21] | 105 [56–152] | 1 [1–1] | 1 [1–1] | 205 [141–266] | |
| 7 | 750 | 7 [4–10] | 14 [10–21] | 96 [50–139] | 1 [1–1] | 1 [1–1] | 216 [157–287] | |
| 8+ | 1177 | 6 [3–8] | 14 [10–21] | 89 [44–129] | 2 [1–3] | 2 [1–3] | 238 [194–315] |
Total number of flat-, hurdle- and steeplechase-racing starts per month for jumps-racing horses aged 3, 5, 7 and 9 years during the 2005/06–2021/22 Thoroughbred racing seasons in New Zealand.
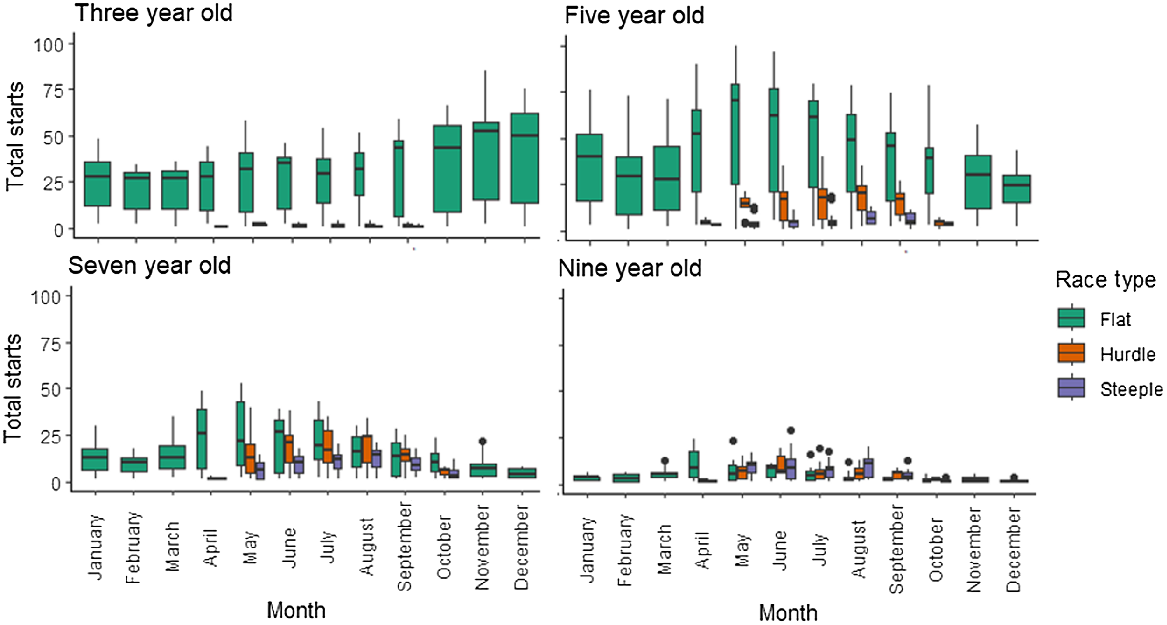
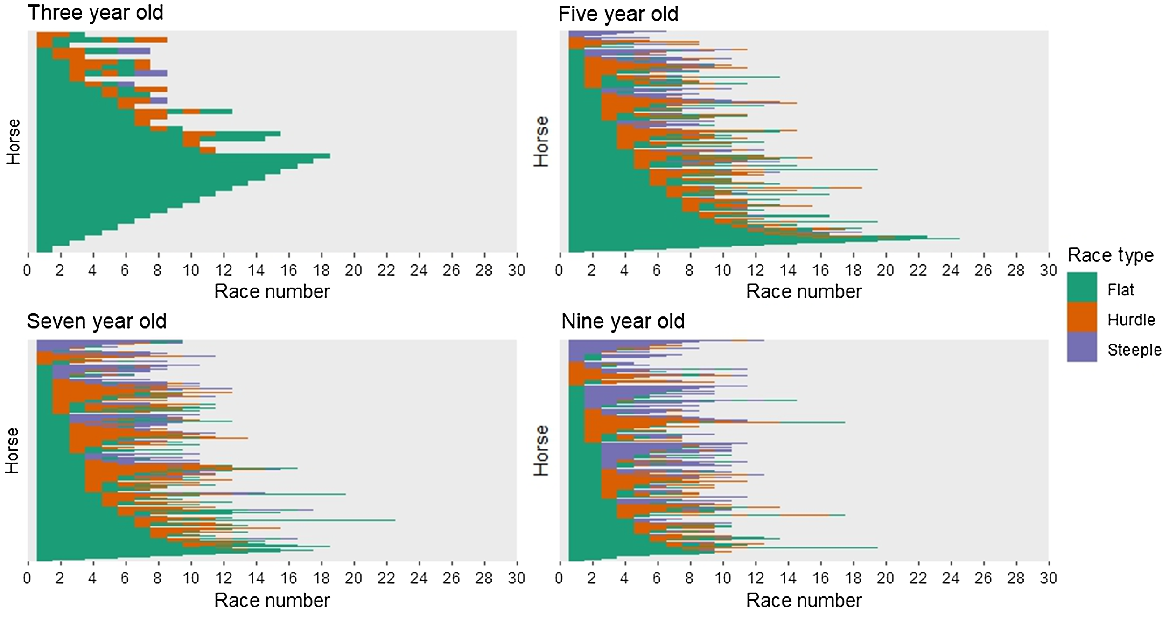
Three-year-old horses had few jumps-racing starts, but competed in flat races year-round (Fig. 3). Five-year-old horses also raced in flat races year-round, in addition to jumps races during the winter months. As horse age increased, the proportion of flat-racing starts decreased, and proportion of jumps-racing starts increased within a year (Figs 3, 4). Most jumps-racing horses competed in flat races at the start of their racing preparation, before switching to either hurdle or steeplechase races for the remainder of their preparation (Fig. 4). Horses typically did not alternate between hurdle and steeplechase races within a season but would often have flat starts between some jumps-race starts.
Discussion
This study has described the career profile and normal pattern of racing for Thoroughbred jumps-racing horses over 15 seasons in New Zealand. Jumps-racing horses were older, predominantly geldings and had more races in their career than did flat-racing horses in New Zealand (Tanner et al. 2013). This pattern is similar to overseas jurisdictions such as the UK and Australia where the median age for a horse starting in a jumps race is older than that in flat racing (~6–8 years old) (Pinchbeck et al. 2002; Reardon et al. 2013; Ruse et al. 2015; Flash et al. 2022). In addition, horses starting in hurdle races are typically 1 year younger than those in steeplechase races, likely to be due to most horses starting their jumps-racing careers in hurdle races and progressing onto steeplechase races (Pinchbeck et al. 2002; Reardon et al. 2013). However, over half (59%) of horses remained in hurdle racing, often because they were better suited to faster race speeds and lower obstacles.
The majority of jumps-racing horses in New Zealand began their jumps-racing careers at 5 years of age after initially racing as flat-racing horses. The proportion of flat racing undertaken by jumps-racing horses in the current study was much higher than that reported for the UK (Ely et al. 2010). This can be due to differences in racing and production focus between the jurisdictions. The primary breeding objective for the Thoroughbred racing industry in New Zealand is to produce flat-racing horses to supply the export market and for domestic racing. In contrast, the UK and Ireland have a higher proportion of National Hunt horses bred specifically for jumps racing (24.9% for Great Britain) (PriceWaterhouseCoopers 2018). As a result, only a small proportion of National Hunt horses compete in flat races (Reardon et al. 2013), and the total number of flat races that National Hunt horses participate in is considerably less (10% of starts) (Ely et al. 2010) than observed in New Zealand.
In the current study there was a strong bias towards geldings (rather than mares) in the jumps-racing population, in comparison to the more even distribution of sexes observed for flat racing in both New Zealand (50% geldings) and Australia (55% geldings) (Flash et al. 2023; Gibson et al. 2023a). Mares are more likely to be retired (Velie et al. 2013), and at a younger age than geldings owing to their residual value as a broodmare (Perkins et al. 2005; Shrestha et al. 2021; Chin et al. 2022). The typical age for a maiden mare at mating in New Zealand is 5.6 years old (Chin et al. 2022), similar to the median age at first jumps-racing start observed in the current study. In contrast, geldings have no residual breeding value and therefore have a greater chance of being retained within the racing population (Legg et al. 2021). This export focus for flat-racing horses means New Zealand breeders have no incentive to race mares in jumps racing, because this would not increase their economic worth as a broodmare. In contrast, National Hunt horses are specifically bred for jumps racing, this explains the larger proportion of mares within the jumps-racing population in the UK (22%) than in New Zealand (11.9%) (Allen et al. 2007).
Maiden racehorses (horses that have not yet won a race) have a flat-racing rating of 55 or lower. The median rating for horses entering jumps racing was 58, indicating a low performing or inexperienced horse. To prolong their career in the racing industry, geldings that fail to perform in flat racing, can be repurposed for jumps racing. This strategy provides another racing option for some horses within the industry and improves sustainability, in addition to potentially providing owners with another opportunity of recovering some of the costs involved in racehorse production (Bailey et al. 1998; Perkins et al. 2005). This further provides explanation to the strong bias towards geldings, which is unique to flat racing in New Zealand. The majority of horses at the completion of their flat-racing career do not enter jumps racing but are retrained for other equestrian disciplines (Crawford et al. 2021).
Wastage from the racing industry is a large welfare and sustainability concern worldwide, so the option of repurposing underperforming flat-racing horses that are potentially more suited for jumps racing is advantageous (Ruse et al. 2015; Rogers et al. 2023).
Three-year-old jumps-racing horses had a similar pattern of racing as did flat-racing horses, with very few horses starting their jumps-racing career in the autumn of their 3-year-old year. As horses aged, they had fewer flat races, with flat starts occuring in the autumn or winter season, as preparation for jumps racing. The lack of race starts by older horses in summer reflects the focus of these horses to race in the jumps races, and that many of these horses are not competitive racing against purely flat-racing horses. Where experienced jumps-racing horses had flat-racing starts, these were likely in high weight races (flat races restricted to jumps-racing horses), just prior to the start of the jumps-racing season in April/May. This also indicated that these flat races were part of the final stage of fitness preparation before competing in jumps races. Older jumps-racing horses are likely to be more experienced, and so generally require fewer flat starts at the beginning of the season to prepare them for jumps races, explaining fewer flat races with an increasing age.
Jumps-racing horses in New Zealand had one race preparation each calendar year, coinciding with the jumps-racing season. As horses aged, and increasingly specialised in their jumps-racing category, there was a concurrent increase in spell length. Jumps-racing horses generally have only one spell during spring/summer, where trainers tend to focus time and resources on younger flat-racing horses that race in higher-stakes races. The median spell length for a jumps-racing horse (194 days) was longer than that reported for flat-racing horses in New Zealand (161 days) (Legg et al. 2021). This reflects the relatively condensed length of the jumps-racing season during the winter months compared to flat racing (Ruse et al. 2015). A by-product only having one spell and a condensed jumps-racing season was that jumps horses had more races within one preparation with a shorter gap between races than similarly aged flat-racing horses (Legg et al. 2021). Given that horses that had a spell greater than 365 days were 5 years old, it is possible that longer spells are given to horses that were unsuccessful in flat racing, to allow them to mature and be eligible to start jumps racing.
Horses entering jumps racing traditionally begin with hurdle races, because these races are shorter, and have lower height jumps than do steeplechase races. The younger age at first start in hurdle versus steeplechase races may be due to the younger age of eligibility to start in hurdle races (minimum 3.5 years old vs 4 years old) (NZTR 2023), reflecting the industry common practice to start jumps horses in hurdles races and progress to steeplechase. This trend is consistently observed worldwide, as National Hunt horses in the UK also begin steeplechase races at an older age than they do hurdle races, despite the eligibility-age criteria being the same (4 years) (Reardon et al. 2013). As horses become more experienced in jumps racing, trainers will recognise those that favour a longer race distance and progress horses to specialise in steeplechase racing, whereas horses that favour a shorter distance can remain in hurdle racing. The proportion of starts of all horses in steeplechase races increased with age and is reflected in the older median starter age. The older age of steeplechase horses than of hurdle- and flat-race horses has been suggested to be a contributing factor to the higher incidence of injuries and fatalities in steeplechase races than hurdle and flat races overseas (Ely et al. 2010; Reardon et al. 2013). However, in New Zealand, there is little difference in the incidence of race day horse fatality between hurdle and steeplechase races, possibly reflecting jurisdictional differences in risk factors for fatality (Gibson et al. 2023b). Reasons for these jurisdictional differences in risk factors may be due to race-level factors such as field size, race distance, jump size and type as well as horse-level factors such as age and career profile.
The structure of racing data provided some limitations. It was not possible to identify jumps horses that raced overseas and returned to New Zealand. However, the export of New Zealand jumps horses is rare and thus unlikely to have affected reliability of this dataset. To identify first starts and end of racing career, the dataset was truncated to 2006/07–2020/21. Approximately 54 horses may have a start in the seasons that were truncated, comprising 4% of the total observations over 15 seasons. Therefore, it is expected that the inclusion of these horses would have minimal effect on the results presented.
Conclusions
The population structure and career pattern of jumps racing in New Zealand reflects the movement of less competitive flat-racing horses into a jump racing career. This process highlights the difference in New Zealand relative to other jurisdictions such as the UK and Ireland. New Zealand does not have a sector of the Thoroughbred breeding industry focusing specifically on breeding jumps-racing horses. Thus, New Zealand jumps-racing horses are more likely to have had flat-racing experience prior to a jumps-racing career. The short-condensed jumps-racing season (only offered during winter) is reflected in a longer spell between racing preparations and greater frequency of racing within a preparation than is observed with flat racing.
Jumps racing provides another racing career for some flat-racing horses, generally geldings. However, in contrast to some northern hemisphere racing jurisdictions, there are limited opportunities for jumps racing in New Zealand, with only 3% of all racing in New Zealand being associated with jumps racing.
Conflicts of interest
Chris Rogers is an Associate Editor of Animal Production Science. To mitigate this potential conflict of interest, they were blinded from the review process.
Declaration of funding
This research was funded by The New Zealand Equine Trust, Grant number ‘9/2017’.
References
Allen WR, Brown L, Wright M, Wilsher S (2007) Reproductive efficiency of Flatrace and National Hunt Thoroughbred mares and stallions in England. Equine Veterinary Journal 39, 438-445.
| Crossref | Google Scholar | PubMed |
Bailey CJ, Reid SW, Hodgson DR, Bourke JM, Rose RJ (1998) Flat, hurdle and steeple racing: risk factors for musculoskeletal injury. Equine Veterinary Journal 30, 498-503.
| Crossref | Google Scholar | PubMed |
Balendra G, Turner M, McCrory P (2008) Career-ending injuries to professional jockeys in British horse racing (1991–2005). British Journal of Sports Medicine 42, 22-24.
| Crossref | Google Scholar | PubMed |
Boden L, Anderson G, Charles J, Morgan K, Morton J, Parkin T, Slocombe R, Clarke A (2006) Risk of fatality and causes of death of Thoroughbred horses associated with racing in Victoria, Australia: 1989–2004. Equine Veterinary Journal 38, 312-318.
| Crossref | Google Scholar | PubMed |
Bolwell CF, Rogers CW, Gee EK, Rosanowski SM (2014) Descriptive statistics and the pattern of horse racing in New Zealand. 1. Thoroughbred racing. Animal Production Science 56, 77-81.
| Crossref | Google Scholar |
Chin YY, Rogers CW, Gee EK, Stafford KJ, Cameron EZ (2022) The pattern of breeding and management within the New Zealand Thoroughbred breeding industry 2005–2015. (II) The mare population. Animal Production Science 64, AN21534.
| Crossref | Google Scholar |
Crawford KL, Finnane A, Greer RM, Phillips CJ, Woldeyohannes SM, Perkins NR, Ahern BJ (2021) Appraising the welfare of Thoroughbred racehorses in training in Queensland, Australia: the incidence, risk factors and outcomes for horses after retirement from racing. Animals 11, 142.
| Crossref | Google Scholar | PubMed |
Ely ER, Avella CS, Price JS, Smith RKW, Wood JLN, Verheyen KLP (2009) Descriptive epidemiology of fracture, tendon and suspensory ligament injuries in National Hunt racehorses in training. Equine Veterinary Journal 41, 372-378.
| Crossref | Google Scholar | PubMed |
Ely ER, Price JS, Smith RK, Wood JLN, Verheyen KLP (2010) The effect of exercise regimens on racing performance in National Hunt racehorses. Equine Veterinary Journal 42, 624-629.
| Crossref | Google Scholar |
Flash ML, Crabb HK, Hitchens PL, Firestone SM, Stevenson MA, Gilkerson JR (2022) Factors associated with racing performance and career duration for Victorian-born Thoroughbreds. Australian Veterinary Journal 100, 48-55.
| Crossref | Google Scholar | PubMed |
Flash M, Shrestha K, Stevenson MA, Gilkerson J (2023) National participation levels in the 2017–2018 Australian thoroughbred racing season. Australian Veterinary Journal 101, 265–274. doi:10.1111/avj.13242
Gibson MJ, Legg KA, Gee EK, Rogers CW (2022) Race-level reporting of incidents using an online system during three seasons (2019/2020–2021/2022) of Thoroughbred flat racing in New Zealand. Animals 12, 3028.
| Crossref | Google Scholar | PubMed |
Gibson MJ, Legg KA, Gee EK, Rogers CW (2023a) The reporting of racehorse fatalities in New Zealand Thoroughbred flat racing in the 2011/12–2021/22 seasons. Animals 13, 612.
| Crossref | Google Scholar | PubMed |
Gibson MJ, Legg KA, Gee EK, Rogers CW (2023b) Risk factors for horse fatality in Thoroughbred jumps racing in New Zealand. Journal of Equine Veterinary Science 129, 104897.
| Crossref | Google Scholar |
Hitchens PL, Morrice-West AV, Stevenson MA, Whitton RC (2019) Meta-analysis of risk factors for racehorse catastrophic musculoskeletal injury in flat racing. The Veterinary Journal 245, 29-40.
| Crossref | Google Scholar | PubMed |
Legg KA, Cochrane DJ, Bolwell CF, Gee EK, Rogers CW (2020) Incidence and risk factors for race-day jockey falls over fourteen years. Journal of Science and Medicine in Sport 23, 1154-1160.
| Crossref | Google Scholar | PubMed |
Legg KA, Gee EK, Cochrane DJ, Rogers CW (2021) Preliminary Examination of the Biological and Industry Constraints on the Structure and Pattern of Thoroughbred Racing in New Zealand over Thirteen Seasons: 2005/06–2017/18. Animals 11, 2807.
| Crossref | Google Scholar | PubMed |
Legg KA, Bolwell CF, Gee EK, Gibson MJ, Rogers CW (2022) Risk factors for horse falls in New Zealand Thoroughbred jumps racing. The Veterinary Journal 289, 105915.
| Crossref | Google Scholar |
NZTR (2019) NZTR Racing policy. Available at https://loveracing.nz/OnHorseFiles/RACING%20POLICY%202019.pdf [Verified 13 March 2023]
NZTR (2023) Rules of racing. New Zealand Thoroughbred Racing Incorportated. Available at https://nztr.co.nz/sites/nztrindustry/files/2023-06/RulesOfRacing_effective26June23.pdf
Parkin TDH, Clegg PD, French NP, Proudman CJ, Riggs CM, Singer ER, Webbon PM, Morgan KL (2004a) Horse-level risk factors for fatal distal limb fracture in racing Thoroughbreds in the UK. Equine Veterinary Journal 36, 513-519.
| Crossref | Google Scholar | PubMed |
Parkin TDH, Clegg PD, French NP, Proudman CJ, Riggs CM, Singer ER, Webbon PM, Morgan KL (2004b) Risk of fatal distal limb fractures among Thoroughbreds involved in the five types of racing in the United Kingdom. Veterinary Record 154, 493-497.
| Crossref | Google Scholar | PubMed |
Perkins NR, Reid SWJ, Morris RS (2005) Profiling the New Zealand Thoroughbred racing industry. 1. Training, racing and general health patterns. New Zealand Veterinary Journal 53, 59-68.
| Crossref | Google Scholar | PubMed |
Pinchbeck GL, Clegg PD, Proudman CJ, Morgan KL, Wood JLN, French NP (2002) Risk factors and sources of variation in horse falls in steeplechase racing in the UK. Preventive Veterinary Medicine 55, 179-192.
| Crossref | Google Scholar | PubMed |
Reardon RJM, Boden LA, Mellor DJ, Love S, Newton JR, Stirk AJ, Parkin TDH (2013) Risk factors for superficial digital flexor tendinopathy in Thoroughbred racehorses in steeplechase starts in the United Kingdom (2001–2009). The Veterinary Journal 195, 325-330.
| Crossref | Google Scholar | PubMed |
Rogers CW, Bolwell CF, Tanner JC, van Weeren PR (2012) Early exercise in the horse. Journal of Veterinary Behavior 7, 375-379.
| Crossref | Google Scholar |
Rogers CW, Legg K, Gibson M, Gee EK (2023) Commercial equine production in New Zealand 4: welfare implications of the New Zealand production systems. Animal Production Science 64, AN22424.
| Crossref | Google Scholar |
Ruse K, Davison A, Bridle K (2015) Jump horse safety: Reconciling public debate and Australian Thoroughbred jump racing data, 2012–2014. Animals 5, 1072-1091.
| Crossref | Google Scholar | PubMed |
Shrestha K, Gilkerson JR, Stevenson MA, Flash ML (2021) Drivers of exit and outcomes for Thoroughbred racehorses participating in the 2017–2018 Australian racing season. PLoS ONE 16, e0257581.
| Crossref | Google Scholar | PubMed |
Tanner JC, Rogers CW, Firth EC (2013) The association of 2-year-old training milestones with career length and racing success in a sample of Thoroughbred horses in New Zealand. Equine Veterinary Journal 45, 20-24.
| Crossref | Google Scholar | PubMed |
Velie BD, Knight PK, Thomson PC, Wade CM, Hamilton NA (2013) The association of age at first start with career length in the Australian Thoroughbred racehorse population. Equine Veterinary Journal 45, 410-413.
| Crossref | Google Scholar | PubMed |