

The influence of loading, road transport, unloading and time in lairage on body temperature in finished feedlot steers
S. L. Bonner A B , I. D. Loxton C , A. Lisle B , R. J. Lawrence A , A. M. Lees B * and J. B. Gaughan B
A
B
C
Abstract
Transport of cattle can be stressful and may lead to increased body temperature. It is necessary to quantify the effect of transport on body temperature so that informed management decisions can be made.
This study aimed to determine the effects of a 5.5 h, 430 km road transport journey on body temperature (TB) of feedlot steers.
Body temperature was obtained at 30 min intervals. All cattle were weighed and randomly allocated to a truck pen prior to transport. Cattle were transported on a single B-double truck, with three upper-deck and three lower-deck compartments. At 0630 hours, cattle were walked from their pens (25 m), weighed and loaded onto the truck. Loading was completed by 1030 hours.
During the weighing and loading process prior to transport, mean TB increased from 39.37 ± 0.11°C to 40.21 ± 0.11°C. Immediately following loading, mean TB increased. The TB of cattle on the upper deck was 40.96 ± 0.08°C and on the lower deck 40.89 ± 0.08°C (P = 0.6299). During the first 3 h of the journey, the TB of lower-deck cattle decreased by 1.14°C (P < 0.01), compared with a 0.83°C reduction in cattle on the upper deck. Over the duration of the journey, which took 1 h longer than expected, the mean TB of the cattle on the upper deck (40.47 ± 0.11°C) was greater (P < 0.0001) than that on the lower deck (40.04 ± 0.12°C). One hour after unloading at the abattoir, pooled TB was 40.26 ± 0.12°C. Minimum TB (38.87 ± 0.04°C) occurred at 10.5 h after unloading.
The results from this study highlight that increases in TB were more associated with cattle handling and loading events, rather than transport, under these environmental conditions. Understanding the magnitude of this increase will help managers decide on pre- and post- transport management of cattle.
Cattle handling and loading for transport may lead to an increase in TB, which can remain elevated for a number of hours. However, it is unclear what the impact of hotter climatic conditions would have on trailer microclimate and, as such, TB regulation during road transport.
Keywords: beef cattle, core body temperature, lairage, livestock handling, microclimate, temperature, temperature humidity index, transportation.
Introduction
Road transport is recognised as a stressor for livestock (Tarrant et al. 1992; Knowles et al. 1999; Van de Water et al. 2003; Stockman et al. 2011; Schwartzkopf-Genswein et al. 2016). The impact of transport on cattle is a function of pre- and post-transport management (handling, loading), feed and water removal, truck movement, novelty of transport, social regrouping, climatic factors (ambient temperature and relative humidity), duration of transit, age, and metabolic status (Eicher 2001). Due to the nature of the beef industry, most cattle are transported by road at least once in their lifetime (Swanson and Morrow-Tesch 2001), and many are transported more than once (Schwartzkopf-Genswein et al. 2016). In Australia, there are clear guidelines regarding the transportation of cattle by road, at both the Federal and State government levels, to ensure that animal welfare is maintained (Animal Health Australia 2012). Nevertheless, there are increasing public concerns about the impact of road transport on the welfare of cattle (Buddle et al. 2018).
Knowledge regarding the impact of loading, transport and unloading on finished beef cattle body temperature, especially in Australia, is limited. Bulitta et al. (2015) stated that the thermal micro-environment within the transport trailer or compartment poses the greatest threat to the animals’ welfare and wellbeing. Furthermore, Nielsen et al. (2022) identified heat stress as one of the factors that have an impact on the welfare of transported cattle. In the European Union, transport guidelines for cattle indicate that long-duration transport should not be undertaken when the forecasted outside temperature along the route is anticipated to exceed 30°C (European Commission Food Safety 2019). However, Australian industry guidelines are vague stating ‘avoid extremes of weather’ (Meat Livestock Australia N.D.), and ‘take action to ensure the welfare of animals being transported during the ongoing heat wave’ (Western Australia Government 2022). Furthermore, in the European Union the stock crate needs to have sensors that display the internal trailer ambient temperature in the cab of the truck. González et al. (2012) concluded that during long-distance transport in the USA, i.e. with durations of ≤30 h, the likelihood of cattle becoming non-ambulatory increased when mid-journey ambient temperatures increased above 20°C, and mortality increased markedly with ambient temperatures above 35°C. This is concerning because in Australia an estimated 50% of journeys exceed 500 km, with some exceeding 2000 km (Lapworth 2008; CSIRO 2016). There is considerable variation in the duration of journeys, which can be short, for example, less than 1 h, or long, for example, 2, 3 or more days.
Physiological markers that can be used as indicators of transport stress during road transport include increased body temperature (Schaefer et al. 1997; Knowles 1999; Stockman et al. 2011), and heart rate (Van de Water et al. 2003). However, Pettiford et al. (2008), and Kenny and Tarrant (1987) reported that increased heart rate was more a function of loading than transportation. There is also evidence that cattle will habituate to transport (Pettiford et al. 2008; Stockman et al. 2011), thereby reducing the magnitude of the stress response. However, there remains little documented evidence of the effect of climatic conditions during loading, transportation and unloading on body temperature of cattle in Australia. It is evident that there is potential for thermal stress during transport; however, there is a paucity of published material on the impact of ambient temperature and relative humidity within truck compartments on livestock during road transport under Australian conditions. As such, the objectives of this study were to (1) determine the impact of short-duration road transport, with an estimated duration of 5.5 h, on body temperature in feedlot cattle, (2) determine the change in ambient temperature and relative humidity in a livestock transport trailer over the duration of the journey, and (3) determine the post-transport effects on body temperature of cattle during lairage.
Materials and methods
The study was approved by the Queensland Department of Primary Industries and Fisheries Animal Ethics Committee (SA2007/06/202).
Sixty-two Black Angus steers, with a non-fasted liveweight of 589.4 ± 2.4 kg, were used in this study. Prior to transport, the steers spent 120 days in a feedlot at the Brigalow Research Station (Theodore, Queensland, Australia, 24°4′S, 149°78′E) as part of another study (Gaughan et al. 2010). The steers had been implanted with intra-abdominal body-temperature transmitters (Sirtrack, Havelock North, New Zealand). Each transmitter (30 mm in diameter × 95 mm long) operated on a different radio frequency (150.10–151.36 MHz). A description of the feedlot layout, animal management prior to transport and the transmitter surgical-implantation methodology has been presented previously in Gaughan et al. (2010).
A B-double truck was used to transport the cattle from the feedlot to the abattoir. A B-double is a multicombination unit with a prime mover articulated with two trailers consisting of six compartments (6.13 × 2.40 m; 14.71 m2). The first trailer, which was located directly behind the prime mover, was a 6.1 m long double-deck stock-crate trailer, with one compartment on the upper deck and one compartment on the lower deck. The second trailer was located behind the first and was a 12.2 m long double-deck stock-crate trailer, with two compartments on the upper deck and lower deck. The stock crate was an iron-frame construction with pressed metal sides, and a ribbed metal floor. The sides of the lower deck were solid from the floor to 350 mm, at which point there was a 165 mm gap (to allow air movement), and then an 865 mm solid panel with a 320 mm opening above the solid panel. The sides of the upper deck were solid with an 865 mm panel. The upper deck was open on the top, with a 575 mm wide walkway located in the centre of each trailer and running the full length of the trailer. The compartments in the first trailer are referred to as the upper or lower forward compartments, and those of the second trailer the upper or lower-middle and rear compartments.
Commencing at 0630 hours on the day of departure, the steers were moved from their respective feedlot pens (one pen at a time), walked to the handling facility (approximately 25 m), weighed (had been fed approximately 1400 hours previous day; full access to water) and then allocated to a transport group (n = 6) consisting of four groups with 10 steers/group, and two groups with 11 steers/group. Following weighing and allocation, each transport group was kept in an unshaded yard (n = 6) with ad libitum access to water, approximately 15 m from the handling facility until loaded. The transport groups were then randomly allocated to a truck compartment (n = 6). The groups with 11 steers were assigned to the upper-deck forward and lower-deck forward compartments. Therefore, the forward compartments on each deck contained 11 steers each (1.34 m2/steer), and the rear and middle compartments each contained 10 steers (1.47 m2/steer). Both of these space allowances were within Queensland Government guidelines for transport space allocations for cattle between 550 and 600 kg (https://www.daf.qld.gov.au/__data/assets/pdf_file/0013/72400/Loading-cattle-transport.PDF).
Each pen group was walked approximately 40 m to the loading ramp, and then into its allocated compartment on the truck. The loading order was first-trailer lower-deck forward compartment, second-trailer lower-deck middle compartment, lower-deck rear compartment, first-trailer upper-deck forward compartment, second-trailer upper-deck middle compartment, and top-deck rear compartment. Cattle loading commenced at approximately 1000 hours and all cattle were loaded by 1018 hours. Transport commenced at 1030 hours. No dogs or electric prodders were used during the loading process.
The steers were transported to a commercial abattoir in south-eastern Queensland, Australia, with an approximate travel distance of 430 km. The estimated travel time from the feedlot to the abattoir was approximately 5 h 30 min. Planned stops for welfare inspection of cattle after departure from the feedlot were at 40 min and 2 h 40 min post-departure. All planned stops and any additional stops were documented and the reason for the stop, location of stop and duration of each stop was recorded. Welfare checks were undertaken at each stop. The following observations were made at each stop: cattle posture (standing or lying); cattle appearance (agitated, calm, or depressed); any sign of injury or ill health, and panting score (closed or open mouth and drooling). Panting score (PS) was defined on a 0–4.5 point scale, where no panting = PS 0, open mouth, tongue extended and excessive drooling = PS 4.5, as described by Gaughan et al. (2008).
During transit, ambient temperature (TA, °C) and relative humidity (RH, %) were recorded using data loggers (Hobo Model H08-007-02; Onset Computer Corporation, Pocasset, MA, USA) at 10 min intervals. The loggers were calibrated by exposing them to a temperature of 35.0 ± 0.6°C and a relative humidity of 47.3 ± 5.2% for 48 h prior to transport, and again for 48 h following transport. The loggers were enclosed in a protective PVC case (85 mm × 45 mm) with a wire mesh front and were attached to the frame of the stock crate in a position slightly above the head height of the steers to minimise any animal interferance with the loggers (Fig. 1). A single logger was placed in the upper-middle and -rear pens, and the lower-middle and -rear pens. Two loggers were placed in the upper and lower forward pens (Fig. 1). From these data, the temperature humidity index (THI) was calculated using the following equation modified from Thom (1959):
The calculated THI were categorised as mild (72 ≤ THI ≤ 79), moderate (80 ≤ THI ≤ 89) and severe (THI ≥ 90) heat stress as described by Armstrong (1994).
Stylised plan of the upper- and lower-deck compartments of the B-double truck (not to scale), and the placement of the loggers. All Hobo loggers were placed at or slightly above head height of the steers, in positions to remain untouched by the steers.

The climatic data external to the stock crate while travelling were obtained from various Australian Bureau of Meteorology weather stations located in or close to towns and localities on route. During transit, individual body temperature was transmitted at 30 min intervals to a radio receiver (TR-5 Receiver, Telonics, Mesa, AZ, USA) located within the cab of the truck. On arrival at abattoir, the radio receiver was removed from the truck and set up in the lairage area so that body temperature could continue to be monitored while the cattle were in lairage. Body-temperature data were obtained until cattle exited the lairage pen and entered a race just prior to stunning. Body-temperature data were then downloaded from the receiver to a computer (TR-5 interface software; Telonics).
On arrival at the abattoir, the steers were unloaded from the truck into a shaded arrival pen (22 m × 22 m) where they remained for 1 h, noting that all cattle were grouped together in the same pen. The steers were then moved as a group from the arrival pen to a lairage pen located within a shed, which was open on three sides. The steers had access to water in both the arrival pen and the lairage pen. The cattle remained in the lairage pen for 16 h. Once cattle were unloaded, the temperature/humidity data loggers were removed from the truck. Two of these were then placed at cattle height on panels either side of the lairage pen. Ambient temperature and RH were then recorded at 10 min intervals until 0900 hours the following day, by which time all cattle had exited the lairage pen.
Statistical analyses
One temperature/humidity logger failed during transit and therefore only limited data were collected from the lower-rear compartment for the duration of the trip. Because of limited body temperature data being obtained from four steers, only data from 58 steers are presented herein. No injuries to steers occurred during loading and unloading, transit or while in lairage.
Body temperature was analysed using a repeated measures model (PROC MIXED, SAS Institute Inc., Cary, NC, USA) using REML estimation. The individual animal was the experimental unit. The model included truck deck (upper, lower), truck compartment (n = 6), deck × compartment, time of day (included transport and lairage), deck × time (in lairage) and the interaction of truck compartment × observation time as fixed effects, with animal being included as a random effect. Least-squares means were estimated for the various treatment effects. When significance (P < 0.05) was indicated, the means were separated using Tukey’s Studentised range test.
Results
Microclimate when moving cattle and during the loading process
Between 0630 hours and 1030 hours, the means (±s.e.) for TA, RH and THI were 24.03 ± 0.46°C (range 20.19–27.52°C), 58.03 ± 1.76% (range 40.3–78.4%) and 70.88 ± 0.45 (range 66.48–77.48 units).
Body temperature prior to transport
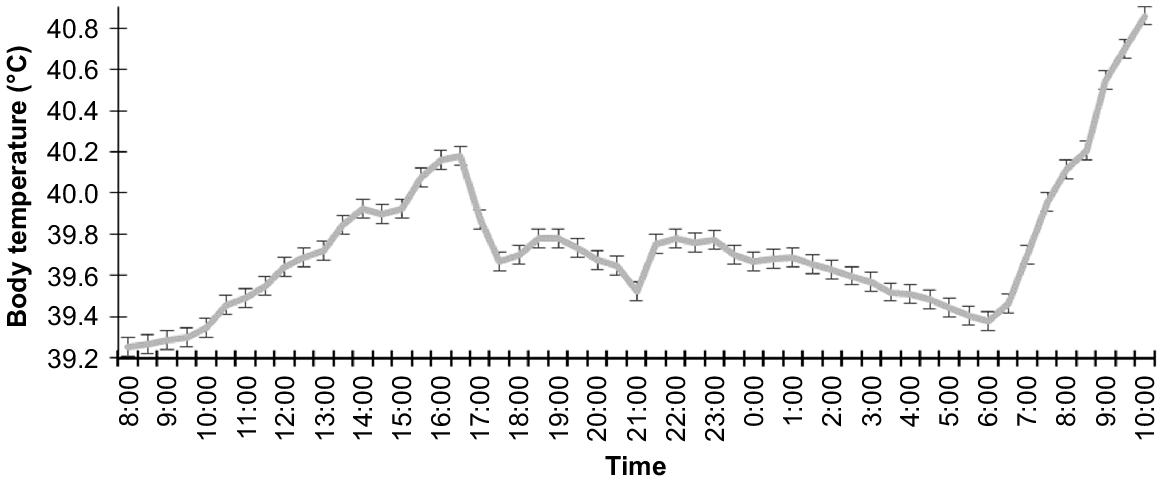
Body temperatures for the 24 h prior to transport are presented in Fig. 2. On the day of loading, the minimum TB (39.38 ± 0.07°C) occurred at 0600 hours, and the maximum of 40.86 ± 0.08°C occurred at 1000 hours (Fig. 2). This is a mean increase of 1.48°C. Thirty minutes of TB collection was lost as the receivers had to be turned off and reconfigured in the truck. Following loading (moving from cattle yard pens, to loading ramp and onto the truck), the TB of cattle (P = 0.6299) on the upper deck were 40.96 ± 0.08°C and on the lower deck 40.89 ± 0.08°C, increases of 0.75 and 0.68°C. Overall, from the start of cattle movement until truck departure (1030 hours), TB increased by 1.55°C.
Climate external to the truck during transit
The mean TA, RH, and THI (external to the truck) during transit were 30.35 ± 0.46°C (range 26.5–32.0°C), 38.99 ± 0.18% (range 34.61–47.37%) and 78.23 ± 0.14 units (63.17–79.33 units), respectively. On arrival at the abattoir, TA, RH and THI were 27.7°C, 43.6% and 74.36 units respectively.
Microclimate between decks and within compartments
There was an initial rise in TA in all compartments, while the truck was stationary prior to the commencement of the trip at 1030 hours. Over the duration of the journey, the compartment temperatures tended to follow the external ambient conditions, i.e. they increased or decreased as external temperature increased or decreased. There were differences between the upper decks and lower decks for TA (P = 0.0032) and THI (P = 0.0029). The means for TA for the upper and lower deck were 27.79 ± 0.02°C and 26.86 ± 0.24°C respectively. For THI, the means were 73.53 ± 017 units for the upper deck and 72.75 ± 0.20 units for the lower deck. There were no deck differences for relative humidity (P = 0.1989). The mean compartment TA, RH, and THI over the duration of the journey are presented in Table 1. During the trip, the mean (±s.e.) for TA, RH, and THI (all compartments combined) were 27.39 ± 0.14°C, 41.06 ± 1.80% and 73.20 ± 0.34 units respectively. The lower forward-front compartment had a lower mean TA (P = 0.0022) and THI (P = 0.0114) than did the upper forward-front compartment, but they were not different (P > 0.05) from the other compartments. All compartments were within the THI mild category (72–79 units) for the duration of the trip.
| Compartment | TA (°C) | RH (%) | THI (units) | |
|---|---|---|---|---|
| Upper front | 27.98 ± 0.47a | 39.64 ± 1.73 | 73.64 ± 0.78a | |
| Upper middle | 27.38 ± 0.38a,b | 41.41 ± 1.79 | 73.26 ± 0.31a,b | |
| Upper rear | 27.80 ± 0.44a,b | 40.53 ± 1.81 | 73.61 ± 0.38a,b | |
| Lower front | 26.73 ± 0.34b | 41.77 ± 1.60 | 72.54 ± 0.28b | |
| Lower middle | 27.14 ± 0.36a,b | 42.67 ± 1.74 | 73.18 ± 0.32a,b | |
| Lower rear | No data | No data | No data |
Means within in a column with different letters differ significantly (at P = 0.10).
THI = (0.8 × TA) + [(RH × 0.01) × (TA – 14.4)] + 46.4).
Travel time, distance travelled and stoppages
The transport phase from the feedlot to the abattoir took approximately 6.5 h, which was 1 h longer than expected. The distance travelled was 420 km, which was slightly less than estimated. The planned stops did not occur at the estimated times because of road conditions, i.e. suitable areas had to be found to stop the truck. During transit, the truck stopped four times, including the following: Stop 1, scheduled stop (5 min duration), 45 min after departure, all cattle standing, calm, no panting; Stop 2, scheduled stop (10 min duration), 3 h after departure, two steers lying, all cattle calm, no panting or drooling; Stop 3, unscheduled stop (11 min duration), 4 h after departure (unscheduled) to adjust radio receiver, three steers lying, all cattle calm, no panting or drooling; Stop 4, unscheduled stop (13 min duration), 5 h after departure, stopped by police for log book and license check, one steer lying, all cattle calm, four panting (all panting, Score 2) in forward-compartment upper deck. Unloading commenced immediately on arrival at the abattoir (6.5 h after departure from feedlot) at approximately 1700 hours. The unloading sequence was from rear compartments to forward compartments on the upper deck, followed by rear compartments to forward compartments on the lower deck, and took 14 min.
Impact of stoppages on transit microclimate
The truck stopped four times during the journey, which was two more than expected. During the first three stops, the TA and THI in the compartments on the lower deck remained mostly stable. However, there were numerical increases in TA and THI on the upper deck each time the truck stopped. During the fourth stop, TA in the upper-front compartment increased from 31.1°C to 33.9°C, and THI increased from 74.5 units to 78.3 units. Ambient temperature returned to 31°C, and THI reduced to 75.4 once movement recommenced. During Stop 4, RH in the middle compartment on the lower deck increased from 29% to 55% and decreased to 32% when travel recommenced.
Body temperature during transport
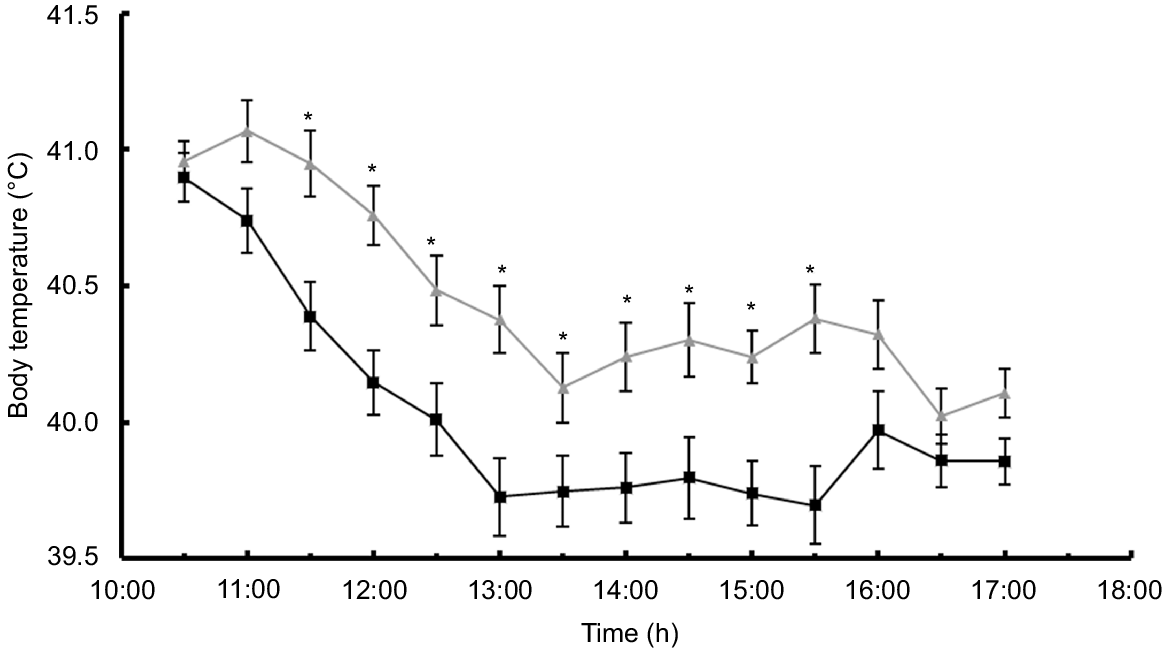
Following the commencement of transportation, the TB of cattle on both decks decreased from the post-loading peaks. However, the reductions in TB were greater (P < 0.01) over the first 3 h of transport for the cattle on the lower deck. Mean TB of cattle on the upper deck decreased by 0.83°C, whereas on the lower deck there was a decrease of 1.14°C. Over the duration of the journey, cattle on the upper deck had a higher (P = 0.0001) mean body temperature than did those on the lower deck, being 40.47 ± 0.11°C and 40.04 ± 0.12°C respectively (Fig. 3). Location in truck, i.e. compartment on a deck, had no effect (P > 0.05) on TB.
Mean body temperature (±s.e.) on the upper (▲) and lower (■) deck of the B-double truck. The loading of cattle was completed at 1030 hours, and cattle were offloaded at the abattoir at 1700 hours. The intervening period was the duration of transport. Asterisk indicates a significant (P < 0.05) difference in body temperature between upper- and lower-deck cattle.
Microclimate during lairage
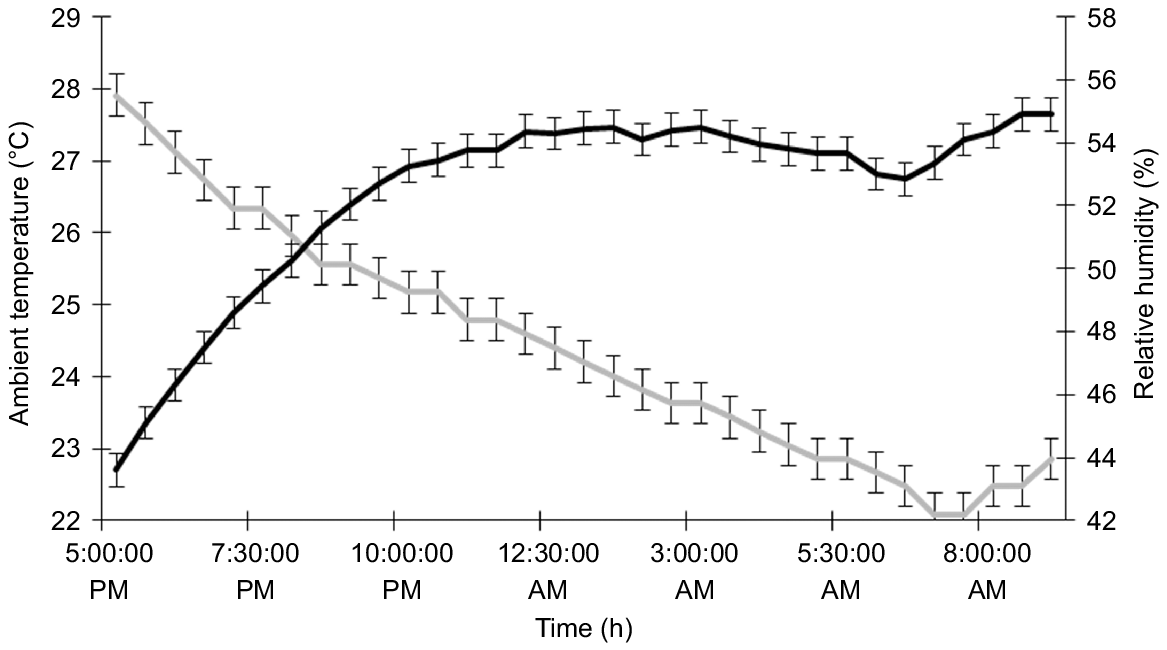
During the 16 h the cattle were in lairage (from 1700 hours to 0900 hours), the mean TA, RH and THI were 24.4 ± 1.6°C, 52.4 ± 2.9%, and 71.1 ± 1.9 units respectively (Fig. 4).
Body temperature in lairage
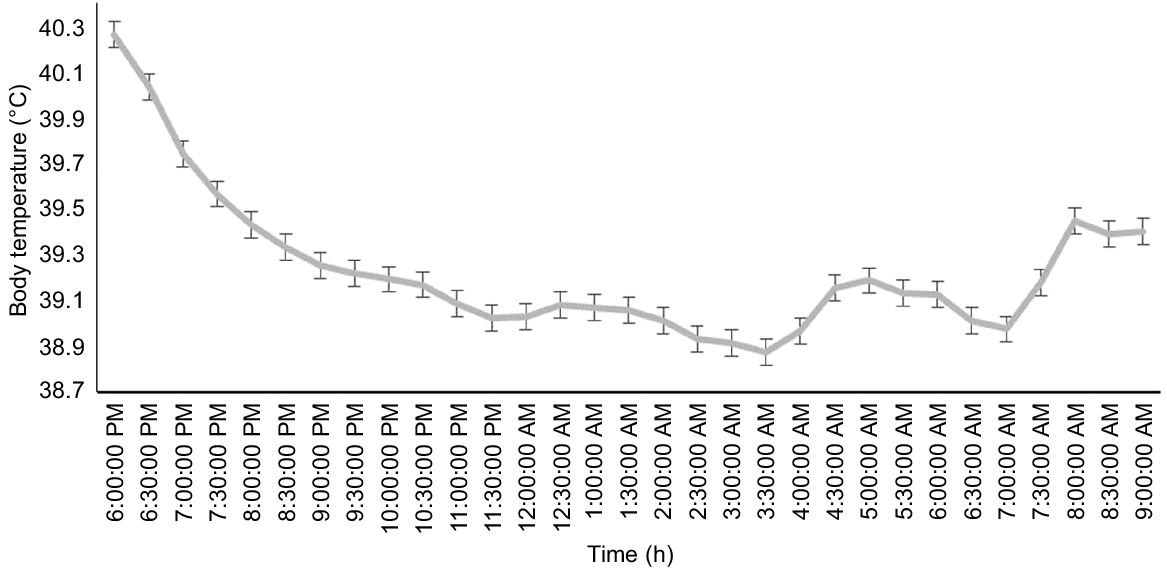
Because there were no differences in TB between the upper- and lower-deck cattle 1 h after unloading, the data have been pooled. One hour after unloading, body temperature was 40.26 ± 0.12°C (Fig. 5). Minimum TB 38.87 ± 0.04°C occurred at 0330 hours, a decrease of 1.39°C over 9.5 h or approximately 0.15°C/h. Body temperature increased by 0.32°C to 39.19 ± 0.04°C at 0500 hours, decreased by 0.22°C to 38.97 ± 0.04°C at 0700 hours and increased by 0.47°C to 39.44 ± 0.04°C at 0800 hours as cattle walked to the stunning box (Fig. 5.). Overall, during the 16 h the cattle were in lairage, mean TB was (39.23 ± 0.04°C).
Discussion
Numerous studies have attempted to quantify the stress response of transported livestock (Kenny and Tarrant 1987; Tarrant et al. 1992; Knowles et al. 1993, 1999; Cockram et al. 1996; Broom 2003; Parker et al. 2003; Ali et al. 2006; Krawczel et al. 2007; Fisher et al. 2010; Nielsen et al. 2011; Bulitta et al. 2015; Deters and Hansen 2020). However, fewer have included body-temperature assessment and/or measurement of the microclimate in livestock trailer compartments (Pettiford et al. 2008; Burdick et al. 2010; Stockman et al. 2011; Goldhawk et al. 2014a; Pascual-Alonso et al. 2017; Marcato et al. 2020; Machado et al. 2021), with only a few measuring both.
Changes in body temperature owing to handling
It is generally accepted that moving cattle, handling and loading will increase body temperature (Kenny and Tarrant 1987; Pettiford et al. 2008). The 1.55°C increase in body temperature from 0630 hours in the current study was associated with moving, weighing, mixing, and loading the cattle onto the truck. Lawrence et al. (2008) reported an increase in body temperature of 1.5°C when cattle (same cattle as used in the current study) were walked 500 m from a paddock to the processing area and then into feedlot pens, prior to the commencement of the study, when TA temperature was approximately 33°C. Using tympanic temperature, Mader et al. (2005) reported an increase of 0.3°C for 456 kg cattle moved 150 m and a 0.67°C increase for cattle moved 600 m from their feedlot pens through a handling facility (but not mixed), and back to their respective pens when TA was 20.4 ± 3.6°C. In another study by Mader et al. (2005), the tympanic temperature increased by approximately 0.6°C in 531 kg cattle moved 600 m, when TA was 2.0 ± 4.6°C. A recent study by Lees et al. (2020) recorded rectal temperatures of 60 purebred Angus cattle (235.2 ± 5.11 kg) at 20 s intervals from 30 min prior to handling until 2 h post-handling. They reported that maximum rectal temperature (39.3 ± 0.04°C; an increase of 0.26°C) occurred 4 min after entry into a weigh box and remained elevated only until 5.7 min after entry into the weigh box, prior to steadily decreasing to baseline rectal temperature. In a transport study using ewes, loading did not increase body temperature; however, there was an increase in body temperature immediately following unloading (Pascual-Alonso et al. 2017). From the limited studies, it is evident that moving cattle will lead to increases in body temperature even under mild TA, i.e. those below 25°C, and moving relatively short distances. Despite the variation that exists across studies, it is evident that exposure to humans and handling events are associated with an increase in body temperature that can be categorised as a physiological stress response. The increased body temperature associated with handling events has additional implications for transporting cattle when ambient conditions are hot, especially for those cattle with a high metabolic heat load, specifically heavy feedlot-finished cattle departing feedlots.
Changes in body temperature as a result of transport
Meléndez et al. (2020) reported an increase in rectal temperature of transported 258 kg Angus and Simmental beef steers calves. They suggested that the increase was due to handling stress associated with loading and unloading, rather than transport per se. Similarly, Pettiford et al. (2008) reported that most of the stress occurred in cattle during loading and the initial stages of transport, but after the cattle were acclimated, they coped with 6 h of transport. In addition, Stockman et al. (2011) reported an increase in the TB of steers during transport of 0.95°C from a baseline of 38.68°C and of 0.52°C from a baseline of 38.60°C for steers not previously transported and those with transport experience respectively. In the current study, TB decreased during transport, following the initial TB increase associated with loading. These data support the findings of Pettiford et al. (2008), suggesting that the increase in TB is due to the handling loading process and not associated with transport. In another study, the rectal temperature of bulls transported 770 km (external temperature ranged from 10 to 15°C) peaked 30 min into the trip and reached a minimum 600 min into the trip (Burdick et al. 2010). Stockman et al. (2011) also reported that mean maximum TB occurred during the first 30 min of transport. In another study, transported ewes reached a maximum TB (40.4°C) 2.5 h from the start of transport (Pascual-Alonso et al. 2017). In the current study, the TB of the cattle on the upper deck also peaked 30 min into the trip; however, the TB of those on the lower deck decreased from the start of the trip. For cattle on the upper, deck minimum TB occurred 360 min into the trip, and for the lower deck the minimum was reached at 300 min. In addition, TB dropped over the first 3 h of travel but did not return to normal levels, specifically ranging between 39.1°C and 39.3°C, which is within the reference range for feedlot cattle on high-energy diets. Investigating the impact of transport on cattle, Nielsen et al. (2011) considered that where conditions are optimal, healthy cattle could be exposed to long-duration transport without having a negative influence on welfare.
Recovery
Recovery time following a handling and transport event is important for cattle wellbeing, and also for their ability to cope with exposure to additional stressors. It was reported by Lawrence et al. (2008) that it took 2–3 h for TB to return to normal when activity and movement ceased. Mader et al. (2005) reported an average of 3.5 h for TB to return to normal for cattle that were moved 600 m in winter (2.5°C) and <1–2 h for cattle moved 150 or 600 m when TA was approximately 20°C. In the current study, mean TB declined by over 1°C from 40.26°C at the commencement of lairage at 1800 hours to a mean minimum of 38.87°C at 0330 hours (9.5 h). Mean TB commenced to rise again from that time onwards, as daily abattoir lairage operations commenced, i.e. human activity, other animal movements and pre-slaughter hygiene washings.
Microclimate
The microclimate within a compartment is a function of external ambient conditions, vehicle speed, stocking density, the compartment within trailer, and duration of travel (Goldhawk et al. 2014b). Other factors include animal size, trailer configuration, road conditions (e.g. dust), solar load, air movement and stock-crate design. A study by Machado et al. (2021) developed thematic maps of the spatial distribution of THI on the upper and lower deck of a truck trailer during the transport of weaner pigs. These showed differences for heat load between the upper and lower decks and among compartments, which were reflected in differences in pig rectal temperature and respiration rates. Goldhawk et al. (2014a, 2014b) also reported microclimate (THI) differences between decks and among compartments in a commercial cattle trailer used for transporting calves. In contrast, a cattle transport study undertaken in the USA summer reported that the TA, RH and THI did not differ among compartments (Troxel et al. 2016). In the current study, although there were deck differences, only the upper- and lower-front compartments differed, possibly as a result of airflow changes owing to the location of the prime mover. During transport in the current study, THI (mean = 73.20 ± 0.34 units) was in the mild heat-load category. At this level, there would be a sufficient temperature gradient for cattle to dissipate heat. However, heat dissipation from cattle on the upper deck appears to be less than from those on the lower deck, resulting in higher TB on the upper deck. Given the design, the cattle on the upper deck were exposed to solar load during the trip, meaning that their heat load was greater than indicated by the THI, which does not account for solar load or wind effects. Microclimate differences between upper and lower decks and among compartments of cattle transport needs further investigation, under a range of ambient conditions and hours of transport. In addition, solar load and air movement should be incorporated as a measure when assessing stock-crate microclimates. There are a number of devices on the market that allow real-time assessment of microclimates within compartments during transport. These should be considered as part of a standard assessment of microclimates during transport. Placement of cattle on the truck may need to be a consideration for susceptible cattle; for example, those walked longer distances during the loading process may be better placed in compartments that are known to have a lower heat loading potential.
Conclusions
In the current study, a rise in TB of feedlot cattle was associated with handling and loading events, rather than transport. This has implications for management in terms of when to load, processes around loading, such as, for example, mixing cattle and how far cattle should move prior to loading, or allowing for a recovery period post-handling but pre-loading. While further studies are required to determine the impact of transport and transport type (e.g. trailer configurations) on body temperature, welfare and carcass quality over longer distances using cattle from different backgrounds, for example, grazing and feedlots, and different liveweights and body condition scores when they are transported under various climatic conditions, there are obvious challenges undertaking projects of this scale. A priority action should be to undertake a more comprehensive evaluation of within-trailer microclimate across different climate conditions and journey durations. This is achievable with the current technologies available that allow real-time assessment within trailer microclimates. Given the knowledge that exists regarding body-temperature changes with handling events, a more comprehensive evaluation of within-trailer microclimates would provide a scientific basis for the development of guidelines regarding the transportation of cattle by road during hot climatic conditions.
Conflicts of interest
Professor John Gaughan is an Associate Editor of Animal Production Science. To mitigate this potential conflicts of interest, they were blinded from the review process.
Declaration of funding
Funding for this study was provided by Meat and Livestock Australia P/L, North Sydney, NSW, Australia, and the Australian Federal Government, Canberra, ACT, Australia. Grant number: B.FLT.345 – Assessment of betaine and glycerol as ameliorants of heat load in feedlot cattle; however, no input into the study was given by the funding bodies beyond this financial support.
Acknowledgements
This study would not have been possible without the contributions of staff time and the facilities of the former Brigalow Research Station, Theodore, central Queensland.
References
Ali BH, Al-Qarawi AA, Mousa HM (2006) Stress associated with road transportation in desert sheep and goats, and the effect of pretreatment with xylazine or sodium betaine. Research in Veterinary Science 80, 343-348.
| Crossref | Google Scholar | PubMed |
Animal Health Australia (2012) Australian animal welfare standards and guidelines – land transport of livestock. Available at https://www.animalwelfarestandards.net.au/land-transport/ [Accessed 31 March 2023]
Armstrong DV (1994) Heat stress interaction with shade and cooling. Journal of Dairy Science 77, 2044-2050.
| Crossref | Google Scholar | PubMed |
Broom DM (2003) Transport stress in cattle and sheep with details of physiological, ethological and other indicators. Deutsche Tierarztliche Wochenschrift 110, 83-89.
| Google Scholar | PubMed |
Buddle EA, Bray HJ, Ankeny RA (2018) ‘I feel sorry for them’: Australian meat consumers’ perceptions about sheep and beef cattle transportation. Animals 8, 171.
| Crossref | Google Scholar | PubMed |
Bulitta FS, Aradom S, Gebresenbet G (2015) Effect of transport time of up to 12 hours on welfare of cows and bulls. Journal of Service Science and Management 8, 161-182.
| Crossref | Google Scholar |
Burdick NC, Carroll JA, Hulbert LE, Dailey JW, Willard ST, Vann RC, Welsh TH, Jr, Randel RD (2010) Relationships between temperament and transportation with rectal temperature and serum concentrations of cortisol and epinephrine in bulls. Livestock Science 129, 166-172.
| Crossref | Google Scholar |
Cockram MS, Kent JE, Goddard PJ, Waran NK, McGilp IM, Jackson RE, Muwanga GM, Prytherch S (1996) Effect of space allowance during transport on the behavioural and physiological responses of lambs during and after transport. Animal Science 62, 461-477.
| Crossref | Google Scholar |
Deters EL, Hansen SL (2020) Invited Review: linking road transportation with oxidative stress in cattle and other species. Applied Animal Science 36, 183-200.
| Crossref | Google Scholar |
Eicher SD (2001) Transportation of cattle in the dairy industry: current research and future directions. Journal of Dairy Science 84, E19-E23.
| Crossref | Google Scholar |
European Commission Food Safety (2019) Transport guide extreme temperatures (doc/12464/2019). Available at https://food.ec.europa.eu/system/files/2019-11/aw_platform_plat-conc_extreme-temp-factsh-cattle.pdf [Accessed 3 April 2023]
Fisher AD, Niemeyer DO, Lea JM, Lee C, Paull DR, Reed MT, Ferguson DM (2010) The effects of 12, 30, or 48 hours of road transport on the physiological and behavioral responses of sheep. Journal of Animal Science 88, 2144-2152.
| Crossref | Google Scholar |
Gaughan JB, Mader TL, Holt SM, Lisle A (2008) A new heat load index for feedlot cattle. Journal of Animal Science 86, 226-234.
| Crossref | Google Scholar | PubMed |
Gaughan JB, Bonner S, Loxton I, Mader TL, Lisle A, Lawrence R (2010) Effect of shade on body temperature and performance of feedlot steers. Journal of Animal Science 88, 4056-4067.
| Crossref | Google Scholar |
Goldhawk C, Crowe T, Janzen E, González LA, Kastelic J, Pajor E, Schwartzkopf-Genswein KS (2014a) Trailer microclimate during commercial transportation of feeder cattle and relationship to indicators of cattle welfare. Journal of Animal Science 92, 5155-5165.
| Crossref | Google Scholar | PubMed |
Goldhawk C, Janzen E, González LA, Crowe T, Kastelic J, Pajor E, Schwartzkopf-Genswein KS (2014b) Trailer microclimate and calf welfare during fall-run transportation of beef calves in Alberta. Journal of Animal Science 92, 5142-5154.
| Crossref | Google Scholar | PubMed |
González LA, Schwartzkopf-Genswein KS, Bryan M, Silasi R, Brown F (2012) Relationships between transport conditions and welfare outcomes during commercial long haul transport of cattle in North America. Journal of Animal Science 90, 3640-3651.
| Crossref | Google Scholar | PubMed |
Kenny FJ, Tarrant PV (1987) The physiological and behavioural responses of crossbred Friesian steers to short-haul transport by road. Livestock Production Science 17, 63-75.
| Crossref | Google Scholar |
Knowles G (1999) A review of the road transport of cattle. Veterinary Record 144, 197-201.
| Crossref | Google Scholar | PubMed |
Knowles TG, Warriss PD, Brown SN, Kestin SC, Rhind SM, Edwards JE, Anil MH, Dolan SK (1993) Long distance transport of lambs and the time needed for subsequent recovery. Veterinary Record 133, 286-293.
| Crossref | Google Scholar | PubMed |
Knowles G, Warriss PD, Brown SN, Edwards JE (1999) Effects on cattle of transportation by road for up to 31 hours. Veterinary Record 145, 575-582.
| Crossref | Google Scholar | PubMed |
Krawczel PD, Friend TH, Caldwell DJ, Archer G, Ameiss K (2007) Effects of continuous versus intermittent transport on plasma constituents and antibody response of lambs. Journal of Animal Science 85, 468-476.
| Crossref | Google Scholar | PubMed |
Lapworth JW (2008) Engineering and design of vehicles for long distance road transport of livestock: the example of cattle transport in northern Australia. Veterinaria Italiana 44, 215-222.
| Google Scholar | PubMed |
Lawrence RJ, Gaughan JB, Loxton ID, Grant TP (2008) The effect of cattle handling on body temperature. Proceedings Australian Society of Animal Production 27, 32.
| Google Scholar |
Lees AM, Salvin HE, Colditz IG, Lee C (2020) The influence of temperament on body temperature response to handling in angus cattle. Animals 10, 172.
| Crossref | Google Scholar | PubMed |
Machado NAF, Martin JE, Barbosa-Filho JAD, Dias CTS, Pinheiro DG, de Oliveira KPL, Souza-Junior JBF (2021) Identification of trailer heat zones and associated heat stress in weaner pigs transported by road in tropical climates. Journal of Thermal Biology 97, 102882.
| Crossref | Google Scholar |
Mader TL, Davis MS, Kreikemeier WM (2005) Tympanic temperature and behavior associated with moving feedlot cattle. The Professional Animal Scientist 21, 339-344.
| Crossref | Google Scholar |
Marcato F, van den Brand H, Kemp B, Engel B, Wolthuis-Fillerup M, van Reenen K (2020) Effects of pretransport diet, transport duration, and type of vehicle on physiological status of young veal calves. Journal of Dairy Science 103, 3505-3520.
| Crossref | Google Scholar | PubMed |
Meat Livestock Australia (N.D.) Transportation. Available at https://www.mla.com.au/research-and-development/animal-health-welfare-and-biosecurity/transportation/ [Accessed 6 April 2023]
Meléndez DM, Marti S, Haley DB, Schwinghamer TD, Schwartzkopf-Genswein KS (2020) Effect of transport and rest stop duration on the welfare of conditioned cattle transported by road. PLoS ONE 15, e0228492.
| Crossref | Google Scholar | PubMed |
Nielsen BL, Dybkjær L, Herskin MS (2011) Road transport of farm animals: effects of journey duration on animal welfare. Animal 5, 415-427.
| Crossref | Google Scholar | PubMed |
Nielsen SS, Alvarez J, Bicout DJ, Calistri P, Canali E, Drewe JA, Garin-Bastuji B, Gonzales Rojas JL, Gortazar Schmidt C, Michel V, Miranda Chueca MA, Padalino B, Pasquali P, Roberts HC, Spoolder H, Stahl K, Velarde A, Viltrop A, Winckler C, Earley B, Edwards S, Faucitano L, Marti S, de La Lama GCM, Costa LN, Thomsen PT, Ashe S, Mur L, Van der Stede Y, Herskin M (2022) Welfare of cattle during transport. EFSA Journal 20, 7442.
| Crossref | Google Scholar |
Parker AJ, Hamlin GP, Coleman CJ, Fitzpatrick LA (2003) Quantitative analysis of acid-base balance in Bos indicus steers subjected to transportation of long duration. Journal of Animal Science 81, 1434-1439.
| Crossref | Google Scholar | PubMed |
Pascual-Alonso M, Miranda-de la Lama GC, Aguayo-Ulloa L, Villarroel M, Mitchell M, Marıa GA (2017) Thermophysiological, haematological, biochemical and behavioural stress responses of sheep transported on road. Journal of Animal Physiology and Animal Nutrition 101, 541-551.
| Crossref | Google Scholar | PubMed |
Pettiford SG, Ferguson DM, Lea JM, Lee C, Paull DR, Reed MT, Hinch GN, Fisher AD (2008) Effect of loading practices and 6-hour road transport on the physiological responses of yearling cattle. Australian Journal of Experimental Agriculture 48, 1028-1033.
| Crossref | Google Scholar |
Schaefer AL, Jones SD, Stanley RW (1997) The use of electrolyte solutions for reducing transport stress. Journal of Animal Science 75, 258-265.
| Crossref | Google Scholar | PubMed |
Schwartzkopf-Genswein K, Ahola J, Edwards-Callaway L, Hale D, Paterson J (2016) Symposium paper: transportation issues affecting cattle well-being and considerations for the future. The Professional Animal Scientist 32, 707-716.
| Crossref | Google Scholar |
Stockman CA, Collins T, Barnes AL, Miller D, Wickham SL, Beatty DT, Blache D, Wemelsfelder F, Fleming PA (2011) Qualitative behavioural assessment and quantitative physiological measurement of cattle naïve and habituated to road transport. Animal Production Science 51, 240-249.
| Crossref | Google Scholar |
Swanson JC, Morrow-Tesch J (2001) Cattle transport: historical, research, and future perspectives. Journal of Animal Science 79(E-Suppl.), E102-E109.
| Crossref | Google Scholar |
Tarrant PV, Kenny FJ, Harrington D, Murphy M (1992) Long distance transportation of steers to slaughter: effect of stocking density on physiology, behaviour and carcass quality. Livestock Production Science 30, 223-238.
| Crossref | Google Scholar |
Thom EC (1959) The discomfort index. Weatherwise 12, 57-61.
| Crossref | Google Scholar |
Troxel TR, Gadberry MS, Beck PA (2016) Temperature, relative humidity, and dew point of 6 commercial trailer compartments during summer transportations of beef calves in the mid-South. The Professional Animal Scientist 32, 461-469.
| Crossref | Google Scholar |
Van de Water G, Verjans F, Geers R (2003) The effect of short distance transport under commercial conditions on the physiology of slaughter calves; pH and colour profiles of veal. Livestock Production Science 82, 171-179.
| Crossref | Google Scholar |
Western Australia Government (2022) Take action to protect livestock heat during transport. Available at https://www.wa.gov.au/government/announcements/take-action-protect-livestock-heat-during-transport [Accessed 6 April 2023]