

Relationships among gastrointestinal mucosal densities of mast cells and eosinophils, helminth infection and diarrhoea in sheep
X. Y. Niu A , S. M. Liu B , J. C. Greeff B C , D. G. Palmer C and G. B. Martin B *
A
B
C
Abstract
Diarrhoea linked to helminth resistance is a major problem in sheep health.
To test whether the distribution of mast cells and eosinophils along the gastrointestinal tract is related to helminth resistance and to susceptibility to diarrhoea.
At weaning, lambs were selected according to extreme (high or low) estimated breeding values for diarrhoea score (50 lambs per genotype, balanced for sex), and for faecal worm egg counts (FWEC). They grazed in single-sex groups in separate but similar enclosures under normal farm conditions (dry summer, wet winter) from autumn until spring, during which time diarrhoea score and FWEC were recorded monthly. Lambs that presented extreme phenotypic values for diarrhoea score and FWEC in August and September were slaughtered (n = 38) at the age of 14 months. For the abomasum, duodenum, ileum, jejunum, caecum and colon, we recorded the densities of eosinophils and mast cells, the number of helminths, their species and developmental stages. The data were pooled across enclosures/sexes and regression analysis was used to assess the relationships among pre-slaughter phenotype, helminth counts, and densities of mast cells and eosinophils.
Eosinophil density was five- to seven-fold greater in the ileum and jejunum than in the abomasum, duodenum, or colon. Mast cell density was greatest in the abomasum and duodenum, and gradually declined along the jejunum, ileum, caecum and colon. In the most immunologically active site, the jejunum, increasing eosinophil density was related to a decrease in the number of helminths (P < 0.05). Similarly, in the next most active site, the abomasum, increasing eosinophil density was related to decreases in the numbers of fourth-stage larvae and the total number of helminths (P < 0.05). In the abomasum, increasing mast cell density was related to declines in the numbers of Teladorsagia circumcincta, total helminth counts (P < 0.05) and FWEC, but was not related to diarrhoea score.
Cell-mediated immune mechanisms in the gastrointestinal mucosa enhance resistance to internal parasites but also increase susceptibility to the diarrhoea in sheep.
Eosinophil and mast cell responses to helminth infection help explain ‘hypersensitivity diarrhoea’.
Keywords: abomasum, diarrhoea, duodenum, eosinophils, gastro-intestinal worms, helminth resistance, immune system, jejunum, mast cells, Merino sheep.
Introduction
Diarrhoea (or ‘scouring’) caused by helminth infections is a widespread problem for sheep in the winter-rainfall regions of Australia and New Zealand. In addition to the direct effects of the infection on productivity, diarrhoea causes the perianal accumulation of faeces that attracts blow flies (Lucilia cuprina), leading to myiasis, an affliction that can be fatal to Merino sheep (Blood and Studdert 1988). This helminth–flystrike complex requires intensive monitoring, chemical treatment and hygiene management (removal of the perianal wool by crutching). Shephard et al. (2022) estimated that helminth infections cost the Australian sheep industry A$665 m in direct productivity losses, plus another A$324 m due to ‘breech’ flystrike. Furthermore, after sheep leave the farm, diarrhoea continues to be a critical issue because the abattoirs show zero tolerance to faecal contamination of the carcass to mitigate public health risk.
The helminth–flystrike complex is becoming increasingly difficult to manage because the helminths continually develop resistance to anthelmintic medication, and the regulation of chemical residues in meat and wool continues to tighten as markets demand residue-free products (Savage and Russell 1999). In any case, anthelmintic treatment offers only a short-term benefit and does not prevent continuous diarrhoea in strategic worm-control programs (Larsen et al. 1999; Jacobson et al. 2009a). For Australia, two major industries (wool and sheep meat), with a combined estimated value of about A$6 billon per annum, are at risk.
One long-term solution is to breed sheep that are resistant to both helminth infection and the development of diarrhoea. Helminth resistance is a heritable trait (Woolaston 1992) and selecting for helminth resistance has been shown to be highly effective, driving the burden of mature Trichstronglyus spp. down by 60% and reducing the average faecal worm egg count (FWEC) by 85% in the Rylington Merino flock (Karlsson and Greeff 2007; Kemper et al. 2010; Greeff et al. 2019). Similarly, diarrhoea score (DS; or ‘dag score’), is also a heritable trait (Greeff et al. 2013). However, Karlsson et al. (2004, 2005) showed that the helminth-resistant sheep were more prone to diarrhoea than were unselected controls, suggesting that some sheep are hypersensitive to the presence of only small numbers of worm larvae, a phenomenon termed ‘larval hypersensitivity diarrhoea’ (Larsen 1997; Meeusen 1999; Jacobson et al. 2009b). In young parasite-naïve sheep, gastrointestinal parasites can cause diarrhoea by directly disrupting the gastrointestinal mucosal architecture. However, in mature sheep, an inflammatory immune response is more likely to follow exposure to helminth larvae rather than mature helminths (Larsen et al. 1994; Jacobson et al. 2009b; Williams et al. 2010a, 2010b; Williams and Palmer 2012).
With hypersensitivity reactions, tissues are infiltrated by eosinophilic granulocytes (eosinophils) and mast cells, and infection with metazoan parasites is commonly associated with eosinophilic inflammatory responses. It has been challenging to characterise hypersensitivity reactions with parasitic infection in the gastrointestinal tract (Mitchell 1980), although the presence of mast cells seems to be a good indicator of both hypersensitivity and the release of the inflammatory mediators that cause intestinal hyper-motility, and thus diarrhoea, in humans and sheep (Spiller 2006; Williams and Palmer 2012). This relationship is supported by mouse experiments showing that mast cells are needed for oral allergens to induce diarrhoea (Brandt et al. 2003).
It seems that sheep with the extreme genotypes for FWEC and diarrhoea would display the full spectrum of immune responses in the gut, thus offering an opportunity to test whether the hypersensitivity reactions caused by larval intake are related to the immune-cell responses in the gastrointestinal mucosa (Larsen et al. 1999; Jacobson et al. 2009b).
Materials and methods
The use of the animals and the experimental procedures were approved (Approval AEC 17-1-02) by the Institutional Animal Ethics Committee of the Department of Primary Industries and Regional Development (DPIRD), Western Australia, under the Guidelines of the National Health and Medical Research Council’s Australian Code of Practice for the Care and Use of Animals for Scientific Purposes.
Animals and experimental design
All sheep were maintained on the DPIRD sheep research station near Katanning in Western Australia (33.69129S, 117.6117E). They were sourced from the helminth-resistant Rylington Merino flock and the breech-strike genetic-resource flock (Karlsson and Greeff 2007; Greeff et al. 2014). The two flocks were managed as a single unit to ensure that all animals were exposed to the same environmental conditions, although, at weaning, the lambs were separated into two single-sex groups that were held in adjacent fields for the duration of the experiment (thus, sex and field were confounded).
Animal management, experimental design, and the two-stage process for selection of the 38 animals that were finally used for tissue analysis, are illustrated in Fig. 1, and detailed by Greeff et al. (2020). Briefly, the severity of diarrhoea was recoded as diarrhoea score (DS; the same as ‘dag score’), a measure of the accumulation of faecal matter around the breech (ranging from 1 for no soiling to 5 for watery diarrhoea extending right down the hind legs to the pasterns). Worm eggs were counted in faeces using the McMaster technique (Whitlock 1948; Hutchinson 2009).
Schema illustrating the experimental protocol, including the two-stage process of selection of experimental animals.
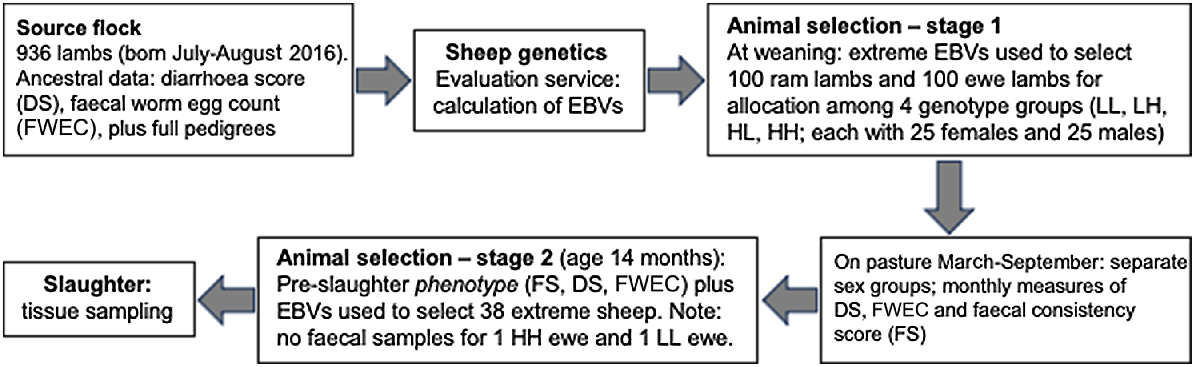
For the present experiment, the original source flock comprised 936 lambs born in July/August 2016 (Fig. 1). Data for DS and FWEC that had been recorded in previous years on all ancestors and relatives, along with full pedigrees, were forwarded to Australia’s national sheep genetic-evaluation service (Sheep Genetics; https://www.sheepgenetics.org.au), where estimated breeding values (EBVs) for DS and FWEC were estimated using best linear unbiased prediction (BLUP) mixed-model methodology (Henderson 1975). Because FWEC and DS are both heritable traits, their EBVs give the best indication of the experimental sheep’s genetic resistance to gastrointestinal worms and propensity to develop diarrhoea. At weaning in March, mid-parent EBVs for FWEC and DS were used to select 100 ram lambs and 100 ewe lambs that presented extreme high or low values (Fig. 1). Thus, the following four genotype groups were established: high DS plus high FWEC (HH), high DS plus low FWEC (HL), low DS plus high FWEC (LH), and low DS plus low FWEC (LL), with each group containing 25 males and 25 females. The rams and ewes were maintained in adjacent enclosures and may have been presented with different worm challenges.
For all experimental animals, FWEC, DS and faecal consistency score (FS; score 1 being normal hard pellets and score 5 being watery diarrhoea) were measured at weaning (March; age of 8 months) and then again in May, June (rams only), July (ewes only), August and September. We used two measures of faecal assessment because FS indicates the level of diarrhoea at a specific point in time, whereas DS indicates an animal’s propensity to develop diarrhoea over a longer period.
Importantly, for all three traits, the repeatability across seasons is low because animals can recover from a bout of diarrhoea or a worm challenge and those recoveries can vary substantially. We wanted to study the cellular processes in play at the time of slaughter so, in Stage 2 (Fig. 1), we used the final measurements of phenotype (DS, FS, FWEC) to select 20 rams and 20 ewes for tissue analysis (Table 1) from each cohort (HH, HL, LH, LL) of the 100 selected rams and 100 selected ewes. However, only 18 extreme ewes could be identified; therefore, an additional two rams were selected, resulting in 18 ewes and 22 rams. No faecal samples could be collected from one HH ewe and one LL ewe; so, in the absence of their FWEC data, a total of 38 sheep with complete data remained in the experiment.
| Genotype | Enclosure 1 (rams) | Enclosure 2 (ewes) | |||||||
|---|---|---|---|---|---|---|---|---|---|
| n | FWEC | FS | DS | n | FWEC | FS | DS | ||
| High DS, high FWEC (HH) | 3 | 1333Ab ± 1319 | 4.0 ± 0.0 | 4.8A ± 0.5 | 3 | 687Aa ± 347 | 4.0 ± 0.0 | 4.0A ± 1.1 | |
| High DS, low FWEC (HL) | 5 | 90Bb ± 74 | 4.2 ± 0.8 | 4.2A ± 0.8 | 4 | 240A ± 222 | 3.8 ± 0.4 | 3.9A ± 0.9 | |
| Low DS, high FWEC (LH) | 6 | 630Ab ± 346 | 3.2 ± 1.1 | 1.5B ± 0.4 | 6 | 2790B ± 2671 | 3.4 ± 0.9 | 1.7B ± 0.4 | |
| Low DS, low FWEC (LL) | 7 | 30Bb ± 27 | 3.4 ± 0.9 | 1.7B ± 0.6 | 4 | 283Aa ± 448 | 4.0 ± 0.0 | 1.8B ± 0.7 | |
All values are mean ± s.d.
Within a column, different upper-case (P < 0.01) and lower-case (P < 0.05) letters indicate signicant differences among the values.
Measurements and sampling
The sheep were slaughtered in September 2017 and tissues were collected from the various segments along the gastrointestinal tract (GIT). Faecal samples collected from the rectum were used to measure FS and FWEC.
Trichostrongylus axei and Teladorsagia circumcincta are common parasites in the abomasum of sheep, whereas Trichostrongylus colubriformis and other Trichostrongylus spp. commonly live in the first 3 m of the small intestine. These helminths can cause damage to the lining of the gut (Larsen et al. 1999), so the luminal contents of the abomasum and the contents of the full length of the small intestine (duodenum, jejunum and ileum) were collected separately. In addition, the abomasal mucosa was digested with pepsin to collect all histotrophic immature stages of the parasites, as outlined by Hutchinson (2009). The gastrointestinal contents were then thoroughly washed through 38 μm mesh sieves to allow collection of all fourth-stage larvae (L4), and immature and mature helminths. Each species of helminth was counted (Ministry of Agriculture, Fish and Food (MAFF) 1986) and Trichostrongylus spp. and Teladorsagia circumcincta were dominant. The numbers of other genera (Haemonchus and Nematodirus) were low in all sheep.
The GIT was then rinsed with saline and about 3 cm2 of tissue was sampled from the abomasum (at the distal end), duodenum (close to the distal end), jejunum (about 3 m away from the proximal end), ileum (in the middle), caecum (at the distal end) and colon (in the middle).
Histology
Tissue samples were cut into 1 cm2 pieces and fixed in 10% neutral-buffered formalin (10% NBF) for at least 24 h, then processed through routine dehydration and embedding in paraffin blocks (Sakura Tissue-Tek TEK 5 Embedding Station, Sakura Corporation, USA). The samples were sectioned at 5 μm by using a Leica RM2235 Manual Microtome (Leica Corporation, Australia), dewaxed and stained. To readily distinguish eosinophils and mast cells, the following two staining protocols were applied separately:
Eosinophils: before staining, all slides were dewaxed and hydrated through graded ethanol (Leica AutoStainer XL, Leica Corporation, Australia) before immersion in tap water. They were then immersed in haematoxylin for 5 s at 25°C to dye the nuclei, and rinsed under running tap water for 5 min, before staining with Chromotrope 2R following the protocol of Lendrum (1944). The Chromotrope 2R solution was prepared by adding 1 g phenol (Sigma-Aldrich, Australia) to 100 mL distilled water (Milli-Q® Synthesis, Merck Corporation, Australia), followed by the addition of 0.5 g Chromotrope 2R (Sigma-Aldrich). The slides were immersed in this solution for 1 h at 25°C, washed thoroughly with tap water, dehydrated with ethanol, and mounted in a synthetic resin. Haematoxylin-counterstained eosinophils were identified by their nuclei: approximately 5 μm in diameter, typically bilobed (and round or oval shaped), with the euchromatin located in the centre of the nucleus. The nuclei were stained blue, whereas the cytoplasm was stained bright red by Chromotrope 2R (Pawlina and Ross 2016);
Mast cells: as described above for eosinophils, all slides were dewaxed, hydrated and rinsed in tap water. The sections were stained with 0.5% toluidine blue (pH 0.5) that had been prepared by dissolving 0.5 g toluidine blue (Sigma-Aldrich) into 100 mL 0.5 M HCl (pH 0.5). The slides were immersed in this solution for 5 days at 25°C, during which period the stain solution was filtered every other day to avoid dye precipitates. The slides were then washed thoroughly with tap water and counter-stained with 1% eosin in 70% ethanol for 20 s, as described by Wingren and Enerback (1983). Mast cells were identified by the dark metachromatic purple/red staining of the granules with toluidine blue, and by being larger than eosinophils (diameter 8–10 μm) and ovoid with a spherical nucleus (Pawlina and Ross 2016). We did not distinguish between tissue mast cells and globule leukocytes because, functionally, they are very similar effector cells (Robinson et al. 2010).
For each sheep, mucosal eosinophils and mast cells were counted under a microscope (×40, Olympus BX50 fluorescence microscope, Olympus Corporation, Japan) in 10 random fields from each slide of tissue sampled along the GIT (~0.23 mm2 per field). Cell counts were converted to cell densities (cells mm−2).
Calculation and statistical analyses
All data for FWEC and helminth counts were log-transformed after adding 10 to each value of each independent trait to remove zeros. The transformed data were analysed with ASReml by using a linear model approach (Gilmour et al. 2015). The rams and ewes had been held in separate enclosures, so sex and enclosure were confounded. The data were therefore initially analysed separately for each sex/enclosure. FWEC group (high and low) and FS group (high and low) were fitted as fixed independent variables, with the number of eosinophils and mast cells at the different sites along the GIT as dependent variables. There were no significant differences between FWEC groups or between FS groups, and no significant interactions between FWEC × FS groups within sex/enclosure. These outcomes are not presented. To overcome the small numbers of animals per treatment cell, the data were pooled across sex/enclosure and the data were re-analysed after expanding the model to include the interactions between sex/enclosure and FWEC groups and between sex/enclosure and FS groups. A significant (P < 0.001) three-way interaction was found for FWEC × FS × GIT. However, no clear trends for differences between extremes could be observed, so we decided to use a different statistical approach by assuming that the underlying physiological processes are most likely to be similar in the two enclosures. The data were pooled and densities of mast cells and eosinophils were fitted at the various GIT sites as independent variables (covariates) with and FS and helminth numbers as dependent variables, as follows:
where yijk is the helminth- or FS-responsive trait for each sheep, μ is the overall mean, enclosurei is the sex/enclosure effect of the ith sheep, eosinophil (all GIT sitesj) is the eosinophil densities in jth gastrointestinal tissue, mast cell (all GIT sitesk) is the mast cell densities in kth gastrointestinal tissue, and eijk is the residual.
During a series of analyses, all non-significant, independent, helminth and diarrhoea variables were sequentially removed from the model until the model contained only significant factors. The log-transformed results were then back-transformed to obtain the predicted means and standard errors of the predicted means. Effects were declared as ‘significant’ when P < 0.05. Obviously, sex and enclosure were confounded but we are reporting effects of sex/enclosure as an indicator of whether the H and L differences reflect similar cellular mechanisms in rams and ewes.
Results
Description of the selected sheep
Table 1 shows the number of animals and the average values for FWEC, FS and DS, at the time of slaughter for the four genotype groups, for both enclosures/sexes. Among enclosure/ram groups, the FWEC value for HH and LH exceeded that for HL and LL (P < 0.05), whereas the values for HH and LH and HL and LL did not differ significantly. Among enclosure/ewe groups, the FWEC value for LH exceeded the values for HH, HL and LL (P < 0.05). There were no significant differences in FS among enclosure/ram groups or among enclosure/ewe groups. In both enclosure/ram and enclosure/ewe groups, DS values were greater for HH and HL than for LH and LL (P < 0.05). These differences among genotype groups largely reflected the EBV-based extremes identified in Selection stage 1 (March), 6 months before slaughter. However, it is important to remember that the outputs of the analyses described below, that were used to test the hypothesis, were based on final phenotype measurements at the time of slaughter, and not on the genotype groups.
Table 2 shows that, on average, there were low to moderate numbers of mature and immature helminths in both the abomasum and the small intestine. However, some individual sheep had heavy burdens, with up to 6000 mature Tel. circumcincta individuals in the abomasum and up to 14,000 mature Trichostrongylus spp. individuals in the small intestine. In some individuals, large numbers of L4 larvae were also observed in the abomasum, indicating a high-challenge environment. For all mean counts, the high standard deviations were large, reflecting the wide variation among individual sheep.
| Trait | Mean ± s.d. | |
|---|---|---|
| Abomasum L4 | 19,840 ± 20,070 | |
| Abomasum Teladorsagia circumcincta immature | 294 ± 487 | |
| Abomasum Trichostrongylus spp. immature | 169 ± 340 | |
| Abomasum immature total | 464 ± 697 | |
| Abomasum Teladorsagia circumcincta mature | 876 ± 1514 | |
| Abomasum Trichostrongylus spp. mature | 823 ± 923 | |
| Abomasum mature total | 1700 ± 1828 | |
| Abomasum total | 22,005 ± 21,877 | |
| Small intestine L4 A | 1489 ± 1801 | |
| Small intestine Trichostrongylus spp. immature | 360 ± 503 | |
| Small intestine Trichostrongylus spp. mature | 3078 ± 3319 | |
| Small intestine total | 4928 ± 4874 | |
| Total worm count | 26,934 ± 25,955 |
Eosinophils and mast cells in GIT tissues
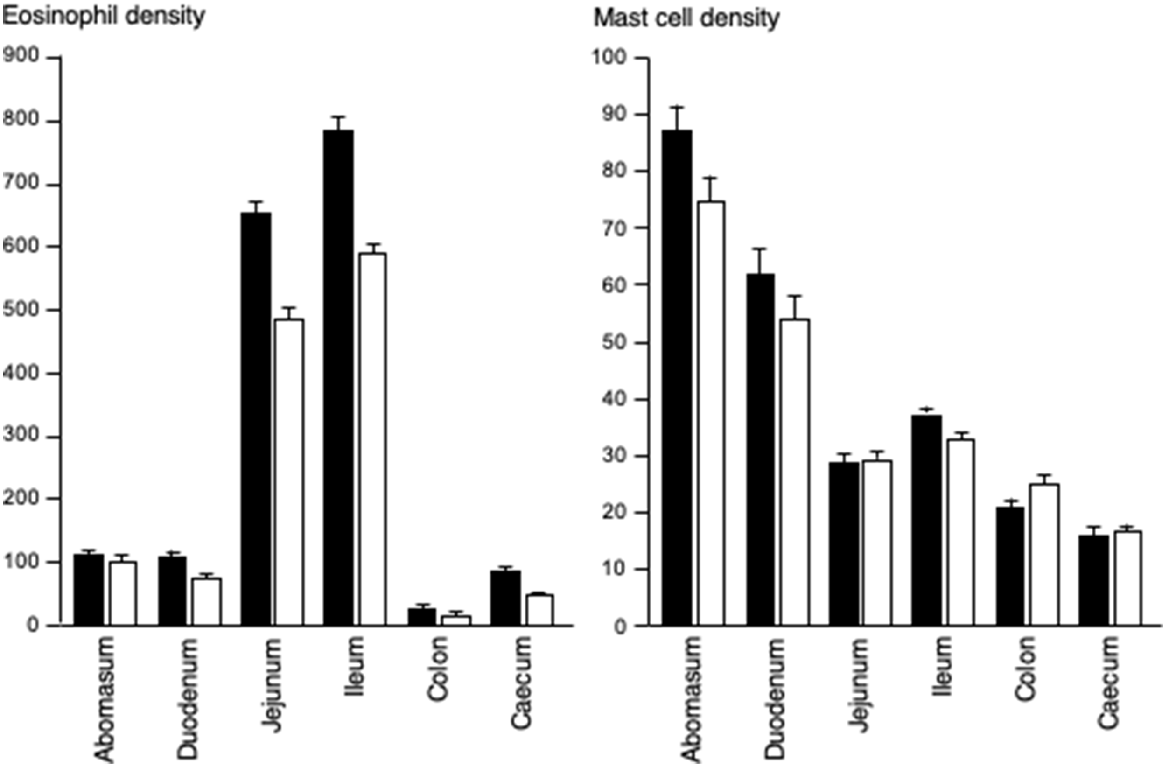
The densities of eosinophilic granulocytes and mast cells in the abomasum, duodenum, jejunum, ileum, caecum and colon were generally greater in the enclosure/ram group than in the enclosure/ewe group, but the pattern along the GIT was similar for both enclosure/sex groups (Fig. 2). The greatest densities of eosinophils were seen in the ileum and jejunum, where cell densities were five to seven times greater than in the abomasum and duodenum. The colon had the fewest eosinophils. Generally, the eosinophil densities were greater in the enclosure/ram groups than in the enclosure/ewe group, especially in the duodenum (P < 0.05), ileum (P < 0.05) and jejunum (P < 0.05). The density of mast cells in the abomasum was similar to the density of eosinophilic granulocytes, but gradually decreased with progress along the small and large intestines.
Links among densities of eosinophils and mast cells, helminth counts, and diarrhoea score
There was a significant (P < 0.001) three-way interaction (FWEC × FS × GIT). The predicted means are shown in Table 3. Apart from the obvious differences in counts at the different GIT sites, no clear differences could be observed among treatments. As explained above, these outcomes may have been due to the combination of small group sizes and measurement errors in cell densities.
| FWEC | FS | GIT segment | Enclosure A | Enclosure B | |||||||||
|---|---|---|---|---|---|---|---|---|---|---|---|---|---|
| n | Eosinophil | Mast cell | n | Eosinophil | Mast cell | ||||||||
| Mean | s.e. | Mean | s.e. | Mean | s.e. | Mean | s.e. | ||||||
| High | High | Abomasum | 6 | 12.2 | 5.84 | 18.8 | 2.14 | 4 | 14.6 | 8.18 | 14.3 | 1.44 | |
| High | Low | Abomasum | 5 | 26.6 | 5.22 | 25.5 | 1.91 | 5 | 28.1 | 8.56 | 33.2 | 1.52 | |
| Low | High | Abomasum | 5 | 30.0 | 5.22 | 17.5 | 1.91 | 5 | 31.7 | 8.96 | 13.0 | 1.58 | |
| Low | Low | Abomasum | 5 | 29.0 | 6.74 | 13.6 | 2.47 | 3 | 36.6 | 8.96 | 26.7 | 1.58 | |
| High | High | Deodenum | 6 | 15.2 | 5.84 | 11.0 | 2.14 | 4 | 13.6 | 8.18 | 10.7 | 1.44 | |
| High | Low | Deodenum | 5 | 22.0 | 5.22 | 25.9 | 1.91 | 5 | 34.5 | 8.56 | 31.0 | 1.52 | |
| Low | High | Deodenum | 5 | 20.0 | 5.22 | 7.9 | 1.91 | 5 | 43.5 | 8.96 | 5.8 | 1.58 | |
| Low | Low | Deodenum | 5 | 24.8 | 6.74 | 9.5 | 2.47 | 3 | 16.0 | 8.96 | 15.3 | 1.58 | |
| High | High | Jejenum | 6 | 63.5 | 5.84 | 10.4 | 2.14 | 4 | 102.6 | 8.18 | 9.7 | 1.44 | |
| High | Low | Jejenum | 5 | 119.2 | 5.22 | 6.7 | 1.91 | 5 | 200.2 | 8.56 | 6.8 | 1.52 | |
| Low | High | Jejenum | 5 | 145.5 | 5.22 | 5.9 | 1.91 | 5 | 172.7 | 8.96 | 6.4 | 1.58 | |
| Low | Low | Jejenum | 5 | 148.4 | 6.74 | 9.5 | 2.47 | 3 | 152.4 | 8.96 | 9.3 | 1.58 | |
| High | High | Ileum | 6 | 130.1 | 5.84 | 12.3 | 2.14 | 4 | 169.1 | 8.18 | 13.0 | 1.44 | |
| High | Low | Ileum | 5 | 130.7 | 5.22 | 10.8 | 1.91 | 5 | 211.1 | 8.56 | 10.8 | 1.52 | |
| Low | High | Ileum | 5 | 134.5 | 5.22 | 4.6 | 1.91 | 5 | 184.3 | 8.96 | 5.5 | 1.58 | |
| Low | Low | Ileum | 5 | 184.5 | 6.74 | 6.8 | 2.47 | 3 | 189.4 | 8.96 | 12.1 | 1.58 | |
| High | High | Colon | 6 | 12.1 | 5.84 | 3.6 | 2.14 | 4 | 16.7 | 8.18 | 3.3 | 1.44 | |
| High | Low | Colon | 5 | 22.2 | 5.22 | 6.7 | 1.91 | 5 | 34.5 | 8.56 | 6.6 | 1.52 | |
| Low | High | Colon | 5 | 11.9 | 5.22 | 4.7 | 1.91 | 5 | 20.6 | 8.96 | 4.0 | 1.58 | |
| Low | Low | Colon | 5 | 7.9 | 6.74 | 4.8 | 2.47 | 3 | 16.9 | 8.96 | 4.7 | 1.58 | |
| High | High | Caecum | 6 | 2.4 | 5.84 | 8.3 | 2.14 | 4 | 4.2 | 8.18 | 6.5 | 1.44 | |
| High | Low | Caecum | 5 | 7.1 | 5.22 | 9.3 | 1.91 | 5 | 13.9 | 8.56 | 7.4 | 1.52 | |
| Low | High | Caecum | 5 | 1.2 | 5.22 | 4.0 | 1.91 | 5 | 2.1 | 8.96 | 3.4 | 1.58 | |
| Low | Low | Caecum | 5 | 5.3 | 6.74 | 7.3 | 2.47 | 3 | 6.9 | 8.96 | 6.6 | 1.58 | |
| s.e. of difference | 7.7 | 2.8 | 11.3 | 2.0 | |||||||||
FWEC, faecal worm egg count; FS, faecal consistency score; GIT, gastrointestinal tract.
We therefore used a regression analysis and it was more informative. As shown in Table 4, for each section of the GIT, there is clear evidence of links between eosinophil and mast cell densities and helminth developmental stages, and for FWEC and DS. Eosinophil density in the abomasum was significantly related to numbers of L4 larvae and total helminth counts in the abomasum, to total helminth accounts in the small intestine, and to total helminth accounts for the entire GIT (P < 0.05). Eosinophil density in the jejunum was significantly related to total numbers of immature and mature helminths in the abomasum and total helminth count in the GIT (P < 0.05). The density of mast cells in the abomasum was significantly related to total helminth count in the abomasum (P < 0.05). In the duodenum, the density of mast cells was related to the numbers of L4 larvae and total helminth count in the small intestine (P < 0.05). With respect to diarrhoea, the density of mast cells in the abomasum was significantly related to FS (P < 0.05), and the densities of eosinophils in the jejunum, caecum and colon were all significantly related to DS (P < 0.05).
| Trait | Encl | Abomasum | Duodenum | Jejunum | Ileum | Caecum | Colon | Interaction significance | ||||||||
|---|---|---|---|---|---|---|---|---|---|---|---|---|---|---|---|---|
| Eosin | Mast | Eosin | Mast | Eosin | Mast | Eosin | Mast | Eosin | Mast | Eosin | Mast | |||||
| log (total Abom L4) | 7.4** | 4.5* | n.s. | n.s. | n.s. | n.s. | n.s. | n.s. | n.s. | n.s. | n.s. | n.s. | n.s. | n.s. | ||
| log (total Abom Tel immature) | 26.0*** | n.s. | n.s. | n.s. | n.s. | 5.6* | n.s. | n.s. | n.s. | n.s. | n.s. | n.s. | 7.5** | n.s. | ||
| log (total Abom Trich immature) | 4.3* | n.s. | n.s. | n.s. | n.s. | 9.7** | n.s. | n.s. | n.s. | n.s. | n.s. | n.s. | n.s. | n.s. | ||
| log (total Abom immature) | 23.6*** | n.s. | n.s. | n.s. | n.s. | 12.6** | n.s. | n.s. | n.s. | n.s. | n.s. | n.s. | n.s. | n.s. | ||
| log (total Abom Tel mature) | 17.7*** | n.s. | 4.7* | n.s. | n.s. | 4.5* | n.s. | n.s. | n.s. | n.s. | n.s. | n.s. | n.s. | n.s. | ||
| log (total Abom Trich mature) | n.s. | 5.4* | n.s. | n.s. | n.s. | n.s. | n.s. | n.s. | n.s. | n.s. | n.s. | n.s. | n.s. | n.s. | ||
| log (total Abom mature) | 4.7* | n.s. | 5.2* | n.s. | n.s. | 5.9* | n.s. | n.s. | n.s. | n.s. | n.s. | n.s. | n.s. | n.s. | ||
| log (THC Abom) | 7.8** | 4.3* | n.s. | n.s. | n.s. | n.s. | n.s. | n.s. | n.s. | n.s. | n.s. | n.s. | n.s. | n.s. | ||
| log (SI L4) | n.s. | n.s. | n.s. | n.s. | 11.1** | n.s. | n.s. | n.s. | n.s. | n.s. | n.s. | n.s. | n.s. | n.s. | ||
| log (SI Trich immature) | 40.9*** | n.s. | n.s. | 4.8* | 4.4* | n.s. | n.s. | n.s. | n.s. | n.s. | n.s. | n.s. | n.s. | Encl × Eosin Duod | 5.3* (significant) | |
| log (SI Trich mature) | 6.5* | n.s. | n.s. | n.s. | n.s. | 5.9* | n.s. | n.s. | n.s. | n.s. | n.s. | 4.9* | n.s. | n.s. | ||
| log (SI THC) | 7.6** | 5.2* | n.s. | n.s. | 6.9* | n.s. | n.s. | n.s. | n.s. | n.s. | n.s. | n.s. | n.s. | Encl × Eosin Abom | 4.8* (significant) | |
| log (THC in GIT) | 11.1*** | 6.3* | n.s. | n.s. | n.s. | 4.6* | n.s. | n.s. | n.s. | n.s. | n.s. | n.s. | n.s. | Encl × Eosin Abom | 5.9* (significant) | |
| log (FWEC) | n.s. | n.s. | n.s. | n.s. | 6.4* | n.s. | n.s. | n.s. | n.s. | n.s. | n.s. | n.s. | n.s. | n.s. | ||
| log (FS) | n.s. | n.s. | 5.3* | n.s. | n.s. | n.s. | n.s. | n.s. | n.s. | n.s. | n.s. | n.s. | n.s. | n.s. | ||
| log (DS) | n.s. | n.s. | n.s. | n.s. | n.s. | 30.1*** | n.s. | n.s. | n.s. | 9.1** | n.s. | 5.6* | n.s. | n.s. | ||
Total helminth count (THC) = L4 larvae + immature helminths + mature helminths, across all sites.
FWEC, faecal worm egg count; FS, faecal consistency score; DS, diarrhoea score; Duod, duodenum; Abom, abomasum; n.s., non-significant.
***P < 0.001; **P < 0.01; *P < 0.05.
There were only three significant interactions (Table 4). Enclosure/sex was a significant factor for immature Trichostrongylus spp. in the small intestine, and for total helminth count in the small intestine and in the GIT (P < 0.05), probably because the two sexes were managed separately in different fields during the experiment, and therefore experienced different magnitudes of worm challenge.
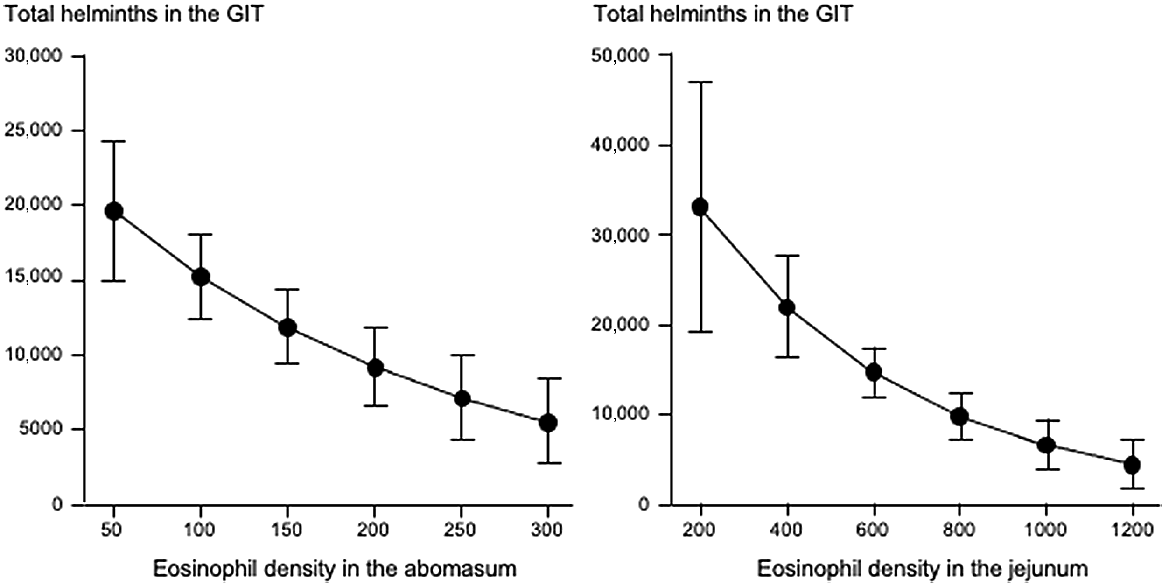
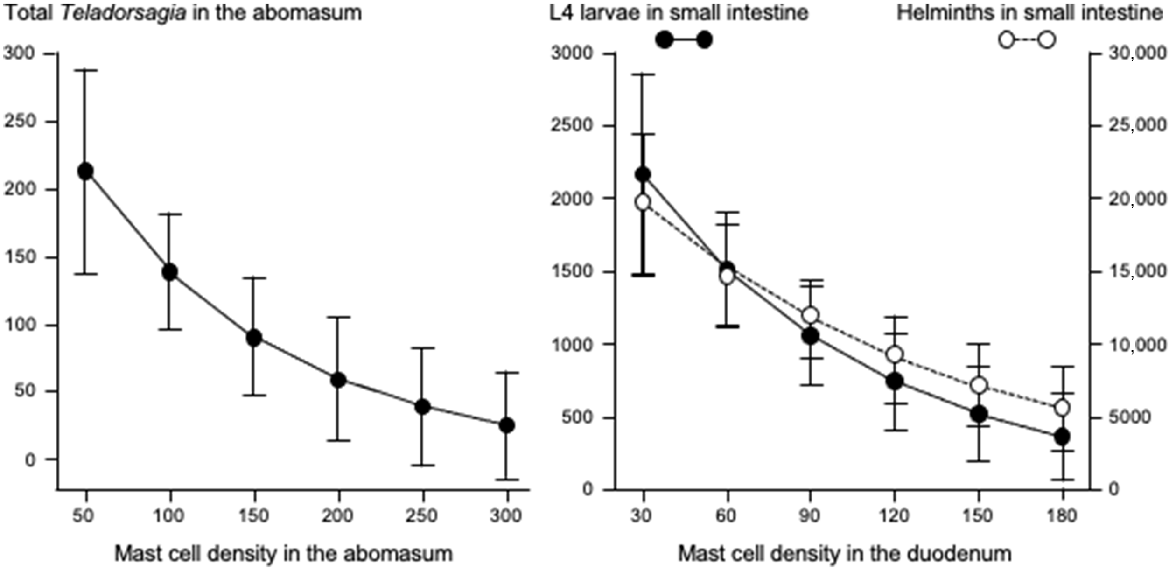
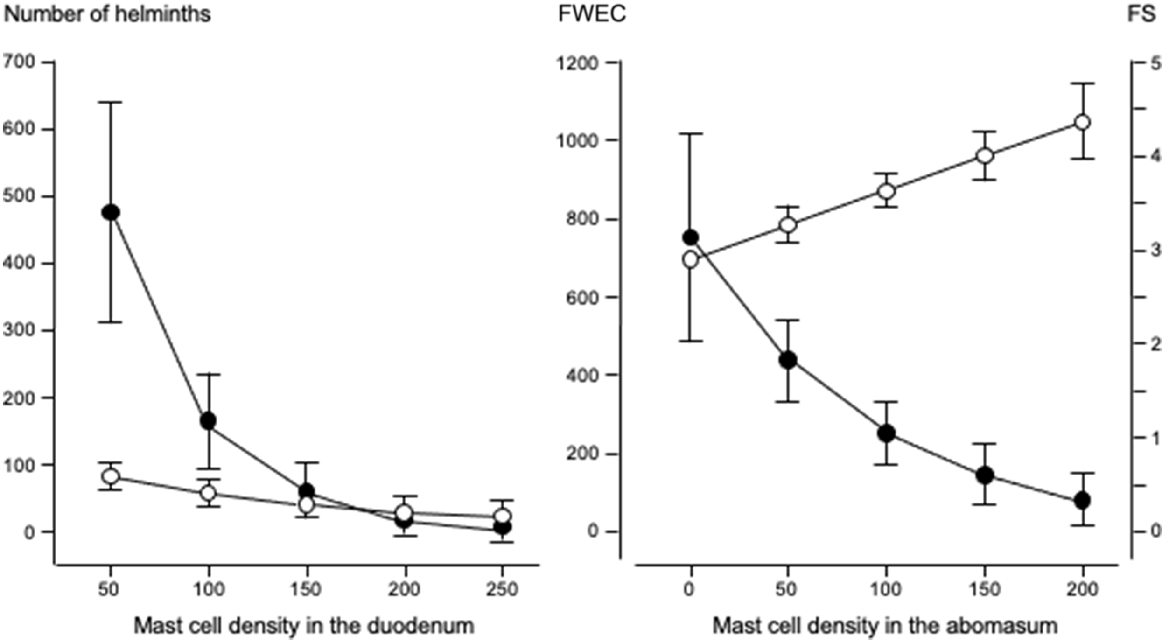
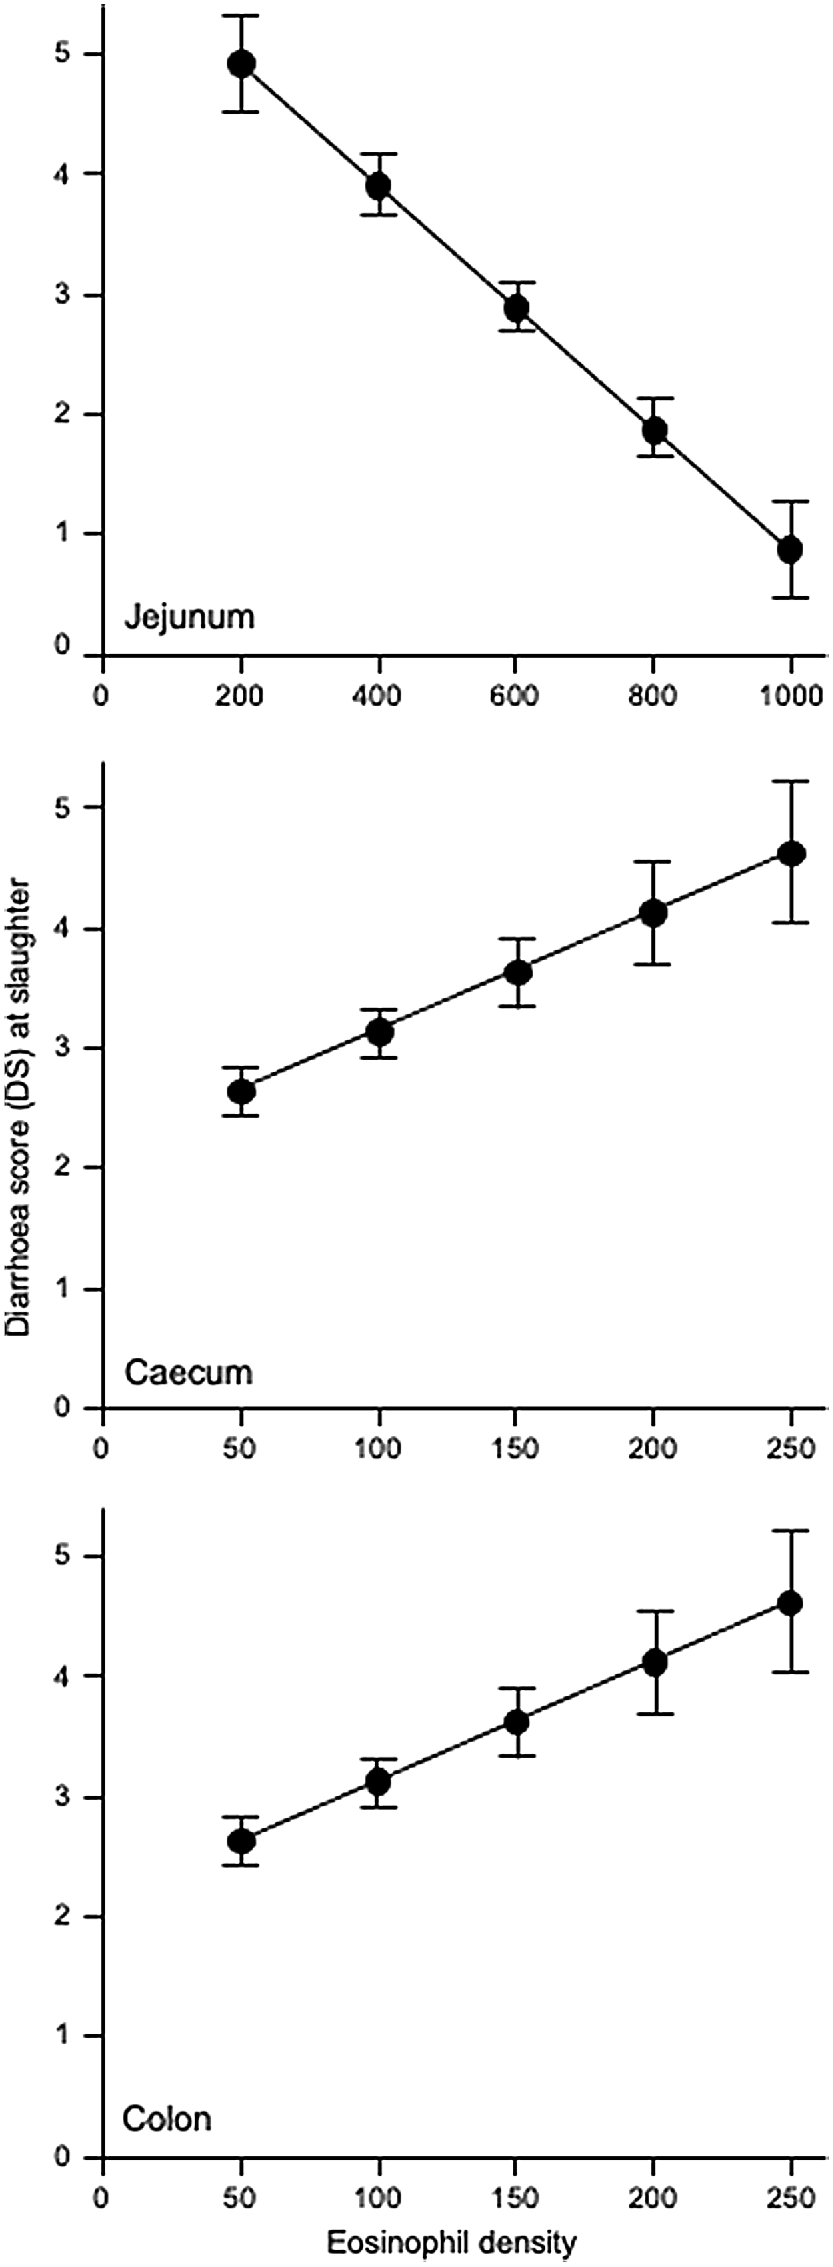
Fig. 3 shows that increases in eosinophil density in the abomasum and jejunum were associated with decreases in the total helminth count in the GIT. Fig. 4 shows that, in the abomasum, as the density of mast cells increased, there was a decrease in the total count of Tel. circumcincta (P < 0.05). Similarly, in the duodenum, as mast cell density increased, there were clear decreases in both the number of L4 larvae and the total helminth count in the small intestine (P < 0.05). Fig. 5 shows as abomasal mast cell density increased, FWEC decreased but FS increased (P < 0.05). Fig. 6 shows that eosinophil density was negatively associated with DS in the abomasum, but positively associated with DS in the caecum and colon.
Left graph shows the relationship between abomasal eosinophil density (cells mm−2) and the total helminth count in the gastrointestinal tract (GIT). Right graphs shows the relationships between jejunal eosinophil density (cells mm−2) and the total helminth count in the GIT. Values are predicted back-transformed means ± s.e.m.
Left graph shows the relationships between mast cell density (cells mm−2) in the abomasum and total count of Tel. circumcincta in the abomasum. Right graph shows the relationships between mast cell density (cells mm−2) in the duodenum and numbers of L4 larvae in small intestine ( ), and total helminth count (
 ) in small intestine. Values are predicted back-transformed means ± s.e.m.
Left graph shows the relationships between duodenal mast cell density (cells mm−2) and the numbers of fourth-stage larvae () and mature helminths ( ). Right graph shows the relationships between abomasal mast cell density (cells mm−2) and faecal consistency score (FS: ), and faecal worm egg count (FWEC: ) in Merino sheep. Values are predicted back-transformed means ± s.e.m.
Discussion
In sheep, the immune cellular responses of the gut to helminth infection seem to be related to the FWEC and diarrhoea phenotypes, with greater densities of eosinophils and mast cells reducing helminth burden but promoting diarrhoea. These findings are relevant to the problem of ‘larval hypersensitivity diarrhoea’, scouring despite low worm-egg counts, that is well-recognised for sheep in the south-west of Western Australia (Jacobson et al. 2009a) and seems to be more prevalent in sheep that are genetically resistant to intestinal helminths (Karlsson et al. 2005).
The genetically resistant sheep used in this investigation have previously been shown to regulate their worm burden, and thus reduce their FWEC, by rejecting adult T. colubriformis and by suppressing development and reducing fecundity in Tel. circumcincta (Kemper et al. 2010). The aim of the present study was to determine whether FWEC and diarrhoea (FS, DS) are associated with differences in eosinophil and mast cell densities. A normal statistical approach (ANOVA) did not show significant differences among the groups, most probably because of the large variance in cellular densities and the small number of animals per treatment. A regression approach showed significant associations. A high mast cell density in the abomasum was associated with a high FS, apparently due to decreases in the number of mature Tel. circumcincta (the dominant species in the abomasum) and the total number of mature helminths. These relationships are consistent with the important role that mast cells are thought to play in the mucosal hypersensitivity response and in the release of inflammatory mediators in the GIT (Pawlina and Ross 2016).
Most eosinophils were seen in the jejunum and ileum. Eosinophils are also involved in the response to helminth infection, although their contribution could be seen as detrimental because of the immune-mediated pathology associated with diarrhoea (Stear et al. 2002; Williams et al. 2010a, 2010b). Our observed distribution of eosinophils and mast cells along the GIT agrees with previous studies (Larsen et al. 1994; Murphy and Weaver 2017). We also noted negative associations between eosinophil density and numbers of helminth in the abomasum, and between eosinophil density in the jejunum and numbers of mature helminths in the abomasum, numbers of mature T. colubriformis in the small intestine, and total helminth count in the GIT. The link between jejunum eosinophils and abomasal counts of Tel. circumcincta has previously been reported by Williams et al. (2010b) who used experimental challenge infections and concluded that both Tel. circumcincta and T. colubriformis can cause immune-mediated diarrhoea in immune sheep. In the present study with naturally infected sheep, we found a positive association between DS and abomasal mast cell density, but a negative association between DS and abomasal eosinophil density, and a positive association between DS and eosinophil density in the lower parts of the GIT (caecum and colon). These observations suggest that mast cells in the abomasum and eosinophils in the large intestine could be involved in the development of diarrhoea in sheep.
Our observations are consistent with mucosal mast cells and eosinophils playing a part in the allergic response to helminth infection. A high density of mast cells in the abomasum and duodenum could be involved in the allergic reactions in the mucus that expel both larvae and more mature helminths, and these reactions may disturb gastrointestinal physiology, leading to the development of diarrhoea. A high density of eosinophils in the upper GIT was associated with small numbers of helminths and a lower FWEC, whereas a high eosinophil density in the lower part of the GIT was associated with a greater tendency to develop diarrhoea. Against expectation, the density of mast cells in the lower GIT was not associated with diarrhoea, perhaps due to their low abundance in these tissues. It is clear that there is room for more research into the role of mast cells and eosinophils in the propensity of helminth-resistant sheep to develop diarrhoea.
Conclusion
Greater densities of eosinophils in the abomasum and jejunum, and a greater density of mast cells in the duodenum, are involved in the immune response to helminth infection and they also help explain a lower FWEC. By contrast, higher densities of eosinophils in the colon and caecum are associated with an increased propensity to develop diarrhoea.
Data availability
The data that support this study will be shared upon reasonable request to the corresponding author.
Declaration of funding
This work was financially supported by the Shanxi Scholarship Council of China (2020-157), and by the Department of Primary Industries and Regional Development, Western Australia.
Acknowledgements
We thank Michael Platten (Histology Laboratory, Perth) and Geoff Cox (Technical Officer, Katanning) from DPIRD for their technical assistance.
References
Brandt EB, Strait RT, Hershko D, Wang Q, Muntel EE, Scribner TA, Zimmermann N, Finkelman FD, Rothenberg ME (2003) Mast cells are required for experimental oral allergen-induced diarrhea. Journal of Clinical Investigation 112, 1666-1677.
| Crossref | Google Scholar | PubMed |
Gilmour AR, Gogel BJ, Cullis BR, Welham SJ, Thompson R (2015) ‘ASReml user guide release 4.1 functional specification.’ (VSN International Ltd: Hemel Hempstead, UK) Available at www.vsni.co.uk
Greeff JC, Karlsson LJE, Schlink AC (2013) Identifying indicator traits for breech strike in Merino sheep in a Mediterranean environment. Animal Production Science 54, 125-140.
| Crossref | Google Scholar |
Greeff JC, Karlsson LJE, Schlink AC (2014) Production benefits of breeding for worm resistance in Merino sheep in a Mediterranean environment. World Congress on Genetics Applied to Livestock Production (Vancouver, Canada) 10, 343-345.
| Google Scholar |
Greeff JC, Liu SM, Palmer DG, Karlsson LJE (2019) Expression of worm resistance in sheep selected for low worm-egg counts fed at maintenance or above-maintenance level. Animal Production Science 59, 1783-1791.
| Crossref | Google Scholar |
Greeff JC, Liu S, Palmer D, Martin GB (2020) Temporal changes in circulatory blood cell parameters of sheep genetically different for faecal worm egg count and diarrhoea from late summer to spring in a Mediterranean environment. Animal Production Science 60, 1630-1642.
| Crossref | Google Scholar |
Henderson CR (1975) Best linear unbiased estimation and prediction under a selection model. Biometrics 31, 423-447.
| Crossref | Google Scholar | PubMed |
Jacobson CL, Bell K, Besier RB (2009a) Nematode parasites and faecal soiling of sheep in lairage: evidence of widespread potential production losses for the sheep industry. Animal Production Science 49, 326-332.
| Crossref | Google Scholar |
Jacobson C, Bell K, Forshaw D, Besier B (2009b) Association between nematode larvae and ‘low worm egg count diarrhoea’ in sheep in Western Australia. Veterinary Parasitology 165, 66-73.
| Crossref | Google Scholar | PubMed |
Karlsson LJE, Greeff JC (2007) Selecting sheep for nematode resistance and correlated responses in dags in a winter rainfall environment. In ‘Proceedings of 17th Conference of the Association for the Advancement of Animal Breeding and Genetics’, New South Wales, Australia. pp. 264–267. (The Association for the Advancement of Animal Breeding and Genetics)
Karlsson LJE, Pollott GE, Eady SJ, Bell A, Greeff JC (2004) Relationship between faecal worm egg counts and scouring in Australian Merino sheep. Animal Production in Australia 25, 100-103.
| Google Scholar |
Kemper KE, Palmer DG, Liu SM, Greeff JC, Bishop SC, Karlsson LJE (2010) Reduction of faecal worm egg count, worm numbers and worm fecundity in sheep selected for worm resistance following artificial infection with Teladorsagia circumcincta and Trichostrongylus colubriformis. Veterinary Parasitology 171, 238-246.
| Crossref | Google Scholar | PubMed |
Larsen JWA, Anderson N, Vizard AL, Anderson GA, Hoste H (1994) Diarrhoea in Merino ewes during winter: association with trichostrongylid larvae. Australian Veterinary Journal 71, 365-372.
| Crossref | Google Scholar | PubMed |
Larsen JWA, Anderson N, Vizard AL (1999) The pathogenesis and control of diarrhoea and breech soiling in adult Merino sheep. International Journal for Parasitology 29, 893-902.
| Crossref | Google Scholar | PubMed |
Lendrum AC (1944) The staining of eosinophil polymorphs and enterochromaffin cells in histological sections. The Journal of Pathology and Bacteriology 56, 441.
| Crossref | Google Scholar |
Meeusen ENT (1999) Immunology of helminth infections, with special reference to immunopathology. Veterinary Parasitology 84, 259-273.
| Crossref | Google Scholar | PubMed |
Mitchell GF (1980) Responses to infection with metazoan and protozoan parasites in mice. Advances in Immunology 28, 451-511.
| Crossref | Google Scholar |
Robinson N, Piedrafita D, Snibson K, Harrison P, Meeusen EN (2010) Immune cell kinetics in the ovine abomasal mucosa following hyperimmunization and challenge with Haemonchus contortus. Veterinary Research 41, 37.
| Crossref | Google Scholar | PubMed |
Spiller R (2006) Role of motility in chronic diarrhoea. Neurogastroenterology & Motility 18, 1045-1055.
| Crossref | Google Scholar | PubMed |
Stear MJ, Henderson NG, Kerr A, McKellar QA, Mitchell S, Seeley C, Bishop SC (2002) Eosinophilia as a marker of resistance to Teladorsagia circumcincta in Scottish Blackface lambs. Parasitology 124, 553-560.
| Crossref | Google Scholar | PubMed |
Whitlock HV (1948) Some modifications of the McMaster helminth egg counting technique and apparatus. Journal of the Council for the Scientific and Industrial Research 21, 177-180.
| Google Scholar |
Williams AR, Palmer DG (2012) Interactions between gastrointestinal nematode parasites and diarrhoea in sheep: pathogenesis and control. The Veterinary Journal 192, 279-285.
| Crossref | Google Scholar | PubMed |
Williams AR, Karlsson LJE, Palmer DG, Vercoe PE, Williams IH, Greeff JC, Emery DL (2010a) Relationships between faecal dry matter, worm burdens and inflammatory mediators and cells in parasite-resistant Merino rams. Veterinary Parasitology 171, 263-272.
| Crossref | Google Scholar | PubMed |
Williams AR, Palmer DG, Williams IH, Vercoe PE, Karlsson LJE (2010b) Faecal dry matter, inflammatory cells and antibodies in parasite-resistant sheep challenged with either Trichostrongylus colubriformis or Teladorsagia circumcincta. Veterinary Parasitology 170, 230-237.
| Crossref | Google Scholar | PubMed |
Wingren U, Enerback L (1983) Mucosal mast cells of the rat intestine: a re-evaluation of fixation and staining properties, with special reference to protein blocking and solubility of the granular glycosaminoglycan. The Histochemistry Journal 15, 571-582.
| Crossref | Google Scholar |
Woolaston RR (1992) Selection of Merino sheep for increased and decreased resistance to Haemonchus contortus: peri-parturient effects on faecal egg counts. International Journal for Parasitology 22, 947-953.
| Crossref | Google Scholar | PubMed |