

Identification of six genomic regions associated with pigment intensity in alpacas
Naomi Gray A , Ishani Shah A , David Groth A and Kylie A. Munyard A *
A *
A Curtin Medical School and Curtin Health Innovation Research Institute, Faculty of Health Sciences, Curtin University, Perth, WA, Australia.
Animal Production Science 63(11) 1052-1062 https://doi.org/10.1071/AN22467
Submitted: 15 December 2022 Accepted: 10 April 2023 Published: 11 May 2023
© 2023 The Author(s) (or their employer(s)). Published by CSIRO Publishing. This is an open access article distributed under the Creative Commons Attribution-NonCommercial-NoDerivatives 4.0 International License (CC BY-NC-ND)
Abstract
Context: Currently, there is a growing consumer demand for more ecologically sustainable practices in the textile industry. Fabric dyeing is highly pollutive, and one way to avoid dyeing is to use naturally coloured fibres. Alpacas exhibit a wide range of fleece colours, thereby making them a good source of fibre for sustainable textile production. Our understanding of the colour genetics of alpacas is improving, but there is still no explanation for all the variation seen in alpaca coat colours.
Aims: To identify a region or regions in the alpaca genome that contribute to differences in pigment intensity.
Methods: Colorimetric analysis using L*a*b* colourspace of fibre from white and black alpacas, that had been genotyped using the Neogen Australasia alpaca coat colour test, was used to classify the samples into intense and dilute groups for each colour. Illumina short-read genotyping by sequencing of the DNA from these alpacas was used to identify single nucleotide polymorphisms that were subsequently used in a case–control genome-wide association study (GWAS) comparing the extreme dilute and intensely pigmented animals.
Key results: Intense eumelanic fibre is darker (P = 0.0003), less red (P = 0.004), and more blue (P = 0.001) than is dilute eumelanic fibre. Intense pheomelanic fibre is darker (P = 1 × 10⁻⁷), more red (P = 3 × 10⁻²⁰), and more yellow (P = 2 × 10⁻⁶) than is dilute pheomelanic fibre. The GWAS showed six regions of genome-wide significance. After manual inspection of these six regions, the best candidate region was upstream of KITLG, a gene previously associated with pigment intensity in dogs.
Conclusions: In combination with ASIP genotype, a regulatory mutation in a region upstream of KITLG in alpacas potentially has a major effect on pigment intensity in the species.
Implications: Successful identification of a marker for pigment intensity will allow breeders to select more precisely for breeding and production animals that will assist them in supplying the desired fibre colours to the textile industry.
Keywords: alpaca, ASIP, CNV, colorimetry, colour, genotyping by sequencing, GWAS, KITLG, pigment intensity.
Introduction
Alpacas (Vicugna pacos) are domesticated South American camelids, farmed for their fibre, meat, pelts, and leather. In Australia, alpaca farming is an emerging industry currently transitioning into a commercial phase (Rural Industries Research and Development Corporation 2016; GHD 2022). The most profitable aspects of the Australian alpaca industry are the livestock export trade and fleece production (Rural Industries Research and Development Corporation 2016). One determinant of fleece quality is its colour (Frank et al. 2006). Compared with other fibre-producing species, alpacas display a wide range of fleece colours (Cruz et al. 2021). Historically, white fibre is preferred as it can be artificially dyed; however, there is a growing interest in utilising the full range of existing alpaca fleece colours (Frank et al. 2006). This is mainly due an increased demand for ‘green’ and sustainable textile production (Cruz et al. 2021). The use of dye is a particularly pollutive part of current textile production (Cruz et al. 2021). An alternative to the use of dyes is to use naturally coloured fibre, therefore making alpacas a good candidate for sustainable textile production (Cruz et al. 2021). It is therefore important to understand alpaca pigmentation genetics to enable farmers to make informed breeding choices (Feeley and Munyard 2009).
Pigmentation in mammals is a highly conserved process, meaning that pigment mechanisms and their genetic basis identified in other mammals can provide an insight into the genetics of alpaca fleece colour (Camacho-Hübner et al. 2002; Hoekstra 2006). In skin, hair, and eyes, the base colour in mammals is determined by the proportion of eumelanin (black/brown pigment) and pheomelanin (yellow/red pigment) (Ito and Wakamatsu 2003). Over 650 genes are known to be involved in pigment formation (Baxter et al. 2019). Eumelanin and pheomelanin are synthesised through melanogenesis inside melanocytes, a specialised form of dendritic cell derived from the embryonic neural crest cells (reviewed by Bonaventure et al. (2013) and Pillaiyar et al. (2017)). Melanin is stored inside melanosomes, which are transferred to neighbouring cells via dendrites (Bonaventure et al. 2013; Pillaiyar et al. 2017). In alpacas, melanocytes are located in the skin epidermis where a single melanocyte will interact with approximately 2–10 keratinocytes (Fleis and Scott 2010).
Within a melanocyte, the production of eumelanin or pheomelanin is determined through the interaction of the melanocortin-1 receptor (MC1R), α-melanocyte stimulating hormone (αMSH), and the agouti signalling protein (ASIP; Robbins et al. 1993; Lu et al. 1994; Barsh 1996; Furumura et al. 1996). MC1R is activated by αMSH binding leading to eumelanin production, which can be antagonised by ASIP binding, promoting pheomelanin production instead (Lu et al. 1994; Barsh 1996; Furumura et al. 1996; ØYehaug et al. 2002; D’Mello et al. 2016). Functional copies of MC1R, αMSH, and ASIP result in a mixture of eumelanin and pheomelanin expression (Table 1; Robbins et al. 1993). Homozygous loss-of-function mutations in ASIP result in predominantly eumelanin production (Table 1; Robbins et al. 1993). Homozygous loss-of-function mutations in MC1R result in predominantly pheomelanin production (Table 1; Bultman et al. 1992; Lu et al. 1994; Barsh 1996).
| MC1R | ASIP | Pigment |
|---|---|---|
| EE or Ee | AA or Aa | Eumelanin and pheomelanin |
| EE or Ee | aa | Eumelanin |
| ee | AA or Aa | Pheomelanin |
| ee | aa | Pheomelanin |
Data are based on Munyard (2011).
In alpacas, a dominant, functional copy of MC1R is identified by the A82/C901 allele, resulting in alanine and arginine (denoted as ‘E’) (Table 2; Powell et al. 2008; Feeley and Munyard 2009). Three mutations are associated with a recessive loss-of-function mutation in MC1R, including G82 resulting in a substation from threonine to alanine at Codon 28 (e1), T901 resulting in a substitution from arginine to cysteine at Codon 301 (e2), and a 4 bp deletion at 224–227 resulting in a frameshift mutation in the protein (e3) (Powell et al. 2008; Feeley and Munyard 2009). In ASIP, three variants in exon four result in a loss-of-function mutation (Feeley et al. 2011). The three mutations include a 57 bp deletion at 325–381 preventing 19 of the final 25 amino acids of ASIP from being synthesised (a1), 292C > T resulting in a substitution from arginine to cysteine at Codon 98 (a2), and 353G > A resulting in a substitution from arginine to histidine at Codon 118 (a3) (Table 3; Feeley et al. 2011).
| MC1R allele | 82 A > C | 901 C > T | Del 224–227 |
|---|---|---|---|
| E | A | C | No |
| e1 | A | T | No |
| e2 | G | C | No |
| e3 | A | C | Yes |
Data are based on Feeley and Munyard (2011), and Powell et al. (2008).
| ASIP allele | Del 325–381 | 292 C > T | 353 G > A |
|---|---|---|---|
| A | T | C | G |
| a1 | G | C | G |
| a2 | T | T | G |
| a3 | T | C | A |
Data are based on Feeley et al. (2011).
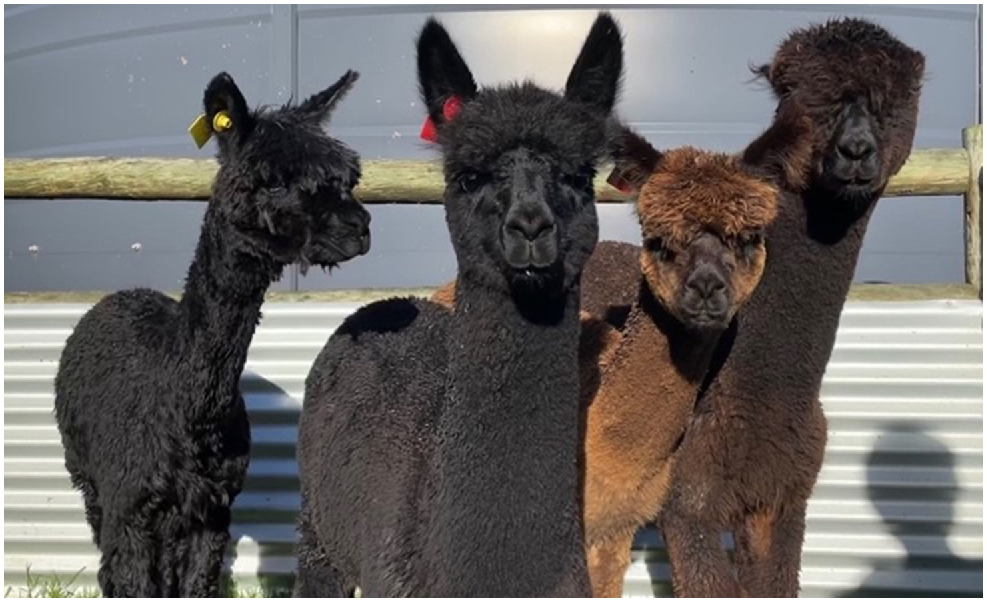
The current understanding of the MC1R and ASIP genes does not explain all the variation in colour observed in alpaca fibre, for example, as shown in Fig. 1 (Lupton et al. 2006; Feeley and Munyard 2009; Munyard 2011; Brancalion et al. 2022). The environment does modify alpaca fibre colour as sun exposure degrades eumelanin and pheomelanin, resulting in a dilution of colour from base to tip (Fig. 1; Wakamatsu et al. 2021). Intense black alpacas produce more eumelanin than do dilute black alpacas, with no difference in pheomelanin production (Wakamatsu et al. 2021). Similar differences in the pheomelanin intensity that are not explained by known MC1R and ASIP alleles have been observed by alpaca breeders (Lynn Edens, Brett Fallon, pers. comm.). There is likely to be an as-yet-unknown effect in addition to the base colour alleles that is intensifying or diluting the production of eumelanin and pheomelanin in alpacas.
Variation in pigment intensity in ‘black’ alpacas, all genotyped to be ‘EE aa’. The two on the left are considered ‘intense’ black and the two on the right are considered ‘dilute’ black. The photographed alpacas live in same environment, are a similar age, and have the same diet (Brett Fallon, pers. comm.).
Differences in pigment production could be a result of an intensity variant that increases the amount of pigment produced, or a dilution variant that decreases the amount of pigment produced. Genes associated with differences in pigment production in other species include pre-melanosome protein (PMEL) in horses (Brunberg et al. 2006; Andersson et al. 2013), frizzled-7 (FZD7) and silver (SILV) in cattle (Gutiérrez-Gil et al. 2007; Floriot et al. 2021; Kimura et al. 2022), melanophilin (MLPH) in chickens (Vaez et al. 2008), and major facilitator superfamily domain containing 12 (MFSD12), tyrosinase-related Protein 1 (TYRP1), KIT ligand (KITLG), and MLPH in dogs (Drögemüller et al. 2007; Bauer et al. 2018; Hédan et al. 2019; Van Buren et al. 2020; Weich et al. 2020; Slavney et al. 2021). Mutations in tyrosinase (TYR) and membrane associated transport protein (MATP) are associated with albinism and pigment dilution in a wide variety of species (Oetting et al. 1996; Aigner et al. 2000; Newton et al. 2001; Camacho-Hübner et al. 2002; Mariat et al. 2003; Schmutz et al. 2004; Blaszczyk et al. 2005; Graf et al. 2005). Due to the large number of genes that are involved in pigment intensity or dilution, the method best suited to identifying novel mutations in alpacas is a genome-wide association study (GWAS; Tam et al. 2019). The purpose of a GWAS is to identify polymorphisms that correlate with a specific phenotype (Marees et al. 2018). In this study, a GWAS was conducted using whole genome sequencing data of alpacas to identify regions in the alpaca genome that correlate to differences in pigment intensity and dilution.
Materials and methods
Animal selection and sample collection
Blood and fibre samples were collected from 65 alpacas comprising 23 black alpacas genotyped as ‘EE aa’ and 42 white alpacas genotyped as ‘AA ee’ using the Neogen Australasia alpaca coat-colour test (all animals were genotyped as non-grey). An additional 27 fibre samples were collected from 11 black ‘EE aa’ alpacas and 16 white ‘AA ee’ alpacas. The ASIP genotypes included were a1a1 (n = 7), a1a2 (n = 2), a1a3 (n = 9), a2a2 (n = 7), a2a3 (n = 2), and a3a3 (n = 4). Twenty-two of the samples were from alpacas bred in Western Australia (WA) and 70 samples were from alpacas bred in the United States of America (USA). Blood samples (1–5 mL) were collected using 22 g needles and syringe by a registered veterinarian, into 5 mL K2 EDTA tubes, and the blood was stored at −20°C. Fibre samples were taken from the mid-side body of the alpaca, as close to the skin as possible.
Fibre-sample preparation and colorimetric analysis
Prior to washing, white fibre samples were trimmed to remove distal parts of the fibre that were stained with grass and dirt that could not be washed out with water. Larger pieces of dirt and debris were removed from the fibre with tweezers. Fibre samples were gently washed, to avoid felting, in deionised water until the water was clear. Washed fibre samples were dried overnight at 37°C, then stored in clear, labelled zip-loc bags for storage at room temperature in a dark cupboard.
In total, 92 fibre samples (34 eumelanic and 58 pheomelanic) were measured using a BYK-Gardner spectro-guide sphere gloss colorimeter (Catalogue No. 6834). The colorimeter was used to take L* as a measurement of lightness from black (0) to white (100), a* as a measurement of the green (−100) to red (+100) spectrum and, b* as a measurement of the blue (−100) to yellow (+100) spectrum. White-fibre measurements were taken closest to the root end of the fibre as that part was least stained by the environment. Black-fibre measurements were taken from the root to tip of the fibre as staining did not affect the colour. Each fibre sample was measured seven times and the averages were plotted in an XYZ scatterplot generated using the scatterplot3d package in RStudio ver. 4.2.0 (Ligges and Maechler 2003; R Core Team 2022). The a* measurements were used to sort the samples in intense and dilute categories as the measurements were distributed similarly between eumelanic and pheomelanic samples, unlike the L* and b* measurements. The highest and lowest quartiles were plotted in a boxplot and the P-value was calculated using a one-tailed test in Microsoft Excel. For eumelanic fibre, samples with a lower a* value were categorised as intense and samples with a higher a* value were categorised as dilute. For pheomelanic fibre, samples with a lower a* value were categorised as dilute and samples with a higher a* were categorised as intense. The eumelanic group had nine fibre samples in each of the intense and dilute quartiles (n = 34), and the pheomelanic group had 15 fibre samples in each of the intense and dilute quartiles (n = 58). Eumelanic alpacas were additionally categorised on the basis of their ASIP genotype (n = 31) and the differences among the L*a*b* measurements were plotted and analysed using a one-way ANOVA in Microsoft Excel. Pheomelanic alpacas were not compared on the basis of their MC1R genotype as 57 of 58 had the same MC1R genotype.
DNA extraction and sequencing
For the samples collected in WA, genomic DNA was extracted from 200 μL of blood by using an Invitrogen PureLink Genomic DNA Mini Kit according to the manufacturer’s protocols. Aliquots containing 1 μg of DNA were dried and transported to Neogen Australasia. Blood samples collected in the USA were sent directly to Neogen Australasia for their in-house DNA-extraction method. Whole-genome sequencing of 65 alpacas was conducted at ~10× coverage (150-base paired-end read format) by using the Illumina NovaSeq system.
Genotyping by sequencing
Genotyping by sequencing was conducted using an in-house bioinformatics pipeline written in bash script. The analysis was executed on a Pawsey Nimbus instance with 32 GiB of RAM and 8 vCPUs, and an AWS M5A.2XLARGE machine with 32 GiB of RAM and 8 vCPUs (RONIN). Read trimming and quality control was conducted using fastp with --trim_poly_g parameter set to a minimum length of 5 (Chen et al. 2018). The trimmed reads were mapped to VicPac4 (draft alpaca reference genome supplied by Brian Davis, Texas A&M) by using Bowtie2 (Langmead and Salzberg 2012) and SAMtools (Danecek et al. 2021) with default settings. Picard tools AddOrReplaceReadGroups and MarkDuplicates were used for quality control (QC) of the BAM files (Broad Institute 2019). Individual variant calling was conducted using GATK HaplotypeCaller with the -ERC GVCF parameter, which output 1 GVCF file per animal (Poplin et al. 2018; Van der Auwera and O’Connor 2020).
GATK GenomicsDBImport was used to merge the 65 GVCF files into a database by using an AWS R5AD.4XLARGE machine with 128 GiB of RAM and 16 vCPUs (RONIN) (Poplin et al. 2018; Van der Auwera and O’Connor 2020). Following this, GATK GenotypeGVCFs was used for joint genotyping of the GVCF database, which processed 1 969 187 806 variants into one VCF file (Poplin et al. 2018; Van der Auwera and O’Connor 2020). In preparation for the GWAS, GATK SelectVariants was used to extract 27 289 672 single-nucleotide polymorphisms (SNPs) from the VCF file (Van der Auwera and O’Connor 2020).
GWAS
SNPs were filtered with a genotyping rate of >90%, and a minor allele frequency of 0.05 by using PLINK 1.9 (Purcell et al. 2007). Principal-component analysis was conducted on the basis of identity-by-state of SNPs in linkage equilibrium (r2 = 0.2) occurring within 50 kb genome-wide windows by using PLINK1.9 (Purcell et al. 2007) and were visualised using the ggplot package (Wickham 2016) in Rstudio (R Core Team 2022). Three GWAS were generated, including combined eumelanic and pheomelanic samples categorised as intense (n = 16) or dilute (n = 16), only pheomelanic samples categorised as intense (n = 12) or dilute (n = 12), and only eumelanic samples categorised as intense (n = 8) or dilute (n = 8). The phenotypic extremes were selected as cases and controls for each GWAS as outlined in Lander and Botstein (Lander and Botstein 1989). All three GWAS were conducted using Fisher’s exact test and with the genome-wide significance threshold set at 5 × 10⁻⁸. The GWAS results were visualised in Manhattan and quantile–quantile (Q–Q) plots generated using SNPEVG v3.2 (Wang et al. 2012).
Analysis of genome-wide significant regions
GWAS results were viewed using Integrative Genomics Viewer (IGV) v2.15.2 (Robinson et al. 2011), and regions of genome-wide significance were extracted and used to search NCBI nucleotide BLAST (Altschul et al. 1990; Sayers et al. 2022). NCBI Genome Data Viewer (GDV) was used to identify genes in the area (Rangwala et al. 2021; Sayers et al. 2022). A literature search was performed to identify any genes with known roles in mammalian pigmentation.
Results
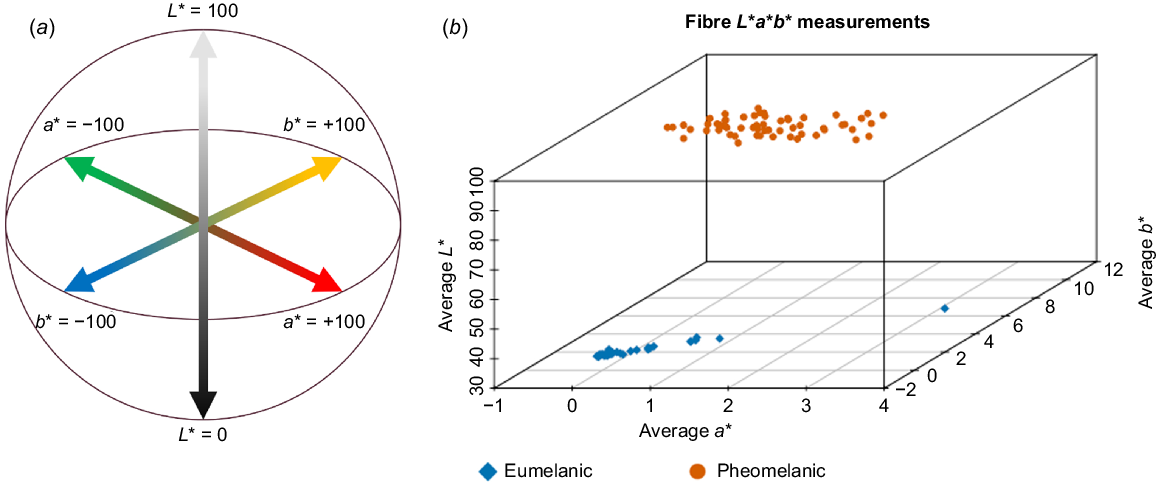
The distribution of the averages of seven L*a*b* colour measurements for each formed two distinct clusters (Fig. 2), with pheomelanic fibre having higher L* and b* measurements than did eumelanic fibre.
Colour measurement of alpaca fibre. (a) CIELAB colour chart (adapted from Ly et al. 2020). L* is a measurement of lightness of black (0) to white (100). a* is a measurement of the green (−100) to red (+100) spectrum. b* is a measurement of the blue (−100) to yellow (+100) spectrum (b) Distribution of the averaged L*, a* and b* measurements for each fibre sample.
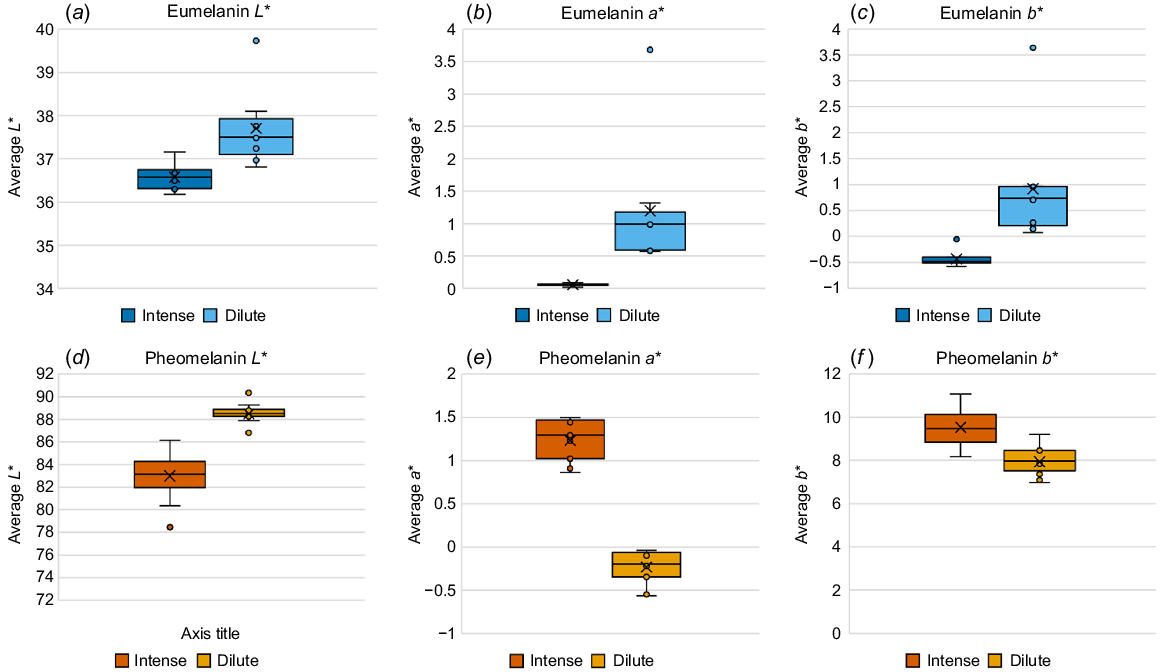
Intense eumelanic fibre is significantly darker (Fig. 3a; P = 0.0003), less red (Fig. 3b; P = 0.004), and slightly more blue than is dilute eumelanic fibre (Fig. 3c; P = 0.001). Similarly, intense pheomelanic fibre is significantly darker (Fig. 3d; P = 1 × 10⁻⁷), more red (Fig. 3e; P = 3 × 10⁻²⁰), and more yellow (Fig. 3f; P = 2 × 10⁻⁶) than is dilute pheomelanic fibre.
Comparison of averaged L*a*b* colour measurement for most intense and dilute fibre samples. (a) Eumelanin L* values, P = 0.0003, (b) Eumelanin a* values, P = 0.004, (c) Eumelanin b* values, P = 0.001, (d) pheomelanin L* values, P = 1 × 10⁻⁷, (e) pheomelanin a* values, P = 3 × 10⁻²⁰, and (f) pheomelanin b* values, P = 2 × 10⁻⁶.
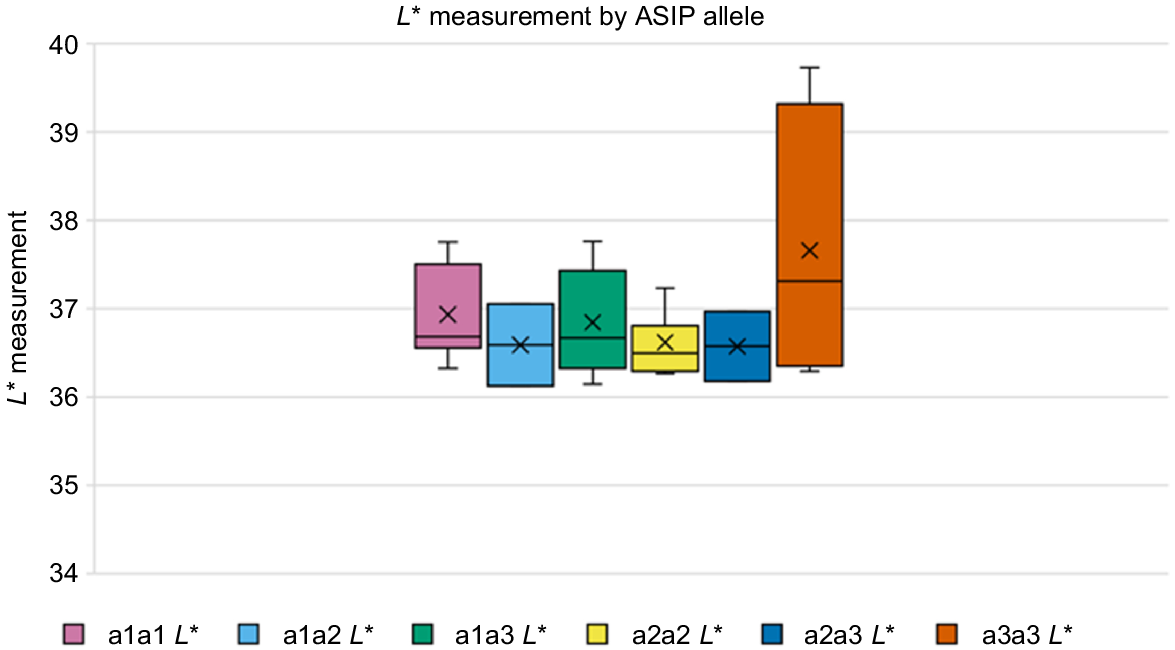
There was no statistically significant difference in the L*a*b* colour measurements of alpacas with the different ASIP alleles (Fig. 4, Supplementary Fig. S1). The a3a3 genotype did have a higher median for all L*a*b* measurements than did other ASIP genotypes; however, this was not statistically significant. This supports the hypothesis that ASIP alleles do not explain all of the pigment variation seen in eumelanic fibre, and that a different variant is likely to be modifying pigment intensity or dilution.
Box-and-whisker plot of averaged L* values of eumelanic samples categorised by ASIP genotype. Average L* measurement for each sample on the Y-axis and the ASIP genotype on the X-axis. One-way ANOVA of the L* values for the different ASIP genotypes resulted in P = 0.33.
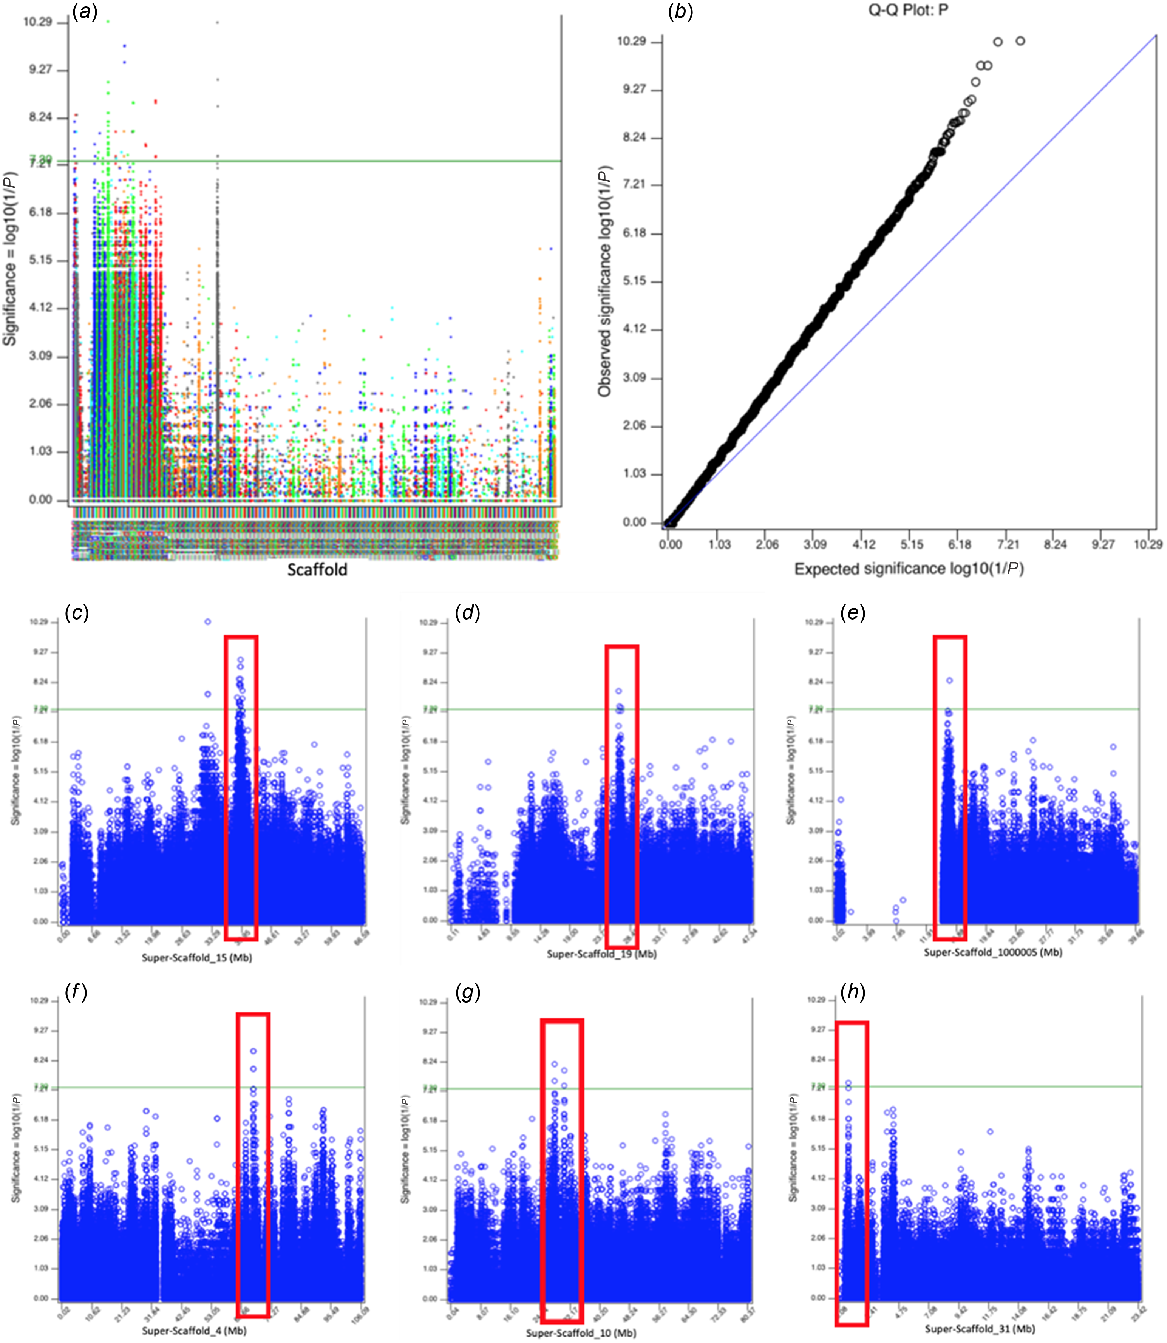
A total of 16 503 152 SNPs and 61 samples with a total genotyping rate of 0.999247 passed filtering and QC. In the combined eumelanic and pheomelanic GWAS, 18 scaffolds contained regions of genome-wide significance (Fig. 5a); of these, six scaffolds contained regions with good support (Fig. 5b–g). In the pheomelanic GWAS (Fig. S3), nine scaffolds contained regions of genome-wide significance (Fig. S2), with only 1 scaffold containing a region with good underlying support (Fig. S2, Table S1). The eumelanic GWAS did not contain any well-supported genome-wide significant regions (Fig. S4).
GWAS of eumelanic and pheomelanic animals. (a) Manhattan plot generated in SNPEVG by using the 16 most intense animals as controls and the 16 most dilute animals as cases. Y-axis is the −log10(P-value) and the X-axis is the scaffold label. Green line represents genome-wide signifiance of 5 × 10⁻⁸. (b) Q–Q plot showing a genomic inflation factor, λ, of 1.14804. (c) Super-Scaffold 15 genome-wide significant region at 38.41–41.13 Mb. (d) Super-Scaffold 19 genome-wide significant region at 26.37–27.24 Mb. (e) Super-Scaffold 100005 genome-wide significant region 14.23–15.54 Mb. (f) Super-Scaffold 4 genome-wide significant region at 67.90–67.96 Mb. (g) Super-Scaffold 10 genome-wide significant regions at 27.98–28.15 Mb and 30.51–30.72 Mb. (h) Super-Scaffold 31 genome-wide significant region at 0.77–0.84 Mb.
The Super-Scaffold 15 candidate region contained three known pigmentation genes, KITLG, POC1B, and CEP290 (Table 4). RIMS1 located on Super-Scaffold 100005 and SYT4 located on Super-Scaffold 31 are genes involved in melanocyte structure (Table 4). The well supported regions of genome-wide significance on Super-Scaffold 19, 4, and 10 did not contain any known pigmentation genes (Table 4).
| GWAS | Scaffold | Known pigmentation gene within 500 kb |
|---|---|---|
| Combined | Super-Scaffold 15 | KITLG: associated with differences in pigment intensity in dogs (Weich et al. 2020; Slavney et al. 2021). POC1B: knockdown results in abnormal melanocyte distribution (Beck et al. 2014). CEP290: knockdown results in delayed melanosome transport (Baye et al. 2011). |
| Combined | Super-Scaffold 19 | No known pigmentation genes. |
| Combined | Super-Scaffold 100005 | RIMS1: overexpression leads to melanocyte dendrite elongation (Yoo et al. 2013). |
| Combined | Super-Scaffold 4 | No known pigmentation genes. |
| Combined | Super-Scaffold 10 | No known pigmentation genes. |
| Combined | Super-Scaffold 31 | SYT4: overexpression leads to melanocyte dendrite elongation (Yoo et al. 2013). |
| Pheomelanic only | Super-Scaffold 4 | No known pigmentation genes. |
Discussion
These data suggest that a region on Super-Scaffold 15 of VicPac4 draft genome, which contains KITLG, POC1B and CEP290, is a strong candidate for influence on pigment intensity in alpacas. In dogs, a 6 kb CNV 152 kb upstream of KITLG was associated with differences in the intensity of eumelanin and pheomelanin (Weich et al. 2020; Slavney et al. 2021). A higher copy number was associated with more intense and uniformly distributed pigment along the hair shaft, while a lower copy number was associated with more dilute pigment (Weich et al. 2020). The CNV was hypothesised to affect KITLG expression levels (Weich et al. 2020). In alpacas, a 145 kb CNV ~272 kb upstream of KITLG was recently identified (Shah et al. 2023) and this corresponds to the candidate region (Fig. 5b). It would be ideal to investigate this CNV in the current study dataset; however, coverage of most of the samples in this study was too low for a valid CNV analysis.
The gene KITLG encodes the ligand for the KIT receptor (KITLG); their interaction is involved in melanogenesis, gametogenesis, and haematopoiesis (Besmer 1991). The binding of KITLG to the KIT receptor on melanocytes activates the MAPK/ERK signalling pathway, which increases melanocyte proliferation and differentiation (Grichnik et al. 1998; Wang et al. 2017). In mice, the expression of KITLG is controlled by an extensive regulatory region between 100 and 300 kb upstream of the gene (Bedell et al. 1995; Wehrle-Haller 2003). Changes in the regulatory region of KITLG can modify its expression, leading to a change in pigmentation, with higher levels of expression associated with darker pigmentation in minks and goats (Bedell et al. 1995; Wehrle-Haller 2003; Miller et al. 2007; Song et al. 2017; Wu et al. 2021). Human skin grafts treated with injections of KITLG resulted in an increase in the size and number of melanocytes in the skin (Grichnik et al. 1998). It is therefore possible that a regulatory variant over 100 kb upstream of KITLG could be altering its expression, leading to an increase in eumelanin and pheomelanin production by modifying the size and number of melanocytes in the skin. In the future, additional samples should be characterised for the CNV to determine whether the copy number in this species also correlates with pigment intensity.
POC1B and CEP290 are also located near the region of genome-wide significance on Super-Scaffold 15 (Table 4). Knockdown of POC1B results in abnormal melanocyte distribution in zebrafish (Beck et al. 2014), and knockdown of CEP290 results in a delay in melanosome transport in zebrafish (Baye et al. 2011). Genes that regulate melanocyte development and melanogenesis, such as MITF, TYR, and TYRP1 in humans and mice, are conserved in zebrafish (Neuffer and Cooper 2022). However, the role(s) of POC1B and CEP290 in mammalian pigmentation are currently unknown (Baye et al. 2011; Beck et al. 2014).
SYT4 (located on Super-Scaffold 31) and RIMS1 (located on Super-Scaffold 100005; Table 4) are associated with melanocyte dendrite elongation. Melanocytes transfer melanin to neighbouring cells via dendrites (Bonaventure et al. 2013; Pillaiyar et al. 2017). In humans, the number and length of melanocyte dendrites is associated with pigmentation in the skin (reviewed by Costin and Hearing 2007). Melanocytes with higher dendricity are associated with hyperpigmentation in the skin (Costin and Hearing 2007). A variant in or near this gene could affect melanocyte dendricity, leading to more dilute or more intense pigmentation.
GWAS that were conducted using only eumelanic or pheomelanic samples did not show the same areas of genome-wide significance as did the combined eumelanic and pheomelanic samples (Table 4). This indicates that there is likely to be at least one gene of major effect, and at least one gene affecting pheomelanin intensity. Variations in genes that cause only dilutions in pheomelanin are known to exist in cattle and dogs (Hédan et al. 2019; Floriot et al. 2021). However, no known pigmentation genes were identified within the genome-wide significant region. The lack of genome-wide significant regions in the eumelanic GWAS is likely to be due to a combination of genes with a small effect plus a low sample size. Increasing the number of eumelanic samples would help identify whether there are any genome-wide significant regions that are associated only with eumelanic alpacas. It is therefore possible that multiple intensity and dilution variants exist in alpacas, including some that modify eumelanin and pheomelanin combined and others that modify only pheomelanin.
Colorimetric analysis of alpaca fibre measured a gradient of colour rather than an intense and dilute phenotype. Other studies that have conducted colorimetric analysis of alpaca fibre have also noted a gradient in colour (Lupton et al. 2006; Cruz et al. 2021).
The inability to genotype the roan pattern in alpacas may be a limitation in the colorimetric analysis of pheomelanic fibre samples. For example, the roan pattern is characterised by white fibres mixed in the base coat (Munyard 2011). Roan is most visible on dark base coats and is difficult to visualise on light base coats. It is therefore possible that the pheomelanic samples used in this study contained roan alpacas. For example, a sample measured as dilute pheomelanin may be an intense pheomelanic sample that is also roan. Once the genetic basis for roan in alpacas is determined, future work studying pigment intensity should exclude roan alpacas based on genotype rather than phenotype.
Sample collection was limited to black alpacas genotyped as ‘EE aa’ and white alpacas genotyped as ‘ee AA’. This enabled the samples to be separated into eumelanic and pheomelanic groups to determine whether areas of genome-wide significance were correlated with the two pigments in combination or separately. Collecting colorimetric data on additional MC1R and ASIP genotypes would be beneficial to understand the full spectrum of colour in alpacas.
No statistically significant difference in L*, a* or b* measurements was found between alpacas categorised on the basis of their ASIP genotype (Figs 4, and S1). This could be due to a low sample size; for example, both the a1a2 and the a2a3 ASIP genotypes contained only two samples. While not statistically significant, the a3a3 genotype had a high median compared with the other genotypes. This could be due to the difference between each ASIP allele, as a3 is hypothesised to be the least deleterious as it results in an amino acid change from arginine to histidine, which are both large, positively charged amino acids (Feeley et al. 2011). Increasing the sample size for each ASIP genotype would better indicate whether there is a correlation between ASIP genotype and pigment intensity. Pheomelanic alpacas were not compared on the basis of their MC1R genotype because 57 of 58 had an e1e1 genotype. Future studies should incorporate the e2 and e3 alleles to determine whether they influence colour measurement.
This research has identified several genome-wide significant regions in the alpaca genome that are associated with differences in pigment intensity as measured by a colorimeter. Identifying candidate variants within these regions will identify new pigment intensity loci in alpacas. Future work should involve developing a genotyping test for the intensity loci which will enable alpaca breeders to make more informed breeding decisions.
Acknowledgements
The authors thank Curtin Medical School and CHIRI for access to facilities, as well as the alpaca owners and breeders who provided samples, information and specialist knowledge that allowed this project to proceed.
References
Aigner B, Besenfelder U, Müller M, Brem G (2000) Tyrosinase gene variants in different rabbit strains. Mammalian Genome 11, 700-702.
| Crossref | Google Scholar |
Altschul SF, Gish W, Miller W, Myers EW, Lipman DJ (1990) Basic local alignment search tool. Journal of Molecular Biology 215, 403-410.
| Crossref | Google Scholar |
Andersson LS, Wilbe M, Viluma A, Cothran G, Ekesten B, Ewart S, Lindgren G (2013) Equine multiple congenital ocular anomalies and silver coat colour result from the pleiotropic effects of mutant PMEL. PLoS ONE 8, e75639.
| Crossref | Google Scholar |
Barsh GS (1996) The genetics of pigmentation: from fancy genes to complex traits. Trends in Genetics 12, 299-305.
| Crossref | Google Scholar |
Bauer A, Kehl A, Jagannathan V, Leeb T (2018) A novel MLPH variant in dogs with coat colour dilution. Animal Genetics 49, 94-97.
| Crossref | Google Scholar |
Baxter LL, Watkins-Chow DE, Pavan WJ, Loftus SK (2019) A curated gene list for expanding the horizons of pigmentation biology. Pigment Cell & Melanoma Research 32, 348-358.
| Crossref | Google Scholar |
Baye LM, Patrinostro X, Swaminathan S, Beck JS, Zhang Y, Stone EM, Sheffield VC, Slusarski DC (2011) The N-terminal region of centrosomal protein 290 (CEP290) restores vision in a zebrafish model of human blindness. Human Molecular Genetics 20, 1467-1477.
| Crossref | Google Scholar |
Beck BB, Phillips JB, Bartram MP, Wegner J, Thoenes M, Pannes A, Sampson J, Heller R, Göbel H, Koerber F, Neugebauer A, Hedergott A, Nürnberg G, Nürnberg P, Thiele H, Altmüller J, Toliat MR, Staubach S, Boycott KM, Valente EM, Janecke AR, Eisenberger T, Bergmann C, Tebbe L, Wang Y, Wu Y, Fry AM, Westerfield M, Wolfrum U, Bolz HJ (2014) Mutation of POC1B in a severe syndromic retinal ciliopathy. Human Mutation 35, 1153-1162.
| Crossref | Google Scholar |
Bedell MA, Brannan CI, Evans EP, Copeland NG, Jenkins NA, Donovan PJ (1995) DNA rearrangements located over 100 kb 5’ of the Steel (Sl)-coding region in Steel-panda and Steel-contrasted mice deregulate Sl expression and cause female sterility by disrupting ovarian follicle development. Genes & Development 9, 455-470.
| Crossref | Google Scholar |
Besmer P (1991) The kit ligand encoded at the murine Steel locus: a pleiotropic growth and differentiation factor. Current Opinion in Cell Biology 3, 939-946.
| Crossref | Google Scholar |
Blaszczyk WM, Arning L, Hoffmann K-P, Epplen JT (2005) A Tyrosinase missense mutation causes albinism in the Wistar rat. Pigment Cell Research 18, 144-145.
| Crossref | Google Scholar |
Bonaventure J, Domingues MJ, Larue L (2013) Cellular and molecular mechanisms controlling the migration of melanocytes and melanoma cells. Pigment Cell & Melanoma Research 26, 316-325.
| Crossref | Google Scholar |
Brancalion L, Haase B, Wade CM (2022) Canine coat pigmentation genetics: a review. Animal Genetics 53, 3-34.
| Crossref | Google Scholar |
Broad Institute (2019) Picard toolkit. Available at https://broadinstitute.github.io/picard/
Brunberg E, Andersson L, Cothran G, Sandberg K, Mikko S, Lindgren G (2006) A missense mutation in PMEL17 is associated with the Silver coat color in the horse. BMC Genetics 7, 46.
| Crossref | Google Scholar |
Bultman SJ, Michaud EJ, Woychik RP (1992) Molecular characterization of the mouse agouti locus. Cell 71, 1195-1204.
| Crossref | Google Scholar |
Camacho-Hübner A, Richard C, Beermann F (2002) Genomic structure and evolutionary conservation of the tyrosinase gene family from Fugu. Gene 285, 59-68.
| Crossref | Google Scholar |
Chen S, Zhou Y, Chen Y, Gu J (2018) fastp: an ultra-fast all-in-one FASTQ preprocessor. Bioinformatics 34, i884-i890.
| Crossref | Google Scholar |
Costin G-E, Hearing VJ (2007) Human skin pigmentation: melanocytes modulate skin color in response to stress. The FASEB Journal 21, 976-994.
| Crossref | Google Scholar |
Cruz A, Yucra A, Gutiérrez GA, Burgos A, Morante R, Gutiérrez JP, Cervantes I, Wurzinger M (2021) Colorimetry analysis of coat color and its relationship with fiber traits in alpacas. Animal 15, 100219.
| Crossref | Google Scholar |
Danecek P, Bonfield JK, Liddle J, Marshall J, Ohan V, Pollard MO, Whitwham A, Keane T, McCarthy SA, Davies RM, Li H (2021) Twelve years of SAMtools and BCFtools. GigaScience 10, giab008.
| Crossref | Google Scholar |
Drögemüller C, Philipp U, Haase B, Günzel-Apel A-R, Leeb T (2007) A noncoding melanophilin gene (MLPH) SNP at the splice donor of exon 1 represents a candidate causal mutation for coat color dilution in dogs. Journal of Heredity 98, 468-473.
| Crossref | Google Scholar |
D’Mello SAN, Finlay GJ, Baguley BC, Askarian-Amiri ME (2016) Signaling pathways in melanogenesis. International Journal of Molecular Sciences 17, 1144.
| Crossref | Google Scholar |
Feeley NL, Munyard KA (2009) Characterisation of the melanocortin-1 receptor gene in alpaca and identification of possible markers associated with phenotypic variations in colour. Animal Production Science 49, 675-681.
| Crossref | Google Scholar |
Feeley NL, Bottomley S, Munyard KA (2011) Three novel mutations in ASIP associated with black fibre in alpacas (Vicugna pacos). The Journal of Agricultural Science 149, 529-538.
| Crossref | Google Scholar |
Fleis RI, Scott DW (2010) The microanatomy of healthy skin from alpacas (Vicugna pacos). Journal of Veterinary Diagnostic Investigation 22, 716-719.
| Crossref | Google Scholar |
Floriot S, Duchesne A, Grohs C, Hozé C, Deloche MC, Fayolle G, Vilotte JL, Boichard D, Fritz S, Boussaha M (2021) A missense mutation in the FZD7 gene is associated with dilution of the red areas of the coat in Montbéliarde cattle. Animal Genetics 52, 351-355.
| Crossref | Google Scholar |
Frank EN, Hick MVH, Gauna CD, Lamas HE, Renieri C, Antonini M (2006) Phenotypic and genetic description of fibre traits in South American domestic camelids (llamas and alpacas). Small Ruminant Research 61, 113-129.
| Crossref | Google Scholar |
Furumura M, Sakai C, Abdel-Malek Z, Barsh GS, Hearing VJ (1996) The interaction of agouti signal protein and melanocyte stimulating hormone to regulate melanin formation in mammals. Pigment Cell Research 9, 191-203.
| Crossref | Google Scholar |
GHD (2022) Alpaca: a compact business case. Available at https://agrifutures.com.au/product/alpaca-a-compact-business-case/
Graf J, Hodgson R, van Daal A (2005) Single nucleotide polymorphisms in the MATP gene are associated with normal human pigmentation variation. Human Mutation 25, 278-284.
| Crossref | Google Scholar |
Grichnik JM, Burch JA, Burchette J, Shea CR (1998) The SCF/KIT pathway plays a critical role in the control of normal human melanocyte homeostasis. Journal of Investigative Dermatology 111, 233-238.
| Crossref | Google Scholar |
Gutiérrez-Gil B, Wiener P, Williams JL (2007) Genetic effects on coat colour in cattle: dilution of eumelanin and phaeomelanin pigments in an F2-Backcross Charolais × Holstein population. BMC Genetics 8, 56.
| Crossref | Google Scholar |
Hoekstra HE (2006) Genetics, development and evolution of adaptive pigmentation in vertebrates. Heredity 97, 222-234.
| Crossref | Google Scholar |
Hédan B, Cadieu E, Botherel N, Dufaure de Citres C, Letko A, Rimbault M, Drögemüller C, Jagannathan V, Derrien T, Schmutz S, Leeb T, André C (2019) Identification of a missense variant in MFSD12 involved in dilution of phaeomelanin leading to white or cream coat color in dogs. Genes-Basel 10, 386.
| Crossref | Google Scholar |
Ito S, Wakamatsu K (2003) Quantitative analysis of eumelanin and pheomelanin in humans, mice, and other animals: a comparative review. Pigment Cell Research 16, 523-531.
| Crossref | Google Scholar |
Kimura S, Hatakeyama T, Koutaka T, Kubo K, Morita S, Eguchi K, Saitoh K, Yamauchi K, Imai S, Kashimura A, Inenaga T, Matsumoto H (2022) PMEL p.Leu18del dilutes coat color of Kumamoto sub-breed of Japanese Brown cattle. BMC Genomics 23, 694.
| Crossref | Google Scholar |
Lander ES, Botstein D (1989) Mapping mendelian factors underlying quantitative traits using RFLP linkage maps. Genetics 121, 185-199.
| Crossref | Google Scholar |
Langmead B, Salzberg SL (2012) Fast gapped-read alignment with Bowtie 2. Nature Methods 9, 357-359.
| Crossref | Google Scholar |
Ligges U, Maechler M (2003) scatterplot3d – an R package for visualizing multivariate data. Journal of Statistical Software 8, 1-20.
| Crossref | Google Scholar |
Lu D, Willard D, Patel IR, Kadwell S, Overton L, Kost T, Luther M, Chen W, Woychik RP, Wilkison WO, Cone RD (1994) Agouti protein is an antagonist of the melanocyte-stimulating-hormone receptor. Nature 371, 799-802.
| Crossref | Google Scholar |
Lupton CJ, McColl A, Stobart RH (2006) Fiber characteristics of the Huacaya alpaca. Small Ruminant Research 64, 211-224.
| Crossref | Google Scholar |
Ly BCK, Dyer EB, Feig JL, Chien AL, Del Bino S (2020) Research techniques made simple: cutaneous colorimetry: a reliable technique for objective skin color measurement. Journal of Investigative Dermatology 140, 3-12.e1.
| Crossref | Google Scholar |
Marees AT, de Kluiver H, Stringer S, Vorspan F, Curis E, Marie-Claire C, Derks EM (2018) A tutorial on conducting genome-wide association studies: quality control and statistical analysis. International Journal of Methods in Psychiatric Research 27, e1608.
| Crossref | Google Scholar |
Mariat D, Taourit S, Guérin G (2003) A mutation in the MATP gene causes the cream coat colour in the horse. Genetics Selection Evolution 35, 119.
| Crossref | Google Scholar |
Miller CT, Beleza S, Pollen AA, Schluter D, Kittles RA, Shriver MD, Kingsley DM (2007) cis-regulatory changes in kit ligand expression and parallel evolution of pigmentation in sticklebacks and humans. Cell 131, 1179-1189.
| Crossref | Google Scholar |
Neuffer SJ, Cooper CD (2022) Zebrafish syndromic albinism models as tools for understanding and treating pigment cell disease in humans. Cancers 14, 1752.
| Crossref | Google Scholar |
Newton JM, Cohen-Barak O, Hagiwara N, Gardner JM, Davisson MT, King RA, Brilliant MH (2001) Mutations in the human orthologue of the mouse underwhite gene (uw) underlie a new form of oculocutaneous albinism, OCA4. The American Journal of Human Genetics 69, 981-988.
| Crossref | Google Scholar |
Oetting WS, Brilliant MH, King RA (1996) The clinical spectrum of albinism in humans. Molecular Medicine Today 2, 330-335.
| Crossref | Google Scholar |
ØYehaug L, Plahte E, VÅGe DI, Omholt SW (2002) The regulatory basis of melanogenic switching. Journal of Theoretical Biology 215, 449-468.
| Crossref | Google Scholar |
Pillaiyar T, Manickam M, Jung S-H (2017) Recent development of signaling pathways inhibitors of melanogenesis. Cell Signal 40, 99-115.
| Crossref | Google Scholar |
Poplin R, Ruano-Rubio V, DePristo MA, Fennell TJ, Carneiro MO, Van der Auwera GA, Kling DE, Gauthier LD, Levy-Moonshine A, Roazen D, Shakir K, Thibault J, Chandran S, Whelan C, Lek M, Gabriel S, Daly MJ, Neale B, MacArthur DG, Banks E (2018) Scaling accurate genetic variant discovery to tens of thousands of samples. bioRxiv 201178.
| Crossref | Google Scholar |
Powell AJ, Moss MJ, Tree LT, Roeder BL, Carleton CL, Campbell E, Kooyman DL (2008) Characterization of the effect of Melanocortin 1 Receptor, a member of the hair color genetic locus, in alpaca (Lama pacos) fleece color differentiation. Small Ruminant Research 79, 183-187.
| Crossref | Google Scholar |
Purcell S, Neale B, Todd-Brown K, Thomas L, Ferreira MAR, Bender D, Maller J, Sklar P, de Bakker PIW, Daly MJ, Sham PC (2007) PLINK: a tool set for whole-genome association and population-based linkage analyses. The American Journal of Human Genetics 81, 559-575.
| Crossref | Google Scholar |
R Core Team (2022) ‘R: a language and environment for statistical computing.’ (R Foundation for Statistical Computing: Vienna, Austria). Available at http://www.R-project.org/
Rangwala SH, Kuznetsov A, Ananiev V, Asztalos A, Borodin E, Evgeniev V, Joukov V, Lotov V, Pannu R, Rudnev D, Shkeda A, Weitz EM, Schneider VA (2021) Accessing NCBI data using the NCBI sequence viewer and genome data viewer (GDV). Genome Research 31, 159-169.
| Crossref | Google Scholar |
Robbins LS, Nadeau JH, Johnson KR, Kelly MA, Roselli-Rehfuss L, Baack E, Mountjoy KG, Cone RD (1993) Pigmentation phenotypes of variant extension locus alleles result from point mutations that alter MSH receptor function. Cell 72, 827-834.
| Crossref | Google Scholar |
Robinson JT, Thorvaldsdóttir H, Winckler W, Guttman M, Lander ES, Getz G, Mesirov JP (2011) Integrative genomics viewer. Nature Biotechnology 29, 24-26.
| Crossref | Google Scholar |
Rural Industries Research and Development Corporation (2016) Alpaca market assessment 2016. Rural Industries Research and Development Corporation. Available at https://www.agrifutures.com.au/product/project-summary-alpaca-market-assessment-2016/
Sayers EW, Bolton EE, Brister JR, Canese K, Chan J, Comeau DC, Connor R, Funk K, Kelly C, Kim S, Madej T, Marchler-Bauer A, Lanczycki C, Lathrop S, Lu Z, Thibaud-Nissen F, Murphy T, Phan L, Skripchenko Y, Tse T, Wang J, Williams R, Trawick BW, Pruitt KD, Sherry ST (2022) Database resources of the national center for biotechnology information. Nucleic Acids Research 50, D20-D26.
| Crossref | Google Scholar |
Schmutz SM, Berryere TG, Ciobanu DC, Mileham AJ, Schmidtz BH, Fredholm M (2004) A form of albinism in cattle is caused by a tyrosinase frameshift mutation. Mammalian Genome 15, 62-67.
| Crossref | Google Scholar |
Shah I, Gray N, Groth D, Brooks S, Munyard K (2023) A copy number variant near KITLG is associated with the roan pattern in alpacas. Animal Production Science in press.
| Google Scholar |
Slavney AJ, Kawakami T, Jensen MK, Nelson TC, Sams AJ, Boyko AR (2021) Five genetic variants explain over 70% of hair coat pheomelanin intensity variation in purebred and mixed breed domestic dogs. PLoS ONE 16, e0250579.
| Crossref | Google Scholar |
Song X, Xu C, Liu Z, Yue Z, Liu L, Yang T, Cong B, Yang F (2017) Comparative transcriptome analysis of mink (Neovison vison) skin reveals the key genes involved in the melanogenesis of black and white coat colour. Scientific Reports 7, 12461.
| Crossref | Google Scholar |
Tam V, Patel N, Turcotte M, Bossé Y, Paré G, Meyre D (2019) Benefits and limitations of genome-wide association studies. Nature Reviews Genetics 20, 467-484.
| Crossref | Google Scholar |
Vaez M, Follett SA, Bed’hom B, Gourichon D, Tixier-Boichard M, Burke T (2008) A single point-mutation within the melanophilin gene causes the lavender plumage colour dilution phenotype in the chicken. BMC Genetics 9, 7.
| Crossref | Google Scholar |
Van Buren SL, Minor KM, Grahn RA, Mickelson JR, Grahn JC, Malvick J, Colangelo JR, Mueller E, Kuehnlein P, Kehl A (2020) A third MLPH variant causing coat color dilution in dogs. Genes 11, 639.
| Crossref | Google Scholar |
Wakamatsu K, Munyard K, Oddie C, Ito S (2021) Photobleached oxidative degradation of melanins: chemical characterization of melanins present in alpaca fiber. Photochemistry and Photobiology 97, 1493-1497.
| Crossref | Google Scholar |
Wang S, Dvorkin D, Da Y (2012) SNPEVG: a graphical tool for GWAS graphing with mouse clicks. BMC Bioinformatics 13, 319.
| Crossref | Google Scholar |
Wang Y, Viennet C, Robin S, Berthon J-Y, He L, Humbert P (2017) Precise role of dermal fibroblasts on melanocyte pigmentation. Journal of Dermatological Science 88, 159-166.
| Crossref | Google Scholar |
Wehrle-Haller B (2003) The role of kit-ligand in melanocyte development and epidermal homeostasis. Pigment Cell Research 16, 287-296.
| Crossref | Google Scholar |
Weich K, Affolter V, York D, Rebhun R, Grahn R, Kallenberg A, Bannasch D (2020) Pigment intensity in dogs is associated with a copy number variant upstream of KITLG. Genes 11, 75.
| Crossref | Google Scholar |
Wu S, Li J, Ma T, Li J, Li Y, Jiang H, Zhang Q (2021) MiR-27a regulates WNT3A and KITLG expression in Cashmere goats with different coat colors. Animal Biotechnology 32, 205-212.
| Crossref | Google Scholar |
Yoo JC, Lim Ty, Park JS, Hah Y-S, Park N, Hong S-G, Park J-Y, Yoon T-J (2013) SYT14L, especially its C2 domain, is involved in regulating melanocyte differentiation. Journal of Dermatological Science 72, 246-251.
| Crossref | Google Scholar |