

Unravelling predator–prey interactions in response to planned fire: a case study from the Tanami Desert
Hayley M. Geyle A B * , Christine Schlesinger A , Sam Banks A , Kelly Dixon A B , Brett P. Murphy A , Rachel Paltridge C , Laura Doolan D , Myra Herbert D ,
 A
B
C
D
E
Abstract
Introduced predators pose a significant threat to biodiversity. Understanding how predators interact with other threats such as fire is crucial to developing effective conservation strategies.
We investigated interactions between the greater bilby (Macrotis lagotis) and two introduced predators, the European red fox (Vulpes vulpes) and feral cat (Felis catus), in response to fire management in a remote part of the Tanami Desert, Australia.
We used motion-sensor cameras and non-invasive genetic sampling to monitor bilbies and predators. We compared activity profiles to determine the level of temporal overlap among species, and used generalised linear modelling to assess the correlation between activity and average normalised difference vegetation index (NDVI; as a proxy for fire-associated environmental change). Finally, we used spatially explicit capture–recapture modelling to estimate cat and bilby densities before and after fire.
Cat and bilby activity declined following fire, whereas fox activity increased (despite only a small proportion of the study area being burnt). Bilbies and foxes showed the greatest overlap in temporal activity (76%), followed by bilbies and cats (71%) and cats and foxes (68%). Bilbies and cats were more likely to be captured in areas with a lower NDVI, whereas foxes were more likely to be captured in areas with a higher NDVI. Bilby density declined significantly following fire, whereas cat density remained constant through time.
Declines in bilby activity and density following fire may be attributed to emigration from the study area and/or increases in fox activity. Post-burn emigration could be due to wide scale destruction of important food resources. However, given much of the study area where bilbies were detected remained unburnt, it is more likely that observed declines are related to increases in fox activity and associated increases in predation pressure. Improved understanding may be gained by experimentally manipulating both fire and predator densities.
Increases in fox activity following fire are likely to have devastating consequences for the local bilby population. It is thus vital that appropriate management activities are put in place to protect bilbies from foxes. This may be achieved through a combination of lethal control and indirect methods.
Keywords: abundance, activity, camera-traps, European red fox, Felis catus, feral cat, fire management, genetic sampling, greater bilby, Macrotis lagotis, minimum known to be alive, threatened, Vulpes vulpes.
Introduction
The rate of human-induced ecological change has escalated in recent years, leading to marked declines in the world’s biodiversity (Johnson et al. 2017). Australia has one of the worst track records globally for recent faunal extinctions, being most evident in the loss of an average of one to two mammal species per decade since European colonisation (Woinarski et al. 2015; Legge et al. 2023). Unlike other parts of the world where mammal extinctions have been attributed mainly to habitat loss, hunting, and other impacts associated with human development and population growth (Hoffmann et al. 2011), Australian mammal extinctions have typically occurred in areas that are remote and relatively unmodified (Woinarski et al. 2015). Although the underlying drivers have been contested, numerous studies have linked these extinctions to predation by introduced predators (particularly feral cats (Felis catus) and European red foxes (Vulpes vulpes)), changing fire regimes, and habitat degradation associated with the spread of livestock and the European rabbit (Oryctolagus cuniculus) (Short and Smith 1994; Johnson et al. 2007; McKenzie et al. 2007; Burbidge et al. 2009; Doherty et al. 2015b; Legge et al. 2023).
Mammal extinctions have been most pronounced in the arid and semi-arid regions of Australia, with arid endemics comprising the majority of extinct taxa (McKenzie et al. 2007). Many extant species in these regions are still declining (Woinarski et al. 2015). The greater bilby (Macrotis lagotis; hereafter referred to as the bilby) is one such species. The bilby is an iconic fossorial mammal of great ecological and human cultural significance (DCCEEW 2023). It fills an important ecological role through bioturbation of soil via numerous shallow diggings made while foraging. This activity can increase water infiltration, nutrient cycling, plant germination and growth, and capture organic matter (Fleming et al. 2014). Additionally, bilbies dig multiple large burrows (up to 2 m deep and 4.5 m long) in which they shelter during the day (Smyth and Philpott 1968), and which are also used for shelter by several co-occurring species (Hofstede and Dziminski 2017; Dawson et al. 2019). Furthermore, for First Nations peoples of the central deserts, the bilby has very strong cultural significance; there are at least 60 different local language names for the species across Australia (Paltridge 2016), and bilbies are included in many ‘Jukurrpa’ dreaming stories and song lines.
The bilby is listed as Vulnerable by the International Union for the Conservation of Nature and the Australian Government (under the Environment Protection and Biodiversity Conservation Act, 1999) because of its patchy distribution and ongoing decline. It is a habitat generalist, having previously occupied three quarters of arid and semiarid Australia (Southgate 1990). However, since European colonisation of the continent, its range has contracted to approximately 20% of its original extent (Southgate 1990). The current distribution is restricted to parts of the Tanami, Great Sandy, and Gibson deserts, with small outlying populations in south-western Queensland and north of Alice Springs in the Northern Territory (DCCEEW 2023). It also occurs as several translocated populations, including on predator-free islands and in mainland fenced enclosures (DCCEEW 2023).
Bilby declines have been most severe in the southern and eastern parts of the range and, similarly to other arid-zone mammals, have been attributed primarily to introduced predators, inappropriate fire regimes and grazing by livestock and rabbits (DCCEEW 2023), although the extent to which these threats interact to affect bilbies is not well understood. For example, bilbies have been positively associated with areas of the Tanami Desert that have been subject to frequent, small fires (Southgate et al. 2007a), but also persist in areas that burn infrequently (e.g. the Gibson Desert in Western Australia, and the Diamantina region of Queensland) (DCCEEW 2023). Although hot fires followed by good rainfall are likely to promote key plant foods for the bilby in deserts dominated by highly flammable spinifex grass (Triodia spp.) (Southgate and Carthew 2007), exploitation of recently burnt areas by cats and foxes in other regions of Australia (McGregor et al. 2014; Hradsky et al. 2017; Moore et al. 2024) suggests fire could also increase predation risk. Even though cat and fox behaviour in other regions can be cautiously extrapolated to the desert, few studies have explicitly quantified the interactions between fire and predators in arid ecosystems (but see Pastro 2013), so their likely impact on bilby populations remains unclear. This knowledge gap hinders our ability to make informed management decisions (to benefit bilby populations), or to monitor bilby responses to threats or management interventions (e.g. planned fires).
Here, we detail a study undertaken in a remote part of the northern Tanami Desert, on the northern edge of the Australian arid zone, aimed at investigating changes in interactions between the bilby and exotic predators (cats and foxes) in response to a planned fire, implemented by the Traditional Custodians and rangers who manage the region. We used motion-sensor cameras and non-invasive genetic sampling of bilby scats to investigate bilby–predator interactions immediately before burn, immediately after burn, and up to 10 months post-burn. We predicted (i) an increase in cat and fox activity/abundance immediately following fire, (ii) an increased overlap in spatial and temporal activity between bilbies and both predators following fire, and (iii) a subsequent decrease in bilby activity/density following fire, owing to increased frequency of encounters with both predators, and an associated increase in predation pressure. We anticipate that improved knowledge of bilby–predator interactions in the region will aid the development of suitable conservation strategies to mitigate threats to the bilby.
Materials and methods
Local context
This study was undertaken in the northern Tanami Indigenous Protected Area (IPA) located in the northern portion of the Tanami Desert, Northern Territory. Declared in 2007, the IPA incorporates an area of approximately 40,050 km2 of Aboriginal freehold land (CLC 2015). The IPA is positioned on the far-northern limit of Australia’s semiarid rangelands and experiences a subtropical climate with distinct wet and dry seasons (CLC 2015). Rainfall is generally limited to the summer months (November to March), with moderate to high temperatures prevailing throughout the year (CLC 2015). ‘Yapa’ (Warlpiri peoples) recognise the following four main seasons: (i) ‘Kawalya’ and ‘Yulyurrpu’ (cold weather), (ii) ‘Kara-purda’ (windy weather), (iii) ‘Wanta’ (hot weather) and (iv) ‘Ngapa-yiri-yiri’ and ‘Wajirrkinyi’ (rainy weather) (CLC 2015). Majority of the country included in the IPA is traditionally that of the northern Warlpiri people. However, the land on which the single permanent settlement of Lajamanu is located, and the country to the north-west of it, is the traditional lands of the Gurindji people. The western portion of the IPA borders on Jaru and Nyininy land, and the eastern portion of the IPA adjoins Warlmanpa land (CLC 2015).
Engagement and communication with First Nations peoples
Rangers and Traditional Custodians were involved in all stages and aspects of this project, from early planning and priority setting (including identifying research questions of interest), through to data collection, and discussion of research findings and what they mean. Consultations and engagement took the form of community workshops (prior to commencement of the project), ongoing discussions during field work, and more formal updates provided to the North Tanami IPA Committee, and to the ‘Warlu’ (fire) Committee. We also produced a plain English summary booklet in collaboration with the North Tanami Rangers for dissemination of research findings to community members (available as Supplementary material S1), on the basis of a conference presentation given by the lead author (HG) and the rangers at the 2023 Territory Natural Resource Management Conference in Darwin, Australia. Through ongoing engagement and communication, the project naturally adapted to incorporate priorities of First Nations peoples in the region. For example, by targeting sites of high priority for planned burns, by adapting survey methodologies to better align with management activities being undertaken on the ground, and by collaborating with other projects (e.g. the ‘Yitaki Maninjaku Ngurungka’ or ‘Reading the Country’ Project) to enable on-the-job training opportunities for younger rangers.
Study area and site selection
Preliminary surveys undertaken in the northern Tanami Desert in August 2021 in collaboration with First Nations land managers informed the selection of our study sites. These surveys were conducted over an area of ~15,000 ha and included both aerial (helicopter) and ground-based searches for bilby sign (Territory Natural Resource Management, unpubl. data). This area, known locally as Mirridi, was chosen because (i) it was readily accessible via vehicle and near the settlement of Lajamanu (~1 h drive), (ii) fresh bilby sign was frequently encountered on and adjacent to the main access road, indicating that bilbies were locally common, and (iii) the site had already been identified by Traditional Custodians as a priority burning site in 2022.
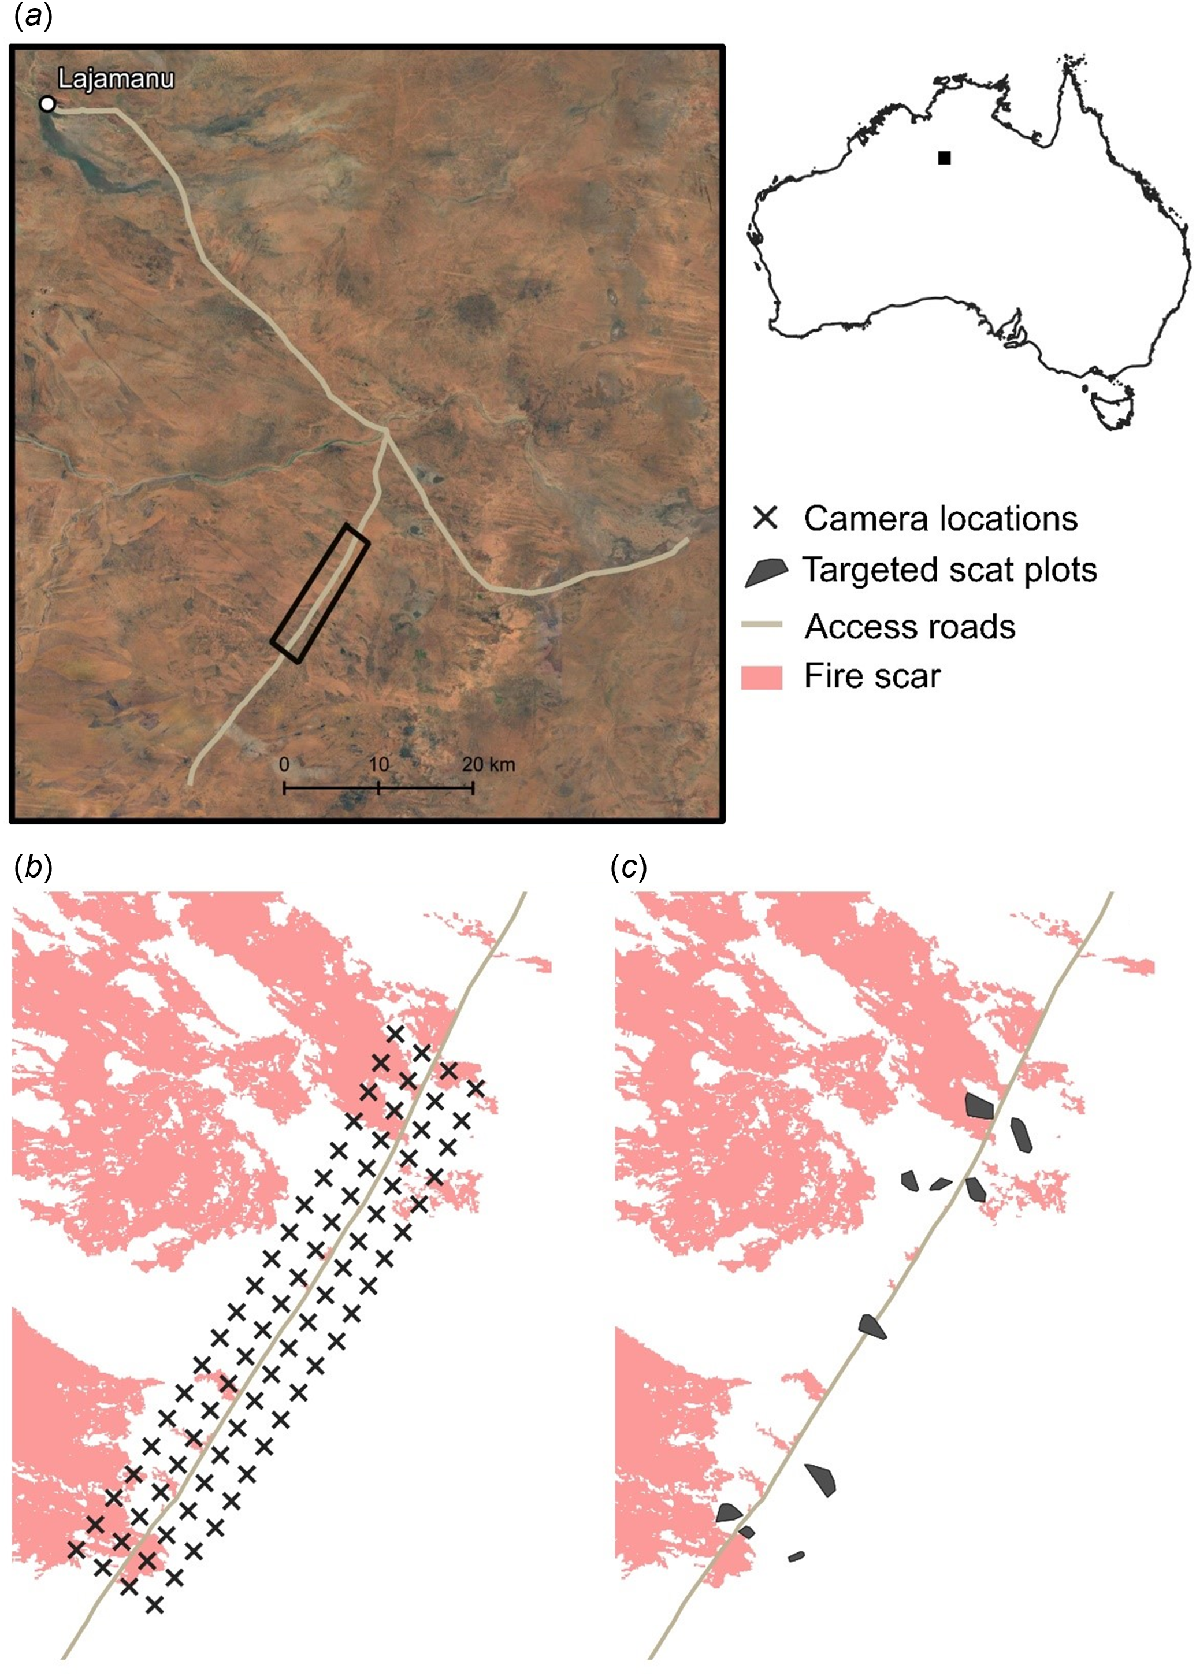
Bilbies are typically transient, moving around the landscape in response to available resources (Southgate et al. 2007b, 2018). Thus, to determine the broad distribution of bilby sign in the area and confirm whether bilbies were still present during the first round of sampling (April 2022), we flew (by helicopter) six standardised aerial transects, including three parallel to each side of the access track (Mirridi outstation road), with a seventh transect flown on the access track. Each standardised transect was 35 km in length and was spaced 500 m apart. The transect along the track was 49.6 km in length. Transect spacing was selected to maximise the likelihood of encountering fresh bilby sign, while also ensuring that we could reasonably walk to each of the transect locations from the road (i.e. <2 km). A Robinson 44 helicopter was used for surveys and flown at a height of 15–20 m above the ground at a speed of 355–65 km per h. One experienced observer sat in the front passenger seat of the helicopter and one experienced observer sat behind the pilot in the back seat. During the survey, observers scanned from their side of the helicopter out to ~100 m, making note of bilby sign (burrows or diggings). Bilby sign is distinct, and can be readily distinguished from the sign of other arid-dwelling animals (Southgate et al. 2018), although confirming the age of sign is sometimes difficult from the air, and requires ground-truthing. When an observer saw potential bilby sign, the helicopter circled back and hovered over the sign. If the sign appeared to be from a bilby, the helicopter landed, and observers alighted to ground-truth the sign. All records of bilby sign from aerial transects were ground-truthed and, where possible, aged. Sign was considered to be ‘fresh’ if it was estimated to be <2 weeks old (i.e. where soft loose spoil was associated with diggings and burrows). The extent of the Mirridi study area was then chosen to encompass most of the fresh bilby sign encountered on aerial transects, with the size of the site determined on the basis of available resources (e.g. the number of motion-sensor cameras available) (Fig. 1a).
The location of (a) the study area at Mirridi, ~40 km south-east of Lajamanu in the northern Tanami Desert, Northern Territory; (b) motion-sensor camera-traps; and (c) targeted bilby (Macrotis lagotis) scat-collection plots. The pink shading in (b) and (c) indicates the area burnt during planned fire management in July 2022.
Camera-trapping
We deployed 80 motion-sensor camera-traps (PC800, Reconyx, Wisconsin, USA) in four rows of 20, established in a roughly 15 × 2.5 km grid intersecting Mirridi road (Fig. 1b). Cameras were spaced ~750 m apart and set horizontally to target medium–large animals (including bilbies and their predators). Grid size and camera spacing were chosen to accommodate bilby and predator home ranges, ensuring that the grid was large enough to cover several bilby home ranges (based on published estimates of average bilby home-range size (3.16 km2 for males) (Moseby and O’Donnell 2003).
Cameras were mounted on metal fence posts ~70 cm above the ground, facing south (to minimise false triggers associated with sun glare), tilted slightly down and targeting a point on the ground 2–3 m away from the camera. Cameras were unbaited, as we were interested in detecting natural movements of bilbies and predators across the landscape, which may have been confounded if individuals were lured to cameras. Camera sensitivity was set to high, and each trigger was set to capture three images at low resolution (3 MP) to prolong battery life. Vegetation within the range of the focal point and immediately surrounding the camera was cleared to minimise the chance of false triggers, maximise ease of species identification, and reduce possible damage in the event of a wildfire. Each three-photo sequence was treated as a single detection event, and in cases where more than one event (of the same species) occurred within 60 min, they were considered to be from the same event. Images were processed using CPW Photo Warehouse, a Microsoft Access application designed to facilitate archiving, identifying, summarising and analysing photo data collected from remote wildlife cameras (Ivan and Newkirk 2016).
Analysis of camera data was restricted to bilbies, cats, and foxes. Although we were also interested in investigating bilby–dingo (Canis dingo) and dingo–cat/fox interactions in response to fire, we did not detect any dingoes on cameras, despite other evidence of their presence (direct sightings and observation of sign). We suspect that this may be because cameras were located off-road. Although research from other locations suggests that all three predators are more likely to be detected on tracks or roads (e.g. Raiter et al. 2018; Geyle et al. 2020; Wysong et al. 2020), this relationship is generally stronger for dingoes, with some studies suggesting close to zero success in detecting dingoes when cameras are deployed off-road (G. Neave, unpubl. data).
Camera-trapping was conducted between May 2022 and May 2023, for 2 months before planned fire management was conducted and for 10 months after.
Bilby scat collection and genetic sampling
‘Kuna’ (scat) was collected at 10 locations within the study area (Fig. 1c) where fresh bilby sign was detected (generally an active burrow), either during aerial surveys or with help from Warlpiri ‘kuyu-pungu’ (master trackers). Intensive scat collection at these sites involved three or more observers searching for scat in different locations near the starting point following a meandering plot-based approach, which typically involved following bilby tracks. The search effort was standardised at nine hours total across observers (e.g. three observers for 3 h, or six observers for 1.5 h) unless the equivalent of an hour search time passed without any observers locating any new scat or fresh sign. Observer experience in locating and identifying bilby scat varied; however, all observers with no prior experience were given the opportunity to shadow and learn from kuyu-pungu. Additionally, one experienced observer was present on all surveys (having undertaken prior training with kuyu-pungu), providing some level of consistency among plots and sampling periods. Targeted plot searches were undertaken ~6 weeks before planned burning, and within 2 weeks after planned burning (i.e. there was ~2 months between the two sampling occasions).
When scat was encountered, we recorded the GPS location, the number of pellets present, the age of the scat, whether it was buried or exposed, and whether it was found at a burrow, near a digging, or in the open. Scat was then collected in a small paper envelope, given a unique ID and placed in a sealed container full of silica gel beads to dry it. All pellets that were deposited close to one another were likely to be from the same individual (Dziminski et al. 2021), and consequently, were stored together. The containers were transferred from the field in a cooler bag and stored at room temperature prior to processing. Only scat samples suspected to be less than 2 weeks old were collected. This was judged on the basis of several factors, including the colour of the scat, odour potency, and evidence of other fresh sign in the immediate vicinity of the deposit (e.g. diggings with fresh soil spools) (Dziminski et al. 2021).
Scat samples were sent to the Australian Genome Research Facility for DNA extraction and genotyping. Genomic DNA extraction was performed using a Nucleospin Tissue Kit (Macherey–Nagel, Germany) with the following two modifications: (i) 25 mg of scat was homogenised in lysis buffer with a TissueLyser II (QIAGEN, Denmark); and (ii) following incubation at 56 degrees, the lysate was precipitated with acetate buffer solution. Custom genotyping was undertaken using the single-nucleotide polymorphism (SNP) panel described in Hogg et al. (2023), made up of 35 autosomal and four sex-linked markers. This panel was designed using samples obtained from a separate population of bilbies in Western Australia (see supplementary note 2.5. of Hogg et al. 2023 for further details); however, early trials suggested that it was also likely to work well for Northern Territory bilby populations. This approach has been shown to provide highly accurate identification of individual bilbies from scats (Hogg et al. 2023).
Fire history, vegetation composition, and fire management
Our camera-traps were placed in locations with relatively uniform fire histories, in that none of the camera stations had burnt for at least 3 years (following widescale fires in 2018; Supplementary material Fig. S1). The lack of recent fires in the region contributed to the high fire fuel loads in some areas, and there was extensive variability in vegetation composition across the study site. For example, some areas comprised relatively open to dense spinifex (Triodia spp.) grassland, whereas others had almost no grass cover, and instead were dominated by shrubby vegetation (including Acacia and Grevillea spp.; Fig. S2). Other areas had a dominant grass and shrub layer, and supported many of the shrubs known to support root-dwelling larvae (an important food source for bilbies, e.g. A. hilliana and A. lysiphloia) (Liddle 2016) (Fig. S2). These different habitat types vary considerably in their flammability and fuel loads.
Following bilby and predator surveys in May and June 2022, the broader Mirridi area was burnt using matches and drip torches (Fig. 1). Burning was conducted by six rangers over 3 days from 11 to 13 July 2022. Fire severity ranged from moderate to severe (see Supplementary material Table S1 for descriptions of fire categories), with some areas patchily burnt and others uniformly. When areas burnt uniformly, it was typically due to high fuel loads, or because the area was dominated by highly flammable and dense vegetation (e.g. spinifex). In total, 31,910 ha was burnt, including smaller patches of the bilby–predator study area (Fig. 1).
Data analysis
Our purpose was to obtain the best estimates possible for multiple parameters (e.g. indices of density and indices of activity) for each species (bilby, cat and fox). To achieve this, we undertook a series of complementary analyses that enabled the best use of data collected via different sampling exercises to derive these estimates, while also ensuring that we had some consistent outputs to allow for direct comparisons among species and in response to fire. Each of these analyses is detailed in the sections that follow, with the rationale for its use.
Overlap in activity
To enable comparisons before and after planned fire management, we summarised the camera-detection data into the following six sampling periods of 2 months each: (i) pre-burn; (ii) post-burn (0–2 months); (iii) post-burn (2–4 months); (iv) post-burn (4–6 months); (v) post-burn (6–8 months); and (vi) post-burn (8–10 months). We plotted detections by latitude and longitude of camera locations to assess the level of spatial overlap among bilbies, cats, and foxes in each sampling period before and after planned fire management.
To investigate temporal interactions among bilbies, cats, and foxes, we created temporal activity profiles across each sampling period by using time stamps from camera photos (package ‘overlap’, ver. 0.3.9 in R) (https://cran.r-project.org/web/packages/overlap/index.html, Ridout and Linkie 2009). We plotted the smooth kernel-density functions to create a probability density distribution for each species’ activity pattern, and calculated the coefficient of overlap (Δ), which measures the total overlap between the two species’ temporal activity distributions (ranging from zero for no overlap to one for complete overlap). We calculated 95% confidence intervals for the estimated coefficients of overlap, using 5000 smoothed bootstrap samples for each species. To further explore the similarity among bilby, cat, and fox activity patterns, we used Mardia–Watson–Wheeler tests (package ‘circular’, ver. 0.5-0 in R) (https://cran.r-project.org/web/packages/circular/index.html, Agostinelli and Lund 2022) to detect differences in the mean angle, or angular variance of circular temporal data, indicating activity peaks.
Average normalised-difference vegetation index as a proxy for environmental changes associated with fire
To assess whether habitat changes associated with planned burning may affect bilby, cat, and fox activity, we summarised data collected from each camera station as binary detection/non-detection data, pooling by sampling occasion, so that there were six observations for each camera and each species combination.
We then used generalised linear models (GLM) with binomial error structure and logit link to investigate the extent to which bilby, cat, and fox activity are correlated with the normalised-difference vegetation index (NDVI). We collected data on fire patchiness and severity at each camera location; however, there were too few cameras in burnt areas to allow direct comparison of the effect of these variables on the species of interest (i.e. only 13 of 80 camera-traps were located within a burn scar). By measuring the difference between near-infrared light (which is reflected by vegetation) and red light (which is absorbed by vegetation), NDVI derives an indicator of vegetation ‘greenness’ (i.e. density and health) (Cramer et al. 1999), and is commonly used to assess post-burn vegetation recovery (reviewed in João et al. 2018). Average NDVI was derived from MODIS satellite data 16-day Terra Imagery at 250 m resolution (MOD13Q1 ver. 6). We calculated averages independently for each sampling period for inclusion in GLMs. We also tested for differences in average NDVI across sampling occasions (i.e. by modelling NDVI as the response variable and sampling occasion as the predictor variable).
Assigning individual bilby and cat identities and estimating density
We used the R package ‘ScatMatch’ (ver. 1.0.0) (https://github.com/dbca-wa/ScatMatch, Huntley 2022) implemented in R to process bilby SNP results. ScatMatch categorises genetic profiles of scats by assessing their pairwise similarity across loci. It facilitates the filtering of SNP genotyping data by using user-defined amplification thresholds across both samples and loci, thus enabling assessment of the putative number of unique individuals under different mismatch thresholds (h) (Prada et al. 2023). In studies using scat DNA, genotyping errors are common owing to the limited quality and quantity of DNA available in scat (e.g. Knapp et al. 2009), resulting in genetic mismatches among samples. Choosing analysis parameters that are either too stringent (e.g. high levels of amplification and little tolerance for mismatches) or too relaxed may thus lead to under- or overestimation of the number of unique individuals (Prada et al. 2023). So as to determine the appropriate level of filtering and mismatch threshold, we evaluated the number of groups under different values of h and the distribution of SNP differences within and among individuals (Fig. S3). A distinct separation between the two peaks in the distribution indicates a higher certainty regarding the ‘true’ number of unique individuals in the dataset (Ottewell et al. 2022).
We opted to retain samples with an amplification success rate of ≥80%, and used h = 6, because this threshold showed a clear separation between the distribution of mismatches among and within samples (Fig. S3). This mismatch threshold was higher than that typically used (usually h = 2–4), and may have had the effect of clustering scats from very closely related individuals (Prada et al. 2023), thereby underestimating the total number of bilbies present. Nevertheless, we adopted this conservative approach so as to mitigate the effect of over-splitting scat genotypes on the basis of genotyping errors rather than true genetic differences. We carefully inspected each scat assignment for consistency and patterns of recapture to ensure that there were no outliers, and found no evidence to suggest that our approach was over-clustering scats.
We used information on individual bilbies obtained from DNA extracted from bilby scat to estimate the minimum number of bilbies known to be alive (MKA) before and immediately after fire. We also combined bilby identities with spatially explicit capture–recapture (SECR) modelling to estimate bilby densities, implemented via the ‘secr’ package (ver. 4.6.9) in R (https://cran.r-project.org/web/packages/secr/index.html, Efford 2023b). Because of the intensity of sampling required (up to 90 h search effort in each period), we were unable to undertake repeat sampling over consecutive days or weeks. However, in cases where animals leave multiple, individually identifiable ‘cues’ (i.e. scat), the ‘secr’ package accepts within-occasion ‘recaptures’ (Efford 2011), so we were able to construct models from targeted plots without the need for repeat searches. We treated each sampling occasion as an independent survey, and used the polygon detector, where the polygon represented the search area within targeted plots. Polygon detectors differ from other modes of detection (e.g. point or proximity, associated with fixed trap stations) in that each detection may have different coordinates, and the coordinates are continuously distributed rather than constrained to fixed points by the field design (Efford 2023a). They also incorporate detection functions differently from other detectors; for instance, instead of measuring the decline in detection probability with distance from the home-range centre (typical of point and proximity detectors), they measure the cumulative hazard of detection (Efford 2023a). We used the hazard half-normal function to fit models of bilby density before and after fire, and a 4-km buffer around plots, by which to ensure that the area was large enough to encompass the home range of all bilbies detected during surveys. Although we had planned to undertake a third round of targeted sampling in the 10-month post-burn period, we were unable to achieve this because of logistical constraints (adverse weather events followed by widescale aerial burns), so the longer-term inferences of fire and predator impacts on bilbies are based on indices of abundance (e.g. capture rates and relative detection probabilities).
We assigned individual identities to cats captured on camera-traps by their unique pelage markings. Once all cats had been identified, the set of images was re-examined twice for any inconsistencies in identification. Some cats were unidentifiable because of having no unique pelage or body markings (e.g. black and ginger cats), whereas others could not be identified because of poor image quality or orientation towards the camera (i.e. where key identifying features were not visible). All unidentifiable cats were excluded from the analysis. We fitted secr models to the data using the proximity detector, where capture histories were collapsed to 24 h sampling occasions, and used a buffer of 10 km around the outermost coordinates of the camera-trap grid. We opted for a larger buffer because we expected cats to travel further in response to fire in the landscape (e.g. see McGregor et al. 2014). We used a half-normal detection function to fit models of cat density for each of the six sampling occasions, such as to allow direct comparisons to be made before and after fire on the basis of comparable data inputs (i.e. ~60 days of repeat sampling).
Owing to the limited number of fox detections and difficulties associated with individually identifying foxes from camera images (Dorning and Harris 2019), we were unable to estimate fox density, so further inferences are based on indices of abundance (capture rates and relative probability of detection). To allow comparison of the relative abundance of foxes and cats, we also investigated differences in cat capture rates and relative probability of cat detection through time.
Results
Camera-trap capture rates, relative detection probability and overlap in activity
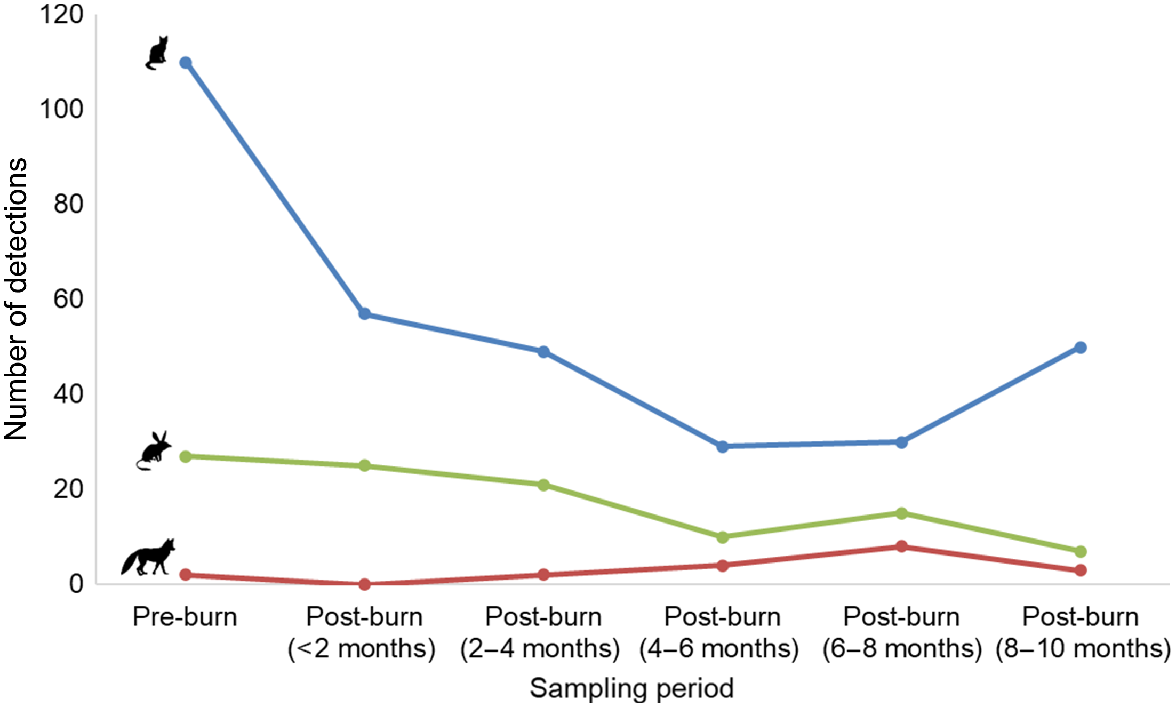
We obtained a total of 105 independent bilby detections, 325 independent cat detections and 19 independent fox detections over the duration of the study. Cats were detected in all parts of the camera grid, although the number of detections decreased by ~48% in the 2 months after planned fire management in the broader study area, before remaining relatively steady in the 2–10 months following fire (Figs 2, S4). Foxes were generally detected more frequently in the northern part of the grid (Fig. S5), whereas bilbies were detected in the northern, central, and southern parts of the grid (Fig. S6). The number of detections of foxes initially decreased (from two to zero in the <2 month post-burn period), before steadily increasing through time (from two, to four, to eight in subsequent sampling periods; Fig. 2). In contrast, bilby detections decreased through time, never returning to pre-fire levels (Fig. 2). Detections at unburnt camera stations decreased or remained relatively steady for all three species relative to pre-fire detections (Fig. S7). At burnt camera stations, the number of bilby detections initially increased, before decreasing in the 2–6 month post-burn period (Fig. S7). Foxes were more frequently detected at burnt camera stations in the 4–10 month post-burn period, whereas cat detections at burnt camera stations declined steadily through time, before increasing in the 8–10 month post-burn period (Fig. S7).
The total number of independent bilby (Macrotis lagotis, green), cat (Felis catus, blue) and fox (Vulpes vulpes, red) detections obtained from camera-traps deployed between May 2022 and May 2023 at Mirridi, ~40 km south-east of Lajamanu in the northern Tanami Desert, Northern Territory. Detections are summarised in 2-month increments for comparison. Note that 16% of camera-traps were in burnt locations following the fire (see Fig. S7 for burnt and unburnt locations plotted separately).
There were relatively few instances of cats and foxes (five in total), or bilbies and foxes (two in total) being detected on the same camera in the same sampling period (Table S2), whereas cats and bilbies were commonly detected on the same camera in the same sampling period (25 in total; Table S2). Nevertheless, bilbies were detected less frequently in areas where foxes were more common, despite having previously occupied these areas (e.g. the northern part of the camera grid in the >4 months post-burn sampling periods; Figs S5, S6).
There were no significant differences in the relative probability of detecting foxes or bilbies through time (evident by overlapping 95% confidence intervals; Fig. S8). The probability of detecting cats declined through time, with detection highest in the pre-burn sampling period, and lowest in the 8–10 month post-burn sampling period (Fig. S8).
Overall, there was a high degree of temporal overlap between cats, foxes and bilbies (Δ ≥ 0.675) across the study area and during all sampling times (Table 1, Fig. 3). Foxes and bilbies showed the greatest overlap in activity (Δ = 0.76), followed by cats and bilbies (Δ = 0.71), and cats and foxes (Δ = 0.68; Table 1). All three species were most active between dusk and dawn, with only cats exhibiting some diurnal activity (Fig. 3). There was some evidence to suggest differences in peak activity times for cats and bilbies (W = 39.747, p = <0.01) and cats and foxes (W = 10.898, p = <0.01; Table 1). By contrast, there was less support to suggest a difference in peak activity times for foxes and bilbies (W = 4.748, p = <0.09; Table 1).
| Sampling period | Species | Activity overlap | W–W | ||||
|---|---|---|---|---|---|---|---|
| Overlap Δ | LowerCI | UpperCI | W | P-value | |||
| Overall (all sampling periods) | Bilby/cat | 0.709 | 0.657 | 0.812 | 39.7 | <0.01 | |
| Bilby/fox | 0.759 | 0.544 | 0.919 | 4.75 | 0.09 | ||
| Cat/fox | 0.675 | 0.502 | 0.819 | 10.9 | <0.01 | ||
Watson–Wheeler (W–W) test results indicate significant differences in peak activity times when P < 0.05.
Overall (across all sampling periods) temporal overlap in cat (Felis catus), fox (Vulpes vulpes) and bilby (Macrotis lagotis) activity. Data obtained from camera-traps deployed from May 2022 to May 2023 at Mirridi, ~40 km south-east of Lajamanu in the northern Tanami Desert, Northern Territory.
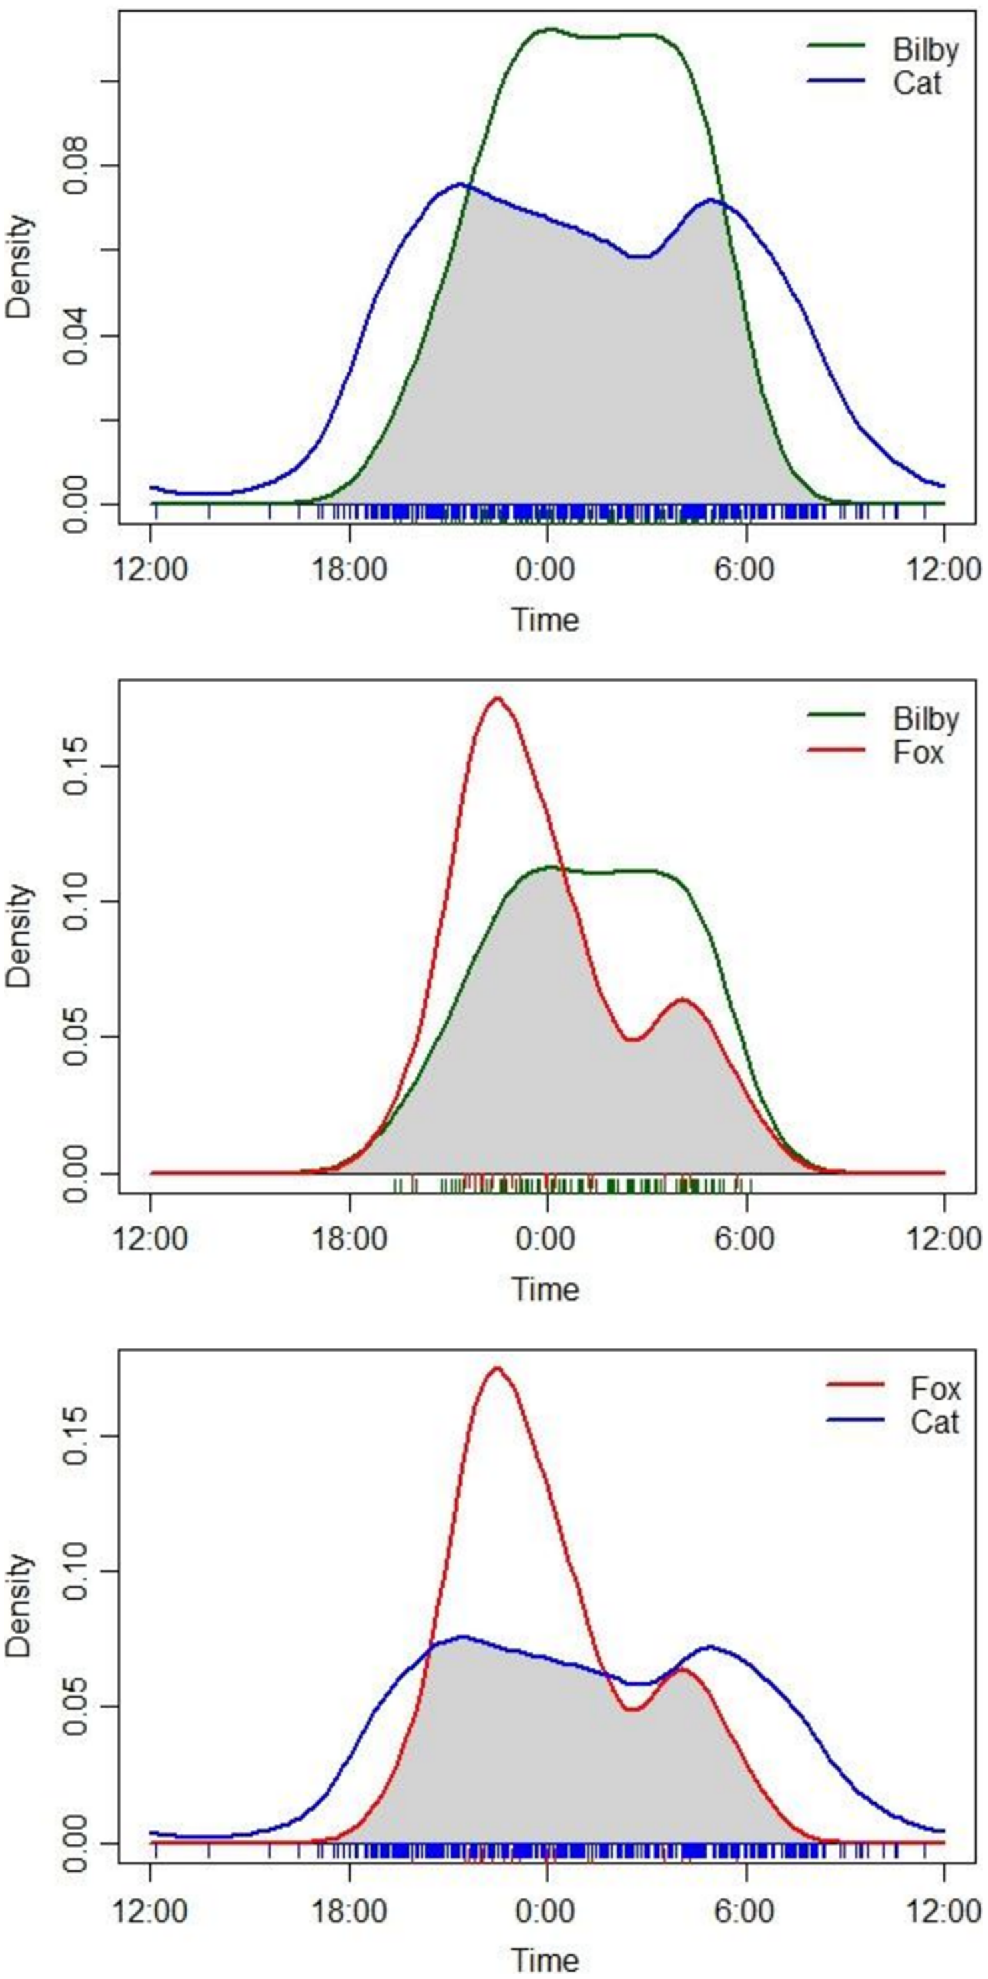
The extent of overlap in temporal activity of cats, foxes, and bilbies varied among sampling periods; cat and bilby activity overlapped most in the pre-burn sampling period (Δ = 0.8), and least in the post-burn (8–10 months) sampling period (Δ = 0.50; Table S3). Both bilby and fox overlap (Δ = 0.79) and cat and fox overlap (Δ = 0.62) were highest in the post-burn (8–10 months) sampling period (Table S3). However, whereas overlap in bilby and fox activity was also high in the post-burn (6–8 months) sampling period (Δ = 0.67), cat and fox overlap was at its lowest (Δ = 0.38; Table S3). Similarly, whereas overlap in cat and bilby activity was high in the post-burn (4–6 months) sampling period (Δ = 0.73), cat and fox activity overlap was low (Δ = 0.39) (Table S3). There were too few fox detections to enable reliable estimation of activity overlap in the pre-burn, post-burn (<2 months) and post-burn (2–4 months) sampling periods (Table S3). We were unable to compute Mardia–Watson–Wheeler tests on data subset by sampling period because of insufficient numbers of observations.
NDVI as a proxy for habitat change associated with fire
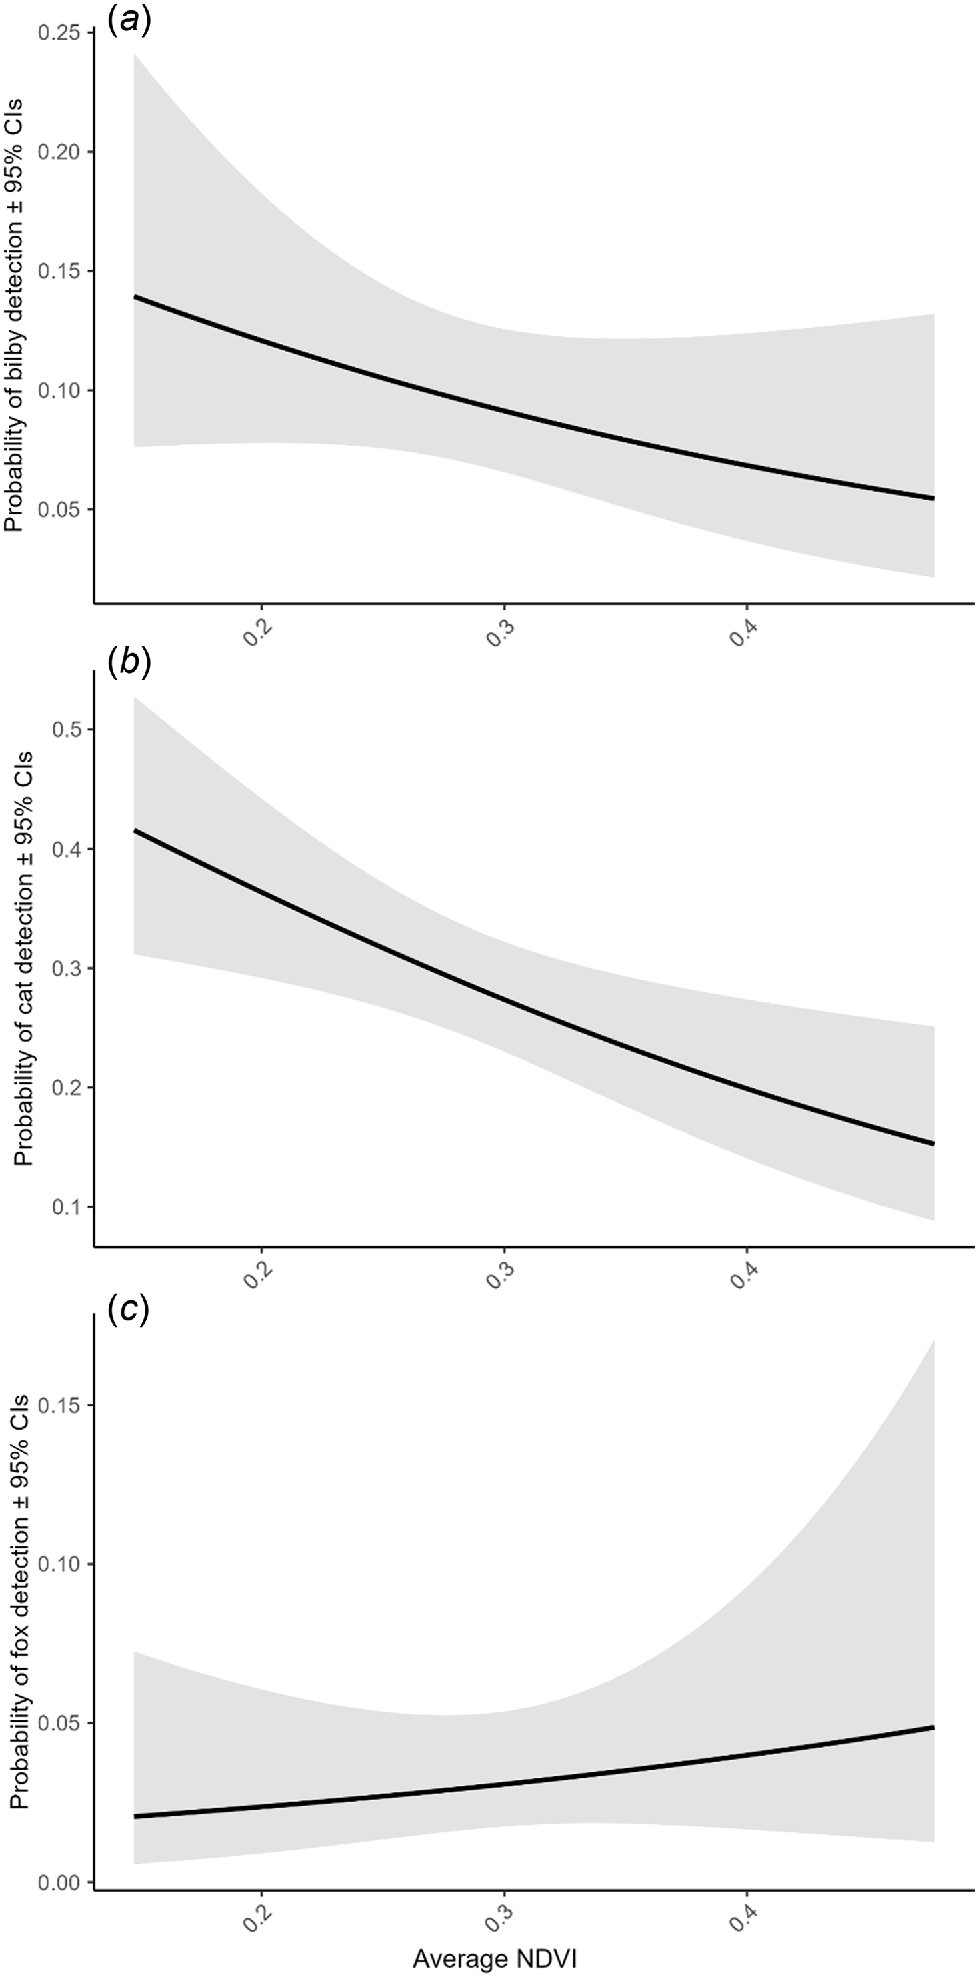
Average NDVI dropped significantly in the period immediately after fire was applied to the broader study region (0–4 months), before increasing to greater than pre-burn levels in periods >4 months post-burn (Fig. S9). Bilbies and cats were more likely to be detected in areas with a lower average NDVI (Fig. 4a, b). By contrast, there was a small positive relationship between the relative probability of fox detection and increasing average NDVI (although confidence intervals were wide; Fig. 4c).
Cat and bilby density
We collected a total of 455 bilby scats in the pre-burn period (of which 245 could be allocated an individual ID) and 197 scats in the post-burn period (of which 157 could be allocated an individual ID; Table S4). Higher success in genotyping scats in the post-burn period than in the pre-burn period may be attributed to a much smaller proportion of ‘older’ scats being collected (3% compared with 44%). This was due to there being a relatively short time window between burning activities and the second round of scat collection (i.e. we only collected samples that we thought had been deposited after planned fire management). All further inferences are derived from samples from which we were able to allocate an individual bilby ID.
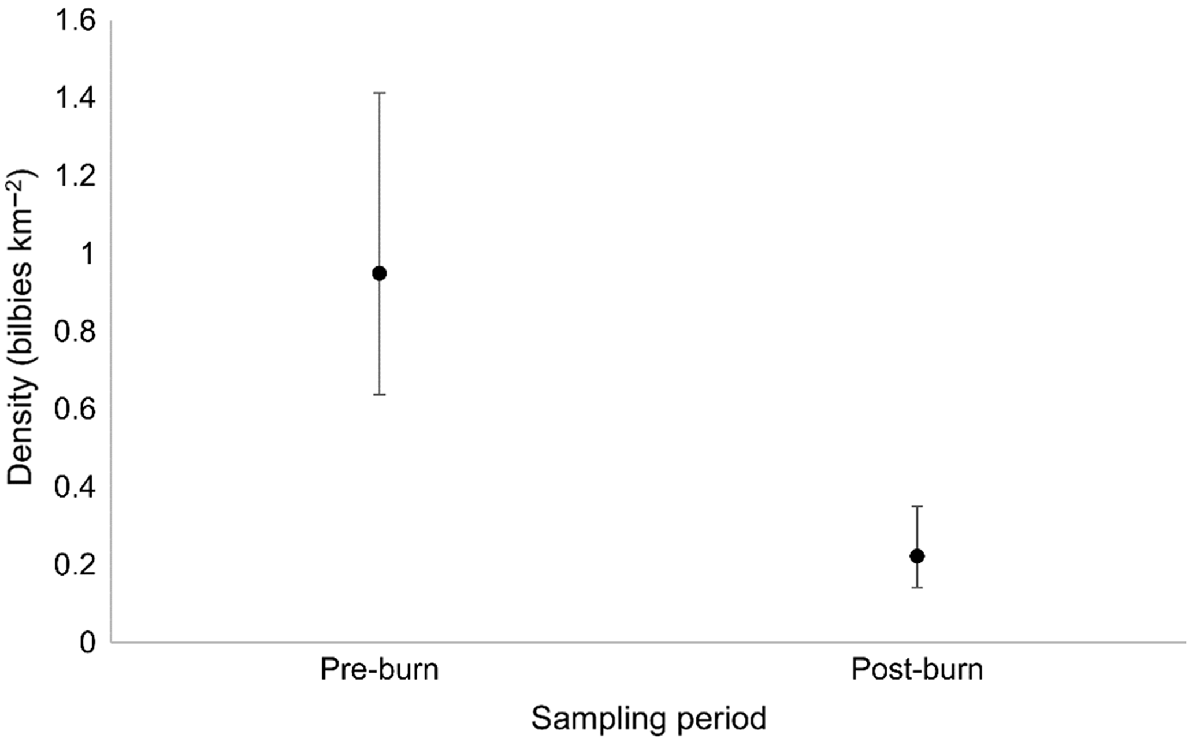
In total, 26 individual bilbies were detected in the pre-burn period, compared with a total of 20 individuals in the post-burn period (Table S4). Fourteen individuals were detected in both time periods, 12 individuals were detected only in the pre-burn period, and six individuals were detected only in the post-burn period (Table S4). Bilby density estimated from secr models (i.e. taking into consideration detectability and individual recaptures) was significantly lower in the post-burn period (0.22 bilbies km−2, CI = 0.081–0.127) than in the pre-burn period (0.95 bilbies km−2, CI = 0.311–1.463; Fig. 5).
The mean density of bilbies before and after planned fire management at Mirridi, ~40 km south-east of Lajamanu in the northern Tanami Desert, Northern Territory. Density estimates are derived from spatially explicit capture–recapture models, fitted using genetic data obtained from targeted scat surveys, and assuming constant densities across space. Error bars represent 95% confidence intervals.
We recorded a total of 237 detections (collapsed to 24 h periods) of identifiable cats (a minimum of 15 individuals) and 96 detections of non-identifiable cats over the entire sampling period. Four individual cats were detected in all six sampling periods, and five individual cats were detected in only one sampling period (Table S5).
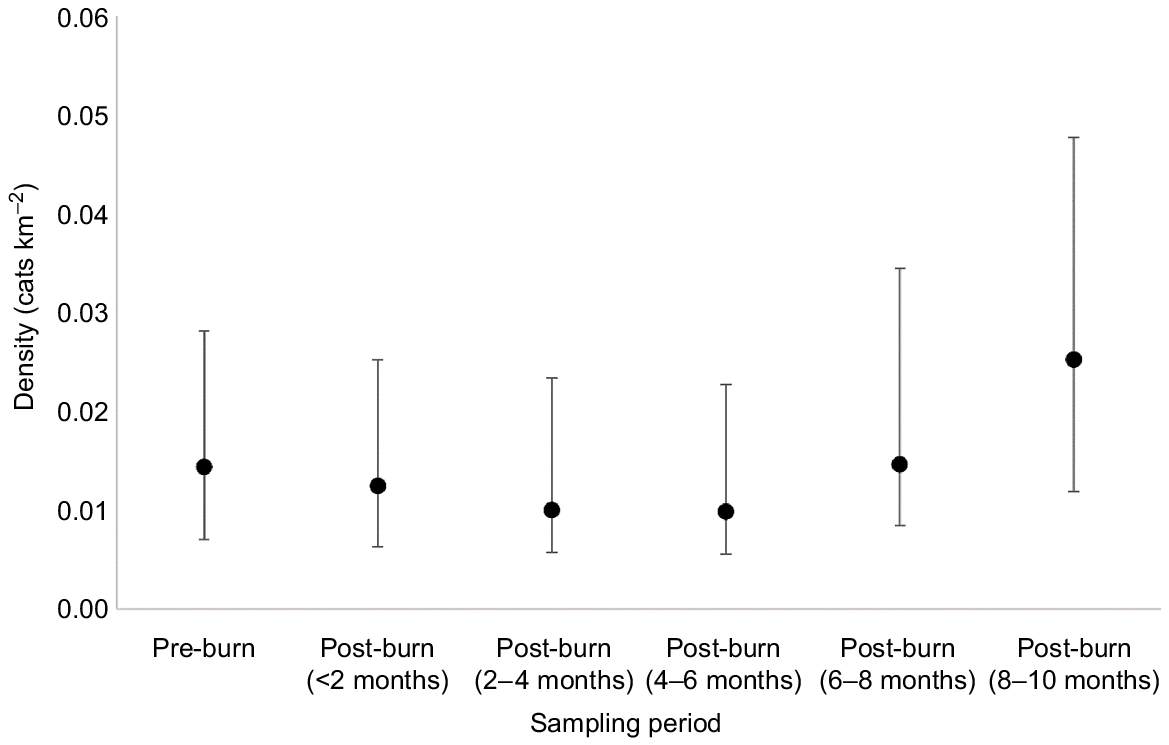
Cat density was lowest in the 2–6 month sampling periods (0.010 cats km−2, CI = 0.004–0.023), and highest in the 8–10 month sampling period (0.025 cats km−2, CI = 0.013–0.048), although this was not statistically significant (evident by overlapping 95% confidence intervals; Fig. 6).
The mean density of cats at Mirridi, ~40 km south-east of Lajamanu in the northern Tanami Desert, Northern Territory. Density is calculated in 2-month increments for comparison before and after planned fire management. Density estimates are derived from spatially explicit capture–recapture models, fitted using camera-trap data, and assuming constant densities across space. Error bars represent 95% confidence intervals.
Discussion
We used camera-trapping and non-invasive genetic sampling of scats to investigate bilby–predator interactions in response to planned burning in a remote part of the Tanami Desert. Consistent with our expectations, we found a decrease in bilby activity and density, and an increase in fox activity after planned fire management, despite the majority of the study area remaining unburnt (however, fires were widespread in the adjacent area). Although we detected too few foxes in the pre-burn period to directly compare activity overlap between bilbies and foxes before and after fire, we did find a high degree of temporal overlap in daily activity between the two species across the entire sampling period, with little evidence to suggest a difference in peak activity times. We also detected fewer bilbies in areas where foxes were present following fire. Contrary to our expectations, we found a decrease in cat activity through time, and a decrease in the amount of temporal overlap between bilbies and cats in the post-burn sampling periods (compared with the pre-burn period), despite a higher degree of spatial overlap.
Relatively constant bilby capture rates immediately following fire in the broader study area, but steady declines in periods of longer duration post-burn, could indicate that bilbies were able to persist in the same locations in the short-term, but not over longer periods. This is consistent with other studies that have shown low direct mortality as a result of fire (Legge et al. 2008; Andersen 2021; Jolly et al. 2022). Two factors may have contributed to the longer-term decline in bilbies after fire; emigration from the study area and/or increases in fox activity. There is little published evidence to suggest small mammals disperse in direct response to fire. However, dispersal could be attributed to changes in resource availability. For example, we documented a large increase in vegetation growth and productivity in the medium term (4–6 months post-burn, measured as average NDVI) in response to heavy rainfall in the region. Whereas other small mammals may use dense vegetation as cover from predators (e.g. Doherty et al. 2015a), bilbies favour relatively open habitats (Southgate 1990; Dawson et al. 2018), likely owing to their high mobility and generalist diet (Southgate et al. 2007a, 2018). Additionally, bilbies occupy deep, complex burrow systems (Smyth and Philpott 1968), which may reduce their need for dense vegetation for shelter.
Another factor may be that the fire destroyed some of the key bilby food plants in the region. Although not measured explicitly, we did observe many dead mature Acacia shrubs (i.e. those likely to support root-dwelling larvae) following fire, particularly in the northern and southern parts of the camera grid, where bilbies were detected most frequently in the months prior to implementation of fire management. Liddle (2016) found that root-dwelling larvae were an important food source for bilbies in the Tanami Desert, and that larvae availability and diggings associated with larvae host shrubs were concentrated in patches of longer-unburnt vegetation. Bilbies are able to extract grubs from killed shrubs for the first month after fire (Liddle 2016), but may move into other locations once this food source is depleted. Although it is likely that bilbies also consume other invertebrates and plant material within the study region, some of which may be promoted by fire (Southgate and Carthew 2006), it is possible that the loss of larvae-host shrubs may have contributed to the decreased activity and bilby abundance we found following fire. However, given that much of the study area remained unburnt, and foxes showed a positive response to increased NDVI, it is more likely that declines in bilby activity and density are associated with increased risk of predation. It is thus possible that increased fox activity served as a further prompt for bilbies to emigrate from productive patches to more open habitats post-burn, or that increased predation pressure by foxes led to direct mortality. For example, foxes may have been attracted to the main fire scar for the first months post-burn, depredating those animals more vulnerable because of the lack of cover for shelter. If this is the case, it is likely that the foxes would retreat to adjacent unburnt patches once food resources are depleted, and, consequently, could have disproportionate impacts on animals persisting in these locations over the longer term.
We observed a decrease in cat detections following fire in the broader study area, despite finding no significant difference in cat densities through time. This may be related to seasonal factors, and, in particular, temperature. Cat capture rates were highest in May to August (corresponding to cooler overall temperatures), before dropping off over the warmer months (September to February). One possible explanation for this may be that key prey items such as reptiles and insects (Woinarski et al. 2018; Woolley et al. 2020) were easier to find during the warmer months, so cats did not have to travel as far to forage. Similarly, we observed a high incidence of spinifex-hopping mice (Notomys alexis) in the landscape in the pre-burn period, which may have altered cat activity. Another possibility is that cat activity was limited by an increased prevalence of foxes in the region. Cats generally occupy a mesopredator role, and studies from elsewhere in Australia have shown that they can be suppressed by larger carnivores (e.g. Brook et al. 2012; Marlow et al. 2015; Hunter et al. 2018). This could occur through either spatial avoidance (where cats use different sites than do foxes), or temporal avoidance (where cats use the same sites as foxes but at different times). Although we did find that cats and foxes used some of the same sites, temporal overlap between the two species was relatively low (~68% on average), and peak activity times differed. These findings provide some support to suggest that foxes may have been suppressing cat activity. It is also possible that the decrease in cat activity (despite stable estimates of density) is explained by cats foraging in the extensively burnt patches of habitat adjacent to the study area, and this has been documented in other studies. For example, McGregor et al. (2014) found that cats selected areas that were recently burnt by intense fires, but only in habitats that typically supported a high abundance of small mammals (generally avoiding fire scars in other circumstances).
Cats and foxes may both have contributed to the observed post-burn declines in bilby activity and density through increased predation pressure, although we found limited evidence to support a likely increase in cat predation associated with fire. Of particular concern was the high incidence of temporal overlap between foxes and bilbies, and the limited support to suggest differences in peak activity times. Bilbies have not historically persisted in areas with high fox activity (Abbott 2001; DCCEEW 2023), so this is a major concern for the local population. Bilbies had high spatial overlap with cats, but there was evidence to suggest differences in peak activity times. If bilbies were avoiding cats and not foxes, this could be indicative of local adaptation (i.e. bilbies have co-existed with cats in this region for many years, whereas foxes have typically been absent, particularly during drought periods). Another important consideration is the absence of dingoes from our analysis. Dingoes may be a direct threat to bilbies (Augusteyn et al. 2021), although they have not been widely linked to the decline of the species (Southgate et al. 2007b). Dingoes may also have a positive influence on bilbies through suppression or displacement of cats and foxes (Letnic et al. 2009; Kennedy et al. 2012). Although there was some evidence of dingoes in the area, we did not capture any dingoes on camera, which could indicate low prevalence, or the use of other areas within the broader landscape as hunting grounds. Further work is required to determine whether the absence or low prevalence of dingoes may be contributing to changes in cat and fox behaviour or population size.
We had limited capacity to measure the direct effects of the planned burning on bilbies and their predators, although we did observe increases in fox activity following fire, decreases in bilby and cat activity, and some changes in the extent of overlap in the species’ space use and daily activity through time (however, we note that this may be a result of environmental factors other than the fire itself, e.g. higher than average rainfall). This limitation was due primarily to the practicalities associated with implementing fire management over a large area in such a way that it was likely to be useful for land managers. For example, early consultations with the Traditional Custodians and rangers showed that it would be virtually impossible to exclude fire from ‘control’ areas within the study region, particularly given the high fuel loads following several years of wet conditions. This was due in part to the limited resources and/or capacity of rangers to establish fire breaks, and meant that we were unable to implement a more robust before-after-impact-control experiment. Although such an approach is recommended for teasing apart complex relationships in response to management actions, this is likely to be extremely challenging to implement in open, remote landscapes. One solution might be to intensively sample two comparable areas, one subject to widescale burning, and one where fire is excluded, although this approach brings other challenges (e.g. increased environmental variability associated with the distance required to ensure that the unburnt site remains unburnt). Another approach might be to implement an experiment where both fire and predator densities are manipulated, because such a study is likely to provide the strongest evidence regarding impacts of predator–fire interactions on prey population dynamics (Doherty et al. 2022).
Despite limitations, our study has contributed to the understanding of bilby–predator interactions through time in an area subject to ongoing and regular fire management. Importantly, our findings demonstrated that broad-scale fire may have negative consequences for bilby populations, most likely owing to associated increases in predation pressure. This is despite much of the actual study area remaining unburnt, and suggests that increases in fox activity in the broader area are likely to have devastating consequences for the local bilby population. This may be further exacerbated by the 2023 late-season (September to December) wildfires that burnt the vast majority of the bilby’s wild distribution (including ~70% of the Northern Tanami IPA where this study was undertaken). It is thus vital that appropriate management activities be put in place to protect bilbies from foxes. Fox baiting is likely to be contentious because of the high risk to dingoes, which are of high cultural significance to First Nations peoples. Additionally, non-target uptake of baits by dingoes could lead to increases in the fox population because of meso-predator release (Doherty and Ritchie 2016). However, recent modifications to canid pest ejectors (attaching a rectangular metal ‘collar’ to the device) have the potential to enable fox control while preventing dingoes from being poisoned, owing to morphological differences in the size and shape of the nose of the two species (Peter McDonald, Northern Territory Department of Environment, Parks and Water Security (DEPWS), pers. comm.). Recent trials have shown some success (Peter McDonald, DEPWS, pers. comm.), but further work is required to discern whether this device can limit access by juvenile dingoes. Fox impacts may also be limited by other forms of lethal control, for example, hunting and shooting, trapping with soft-jaw traps and den destruction, as well as Felixer traps, which use rangefinder sensors to distinguish cats and foxes from non-target wildlife (before spraying targets with a toxic gel). These approaches are likely to be better supported by the local community, although they are generally labour-intensive, expensive to implement and have varying success (Saunders et al. 2010). Given the threat to the bilby population, we recommend a combination of both lethal control (in areas where bilbies are likely to be at high risk from fox predation) and other indirect methods that may be more feasible over larger spatial scales (e.g. fire and feral herbivore management to maintain a diversity of habitat types and structures).
Data availability
The data that support this study are owned by multiple parties, and cannot be made publicly available. Data may be shared upon reasonable request to the corresponding author if all parties agree, and pending the establishment of appropriate data sharing agreements.
Declaration of funding
Hayley Geyle was supported by a scholarship from the Research Institute for the Environment and Livelihoods (Charles Darwin University), through funding from Territory Natural Resource Management (from the Australian Government’s National Landcare Program) and through funding from the Holsworth Wildlife Research Endowment – Equity Trustees Charitable Foundation and the Ecological Society of Australia.
Acknowledgements
We thank the Murnkurrumurnkurru Gurindji and Warlpiri Rangers, key Central Land Council staff (especially Andrew Love, Kim Webeck, Clifford McGinness, Alice Fredericks and Phil Harris), the Northern Tanami IPA Committee, and the many volunteers that assisted with fieldwork. We also thank Jeremy Garnett of Top End Editing. Acknowledgement of Traditional Custodians and Country: this research was undertaken on the traditional lands of the Gurindji and Warlpiri people. We pay our respects to the elders, both past and present, and recognise their connection to, and role in caring for and maintaining Country over thousands of years.
References
Abbott I (2001) The Bilby Macrotis lagotis (Marsupialia: Peramelidae) in south-western Australia: original range limits, subsequent decline, and presumed regional extinction. Records of the Western Australian Museum 20(3), 271-306.
| Google Scholar |
Agostinelli C, Lund UR (2022) package ‘circular’: Circular Statistics (version 0.4-95). Available at https://r-forge.r-project.org/projects/circular/
Andersen AN (2021) Faunal responses to fire in Australian tropical savannas: insights from field experiments and their lessons for conservation management. Diversity and Distributions 27(5), 828-843.
| Crossref | Google Scholar |
Augusteyn J, Rich M, Story G, Nolan B (2021) Canids potentially threaten bilbies at Astrebla Downs National Park. Australian Mammalogy 43(3), 300-310.
| Crossref | Google Scholar |
Brook LA, Johnson CN, Ritchie EG (2012) Effects of predator control on behaviour of an apex predator and indirect consequences for mesopredator suppression. Journal of Applied Ecology 49(6), 1278-1286.
| Crossref | Google Scholar |
Burbidge AA, McKenzie NL, Brennan KEC, Woinarski JCZ, Dickman CR, Baynes A, Gordon G, Menkhorst PW, Robinson AC (2009) Conservation status and biogeography of Australia’s terrestrial mammals. Australian Journal of Zoology 56(6), 411-422.
| Crossref | Google Scholar |
Cramer W, Kicklighter DW, Bondeau A, Moore BD, III, Churkina G, Nemry B, Ruimy A, Schloss AL, The Participants of the Potsdam NPP Model Intercomparison (1999) Comparing global models of terrestrial net primary productivity (NPP): overview and key results. Global Change Biology 5(S1), 1-15.
| Crossref | Google Scholar |
Dawson SJ, Adams PJ, Moseby KE, Waddington KI, Kobryn HT, Bateman PW, Fleming PA (2018) Peak hour in the bush: linear anthropogenic clearings funnel predator and prey species. Austral Ecology 43(2), 159-171.
| Crossref | Google Scholar |
Dawson SJ, Broussard L, Adams PJ, Moseby KE, Waddington KI, Kobryn HT, Bateman PW, Fleming PA (2019) An outback oasis: the ecological importance of bilby burrows. Journal of Zoology 308(3), 149-163.
| Crossref | Google Scholar |
Doherty TS, Ritchie EG (2016) Stop jumping the gun: a call for evidence-based invasive predator management. Conservation Letters 10, 15-22.
| Crossref | Google Scholar |
Doherty TS, Davis RA, van Etten EJB (2015a) A game of cat-and-mouse: microhabitat influences rodent foraging in recently burnt but not long unburnt shrublands. Journal of Mammalogy 96(2), 324-331.
| Crossref | Google Scholar |
Doherty TS, Dickman CR, Nimmo DG, Ritchie EG (2015b) Multiple threats, or multiplying the threats? Interactions between invasive predators and other ecological disturbances. Biological Conservation 190, 60-68.
| Crossref | Google Scholar |
Doherty TS, Geary WL, Jolly CJ, Macdonald KJ, Miritis V, Watchorn DJ, Cherry MJ, Conner LM, González TM, Legge SM, Ritchie EG, Stawski C, Dickman CR (2022) Fire as a driver and mediator of predator–prey interactions. Biological Reviews 97(4), 1539-1558.
| Crossref | Google Scholar |
Dorning J, Harris S (2019) The challenges of recognising individuals with few distinguishing features: Identifying red foxes Vulpes vulpes from camera-trap photos. PLoS ONE 14(5), e0216531.
| Crossref | Google Scholar |
Dziminski MA, Carpenter FM, Morris F (2021) Monitoring the abundance of wild and reintroduced bilby populations. The Journal of Wildlife Management 85(2), 240-253.
| Crossref | Google Scholar |
Efford MG (2011) Estimation of population density by spatially explicit capture–recapture analysis of data from area searches. Ecology 92(12), 2202-2207.
| Crossref | Google Scholar |
Efford M (2023a) Polygon and transect detectors in secr 4.6. Available at https://www.otago.ac.nz/density/pdfs/secr-polygondetectors.pdf [Accessed 11 January 2024]
Efford MG (2023b) secr: Spatially explicit capture–recapture models. R package version 4.6.0. Available at https://CRAN.R-project.org/package=secr
Fleming PA, Anderson H, Prendergast AS, Bretz MR, Valentine LE, Hardy GES (2014) Is the loss of Australian digging mammals contributing to a deterioration in ecosystem function? Mammal Review 44(2), 94-108.
| Crossref | Google Scholar |
Geyle HM, Stevens M, Duffy R, Greenwood L, Nimmo DG, Sandow D, Thomas B, White J, Ritchie EG (2020) Evaluation of camera placement for detection of free-ranging carnivores; implications for assessing population changes. Ecological Solutions and Evidence 1(1), e12018.
| Crossref | Google Scholar |
Hoffmann M, Belant JL, Chanson JS, Cox NA, Lamoreux J, Rodrigues ASL, Schipper J, Stuart SN (2011) The changing fates of the world’s mammals. Philosophical Transactions of the Royal Society of London. Series B, Biological Sciences 366(1578), 2598-2610.
| Crossref | Google Scholar |
Hofstede L, Dziminski MA (2017) Greater bilby burrows: important structures for a range of species in an arid environment. Australian Mammalogy 39(2), 227-237.
| Crossref | Google Scholar |
Hogg CJ, Edwards RJ, Farquharson KA, Silver LW, Brandies P, Peel E, Escalona M, Jaya FR, Thavornkanlapachai R, Batley K, Bradford TM, Chang JK, Chen Z, Deshpande N, Dziminski M, Ewart K, Griffith O, Marin-Gual L, Moon KL, Travouillon KJ, Waters P, Whittington CM, Wilkins MR, Helgen KM, Lo N, Ho SYW, Ruiz-Herrera A, Paltridge R, Graves JAM, Renfree M, Shapiro B, Ottewell K, Rangers K, Belov K (2023) Extant and extinct bilby genomes combined with Indigenous knowledge improve conservation of a unique Australian marsupial. Nature Ecology & Evolution 8, 1311-1326.
| Crossref | Google Scholar |
Hradsky BA, Mildwaters C, Ritchie EG, Christie F, Di Stefano J (2017) Responses of invasive predators and native prey to a prescribed forest fire. Journal of Mammalogy 98(3), 835-847.
| Crossref | Google Scholar |
Hunter DO, Lagisz M, Leo V, Nakagawa S, Letnic M (2018) Not all predators are equal: a continent-scale analysis of the effects of predator control on Australian mammals. Mammal Review 48(2), 108-122.
| Crossref | Google Scholar |
Huntley B (2022) _ScatMatch: Functions to aid with processing mass array data_. R package version 1.0.0. Available at https://github.com/dbca-wa/ScatMatch
Ivan JS, Newkirk ES (2016) Cpw Photo Warehouse: a custom database to facilitate archiving, identifying, summarizing and managing photo data collected from camera traps. Methods in Ecology and Evolution 7(4), 499-504.
| Crossref | Google Scholar |
João T, João G, Bruno M, João H (2018) Indicator-based assessment of post-fire recovery dynamics using satellite NDVI time-series. Ecological Indicators 89, 199-212.
| Crossref | Google Scholar |
Johnson CN, Isaac JL, Fisher DO (2007) Rarity of a top predator triggers continent-wide collapse of mammal prey: dingoes and marsupials in Australia. Proceedings of the Royal Society B: Biological Sciences 274(1608), 341-346.
| Crossref | Google Scholar |
Johnson CN, Balmford A, Brook BW, Buettel JC, Galetti M, Guangchun L, Wilmshurst JM (2017) Biodiversity losses and conservation responses in the Anthropocene. Science 356(6335), 270-275.
| Crossref | Google Scholar |
Jolly CJ, Dickman CR, Doherty TS, van Eeden LM, Geary WL, Legge SM, Woinarski JCZ, Nimmo DG (2022) Animal mortality during fire. Global Change Biology 28(6), 2053-2065.
| Crossref | Google Scholar |
Kennedy M, Phillips BL, Legge S, Murphy SA, Faulkner RA (2012) Do dingoes suppress the activity of feral cats in northern Australia? Austral Ecology 37(1), 134-139.
| Crossref | Google Scholar |
Knapp SM, Craig BA, Waits LP (2009) Incorporating genotyping error into non-invasive DNA-based Mark—Recapture population estimates. The Journal of Wildlife Management 73(4), 598-604.
| Crossref | Google Scholar |
Legge S, Murphy S, Heathcote J, Flaxman E, Augusteyn J, Crossman M (2008) The short-term effects of an extensive and high-intensity fire on vertebrates in the tropical savannas of the central Kimberley, northern Australia. Wildlife Research 35(1), 33-43.
| Crossref | Google Scholar |
Legge S, Rumpff L, Garnett ST, Woinarski JCZ (2023) Loss of terrestrial biodiversity in Australia: magnitude, causation, and response. Science 381, 622-631.
| Crossref | Google Scholar |
Letnic M, Crowther MS, Koch F (2009) Does a top-predator provide an endangered rodent with refuge from an invasive mesopredator? Animal Conservation 12(4), 302-312.
| Crossref | Google Scholar |
Marlow NJ, Thomas ND, Williams AAE, Macmahon B, Lawson J, Hitchen Y, Angus J, Berry O (2015) Cats (Felis catus) are more abundant and are the dominant predator of woylies (Bettongia penicillata) after sustained fox (Vulpes vulpes) control. Australian Journal of Zoology 63(1), 18-27.
| Crossref | Google Scholar |
McGregor HW, Legge S, Jones ME, Johnson CN (2014) Landscape management of fire and grazing regimes alters the fine-scale habitat utilisation by feral cats. PLoS ONE 9(10), e109097.
| Crossref | Google Scholar |
McKenzie NL, Burbidge AA, Baynes A, Brereton RN, Dickman CR, Gordon G, Gibson LA, Menkhorst PW, Robinson AC, Williams MR, Woinarski JCZ (2007) Analysis of factors implicated in the recent decline of Australia’s mammal fauna. Journal of Biogeography 34(4), 597-611.
| Crossref | Google Scholar |
Moore HA, Yawuru Country Managers, Bardi Jawi Oorany Rangers, Nyul Nyul Rangers, Nykina Mangala Rangers, Gibson LA, Dziminski MA, Radford IJ, Corey B, Bettink K, Carpenter FM, McPhail R, Sonneman T, Greatwich B (2024) Where there’s smoke, there’s cats: long-unburnt habitat is crucial to mitigating the impacts of cats on the Ngarlgumirdi, greater bilby (Macrotis lagotis). Wildlife Research 51(5), WR23117.
| Crossref | Google Scholar |
Moseby KE, O’Donnell E (2003) Reintroduction of the greater bilby, Macrotis lagotis (Reid) (Marsupialia: Thylacomyidae), to northern South Australia: survival, ecology and notes on reintroduction protocols. Wildlife Research 30(1), 15-27.
| Crossref | Google Scholar |
Raiter KG, Hobbs RJ, Possingham HP, Valentine LE, Prober SM (2018) Vehicle tracks are predator highways in intact landscapes. Biological Conservation 228, 281-290.
| Crossref | Google Scholar |
Ridout MS, Linkie M (2009) Estimating overlap of daily activity patterns from camera trap data. Journal of Agricultural, Biological, and Environmental Statistics 14(3), 322-337.
| Google Scholar |
Saunders GR, Gentle MN, Dickman CR (2010) The impacts and management of foxes Vulpes vulpes in Australia. Mammal Review 40(3), 181-211.
| Crossref | Google Scholar |
Short J, Smith A (1994) Mammal decline and recovery in Australia. Journal of Mammalogy 75(2), 288-297.
| Crossref | Google Scholar |
Smyth D, Philpott C (1968) Field notes on rabbit bandicoots, Macrotis lagotis Reid (Marsupialia) from central Western Australia. Transactions of the Royal Society of South Africa 92, 3-17.
| Google Scholar |
Southgate R, Carthew SM (2006) Diet of the bilby (Macrotis lagotis) in relation to substrate, fire and rainfall characteristics in the Tanami Desert. Wildlife Research 33(6), 507-519.
| Crossref | Google Scholar |
Southgate R, Carthew SM (2007) Post-fire ephemerals and spinifex-fuelled fires: a decision model for bilby habitat management in the Tanami Desert, Australia. International Journal of Wildland Fire 16(6), 741-754.
| Crossref | Google Scholar |
Southgate R, Paltridge R, Masters P, Carthew S (2007a) Bilby distribution and fire: a test of alternative models of habitat suitability in the Tanami Desert, Australia. Ecography 30(6), 759-776.
| Crossref | Google Scholar |
Southgate R, Paltridge R, Masters P, Ostendorf B (2007b) Modelling introduced predator and herbivore distribution in the Tanami Desert, Australia. Journal of Arid Environments 68(3), 438-464.
| Crossref | Google Scholar |
Southgate R, Dziminski MA, Paltridge R, Schubert A, Gaikhorst G (2018) Verifying bilby presence and the systematic sampling of wild populations using sign-based protocols – with notes on aerial and ground survey techniques and asserting absence. Australian Mammalogy 41(1), 27-38.
| Crossref | Google Scholar |
Woinarski JCZ, Burbidge AA, Harrison PL (2015) Ongoing unraveling of a continental fauna: decline and extinction of Australian mammals since European settlement. Proceedings of the National Academy of Sciences 112(15), 4531-4540.
| Crossref | Google Scholar |
Woinarski JCZ, Murphy BP, Palmer R, Legge SM, Dickman CR, Doherty TS, Edwards G, Nankivell A, Read JL, Stokeld D (2018) How many reptiles are killed by cats in Australia? Wildlife Research 45, 247-266.
| Crossref | Google Scholar |
Woolley L-A, Murphy BP, Geyle HM, Legge SM, Palmer RA, Dickman CR, Doherty TS, Edwards GP, Riley J, Turpin JM, Woinarski JCZ (2020) Introduced cats eating a continental fauna: invertebrate consumption by feral cats (Felis catus) in Australia. Wildlife Research 47(8), 610-623.
| Crossref | Google Scholar |
Wysong ML, Iacona GD, Valentine LE, Morris K, Ritchie EG (2020) On the right track: placement of camera traps on roads improves detection of predators and shows non-target impacts of feral cat baiting. Wildlife Research 47(8), 557-569.
| Crossref | Google Scholar |