Does variable probability of detection compromise the use of indices in aerial surveys of medium-sized mammals?
John P. Tracey A C D , Peter J. S. Fleming A C and Gavin J. Melville BA Applied Ecology Research Group, University of Canberra, Canberra, ACT 2601, Australia.
B Biometrics Program, NSW Agriculture, Trangie Agricultural Research Centre, PMB 19, NSW 2823, Australia.
C Current address: Vertebrate Pest Research Unit, NSW Department of Primary Industries, Orange Agricultural Institute, Forest Road, Orange, NSW 2800, Australia.
D Corresponding author. Email: john.tracey@agric.nsw.gov.au
Wildlife Research 32(3) 245-252 https://doi.org/10.1071/WR03126
Submitted: 23 December 2003 Accepted: 19 October 2004 Published: 22 June 2005
Abstract
Although aerial surveys are an effective and commonly used method of monitoring wildlife populations, variable detection probability may result in unreliable indices or biased estimates of absolute abundance. Detection probability can vary between sites, sampling periods, species, group sizes, vegetation types and observers. These variables were examined in helicopter surveys of a suite of medium-sized mammals in a hilly environment in central eastern New South Wales. Maximum-likelihood methods were used to investigate the effects of these variables on detection probability, which was derived using the double-count technique. Significant differences were evident between species in the overall analysis, and group size, vegetation, observer pair and sampling period for various individual species when analysed separately. The implications for monitoring wildlife populations between sites and across time are discussed. This paper emphasises that aerial survey indices may be effective in detecting large differences in population size but can be improved by quantifying detection probabilities for a range of variables.
Acknowledgments
We thank Ken England, Greg Jones, Glen Walker and Richard Mason for their assistance in aerial surveys, and Matt Hollingdale and Mark Rogers for reliable and safe helicopter piloting. Mike, Ant and Chris Martin, Donald and Doug Arnott, and Kevin Cluff kindly allowed us to count feral goats on their land. Funding of NSW Department of Primary Industries, the National Feral Animal Control Program and the Wildlife and Exotic Disease Preparedness Program is gratefully acknowledged. Remy Van de Ven, Jim Hone and Steven McLeod provided constructive comments and discussion.
Anderson, D. R. (2001). The need to get the basics right in wildlife field studies. Wildlife Society Bulletin 29, 1294–1297.
Bayliss, P. (1985). The population dynamics of red and western grey kangaroos in arid New South Wales, Australia. I. Population trends and rainfall. Journal of Animal Ecology 54, 111–125.
Caley, P. A. , and Morley, C. G. (2002). Assessing growth rates of European rabbit populations using spotlight transect counts. Journal of Wildlife Management 66, 195–200.
Caughley, G. , and Grice, D. (1982). A correction factor for counting emus from the air, and its application to counts in Western Australia. Australian Wildlife Research 9, 253–259.
| Crossref | GoogleScholarGoogle Scholar |
Gilroy, J. (1999). Kangaroo monitoring in relation to kangaroo management in New South Wales. Australian Zoologist 31, 306–308.
Hone, J. (1988). A test of the accuracy of line and strip transect estimators in aerial survey. Australian Wildlife Research 15, 493–497.
| Crossref | GoogleScholarGoogle Scholar |
Lancia, R. A. , Bishir, J. W. , Conner, M. C. , and Rosenberry, C. S. (1996). Use of catch–effort to estimate population size. Wildlife Society Bulletin 24, 731–737.
Short, J. , and Bayliss, P. (1985). Bias in aerial survey estimates of kangaroo density. Journal of Applied Ecology 22, 415–422.
Steinhorst, R. K. , and Samuel, M. D. (1989). Sightability adjustment methods for aerial surveys of wildlife populations. Biometrics 45, 415–425.
Trick, L. M. , and Pylyshyn, Z. W. (1994). Why are small and large numbers enumerated differently? A limited-capacity preattentive stage in vision. Psychological Review 101, 80–102.
| Crossref | GoogleScholarGoogle Scholar | PubMed |

Walter, M. J. , and Hone, J. (2003). A comparison of three aerial survey techniques to estimate wild horse abundance in the Australian Alps. Wildlife Society Bulletin 31, 1138–1149.

White, G. C. , Bartmann, R. M. , Carpenter, L. H. , and Garrott, R. A. (1989). Evaluation of aerial line transects for estimating mule deer densities. Journal of Wildlife Management 53, 625–635.

Appendix. Variance estimate for average detection probability
Consider the double count method of Caughley and Grice (1982). In their paper they quote estimates for p1 and p2, which are the unconditional detection probabilities for two observers who independently count groups of emus in an aerial survey. They use the average of these,  , as an estimate for mean detection probability which is then used in a correction factor for the purpose of estimating true density. Since the estimate of average detection probability can be regarded as a function of multinomial variates, we use the delta method to derive a variance estimate for
  .
.
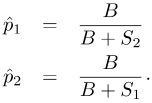
Suppose n is the total number of animals (or groups) detected in the survey, partitioned into S1 = the number seen by observer 1, S2 = the number seen by observer 2, and B = the number seen by both observers. This leaves N – S1 – S2 – B animals undetected, where N is the total number of animals in the survey area. The estimates for the unconditional detection probabilities are given by

The average detection probability then becomes

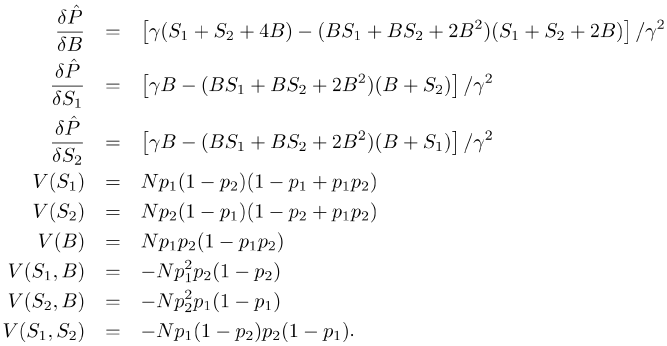
Using the delta method the approximate variance of  (unconditional on n) will be

where each of the terms in this expression appear below.

The variance estimate follows by replacing N and the parameters p1 and p2 with their estimates. The following estimate for N is a suitable choice


