

A test of whether rabbit abundance increases following predator control in a rural landscape
Mandy Barron A , Natalie de Burgh B and Grant Norbury C *
C *
A
B
C
Abstract
In New Zealand and Australia, rural landowners believe that local control of invasive predators aimed at protecting the indigenous biota exacerbates European rabbit (Oryctolagus cuniculus) problems on their land.
We tested this using rabbit index data collected in replicated areas with and without predator control in rural landscapes of the Hawke’s Bay region of New Zealand.
Spotlight data were available from two ecological restoration areas. For the Cape to City area, data were collected from 2016 to 2021, with three sites subjected to ongoing predator control (traps deployed in 2016 and 2017) and two sites untreated. For the Poutiri Ao ō Tāne area, data were collected from 2012 to 2021, with two sites subjected to ongoing predator control (beginning in 2012) and three sites untreated. Generalised linear mixed-effects models were used to assess whether predator control was a statistically significant predictor of rabbit counts. Cameras were also deployed annually, beginning in 2015, in the treatment and non-treatment areas in Cape to City. Mixed-effects models were fitted to the camera detection data using a ‘Before After Control Impact’ framework to assess whether camera detection rates of rabbits changed with predator control.
Contrary to landowner expectations, fewer rabbits were counted under spotlight at the predator control sites at Cape to City, although no effect was detected in the camera detection data. More rabbits were counted on the predator control sites at Poutiri Ao ō Tāne, but this effect was not statistically significant and only became apparent in the last 2 years of the 9-year monitoring period.
The effects of predator control on rabbit abundance indices in the Hawke’s Bay region were contradictory and inconclusive. This suggests that the influence of predators on rabbit populations is minor compared with other sources of population limitation or regulation, such as disease and poor food quality.
The absence of a definitive predator effect should reassure landowners concerned about potential rabbit population outbreaks following predator control.
Keywords: human−wildlife conflict, population limitation, population regulation, predator control, predators, predator−prey dynamics, rabbits, rabbit irruptions.
Introduction
European rabbits (Oryctolagus cuniculus) are introduced in many places around the world and can cause major environmental damage where they are overabundant, especially in agricultural systems. In some places, such as Australia and New Zealand, rabbits co-occur with introduced mammalian predators (e.g. feral cats, Felis catus; red foxes, Vulpes vulpes; and mustelids, Mustela furo, M. nivalis, and M. erminea), which consume rabbits as their primary prey (Read and Bowen 2001; Holden and Mutze 2002; Doherty et al. 2015; King et al. 2021; Gillies and van Heezik 2021). Rural landowners believe that extensive predator trapping programs undertaken by government agencies and community groups to protect indigenous species (such as birds and reptiles) lead to higher rabbit abundance (Norbury and Jones 2015; McKelvie-Sebileau 2020). This perception will become increasingly important as new technologies and ambitious visions of pest eradication over very large scales gain traction (Russell et al. 2015). Norbury and Jones (2015) reviewed the evidence for rabbit responses to predator control from published international literature and concluded that predators have relatively little effect on rabbit numbers compared with other rabbit mortality factors, such as disease and poor food quality. However, predators can occasionally limit the recovery of rabbit numbers from low levels; for example, following drought or major epizootics (e.g. Newsome et al. 1989; Pech et al. 1992).
Norbury and Jones (2015) called for robust rabbit monitoring in replicated areas with and without predator control to identify the circumstances that can sometimes lead to rabbit increases. Here we use rabbit index data collected in replicated, treated, and non-treated areas in rural landscapes of the Hawke’s Bay region of New Zealand’s North Island to test whether predator reductions by kill-trapping lead to rabbit increases.
Materials and methods
We analysed rabbit monitoring data from two large-scale ecological restoration projects in the Hawke’s Bay region: the Poutiri Ao ō Tāne (PAoT, 6,000 ha) and the Cape to City (CtC, 26,000 ha) ecological restoration areas. A core component of these projects is reducing the numbers of invasive predators: feral cats, stoats, ferrets, brushtail possums (Trichosurus vulpecula, which depredate bird eggs and chicks), and, to a lesser extent, rats (Rattus rattus and R. norvegicus). Predator control was undertaken by Hawke’s Bay Regional Council staff and pest control contractors. At PAoT, trapping began in 2012 using DOC-250 traps (DOC, Wellington, NZ) for mustelids and Timms traps (KBL Rotational Moulders, Palmerston North, NZ) for cats (Glen et al. 2019). Traps were baited with various combinations of fresh rabbit meat, a rabbit-based paste (Erayz®, Connovation Ltd, Auckland), or a synthetic, rat-scented lure (Goodnature Ltd, Wellington, NZ). Pulsed cat control was also carried out using a combination of live traps (Havahart cage traps, Lititz, Pennsylvania, USA), leg-hold traps (Victor #1 1/2 soft-catch, Oneida Victor, Cleveland, Ohio, USA), kill traps (Timms and Possum Master traps, Possum Master Industries, Tauranga, NZ), and opportunistic shooting. In 2018, a once-off poisoning trial using Para-aminopropiophenone (PAPP) was tested on cats with some success (de Burgh et al. 2021). At CtC, traps were deployed over several months in 2016 and 2017 using mostly kill traps (podiTRAP, Metalform, Dannevirke, NZ) (Glen and Peace 2021). Feral cats were also trapped using cage and leghold traps. Selection of predator control sites was independent of rabbit abundances or ease of predator control. Predator control was undertaken as only one component of restoring landscape-level biodiversity. The non-treatment sites were part of Hawke’s Bay Regional Council’s ongoing rabbit monitoring program, which were selected years before the landscape projects began.
Hawke’s Bay Regional Council staff collected rabbit count data from spotlight routes for trend monitoring across the region, and some of these routes in the PAoT and CtC areas were subjected to predator control. Unfortunately count data were not consistently available for each spotlight route before predator control began. We also analysed camera detection data collected by Manaaki Whenua – Landcare Research within the CtC area, which benefited from having 1 year of pre-treatment monitoring to account for any pre-existing differences between sites that were unrelated to predator control.
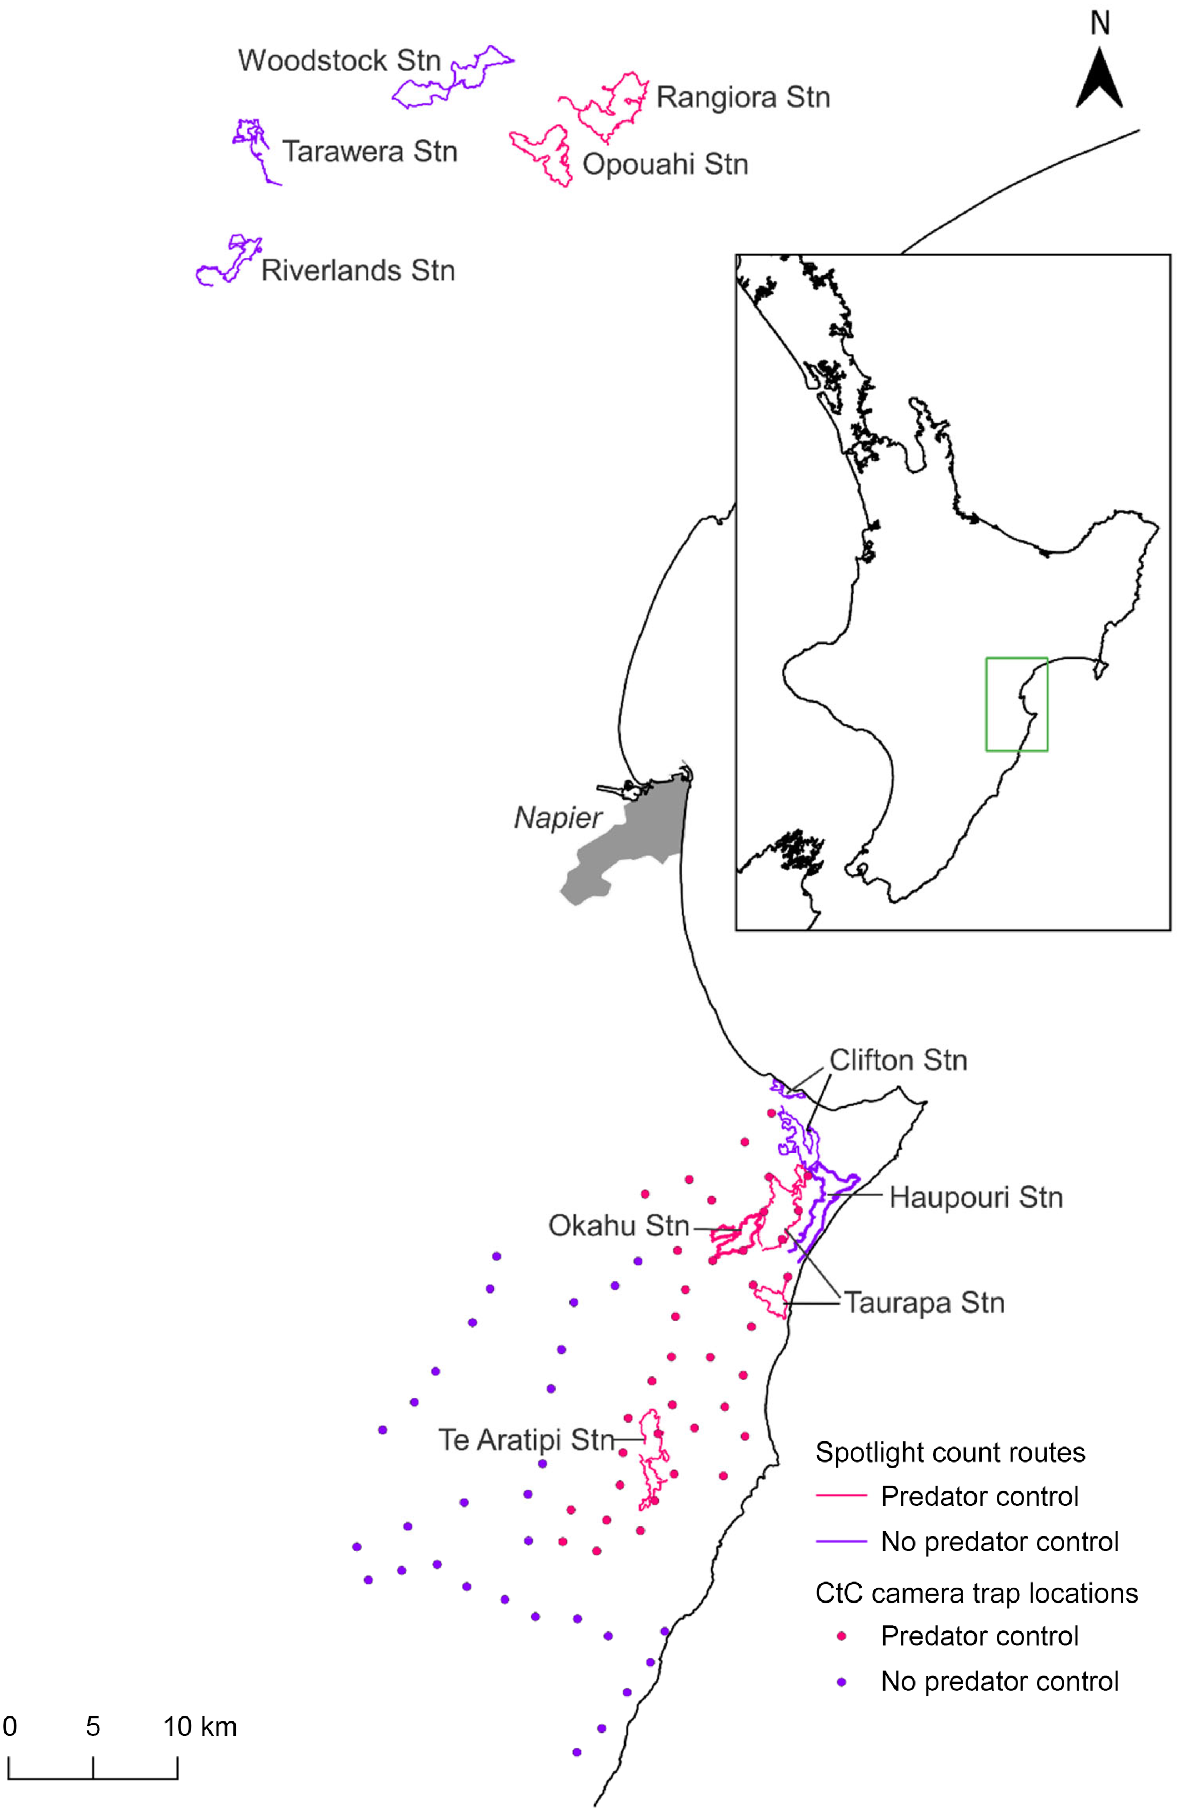
Spotlight counts of rabbit populations were conducted annually or biennially in winter following a standard protocol (NPCA 2020). These surveys entailed driving slowly (less than 20 km per hour) along routes ranging from 17 to 33 km in length, counting the number of rabbits detected within a semicircle of ~50 m in radius forward of the observer using a 30–55-watt spotlight. Spotlight counts were generally undertaken over two nights with similar weather conditions and scheduled within 5 days of each other. We used the mean number of rabbits counted over these two nights as the response variable in the analyses. Spotlight data were available for five sites at CtC (Fig. 1) spanning 6 years from 2016 to 2021. Three of these sites – Taurapa Station, Okahu Station and Te Aratipi Station – were subject to ongoing predator control where traps were deployed across the treatment area in 2016 and 2017. Two of these sites – Haupouri Station and Clifton Station – were untreated (no predator control). The PAoT project area encompassed five spotlight sites that were surveyed annually until 2015, then biennially thereafter. The analysis of the PAoT data covered the period of 2012–2021. Predator control at two sites, Opouahi Station and Rangiora Station, began in 2012. The three remaining sites, Woodstock Station, Tarawera Station, and Riverlands Station, were not subjected to predator control (Fig. 1).
Map of study area showing Poutiri Ao ō Tāne spotlight routes in the north and Cape to City spotlight routes and camera locations to the south. Sites subject to predator control are indicated with pink symbols, untreated sites with purple symbols.
The mean nightly number of rabbits counted per site was modelled using Poisson mixed-effects regression, adjusting for the route length (km) to account for varying survey effort between routes. Predator control was included as a fixed-effect predictor, and site and survey year were included as random-effects predictors (with year was nested within site; i.e. an observation-level random effect). An effect of predator control on rabbit counts was indicated if the ‘predator treatment’ predictor was statistically significant (Wald test, P-value <0.05). Analyses were done in R (R Development Core Team 2019) using the lme4 package (Bates et al. 2015).
Rabbit control was not included as a factor in the analyses because there was only one instance of widespread coordinated rabbit control at one of the study sites during the analysis period (burrow fumigation and shooting at Opouahi Station in 2012). Rabbit haemorrhagic disease (RHD) can also affect rabbit numbers, and serological data identifying the presence of antibodies to rabbit haemorrhagic disease virus (RHDV) were available for rabbit samples shot in the Hawke’s Bay Region over the 2004–2019 period. However, because these data were not available for 4 of the 6 years of monitoring in CtC, and 2 of the 7 years of monitoring in PAoT, they could not be included in the analyses.
Images of rabbits were available for the CtC area from a camera network designed to monitor predator abundance (Glen and Peace 2021). Camera data were collected annually from 2015 to 2020, which included 1 year (2015) before the predator treatment at CtC began. Motion-triggered cameras (Browning Strike Force BTC-5, Prometheus Group, Birmingham, Alabama, USA) were deployed across the study area in November/December each year for 21 days at a time. There were 37 cameras placed in the CtC treatment area and 31 cameras in an adjacent non-treatment area outside CtC. Cameras were placed at least 2 km apart, achieving broad coverage of the study area. They were set to take three images in quick succession when triggered, with no delay between successive triggers. Although rabbits were by far the most common herbivore identified in the images, they could not always be reliably distinguished from hares, so they were grouped together as lagomorph detections.
Detection data (number of lagomorph detections per 21 days) were over-dispersed, consisting mostly of zero detections with occasional very high (>40) detections. We therefore assumed a negative binomial error distribution for the analysis. The annual number of lagomorph detections per camera was regressed against the fixed-effect predictors: predator removal treatment (yes/no) and period (pre/post treatment), plus the interaction between them. This model specification is called a ‘Before After Control Impact’ (BACI) design, where the treatment is considered to have an impact if the interaction effect is statistically significant. This indicates the response to the treatment occurred post-applications and was not due to pre-existing differences between the sites. The regression also included a correction for the number of nights the cameras were deployed, as well as a random effect for camera ID to account for repeated surveys at the same location.
Results
Spotlight counts
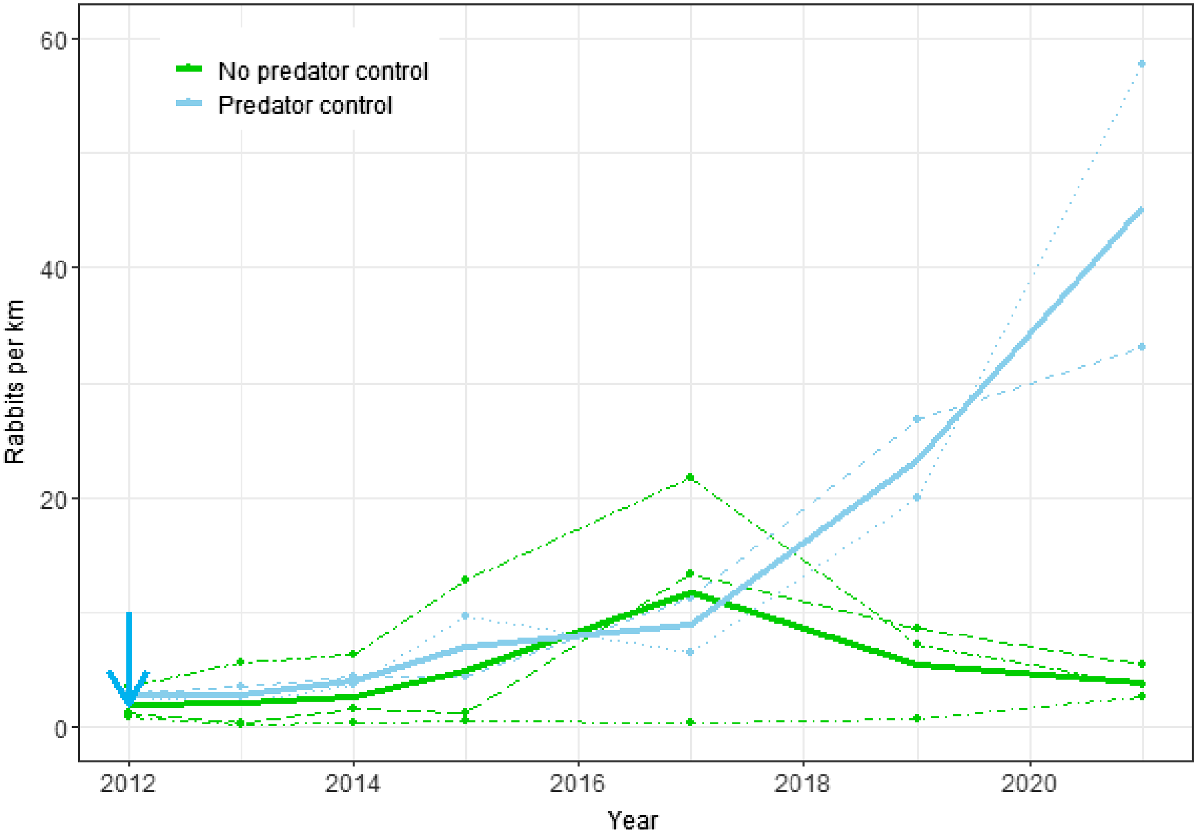
Rabbit counts increased at both treatment sites at PAoT, but this increase was observed only in the last 2 years of monitoring (Fig. 2). In contrast, rabbit counts at all three treated sites at CtC remained at very low levels (Fig. 3). At the PAoT sites there was no statistically significant difference in rabbit counts between the treatment (predator control) and non-treatment sites (P = 0.081), despite noticeable increases in rabbit numbers at the two treatment sites (Opouahi Station and Rangiora Station) in 2019 and 2020 (Fig. 2). Counts were more variable between years than between sites (SDyear = 1.00 vs SDsite = 0.69), and the combined (site and year) variation was greater than that attributed to predator control (βtmt = 1.26).
Changes in rabbit spotlight counts from 2012 to 2021 for the Poutiri Ao ō Tāne ecological restoration area with and without predator control. Dots and dashed lines represent data from individual sites; solid lines show estimates from the fitted model for the effects of predator control; the blue arrow shows when predator control began.
Changes in rabbit spotlight counts from 2016 to 2021 for the Cape to City ecological restoration area with and without predator control. Dots and dashed lines represent data from individual sites; solid lines show estimates from the fitted model for the effects of predator control; the blue arrow indicates when predator control began.
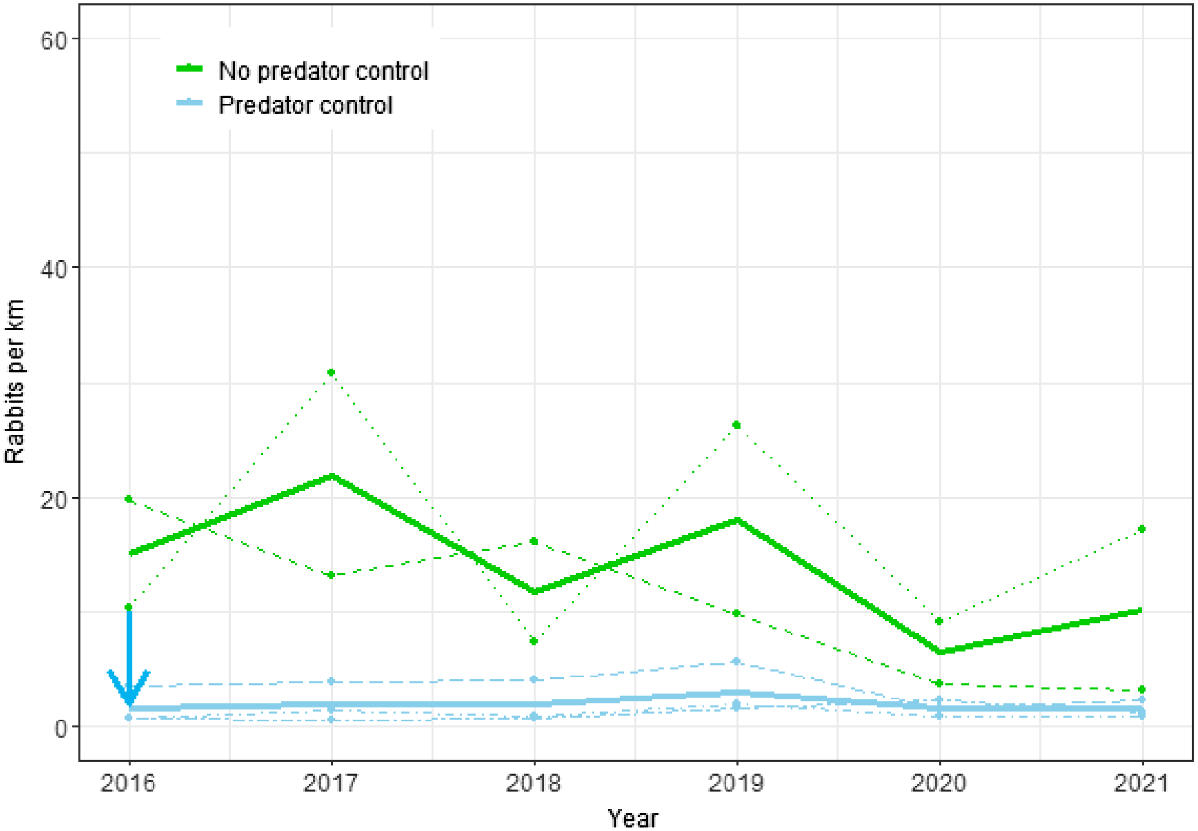
At the CtC sites, rabbit counts were significantly lower (P < 0.0001) on the predator control sites, amounting to approximately 13% of those at non-treatment sites (Fig. 3). Counts were more variable between years than between sites (SDyear = 0.56 vs SDsite = 0.38), but the magnitude of the negative effect of predator control on rabbit counts (βtmt = −2.01) was much greater than that due to random variation from year and site combined.
Camera detections
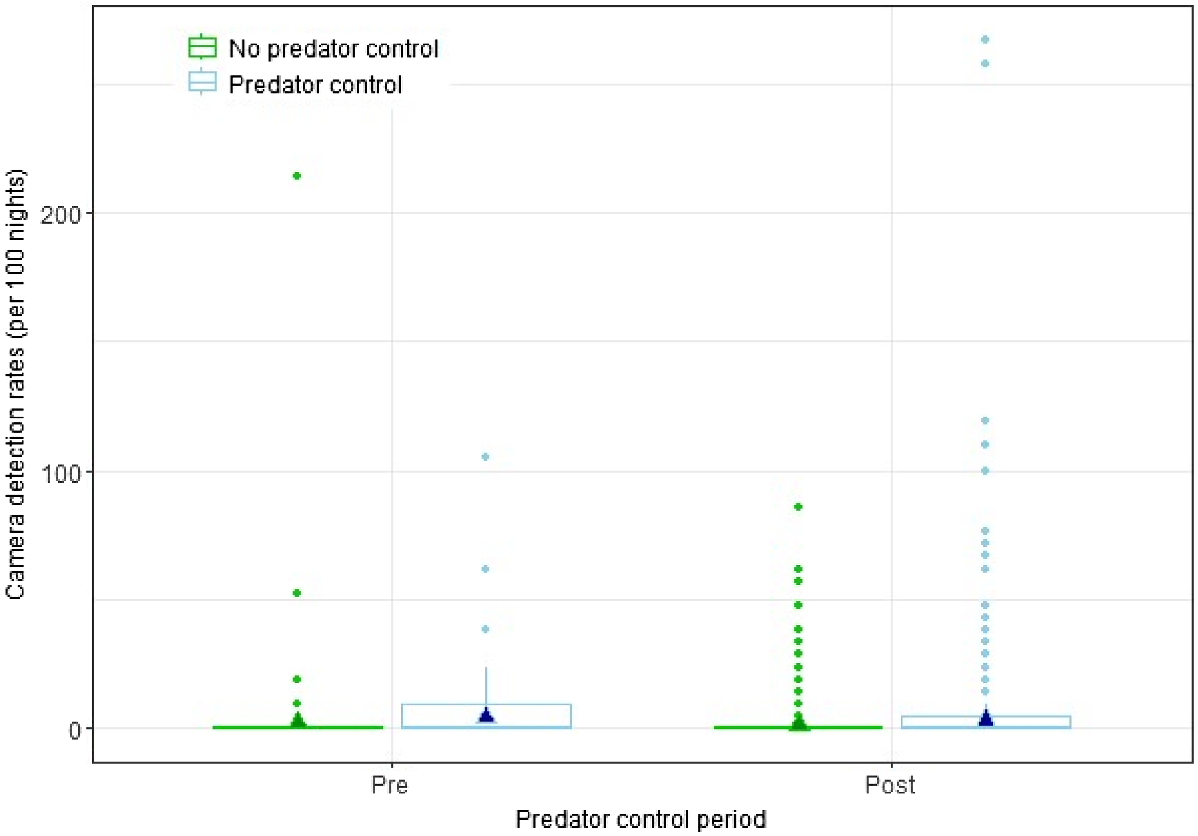
There was no statistically significant interaction effect between predator treatment and treatment period (P = 0.902) on lagomorph camera detection rates in the CtC area, indicating that predator control had no discernible effect on lagomorph detections (Fig. 4).
Box plots for annual lagomorph camera detection rate, 2015–2020, for the Cape to City ecological restoration area with and without predator control, and pre- and post-control. The outline boxes encompass the interquartile range, the bold horizontal line indicates median values, the whiskers indicate the upper and lower extremes, and the points represent outliers. The filled triangles show estimates from the fitted model.
Discussion
The effects of predator control on rabbit abundance indices in the Hawke’s Bay region were contradictory and inconclusive. At CtC, there was a significant negative relationship between predator control and rabbit spotlight counts, but no effect on camera detection rates. Conversely, at PAoT there was a positive, but not statistically significant, relationship between predator control and rabbit spotlight counts. The lack of a treatment effect in the model fitted to the PAoT data is likely because differences between treatments only became apparent in the last two surveys (2019 and 2021) of the 9-year survey period when predator control was implemented. Had the difference been a result of predator control we would expect rabbit populations to respond earlier, given their high rate of increase and general year-round breeding (Gibb and Williams 1994).
Our test of predator control effects assumes that control was effective at reducing predator numbers. de Burgh et al. (2021), Glen and Peace (2021), and Glen et al. (2019) showed that feral cat and mustelid numbers were overall reduced following the introduction of the CtC and PAoT predator control programs, although this reduction varied across time, space, and control method used. Specifically, occupancy modelling of predator detections in tracking tunnels at PAoT starting just before predator control began and continuing for 4 years, showed that site use by feral cats, and to some extent mustelids, was lower in the predator removal area than in the non-treatment area (Glen et al. 2019). Similarly, fewer feral cats were detected on cameras following a poison trial in 2018 at PAoT (de Burgh et al. 2021). At CtC, the same cameras used for rabbit detections in this study showed some, although variable, reductions in predator detections in the treatment area relative to the non-treatment area (Glen and Peace 2021). One of the spotlight transects in the treatment area of CtC (Taurapa Station) was only 1–2 km away from two of the spotlight transects in the non-treatment area (Haupouri and Clifton Stations) (Fig. 1). This proximity was unavoidable and may have caused some interference in the abundance of mobile predator species (i.e. cats) between areas.
Unfortunately, there was a paucity of pre-treatment data in this study. This highlights the importance of increased replication and pre-treatment monitoring to quantify other sources of variation between sites and over time, and to detect differences due to the treatment. However, if the effect of predation on rabbit populations is minor compared with other regulatory or limiting mechanisms, it may be difficult to detect, even with an optimal study design. Indeed, other New Zealand and overseas studies have shown that predators play a minor role in rabbit population regulation compared with the effects of climate, food, disease, and habitat (Norbury and Jones 2015).
The rabbit populations at the sites monitored in this study showed a range of trajectories: low and stable (Riverlands Station, Okahu Station), oscillating between highs and lows (Haupouri Station), exponential-like growth (Rangiora Station), and possibly cyclic (Woodstock Station). Furthermore, there did not appear to be synchrony in population fluctuations between sites, and models incorporating random effects for year nested within a site provided a better fit than those assuming a uniform effect of year across sites. For these best-fit models, the estimated ‘random’ variation between years within a site was 1.5 times greater than the variation between sites. This suggests that local dynamics were predominating, rather than, for example, climatic effects which would likely manifest across the entire region.
One potential site-specific limiting factor not accounted for in this analysis is rabbit population control. There was one known instance of large-scale, coordinated rabbit control during the study period (at Opouahi Station in 2012), but there were undoubtedly many instances of individuals or small groups doing night shooting at individual sites. In general, shooting is considered effective for rabbit control only when rabbit numbers are already low (Williams et al. 1995). However, we have no means of assessing the effect of night shooting on rabbit populations in our study areas.
Due to missing serology data (see Methods) we could not retrospectively estimate the impact, if any, of RHD on rabbit numbers. Similar to predation, RHD impacts on rabbit abundance are likely to vary significantly over time and space. Disease and predation can also interact. Reddiex et al. (2002) found that the reduction in rabbit numbers due to the first wave of RHD was significantly greater at North Canterbury sites where predators had not been removed, compared to those where they had. However, no such effect at sites with high rabbit density in Central Otago (Reddiex 2004).
A novel strain of RHDV, the RHDV-K5 (K5) strain, was introduced to New Zealand and released in the Hawke’s Bay region in autumn 2018. Spotlight routes were not surveyed at the PAoT sites in 2018. However, two of the non-treatment sites where K5 releases took place (Woodstock and Tarawera) showed a downward trend in the following year. Conversely, at a predator control site (Rangiora) adjacent to a K5 release, rabbit counts continued to rise dramatically. In contrast, at CtC, a non-treatment site where K5 was released (Clifton Station) showed an increase in spotlight counts from 2017 to 2018, while no change in rabbit numbers was apparent at a predator treatment site adjacent to a K5 release location (Taurapa Station). In Central Otago and the Mackenzie Basin, the introduction of K5 caused only minor epidemics with little suppression of rabbit populations, and the strain has subsequently died out (J Duckworth, unpublished data); a similar outcome is likely to have occurred in Hawke’s Bay.
The equivocal effect of predator control on prey abundance in this study is consistent with several other studies showing predator effects to be context-specific (e.g. Lennox et al. 2018; Norbury and Reardon 2023). This has implications for management of rabbits in their native range on the Iberian Peninsula. Here predator control is highly contentious, with hunters claiming that predator control is essential to boost populations of game species, including rabbits, while environmentalists oppose removing predators because they include several endangered indigenous species. Given the greater diversity of predators on the Iberian Peninsula, the equivocal effects of predator control on rabbit abundance found in this study are even more likely to apply in their native range.
In summary, rabbit counts in Hawke’s Bay were highly variable across sites and years, making it difficult to detect a clear effect of predator control over and above all the other sources of largely unmeasured variation. The absence of a definitive predator effect should be reassuring to landowners concerned that rabbit populations would irrupt following predator control.
Data availability
All data needed to evaluate the conclusions in the paper have been deposited here: https://datastore.landcareresearch.co.nz/dataset/hawkesbayrabbits.
Declaration of funding
This research was funded by the Hawke’s Bay Regional Council and the New Zealand Ministry of Business, Innovation and Employment’s Strategic Science Investment Fund.
Acknowledgements
This paper is based on a report prepared for the Hawke’s Bay Regional Council. Thanks to Hawke’s Bay Regional Council staff for undertaking the spotlight counts, especially Allan Beer for providing the count data. Thanks to Al Glen and Jo Peace for the camera data, to Al Glen for comments on the manuscript, and to Ray Prebble for editing.
References
Bates D, Mächler M, Bolker B, Walker S (2015) Fitting linear mixed-effects models using lme4. Journal of Statistical Software 67, 1-48.
| Crossref | Google Scholar |
de Burgh N, Glen AS, Mayo K, Mitchell M (2021) Using para-aminopropiophenone (PAPP) as a tool to control feral cats in Hawke’s Bay, New Zealand. New Zealand Journal of Ecology 45, 3424.
| Google Scholar |
Doherty TS, Davis RA, van Etten EJB, Algar D, Collier N, Dickman CR, Edwards G, Masters P, Palmer R, Robinson S (2015) A continental-scale analysis of feral cat diet in Australia. Journal of Biogeography 42, 964-975.
| Crossref | Google Scholar |
Glen AS, Perry M, Yockney I, Cave S, Gormley AM, Leckie C, Dickson R, Rakete-Stones W, Rakete-Stones P, Norbury GL, Ruscoe WA (2019) Predator control on farmland for biodiversity conservation: a case study from Hawke’s Bay, New Zealand. New Zealand Journal of Ecology 43, 3358.
| Google Scholar |
Holden C, Mutze G (2002) Impact of rabbit haemorrhagic disease on introduced predators in the Flinders Ranges, South Australia. Wildlife Research 29, 615-626.
| Crossref | Google Scholar |
Lennox RJ, Gallagher AJ, Ritchie EG, Cooke SJ (2018) Evaluating the efficacy of predator removal in a conflict-prone world. Biological Conservation 224, 277-289.
| Crossref | Google Scholar |
Newsome AE, Parer I, Catling PC (1989) Prolonged prey suppression by carnivores – predator-removal experiments. Oecologia 78, 458-467.
| Crossref | Google Scholar | PubMed |
Norbury G, Jones C (2015) Pests controlling pests: does predator control lead to greater European rabbit abundance in Australasia? Mammal Review 45, 79-87.
| Crossref | Google Scholar |
Norbury GL, Reardon JT (2023) Total response models as a conceptual management framework for conserving vulnerable secondary prey. Conservation Science and Practice 5, e12983.
| Crossref | Google Scholar |
Pech RP, Sinclair ARE, Newsome AE, Catling PC (1992) Limits to predator regulation of rabbits in Australia: evidence from predator-removal experiments. Oecologia 89, 102-112.
| Crossref | Google Scholar | PubMed |
R Development Core Team (2019) R: a language and environment for statistical computing. R Foundation for Statistical Computing, Vienna, Austria. Available at https://www.r-project.org/
Read J, Bowen Z (2001) Population dynamics, diet and aspects of the biology of feral cats and foxes in arid South Australia. Wildlife Research 28, 195-203.
| Crossref | Google Scholar |
Reddiex B, Hickling GJ, Norbury GL, Frampton CM (2002) Effects of predation and rabbit haemorrhagic disease on population dynamics of rabbit (Oryctolagus cuniculus) in North Canterbury, New Zeland. Wildlife Research 29, 627-633.
| Crossref | Google Scholar |
Russell JC, Innes JG, Brown PH, Byrom AE (2015) Predator-Free New Zealand: Conservation Country. BioScience 65, 520-525.
| Crossref | Google Scholar | PubMed |