

The bigger they are, the higher they go: Australian insectivorous bats confirm Bergmann’s 175-year-old prediction
Alexander Herr A *
A *
A
Abstract
Some insectivorous bats are some of the smallest flying endotherm. They have a high energy demand to maintain body temperature. Therefore, one can expect that larger animals of a species and larger species occur in colder environments as a result of improved energy conservation related to reduced surface to volume ratio in larger endotherm animals. Evidence of this general rule is scarce in bats, although Bergmann predicted this some 175 years ago for closely related species.
In this work, I investigated whether bat body size increases with above-sea-level elevation-related temperature decrease for three closely related Australian bat species of the genus Vespadelus. The purpose of this was two-fold. First, to investigate whether there is a relationship between bat size and elevation by using more recent computational techniques of Bayesian multilevel modelling (BMM). Second, to provide an example of applying recent advances in BMMs to wildlife research and to predict potential consequences of climate warming for these bats.
I investigated whether bat size relates to elevations of bat-capture locations. I included measurement errors for elevation and forearm length measurements by using a BMM in an high-performance computing environment. This model uses measurements of 775 bats from locations in the western slopes of the Australian Alps.
The BMM analysis showed that bat forearm length increased 0.11 mm for every 100 m elevation, with a low standard error of 0.01 mm, indicating a high precision. The standard deviations of the variables species and sex within species were large. This means that they did not provide sufficient explantory power for the overall model and predictions to warrant inclusion.
This study showed that there is a linear increase of bat size with elevation. This is the first study to show that bat size is related to elevation (and associated temperature decline) in three sympatric, closely related species of the same genus and it confirmed what Bergmann predicted over 175 years ago.
Under a warming climate, the results predict that bats become smaller on average. When incorporating average temperature-lapse rate to calculate elevations that assume a 1.5 and 3°C change in future average climate, the study coarsely quantified reduction in suitable habitat for the largest of the three species, V. darlingtoni, of up to 3%.
Keywords: Australian Alps, Bayesian multilevel model, Chiroptera, forearm length, lapse rate, measurement error, size, surface to volume ratio, temperature and elevation.
Introduction
Insectivorous bats are living at the energetic edge of their physiological limits when considering energy requirements for flight, which is exacerbated in temperate areas and higher elevations. Although bats have a range of behavioural and physiological adaptations to cold conditions, they also show geographic variations that are expressed in a species’ morphometric traits and in distributions (Voigt et al. 2010; Stawski et al. 2014; Chenery et al. 2022). Given the vagaries of an insectivorous diet in areas where seasons influence food shortages, there is a possibility that insectivorous bat size distribution is complying with Bergmann’s 175-year-old prediction. Bergmann identified bats as a mammal taxon with very small forms that have a large surface area to body volume ratio, which is extreme when compared with other taxa (loosely translated from ‘… Ein Extrem von Ausbreitung der Körperoberfläche im Verhältniss zum Volumen bietet auf der andern Seite, eine Familie dar, welche meist kleine, zum Theil sehr kleine Formen zählt: die der Fledermäuse…’; Bergmann 1848, p. 44).
Bergmann made this prediction on the basis of what is in modern times known as Bergmann’s rule, which implies that larger animals of a species and larger species occur in colder environments as a result of improved energy conservation related to reduced surface to volume ratio in larger endotherm animals. The rule is often discussed in relation to its general applicability, although Bergmann identified many exceptions and variations associated with taxonomic differences (Bergmann 1848; Brown and Lee 1969; Meiri and Dayan 2003; Clauss et al. 2013; Alston et al. 2023; Baldwin et al. 2023; He et al. 2023). The controversy around the applicability of Bergmann’s rule is in part related to the use of a single English translation of the rule, which may have led to misinterpretation and misconceptions. When taking into account Bergmann’s extensive treatment of how the body surface area to volume ratio influences the temperature–size relationship (i.e. the mechanism behind the rule), many analyses with outcomes diverting from the rule become less controversial (Watt et al. 2010). So as to avoid misinterpretation, I provide the relevant translations and original for those passages from Bergmann that I believe are relevant for this paper.
Most studies investigating the relationship between many bat species and temperature have focused on mean body size and latitude associated mean temperatures (see e.g. Clauss et al. 2013; Jiang et al. 2019; Wang et al. 2020; Alston et al. 2023) and only one study investigated the body size of two bat species of two different genera with altitude (Castillo-Figueroa 2022). Bergmann also stated that closely related, sympatric species have morphological characteristics and distributions that show these size differences at species and intraspecies level. One such taxon is the genus Vespadulus (Vespertillionidae), where three tree-roosting species occur together in south-eastern Australia over a range of elevations. Vespadelus darlingtoni is the larger species, V. vulturnus the smaller, with V. regulus being the intermediate species. Studies have indicated that V. darlingtoni prefers elevations above 600 m asl, V. vulturnus prefers elevations below 1000 m, whereas there is in no indication for elevational preference for V. regulus (Law et al. 1998; Law et al. 2023). They differ in size and weight, with forearm length being a characteristic identifier and measure of size (Herr 1998; Churchill 2009; Meng et al. 2016; Law et al. 2022).
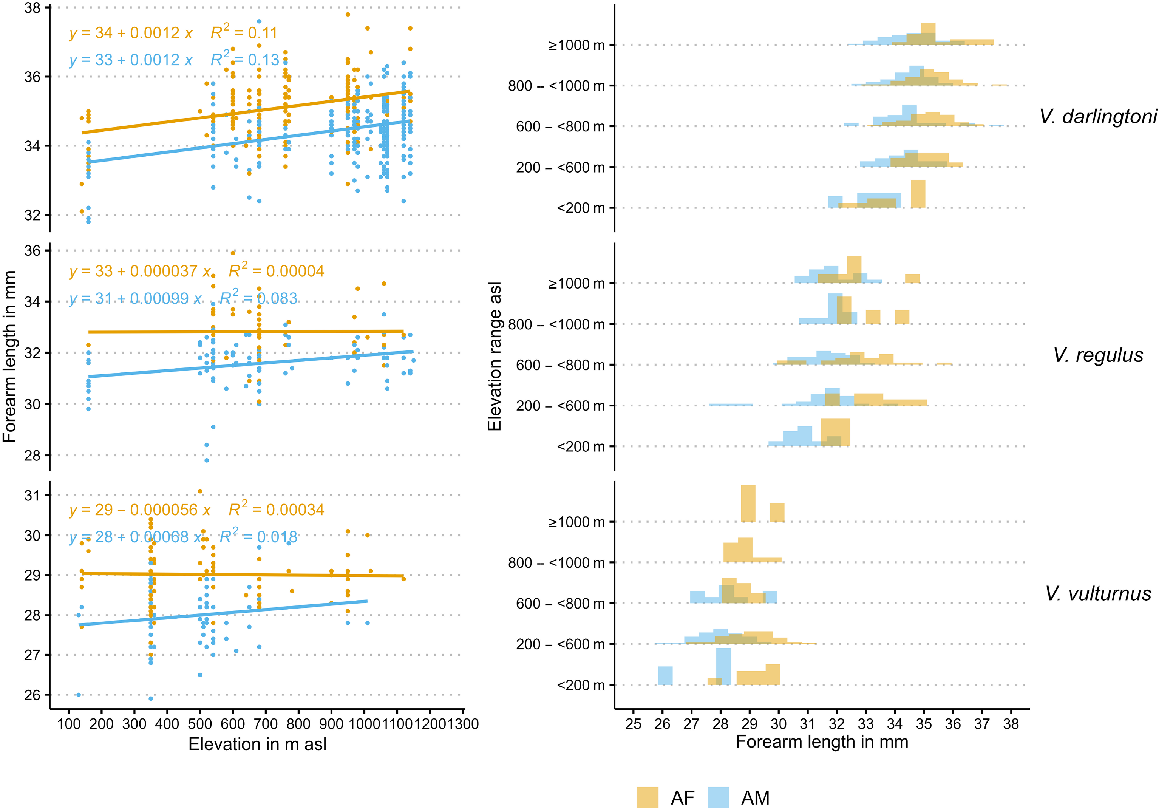
Previous work in the 1990s on the elevational distribution and size of these species was inconclusive, and this may have been related to the limited availability of highly intensive computational methods (see Herr 1998). An initial explorative linear regression analysis of the forearm length with elevation for this work showed small inconclusive trends for the three species and sex and also a high unexplained variance expressed in R2 values (Fig. 1, first panel). However, forearm length counts indicated a trend for increasing forearm length in both adult sexes of the different species (Fig. 1, second panel).
In this work, I investigated whether bat body size (as inferred from forearm length) increases with elevation-related temperature decrease. It tests Bergmann’s prediction that temperature-related increase in body size applies to closely related bat taxa (Bergmann 1848). Mainly, I quantified the relationship between forearm length in V. darlingtoni, V. vulturnus, and V. regulus and the elevation (and, by implication, decreasing temperature) at which they live in a statistical sense, and also incorporated additional sources of variation for bat size and bat occurrence. The purpose of this was two-fold. First, I investigated whether there is a relationship between bat size and elevation by using more recent computational techniques of Bayesian multilevel modelling. Second, I provided an example of a modern Bayesian multilevel model (BMM). Advantages of BMMs are their ability to incorporate additional information such as measurement errors and correlations to better estimate the size–elevation relationship and to estimate the full range of uncertainties, thus providing uncertainty bounds (and precision estimates) for the magnitude of this relationship. The results of this analysis also have implications for climate change-related habitat changes. I briefly discuss the implications of increasing temperature for larger bats in the study area, by using an example of elevation-related potential habitat-suitability changes.
Materials and methods
For this study, I used the data from V. darlingtoni, V. regulus and V. vulturnus adult males and females. These bat measurements were from Herr (1998), who surveyed bats in the western slopes of the Australian Alps by using harp traps between the Murray River near Albury and the mountainous south-eastern, below-alpine areas towards the Alpine National Park. For this work, I used measurements from 775 bats that occured in eight areas of inland south-eastern Australia ranging in elevation from 100 m to 1200 m asl and covering nearly 7000 km2. Further details on the study area, survey methods and timing are available from Herr (1998).
I focused on adult bats, because the growth development of subadults would introduce non-linearity, and, therefore, confound the analysis in size distribution of the three species. I used forearm length as an indicator for bat size in preference over weight and other length measurements. Unlike the weight of individual bats, which can change much over the course of their feeding as they forage large amounts of insects, forearm length provides the most reliable measure of body size because it does not vary in an adult bat (Kunz et al. 1995; Herr 1998; Gardner et al. 2009; Gonsalves et al. 2013; McGuire et al. 2018; Davy et al. 2022). Female Vespadelus species are generally larger than males, which is also reflected in their longer forearms. This aligns with the general female-biased sexual size dimorphism in insectivorous bats (e.g. Lentini et al. 2015; de Oliveira 2020).
Statistical model of bat forearm length at different elevations
I develop a BMM, which is an improvement on conventional linear regression models, because it can also account for variations in intercept, slope, correlations between grouping variables and measurement errors. I used the Bayesian regression model using Stan (BRMS) library associated with the freely available statistical software R. All Monte Carlo Markov-chain (MCMC) random-sampling includes four chains with 5000 iterations each to sample the posterior parameter values and the final model has a full MCMC convergence, with values of <1.05 and an effective sample size ratio of at least 0.1 (Vehtari et al. 2017; R Core Team 2021; Bürkner et al. 2023a; Gabry et al. 2023). The high-performance computing enabled backbone for BRMS, cmdStanR, reduced performance time requirements of the MCMC algorithm from days to hours when using parallel within-chain processing.
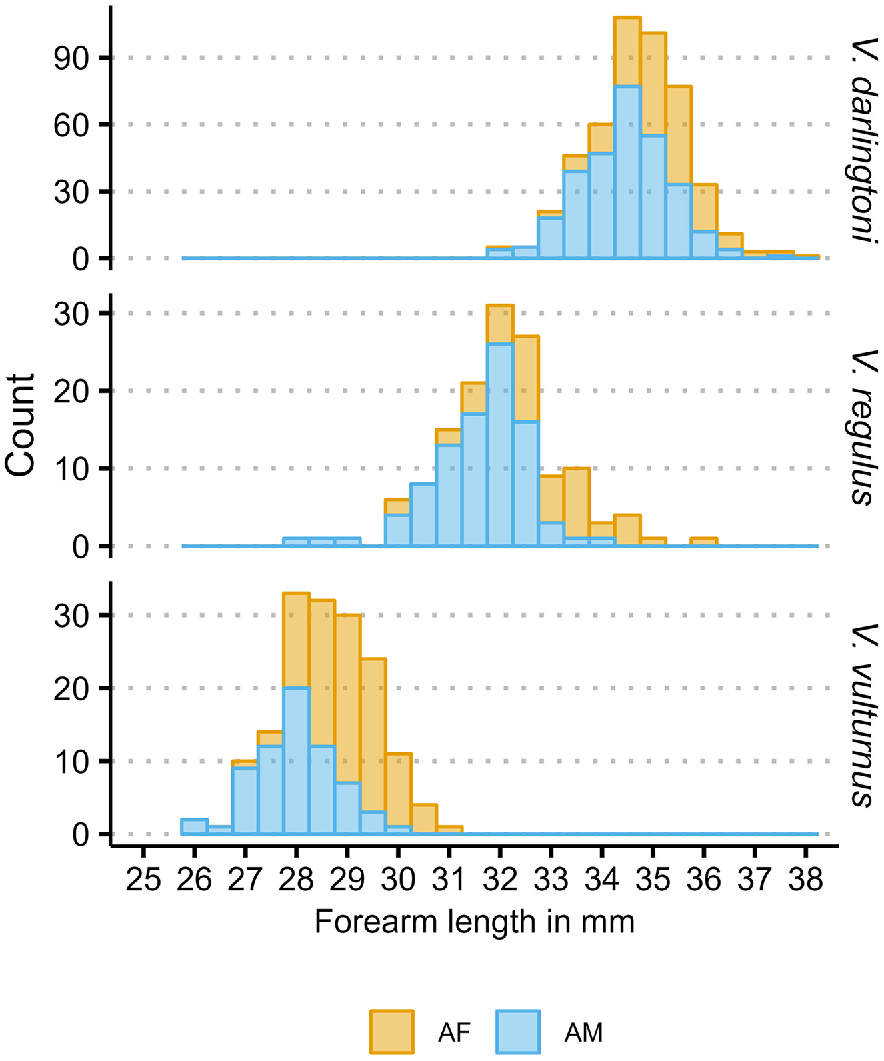
In the analysis I related bat forearm length (response variable) to elevation (explanatory variable). Besides elevation, there are two variables that group the data into adult females and males (two groups) of the species V. darlingtoni, V. regulus, V. vulturnus (three groups), with sex grouped within species level. On the basis of Fig. 2, forearm length has an approximate normal distribution with a linear predictor μ and a standard deviation σ.
The approach has an expectation that the response variable forearm length linearly changes with the explanatory variables plus an additional term ε that represents unexplained variance, such as errors in measuring bat forearm length. Specifically, the variation is with each elevation i, and the males and females of the adult bats from the three species (i.e. species) and sex nested within species (species|sex), where α represents the intersect, β1−n the slopes for each of the explanatory variables. This leads to Eqn 1, as follows:
The BMM can incorporate the group-level variables sex and species in different ways, namely first, as components of the linear equation, and second, as group-level (random) parameters for intercept and slope of the equation. A ‘full model’ accounting for both ways provides the complete Eqn 2, where I expect a normal distribution for each intercept (α) and slope (β) parameter, with a standard deviation of τ. Incorporating random intercepts and slopes adds additional information into the modelling through using information from relationships of samples among and within the grouping variables (McElreath 2020).
In addition to the broad BRMS default priors, I used relatively uninformative priors for the MCMC sampling. The initial prior for the intercept α has a normal distribution, with a mean of 33 (the mean of all bat forearm length measurements) and a standard deviation of 1. Group-specific β intercept priors are of the same values. All other slopes have a normal prior, with a mean of 0 and a standard deviation of 1. Variations for the species|sex grouping intercept have a mean and standard deviation of 1, and the species-level group intercept variation has a mean of 2 and standard deviation of 1.25. This provides a sufficiently wider range of slopes in orders of magnitude higher than what one would expect from the data range. Variations around intersect and slopes are always held positive in the modelling. Additionally, the BMM accounts for group-specific correlations using Lewandowski-Kurowicka-Joe (LKJ) priors, Ωk ~ LKJ(ζ), thus incorporating additional information into the estimation that would not be possible with a conventional linear regression model. Setting ζ prior to 1 assumes a uniform density for the correlation matrices (Lewandowski et al. 2009; Bürkner 2017; Nalborczyk et al. 2019).
I developed five model variations, allowing for different population effects and combinations in group-level variations with intercept and slope. I compared the effectiveness of these models with a leave-one-out analysis, using the theoretical expected log pointwise predictive density (elpd) to assess the predictive accuracy of both models (Vehtari et al. 2017).
Model 1 (Eqn 2) has all variables included as population-level effects and group-level (random) variation for intercept and elevation slopes, with the sex nested within species (species|sex); that is, I expect that the differences in sex are not the same among the species (i.e. male–female difference may result in different means and slopes for the different species).
A more limited Model 2 does not include the grouping variables as population effects. Instead, the model includes them just as group-level (random) parameters, which uses species by sex intercepts and species by sex variations on elevation slope (Eqn 3). Removing the elevation slope from the equation leads to Model 3 (Eqn 4).
For model comparison purposes, I included two more models, one that includes intercept and population effects for elevation (β1) only (Eqn 5) and one model that includes only the intercept, that is, the α parameter (the grand mean intercept) is the only part of the right-hand side model equation. These last two models provide the benchmark for model comparison. Here an elpd difference (elpd diff) less than four with other models means that including these additional variables does not provide additional information, which would justify incorporating these variables.
Incorporating measurement errors
Measuring forearm length in insectivorous bats is, like any physical measurement, fraught with errors. Bayesian analysis enables the inclusion of measurement errors explicitly (Bürkner 2017). It removes the measurement error from ε (Eqn 1), and places it with the response-variable forearm length. Here I demonstrate how to implement this by adding measurement error to the preferred model outcomes. This requires an understanding of forearm measurement errors and takes the form of Eqn 6, where ForearmOBSi, the measured value, is centred on a normally distributed, unknown ‘real’ value ForearmESTi and a known error ForearmSEi. Luckily, forearm length measurement errors for insectivorous bat species in the study area are known with a mean of 0.2 mm and a standard deviation of 0.23 (Herr et al. 2000). I use this standard deviation to incorporate the error for the forearm length estimates in a simplified fashion (Bürkner et al. 2023b).
Elevation measurements are also somewhat variable, and given that bats can fly long distances, I expect that the captures represent an elevation range, rather than the exact elevation in metres asl. Therefore, I included an elevation error into the explanatory side of the equation. Estimation of this error is somewhat more difficult, but we can use some guesses based on home-range and general study-area descriptions. Home-range travel distances for V. darlingtoni were up to 6 km, although most of the triangulated travel distances were less than 1000 m. This is a distance similar to the smaller V. pumulis, a more northerly distributed species, which did not move further than 1 km (Herr 1998; Law and Anderson 2000). Within the limits of the study area, the elevation change over a distance of 1 km ranges between 120 m and 1950 m asl. Using the GEODATA 9-s digital elevation model (9-s DEM) for Australia (Hutchinson 2008), a focal analysis readily calculates the elevation range for a 1 km distance, and 75% of the elevation range is at 200 m or less. Consequently, I include an error of ±100 m for each elevation (Eqn 7), where ElevationOBSi, the measured value, is centred on a normally distributed, unknown ‘real’-value ElevationESTi and a known-error ElevationSEi.
I used uniform distribution (BRMS default flat) priors for both measurement errors.
Results
The results of the analysis showed that the bats comply with Bergmann’s rule, that is, bat size increases with elevation, and, by implication, decreasing temperature. All models provided similar mean elevation estimates but only Model 3 had an acceptable estimate error. The errors for Models 1 and 2 were of the same order of magnitude as the estimate (rounded to the nearest 1/10). Model 3 had an elevation error that was one order of magnitude smaller than the estimate (Table 1). When comparing models, Models 1–3 had a much larger elpd diff value than the benchmark models, indicating that the inclusion of elevation and nested grouping of species with sex provide improved model information (Table 2). The absolute elpd diff differences among Models 1–3 were small and <3, which suggests that these models have similar predictive performance (Sivula et al. 2022). Only Model 3 provided satisfactory estimates from a statistical perspective, and it used the least amount of parameter estimations. The additional information gained from including the grouping variables species and species|sex as population effects was limited and they resulted in an overly large standard error. This is fortuitous because I am mainly interested in the relationship of forearm length with elevation, and not in species specific or sex-related variations. Hence, I subsequently discuss the details of Model 3 only, where I further implement measurement errors.
| Model | Parameter | Estimate | Error | |
|---|---|---|---|---|
| 1 | Intercept | 32.60 | 0.90 | |
| 2 | Intercept | 32.50 | 0.80 | |
| 3 | Intercept | 32.40 | 0.80 | |
| 1 | Elevation | 0.08 | 0.12 | |
| 2 | Elevation | 0.08 | 0.12 | |
| 3 | Elevation | 0.10 | 0.01 | |
| 1 | Residual | 0.85 | 0.02 | |
| 2 | Residual | 0.85 | 0.02 | |
| 3 | Residual | 0.86 | 0.02 |
s.d., standard deviation; elevation slope is per 100 m; all other units are in mm.
| Model | elpd diff | s.e. diff | |
|---|---|---|---|
| 1 | 0.00 | 0.00 | |
| 2 | −0.17 | 0.21 | |
| 3 | −2.69 | 2.72 | |
| Intercept and elevation group-level (random) effects only | −748.45 | 28.38 | |
| Intercept only | −872.76 | 27.71 |
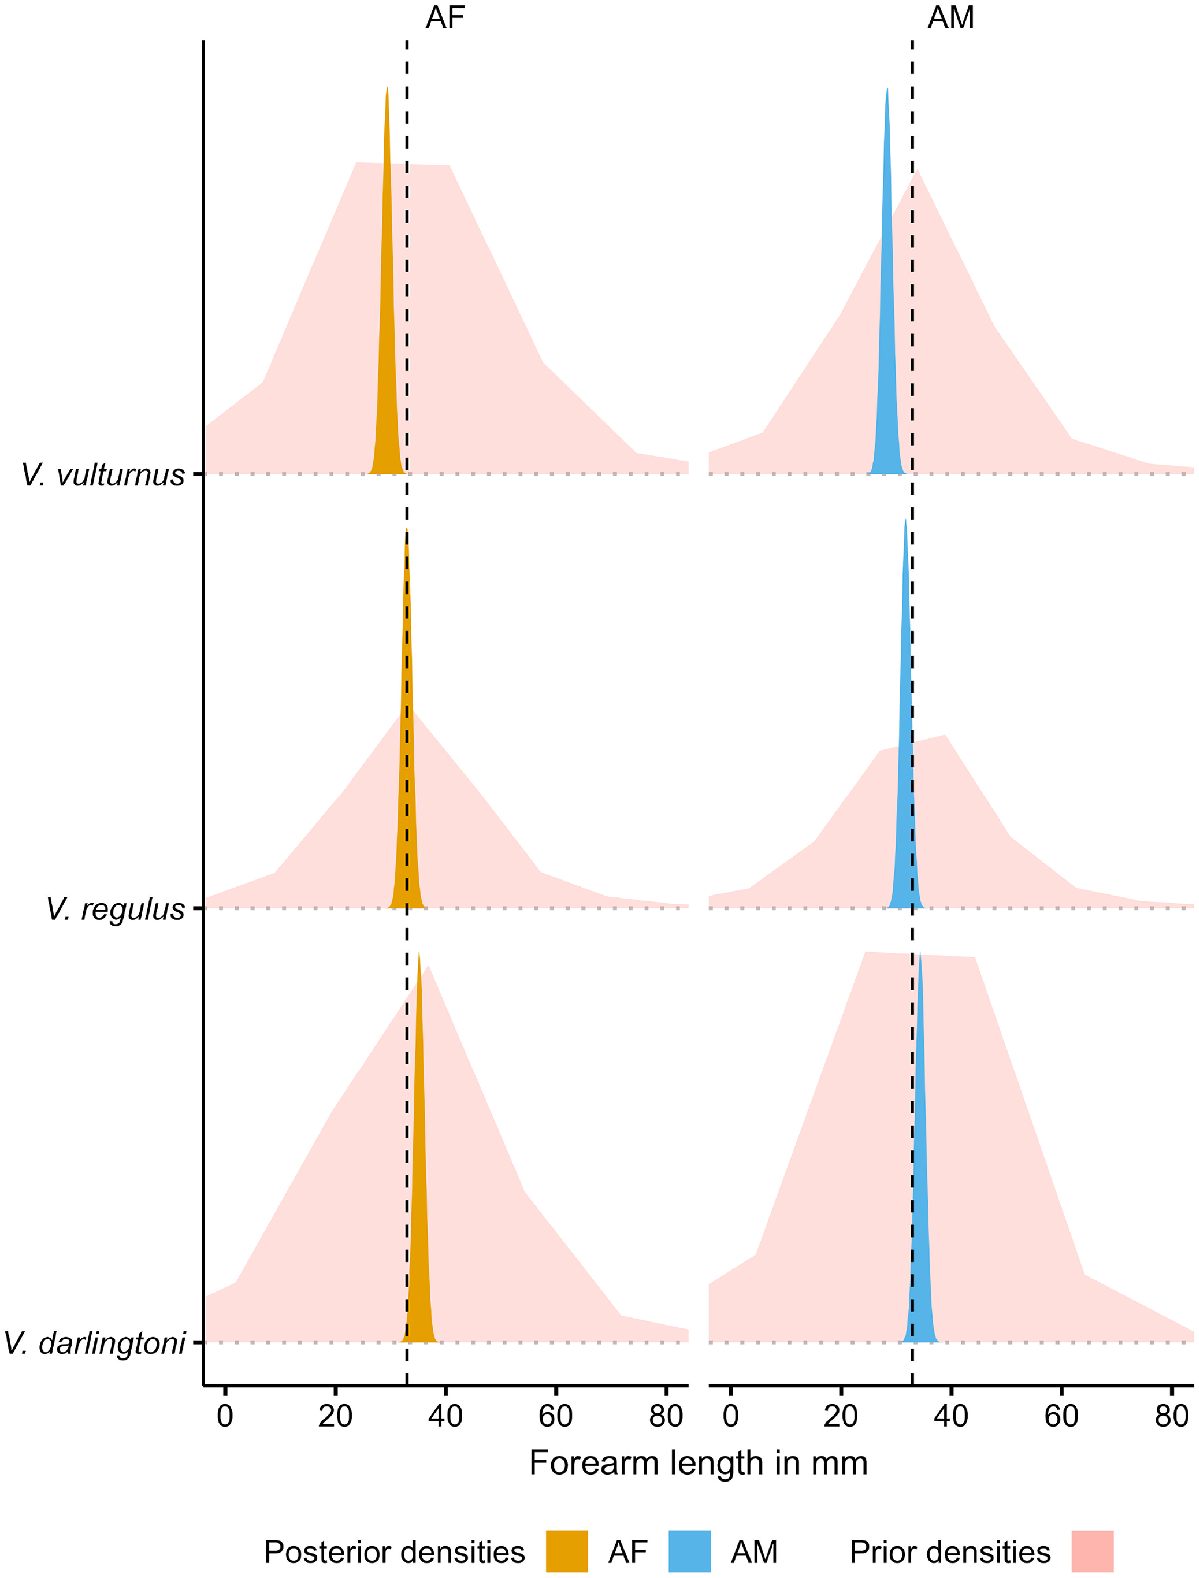
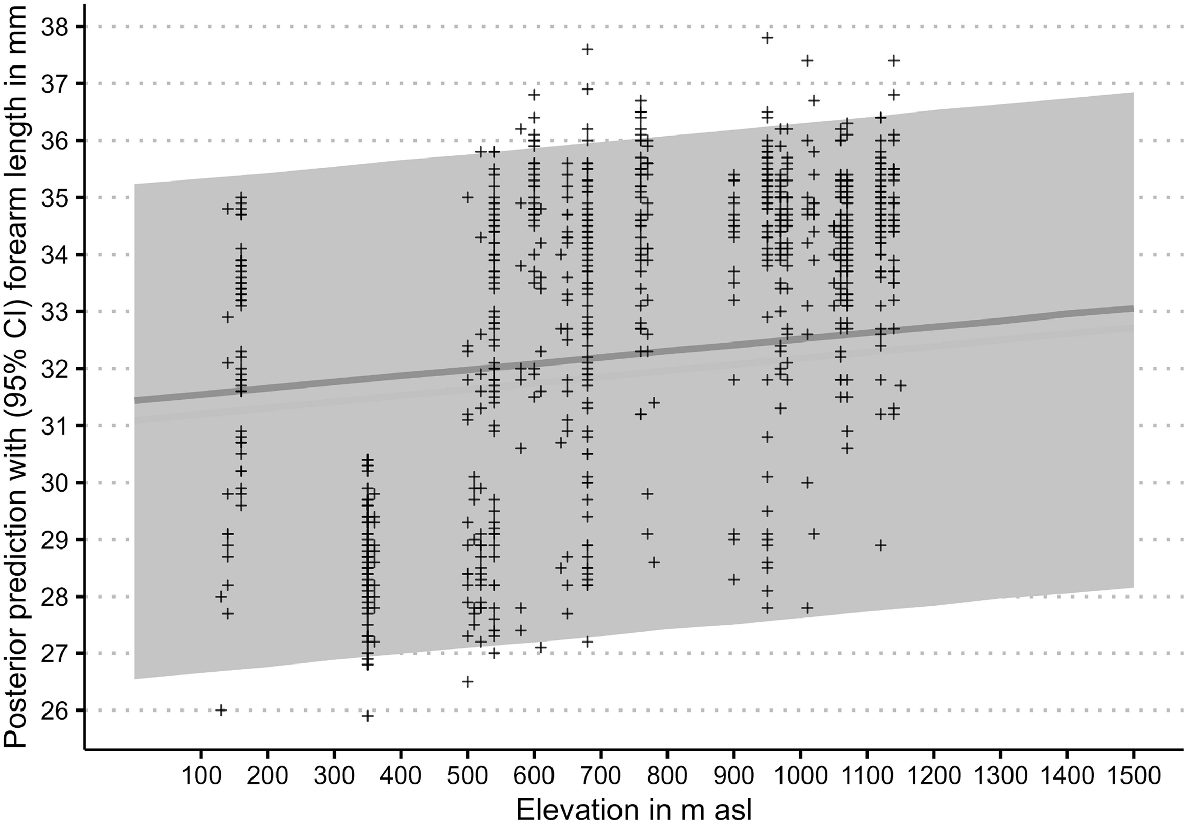
The priors for the measurement error model are broad and provide a wide range of potential forearm length estimates, as the prior densities in Fig. 3 show. Although having low-informative priors, the model provides fairly tight posterior estimates of forearm length as the posterior densities in Fig. 3 attest. With measurement errors for forearm length and elevation included, the residual standard deviation estimate (σ) is 0.82 mm, leading to a residual variance of 0.67. The model estimates a forearm length increase of 0.11 mm for every 100 m elevation increase. The standard error for all estimates is at least one order of magnitude smaller for the population-level effects and less than half the size for residual standard deviations (Table 3), with the latter reflecting the overlap in forearm length between species and sex. This is also apparent in the overlapping posterior densities in Fig. 4 and the overlapping measured forearm length values (‘+’ in Fig. 5) and their posterior predictions (confidence intervals in Fig. 5). Despite this overlap, and even with the inclusion of measurement errors, the model attributed the elevation-related forearm length increase of 1.1 mm over a 1000 m elevation range (Fig. 5) fairly confidently, as the low standard error indicates (Table 3). In the context of Table 3 and Fig. 5, the reviewers struggled with the discrepancies of the reported intercept estimate in the table and location of the visual line in the figure. This difference is a result of summarising aspects of the model; the single grand mean intercept in the table is calculated as the mean of all posterior intercept estimates (i.e. including all intercept estimates at all elevations), whereas the line in the figure is a result of estimating the 5% quantile interval around the median. Although this is an interesting side effect of using mean posteriors predictions in model summaries, the intercept is not of much other interest for the final model. What is important to consider are the slopes (β) in Eqn 4 to ascertain how much a unit of elevation increase influences forearm length. This slope is a result of the relationship of elevation–forearm length and the variation around the grand mean intercept, which also includes the species and species by sex specific variations incorporated in the posteriors.
Comparison of prior and posterior densities of forearm length for three Vespadelus species and their sex. The dashed vertical line indicates the average bat forearm length. AF, adult female; AM, adult male.
| Effect | Term | Estimate | s.e. | |
|---|---|---|---|---|
| Population-level | Intercept | 32.42 | 0.85 | |
| Population-level | Elevation | 0.11 | 0.01 | |
| Group-level (random) | Species | 2.66 | 0.83 | |
| Group-level (random) | Sex within species | 1.11 | 0.51 | |
| Group-level (random) | Sigma | 0.82 | 0.02 |
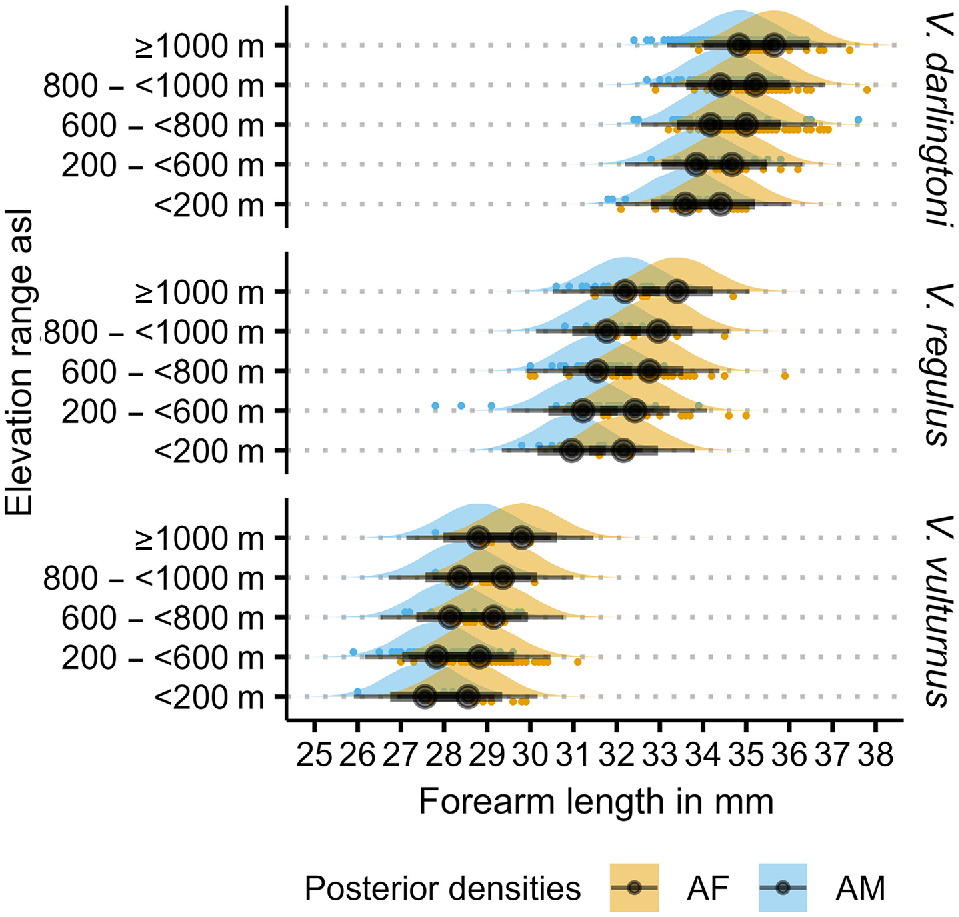
Posterior densities and predictions of Vespadelus forearm length with elevation. AF, adult female; AM, adult male.
Posterior densities and predictions of Vespadelus forearm length with elevation. CI, credible interval as grey band; grey line, median of posterior prediction.
However, the intercept standard deviations of the group-level variables (species, αspecies and sex within species, αspecies|sex, see Eqn 4) show a somewhat larger standard error (Table 3). This indicates that these variables do not influence the relationship as clearly as does the elevation. This is reasonable, given the large range of forearm length among species and within sex of adult bats. Here, the model estimates an upper and lower range of 3.49 mm and 1.83 mm (estimate ± s.e) for species-related deviation from the grand mean intercept respectively. For sex within species, this deviation ranges from 1.62 mm (upper limit) to 0.6 mm (lower limit).
Discussion
This analysis showed a clear increasing relationship between bat size and elevation as a proxy for decreasing temperature, in line with Bergmann’s prediction and based on his original assertion that the surface to volume ratio of body size in animals influences their distribution. There is a positive statistical relationship of bat size (represented by their forearm length) with elevation for a group of three taxonomically closely related, sympatric species. The BMM provided estimates of the relationship with high confidence, as the low standard errors in Table 3 show. While the 1.1 mm increase per 1000 m is smaller than species- and sex-related changes, and 1/8 of the residual standard deviation, the BMM readily estimated residuals and the contribution of each explanatory variable to the prediction. The advantage of the BMM approach over conventional linear regression is that it can readily incorporate measurement errors for both the predictor and the explanatory variables. This leads to more robust estimates and provides support for an increasing relationship of bat size with elevation.
The findings of increasing forearm length (as a reliable size indicator in bats) with elevation (and, by implication, decreasing temperature) conforms with the generality of Bergmann’s rule, where larger animals can tolerate colder temperatures as a result of reduced surface to volume ratio. The result also supports Bergmann’s prediction that the smaller species of the same genera, where the main difference is their size, require a warmer climate and this requirement is directly related to the size difference (‘… Gäbe es nun Genera, deren Species sich so weit als möglich (eine Beschränkung dieser Möglichkeit ist im Anhange angedeutet) nur durch die Grösse unterschieden, so würden die kleinen Arten derselben durchweg ein wärmeres Klima fordern und zwar nach einem aus der Grössendifferenz genau bestimmten Maasse…’; Bergmann 1848, p. 46).
Accepting this conformance for this study relies on the following two causal relationships: (1) the relationship between body size and temperature that Bergmann’s rule implies, and (2) the linear relationship of average temperature increase with elevation. The causal relationship between the need for increased body size in declining temperature is based on the unequal surface:volume-ratio change (i.e. where volume increases with the power of 3 and surface with the power of 2). As a consequence, larger warm-blooded animals can regulate their core temperature more easily than can smaller animals. This is true for animals of closely related taxa, where the smaller trait differences are less likely to compensate temperature-regulation deficiencies (Brown and Lee 1969; Watt et al. 2010; Clauss et al. 2013; Baldwin et al. 2023). The more unrelated the taxa are, the broader are the organisational modifications that can over-ride the principle (loosely translated from ‘… Die Breite dieser Modificationen, welche sämmtlich auf der Organisation beruhen, muss natürlich um so mehr abnehmen je ähnlicher die Thiere einander in ihrer Organisation sind. So differente Grössen, wie sie in den Extremen in den verschiedenen Klimaten, besonders im tropischen gegeben sind, setzen grosse Verschiedenheiten der Organisation voraus…’) (Bergmann 1848, p. 46). This study used three closely related Vespadelus taxa for analysing the body size to elevation relationship, with the assumption that elevation is a proxy for temperature.
The second assumption is based on the (region-specific, very generalised) linear relationship between elevation and temperature known as the lapse rate. This is as a rule of thumb, which, on average, is 0.75°C decrease for every 100 m of elevation (Galloway 1988; Rolland 2003). However, the lapse rate implies a general relationship that varies geographically with temperature, precipitation and with air pressure, and this variation is exacerbated in mountainous regions (Nunez and Colhoun 1986; Minder et al. 2010; Pan et al. 2021; Rosas-Chavoya et al. 2021). In the Australian Alps region, for example, this rate is applicable over the winter period, but can be 0.91°C degrees per 100 m over summer and varies with microclimate locally (Green 2014). Hence, the model in this paper incorporates elevation variation, which is a way of addressing this variability in temperature, in addition to allowing for bat flight distances increasing the elevation range.
The size–elevation relationship also has implications for insectivorous bats in the study area under climate change. If insectivorous bats align with Bergmann’s rule, anthropogenic-related changes in climate may influence their survival ability at different elevations through a warming effect (see also Law et al. 2018). Climate change is likely to influence the bode size, and there is a risk that animals may not have sufficient time for adaption if the current environmental change is more rapid than their adaptaptability through phenotypic plasticity (Charmantier et al. 2008; Teplitsky and Millien 2013; Merilä and Hendry 2014; Thackeray et al. 2016; Radchuk et al. 2019). Current evidence around this risk for V. darlingtoni is inconclusive because previous studies did not find a consistent trend for a change over recent decades in density, survival or condition from one montane study area (Law et al. 2018; Law et al. 2023). Nevertheless, the risk still applies to bats in the study area, and, in addition, they are exposed to climate change-induced suitable habitat reduction. In areas where larger bats occur at higher altitudes, this may push them further into higher areas where more extreme temperature changes are prevalent, thus limiting their suitable-habitat availability (Moritz et al. 2008; Chen et al. 2011; Spence and Tingley 2020; Spence et al. 2022).
In the context of the study area, if global warming results in a competitive advantage for smaller bats, one could expect the following two overlapping outcomes for the larger species: (1) the average forearm length (by implication, size) of the population would reduce, thus exposing bats to more competition with the smaller species; and (2) the competition from the smaller species would push the larger species into higher (by implication, cooler) areas. The three bat species have overlapping echolocation call-frequency ranges and they will feed on the full size ranges of available insects, with V. vulturnus having a potential upper size limit of prey it can ingest when compared with the two larger species. However, even though a smaller bat may not be able to ingest as large a prey owing to its physical size, it has the advantage of accessing smaller tree hollows for roosting, as well as being able to use the hollows larger bats rely on (see e.g. Herr 1998). Being pushed into higher habitats may have negative consequences. These higher habitats are already limited; within the study area, V. darlingtoni has a stronghold in the higher elevations and mountain peaks, so there is nowhere higher to go. Further afield, their distribution is mostly limited to below the subalpine areas, to an altitude of approximately 1500 m, where large trees are in low numbers (Slatyer 2010). This limit is related to their preference for larger roost trees (above 80 cm in diameter at breast height) with hollow development that provides appropriate shelter and microclimate for maternity groups (Taylor and Savva 1988; Herr 1998; Hoye et al. 2008).
A very coarse back of the envelope (BOTE) calculation for the study area can provide an estimate of suitable habitat reduction. When assuming that current elevation provides the current suitable temperature range for the bats, a 1.5°C and 3°C temperature increase would change suitability to a 1.5°C (or 3°C) higher elevation equivalent. Under climate change, tree-line upward movement may occur, but the availability of larger roosting trees would require significant time to occur, so I ignore upslope habitat improvement from an upward-shifting subalpine boundary. Further, I assume that (1) competition from the smaller species makes habitat for V. darlingtoni less suitable. Although competition among bats is very difficult to prove directly, ecological and evolutionary theory dictates its validity, and studies have generally accepted it (Roeleke et al. 2018; Morningstar et al. 2019; Salinas-Ramos et al. 2019; Novella-Fernandez et al. 2020). I also assume that (2) the average temperature lapse rate for the study area does not change under future climate (i.e. ignoring lapse-rate change at lower altitudes, see e.g. Mokhov and Akperov (2006), Kröner et al. (2016)).
The result is an elevation change of 200 m for 1.5°C and 400 m for 3°C, that is, 1300 m current elevations are equivalent to 1500 m elevations under 1.5°C increase and 1100 m current elevations are equivalent to 1500 m under 3°C increase. Under such circumstances, there is a reduction of suitable habitats for V. darlingtoni in those areas that in the future would be the 1500 m or above equivalent of the current elevations. This area is readily calculated for the study area on the basis of the Australian 9-s DEM (see e.g. Hutchinson 2008), to a 0.6 km2 (0.9%) suitable-habitat loss for a 1.5°C average temperature increase and a 1.7 km2 (3%) suitable-habitat loss for a 3°C average temperature increase. Climate change also may result in other changes such as habitat loss from, for example, increased fires and changes in vegetation as a response to reduced precipitation or a change in the tree line through climate tracking (Körner 2012; Zylstra 2018; Young and Littleboy 2019; Naccarella et al. 2020; Ji et al. 2022; Verrall et al. 2023). Although this BOTE does not consider such changes, they are still useful in estimating potential climate-change impacts on larger bats. Here, the causal link is the mechanism behind Bergmann’s rule, and its consequences that allow smaller bats to access higher areas under a warmer climate.
Conclusions and future work
This study applied a BMM to data from 775 bats of three closely related Vespadelus species and showed that there is a linear increase of bat size (as represented by forearm length) with elevation. The approach incorporated measurement errors for forearm length and elevation to estimate a forearm length increase of 1.1 (±0.01) mm over a range of 1000 m. Although some studies have confirmed an intraspecific relationship between size and temperature (Jiang et al. 2019; Wang et al. 2020; Mundinger et al. 2021; Alston et al. 2023; Wood and Cousins 2023), this is the first study to show that bat size is related to elevation (and associated temperature decline) in three sympatric, closely related species of the same genus and it confirmed what Bergmann predicted over 175 years ago.
Under a warming climate, the results predict that bats become smaller, on average. When incorporating average temperature lapse rate to calculate elevations that assume a 1.5°C and 3°C changes in future average climate, the study coarsely quantified changes that resulted in a reduction of suitable habitat for the largest of the three species, V. darlingtoni, of up to 3%. This assumed that habitat would become less suitable for the largest bat species because of increased competition from the smaller species and included a roost-tree preference-related upper-elevation distribution limit for the larger species of 1500 m.
Future work could use more recent forearm length measurements and by comparing these with older measures (e.g. from the Australasian Bird and Bat Banding Scheme or long-term field studies), it may be possible to confirm the predicted lower forearm length of V. darlingtoni, for an area with sufficiently wide elevation ranges that show an increased temperature over time.
Acknowledgements
Micah Davies’ valuable feedback provided improvements on the draft of this paper. I am grateful to Ondrej Hlinka for upgrading CSIRO HPC to the cmdstanR library on short turn-around. This reduced the MCMC estimates to very reasonable time-frame from days to within an hour. I also thank three anonymous reviewers, whose comments helped improve the clarity of the paper.
References
Alston JM, Keinath DA, Willis CKR, Lausen CL, O’Keefe JM, Tyburec JD, Broders HG, Moosman PR, Carter TC, Chambers CL, Gillam EH, Geluso K, Weller TJ, Burles DW, Fletcher QE, Norquay KJO, Goheen JR (2023) Environmental drivers of body size in North American bats. Functional Ecology 37, 1020-1032.
| Crossref | Google Scholar |
Baldwin JW, Garcia-Porta J, Botero CA (2023) Complementarity in Allen’s and Bergmann’s rules among birds. Nature Communications 14, 4240.
| Crossref | Google Scholar |
Bergmann C (1848) ‘Über die Verhältnisse der Wärmeökonomie der Thiere zu ihrer Größe’. Abgedruckt aus den Göttinger studien. pp. 595–708. (Vandenhoeck und Ruprecht) Available at https://www.digitale-sammlungen.de/en/view/bsb10306637
Brown JH, Lee AK (1969) Bergmann’s rule and climatic adaptation in woodrats (Neotoma). Evolution 23, 329-338.
| Crossref | Google Scholar | PubMed |
Bürkner P-C (2017) Brms: an R package for Bayesian multilevel models using Stan. Journal of Statistical Software 80, 1-28.
| Crossref | Google Scholar |
Bürkner P-C, Gabry J, Weber S, Johnson A, Modrak M, Badr HS, Weber F, Ben-Shachar MS, Rabel H, Mills SC, Wild S (2023a) Estimating distributional models with brms. Vignette included in R package brms, version 2.20.1. Available at https://CRAN.R-Project.org/package=brms
Bürkner P-C, Gabry J, Weber S, Johnson A, Modrak M, Badr HS, Weber F, Ben-Shachar MS, Rabel H, Mills SC, Wild S (2023b) Handle missing values with brms. Vignette included in R package brms, version 2.20.1. Available at https://CRAN.R-Project.org/package=brms
Castillo-Figueroa D (2022) Does Bergmann’s rule apply in bats? Evidence from two neotropical species. Neotropical Biodiversity 8, 200-221.
| Crossref | Google Scholar |
Charmantier A, McCleery RH, Cole LR, Perrins C, Kruuk LEB, Sheldon BC (2008) Adaptive phenotypic plasticity in response to climate change in a wild bird population. Science 320, 800-803.
| Crossref | Google Scholar | PubMed |
Chen I-C, Hill JK, Ohlemüller R, Roy DB, Thomas CD (2011) Rapid range shifts of species associated with high levels of climate warming. Science 333, 1024-1026.
| Crossref | Google Scholar | PubMed |
Chenery M, Geiser F, Stawski C (2022) Thermal biology and roost selection of free-ranging male little forest bats, Vespadelus vulturnus, during winter. Journal of Mammalogy 103, 826-834.
| Crossref | Google Scholar | PubMed |
Churchill S (2009) ‘Australian bats.’ (Allen & Unwin) Available at https://books.google.com.au/books?id=zY4ZfTWXPYoC
Clauss M, Dittmann MT, Müller DWH, Meloro C, Codron D (2013) Bergmann’s rule in mammals: a cross-species interspecific pattern. Oikos 122, 1465-1472.
| Crossref | Google Scholar |
Davy CM, von Zuben V, Kukka PM, Gerber BD, Slough BG, Jung TS (2022) Rapidly declining body size in an insectivorous bat is associated with increased precipitation and decreased survival. Ecological Applications 32, e2639.
| Crossref | Google Scholar |
de Oliveira FV (2020) Microchiroptera life history. In ‘Encyclopedia of animal cognition and behavior’. (Eds J Vonk, T Shackelford) pp. 1–15. (Springer International Publishing: Cham, Switzerland) doi:10.1007/978-3-319-47829-6_1158-1
Gabry J, Češnovar R, Johnson A (2023) Cmdstanr: R interface to ‘CmdStan’. Available at https://mc-stan.org/cmdstanr/
Galloway RW (1988) The potential impact of climate changes on Australian ski fields. In ‘Greenhouse: planning for climate change’. (Ed. G Pearman) pp. 428–437. (CSIRO Publishing: Melbourne, Vic, Australia) doi:10.1071/9780643105041
Gardner JL, Heinsohn R, Joseph L (2009) Shifting latitudinal clines in avian body size correlate with global warming in Australian passerines. Proceedings of the Royal Society B: Biological Sciences 276, 3845-3852.
| Crossref | Google Scholar |
Gonsalves L, Bicknell B, Law B, Webb C, Monamy V (2013) Mosquito consumption by insectivorous bats: does size matter? PLoS ONE 8, e77183.
| Crossref | Google Scholar | PubMed |
Green K (2014) Growing season air temperature lapse rate in the snowy mountains. Australian Meteorological and Oceanographic Journal 64, 289-291.
| Crossref | Google Scholar |
He J, Tu J, Yu J, Jiang H (2023) A global assessment of Bergmann’s rule in mammals and birds. Global Change Biology 29, 5199-5210.
| Crossref | Google Scholar | PubMed |
Herr A (1998) Aspects of the ecology of insectivorous forest-dwelling bats (Microchiroptera) in the western slopes of the Australian alps. PhD Thesis, Charles Sturt University. Available at https://doi.org/10.13140/RG.2.2.12708.94087/1
Herr A, Klomp NI, Lumsden LF (2000) Variability in measurements of microchiropteran bats caused by different investigators. Mammalian Biology 65, 51-54 Available at https://www.biodiversitylibrary.org/part/192414.
| Google Scholar |
Hutchinson SMF (2008) GEODATA 9 second DEM and D8: digital elevation model version 3 and flow direction grid 2008. Record DEM-9S.v3. (Geoscience Australia: Canberra, ACT, Australia) Available at https://pid.geoscience.gov.au/dataset/ga/66006
Ji F, Nishant N, Evans JP, Di Luca A, Di Virgilio G, Cheung KKW, Tam E, Beyer K, Riley ML (2022) Rapid warming in the Australian alps from observation and NARCliM simulations. Atmosphere 13, 1686.
| Crossref | Google Scholar |
Jiang T, Wang J, Wu H, Csorba G, Puechmaille SJ, Benda P, Boireau J, Toffoli R, Courtois J-Y, Nyssen P, Colombo R, Feng J (2019) The patterns and possible causes of global geographical variation in the body size of the greater horseshoe bat (Rhinolophus ferrumequinum). Journal of Biogeography 46, 2363-2377.
| Crossref | Google Scholar |
Körner C (2012) ‘Alpine treelines: functional ecology of the global high elevation tree limits’. (Springer: Basel, Switzerland) doi:10.1007/978-3-0348-0396-0
Kröner N, Kotlarski S, Fischer E, Lüthi D, Zubler E, Schär C (2016) Separating climate change signals into thermodynamic, lapse-rate and circulation effects: theory and application to the European summer climate. Climate Dynamics 48, 3425-3440.
| Crossref | Google Scholar |
Kunz TH, Whitaker JO, Jr, Wadanoli MD (1995) Dietary energetics of the insectivorous mexican free-tailed bat (Tadarida brasiliensis) during pregnancy and lactation. Oecologia 101, 407-415.
| Crossref | Google Scholar | PubMed |
Law BS, Anderson J (2000) Roost preferences and foraging ranges of the eastern forest bat Vespadelus pumilus under two disturbance histories in northern New South Wales, Australia. Austral Ecology 25, 352-367.
| Crossref | Google Scholar |
Law B, Anderson J, Chidel M (1998) A bat survey in State Forests on the south-west slopes region of New South Wales with suggestions of improvements for future surveys. Australian Zoologist 30, 467-479.
| Crossref | Google Scholar |
Law BS, Chidel M, Law PR (2018) Forest bat population dynamics over 14 years at a climate refuge: effects of timber harvesting and weather extremes. PLoS ONE 13, e0191471.
| Crossref | Google Scholar |
Law B, Brassil T, Chidel M (2022) Site fidelity and other attributes of infrequently trapped bats over two decades in a montane wet sclerophyll forest. Australian Mammalogy 45, 91-97.
| Crossref | Google Scholar |
Law B, Brassil T, Proud R, Potts J (2023) Estimating density of forest bats and their long-term trends in a climate refuge. Ecology and Evolution 13, e10215.
| Crossref | Google Scholar |
Lentini PE, Bird TJ, Griffiths SR, Godinho LN, Wintle BA (2015) A global synthesis of survival estimates for microbats. Biology Letters 11, 20150371.
| Crossref | Google Scholar | PubMed |
Lewandowski D, Kurowicka D, Joe H (2009) Generating random correlation matrices based on vines and extended onion method. Journal of Multivariate Analysis 100, 1989-2001.
| Crossref | Google Scholar |
McElreath R (2020) ‘Statistical rethinking: a Bayesian course with examples in r and stan’, 2nd edn. (CRC Press) Available at http://xcelab.net/rm/statistical-rethinking/
McGuire LP, Kelly LA, Baloun DE, Boyle WA, Cheng TL, Clerc J, Fuller NW, Gerson AR, Jonasson KA, Rogers EJ, Sommers AS, Guglielmo CG (2018) Common condition indices are no more effective than body mass for estimating fat stores in insectivorous bats. Journal of Mammalogy 99, 1065-1071.
| Crossref | Google Scholar |
Meiri S, Dayan T (2003) On the validity of Bergmann’s rule. Journal of Biogeography 30, 331-351.
| Crossref | Google Scholar |
Meng F, Zhu L, Huang W, Irwin DM, Zhang S (2016) Bats: body mass index, forearm mass index, blood glucose levels and SLC2A2 genes for diabetes. Scientific Reports 6, 29960.
| Crossref | Google Scholar |
Merilä J, Hendry AP (2014) Climate change, adaptation, and phenotypic plasticity: the problem and the evidence. Evolutionary Applications 7, 1-14.
| Crossref | Google Scholar | PubMed |
Minder JR, Mote PW, Lundquist JD (2010) Surface temperature lapse rates over complex terrain: lessons from the Cascade Mountains. Journal of Geophysical Research: Atmospheres 115, D14122.
| Crossref | Google Scholar |
Mokhov II, Akperov MG (2006) Tropospheric lapse rate and its relation to surface temperature from reanalysis data. Izvestiya, Atmospheric and Oceanic Physics 42, 430-438.
| Crossref | Google Scholar |
Moritz C, Patton JL, Conroy CJ, Parra JL, White GC, Beissinger SR (2008) Impact of a century of climate change on small-mammal communities in Yosemite National Park, USA. Science 322, 261-264.
| Crossref | Google Scholar | PubMed |
Morningstar DE, Robinson CV, Shokralla S, Hajibabaei M (2019) Interspecific competition in bats and diet shifts in response to white-nose syndrome. Ecosphere 10, e02916.
| Crossref | Google Scholar |
Mundinger C, Scheuerlein A, Kerth G (2021) Long-term study shows that increasing body size in response to warmer summers is associated with a higher mortality risk in a long-lived bat species. Proceedings of the Royal Society B: Biological Sciences 288, 20210508.
| Crossref | Google Scholar |
Naccarella A, Morgan JW, Cutler SC, Venn SE (2020) Alpine treeline ecotone stasis in the face of recent climate change and disturbance by fire. PLoS ONE 15, e0231339.
| Crossref | Google Scholar | PubMed |
Nalborczyk L, Batailler C, Lœvenbruck H, Vilain A, Bürkner P-C (2019) An introduction to Bayesian multilevel models using brms: a case study of gender effects on vowel variability in standard Indonesian. Journal of Speech, Language, and Hearing Research 62, 1225-1242.
| Crossref | Google Scholar | PubMed |
Novella-Fernandez R, Ibañez C, Juste J, Clare EL, Doncaster CP, Razgour O (2020) Trophic resource partitioning drives fine-scale coexistence in cryptic bat species. Ecology and Evolution 10, 14122-14136.
| Crossref | Google Scholar | PubMed |
Nunez M, Colhoun EA (1986) A note on air temperature lapse rates on Mount Wellington, Tasmania. Papers and Proceedings of The Royal Society of Tasmania 120, 11-15.
| Crossref | Google Scholar |
Pan Z, Zhu J, Liu J, Gu J, Liu Z, Qin F, Pan Y (2021) Estimation of air temperature and the mountain-mass effect in the Yellow River Basin using multi-source data. PLoS ONE 16, e0258549.
| Crossref | Google Scholar |
Radchuk V, Reed T, Teplitsky C, van de Pol M, Charmantier A, Hassall C, Adamík P, Adriaensen F, Ahola MP, Arcese P, Miguel Avilés J, Balbontin J, Berg KS, Borras A, Burthe S, Clobert J, Dehnhard N, de Lope F, Dhondt AA, Dingemanse NJ, Doi H, Eeva T, Fickel J, Filella I, Fossøy F, Goodenough AE, Hall SJG, Hansson B, Harris M, Hasselquist D, Hickler T, Joshi J, Kharouba H, Martínez JG, Mihoub J-B, Mills JA, Molina-Morales M, Moksnes A, Ozgul A, Parejo D, Pilard P, Poisbleau M, Rousset F, Rödel M-O, Scott D, Senar JC, Stefanescu C, Stokke BG, Kusano T, Tarka M, Tarwater CE, Thonicke K, Thorley J, Wilting A, Tryjanowski P, Merilä J, Sheldon BC, Pape Møller A, Matthysen E, Janzen F, Dobson FS, Visser ME, Beissinger SR, Courtiol A, Kramer-Schadt S (2019) Adaptive responses of animals to climate change are most likely insufficient. Nature Communications 10, 3109.
| Crossref | Google Scholar |
R Core Team (2021) ‘R: a language and environment for statistical computing.’ (R Foundation for Statistical Computing: Vienna, Austria) Available at: https://www.R-project.org/
Roeleke M, Johannsen L, Voigt CC (2018) How bats escape the competitive exclusion principle: seasonal shift from intraspecific to interspecific competition drives space use in a bat ensemble. Frontiers in Ecology and Evolution 6, 101.
| Crossref | Google Scholar |
Rolland C (2003) Spatial and seasonal variations of air temperature lapse rates in alpine regions. Journal of Climate 16, 1032-1046.
| Crossref | Google Scholar |
Rosas-Chavoya M, López-Serrano PM, Hernández-Díaz JC, Wehenkel C, Vega-Nieva DJ (2021) Analysis of near-surface temperature lapse rates in mountain ecosystems of northern Mexico using Landsat-8 satellite images and ECOSTRESS. Remote Sensing 14, 162.
| Crossref | Google Scholar |
Salinas-Ramos VB, Ancillotto L, Bosso L, Sánchez-Cordero V, Russo D (2019) Interspecific competition in bats: state of knowledge and research challenges. Mammal Review 50, 68-81.
| Crossref | Google Scholar |
Sivula T, Magnusson M, Matamoros AA, Vehtari A (2022) Uncertainty in Bayesian leave-one-out cross-validation based model comparison. Available at https://arxiv.org/abs/2008.10296
Slatyer R (2010) Climate change impacts on Australia’s alpine ecosystems. ANU Undergraduate Research Journal 2, 81-97.
| Crossref | Google Scholar |
Spence AR, Tingley MW (2020) The challenge of novel abiotic conditions for species undergoing climate-induced range shifts. Ecography 43, 1571-1590.
| Crossref | Google Scholar |
Spence AR, LeWinter H, Tingley MW (2022) Anna’s hummingbird (Calypte anna) physiological response to novel thermal and hypoxic conditions at high elevations. Journal of Experimental Biology 225, jeb243294.
| Crossref | Google Scholar |
Stawski C, Willis CKR, Geiser F (2014) The importance of temporal heterothermy in bats. Journal of Zoology 292, 86-100.
| Crossref | Google Scholar |
Taylor RJ, Savva NM (1988) Use of roost sites by four species of bats in state forest in south-eastern Tasmania. Wildlife Research 15, 637.
| Crossref | Google Scholar |
Teplitsky C, Millien V (2013) Climate warming and Bergmann’s rule through time: is there any evidence? Evolutionary Applications 7, 156-168.
| Crossref | Google Scholar | PubMed |
Thackeray SJ, Henrys PA, Hemming D, Bell JR, Botham MS, Burthe S, Helaouet P, Johns DG, Jones ID, Leech DI, Mackay EB, Massimino D, Atkinson S, Bacon PJ, Brereton TM, Carvalho L, Clutton-Brock TH, Duck C, Edwards M, Elliott JM, Hall SJG, Harrington R, Pearce-Higgins JW, Høye TT, Kruuk LEB, Pemberton JM, Sparks TH, Thompson PM, White I, Winfield IJ, Wanless S (2016) Phenological sensitivity to climate across taxa and trophic levels. Nature 535, 241-245.
| Crossref | Google Scholar | PubMed |
Vehtari A, Gelman A, Gabry J (2017) Practical Bayesian model evaluation using leave-one-out cross-validation and WAIC. Statistics and Computing 27, 1413-1432.
| Crossref | Google Scholar |
Verrall B, Norman P, Mackey B, Fisher S, Dodd J (2023) The impact of climate change and wildfire on decadal alpine vegetation dynamics. Australian Journal of Botany 71, 231-251.
| Crossref | Google Scholar |
Voigt CC, Sörgel K, Dechmann DKN (2010) Refueling while flying: foraging bats combust food rapidly and directly to power flight. Ecology 91, 2908-2917.
| Crossref | Google Scholar | PubMed |
Wang M, Chen K, Guo D, Luo B, Wang W, Gao H, Liu Y, Feng J (2020) Ambient temperature correlates with geographic variation in body size of least horseshoe bats. Current Zoology 66, 459-465.
| Crossref | Google Scholar | PubMed |
Watt C, Mitchell S, Salewski V (2010) Bergmann’s rule; a concept cluster? Oikos 119, 89-100.
| Crossref | Google Scholar |
Wood H, Cousins SAO (2023) Variability in bat morphology is influenced by temperature and forest cover and their interactions. Ecology and Evolution 13, e9695.
| Crossref | Google Scholar |
Young J, Littleboy M (2019) Climate change impacts in the NSW and ACT alpine region: impacts on water availability. (NSW Department of Planning, Industry and Environment: Sydney, NSW, Australia) Available at https://www.climatechange.environment.nsw.gov.au/sites/default/files/2021-08/Climate change impacts Alpine - Water availability.pdf
Zylstra PJ (2018) Flammability dynamics in the Australian alps. Austral Ecology 43, 578-591.
| Crossref | Google Scholar |