

Using detection dogs for surveillance of invasive dama wallaby (Notamacropus eugenii) in North Island, New Zealand
A. David M. Latham A * , M. Cecilia Latham A , Jo Peace B and Andrew M. Gormley A
A
B
Abstract
Dama wallabies (Notamacropus eugenii) were introduced into the Bay of Plenty Region, New Zealand, in the early 1900s. They subsequently became an invasive pest, damaging pasture, silviculture, and native vegetation. One key management strategy is the eradication of isolated populations.
First, we empirically determined the detection probabilities of detection dogs and handlers searching for faecal pellet groups of dama wallaby in pasture and forested habitats. Second, we used detection probabilities to derive surveillance system sensitivity (SSe) and estimate the cost per hectare required to have a high confidence (95%) that a targeted wallaby population has been eradicated.
We collected and deployed faecal pellet groups in an area with no naturally occurring wallabies. Following faecal pellet surveys by detection dogs and handlers, we estimated the probability of a dog–handler team detecting a pellet group and derived SSe. We derived SSe for a single faecal pellet group and, using simulation, upscaled this estimate to multiple pellet groups voided by a single surviving individual.
The detection probability of dogs searching for a single faecal pellet group that was within the detection swathe was relatively high (minimum of 45%). Scaling this instantaneous probability of detection for a single pellet group to the multiple pellet groups voided by a single wallaby around its home range resulted in 30–33-fold increases in SSe compared to the sensitivity of searching for a single faecal pellet group. The costs of surveillance for confirming eradication using detection dogs and handlers are NZ$54–NZ$72 for a 100-ha area.
Detection dogs and handlers are an efficacious and cost-effective surveillance method for confirming eradication of dama wallaby in open and forested habitats.
Detection dogs and handlers are an important surveillance tool for the management of wallabies in New Zealand. The data from this study enable managers to determine the required surveillance effort to have high confidence (e.g. 0.95) that a wallaby population has been eradicated, or that a suspected new population is actually absent if no wallabies are detected. Additionally, it enables per hectare costs of surveillance to be estimated and compared to alternative methods.
Keywords: damage, decision making, faecal pellet surveys, Macropodidae, pest management, proof of eradication, surveillance system sensitivity, survey effort, tammar wallaby, vertebrate pests.
Introduction
Invasive mammalian herbivores can threaten natural biodiversity, ecosystem function, and primary productivity (Putman and Moore 1998; Hone 2007; Dolman and Wäber 2008; Relva et al. 2010; Latham et al. 2020). Sustained lethal control of invasive mammalian populations is an important strategy for suppressing pest numbers and mitigating the damage they cause (Parkes and Murphy 2003). However, given the high financial expenditures associated with managing pests in perpetuity, eradication is increasingly favoured as a better long-term strategy for delivering high ecological benefits (Russell et al. 2015; Jones et al. 2016; Macdonald et al. 2019). To date, eradication has been most successful for newly founded populations with limited geographic distributions and low risk of reincursion (Tobin et al. 2014; Robertson et al. 2017), exemplified by offshore and oceanic islands (Donlan et al. 2003; Towns and Broome 2003; Ramsey et al. 2009). Nevertheless, as new technologies emerge and evidence-based strategies improve, eradications from increasingly large mainland areas become more feasible (Nugent et al. 2018; Murphy et al. 2019; Anderson et al. 2022).
Wallabies (Macropodidae) are herbivorous marsupials native to Australia and New Guinea (Eldridge and Coulson 2015). They have been introduced to Hawaii, New Zealand, and parts of the British Isles and continental Europe (Lazell et al. 1984; English and Caravaggi 2020; Latham and Warburton 2021). Although most populations of introduced wallabies have remained at low numbers around their point of release or escape, some populations have increased in numbers, expanded their geographic ranges, and had unwanted impacts in invaded areas (Havlin et al. 2018; Latham et al. 2020; Latham and Warburton 2021). The unwanted impacts of wallabies are most evident and widespread for populations of dama (or tammar; Notamacropus eugenii) and Bennett’s (or red-necked; N. rufogriseus) wallabies that were introduced into the North and South islands of New Zealand, respectively (Latham and Warburton 2021). These species negatively impact native vegetation, pasture, crops, and silviculture (Warburton 1986; Wallace and Wallace 1995; Wright 2017), although quantitative data supporting some of these impacts are sparse (Latham et al. 2020).
Dama wallabies were introduced into New Zealand from Australia in approximately 1870 (Wodzicki and Flux 1967). Initially released on Kawau Island in the Hauraki Gulf, they were subsequently liberated (probably from the Kawau Island population) in the Rotorua District, North Island, in 1912 and 1940 (Latham and Warburton 2021). Dama wallabies have spread from the release site in the Rotorua Lakes area, and it is estimated that they currently occupy between 1865 km2 and 4126 km2, primarily in the Bay of Plenty Region (Latham et al. 2019). To reduce or halt the spread of dama and other species of wallaby, the New Zealand Ministry for Primary Industries was tasked with leading Tipu Mātoro, a National Wallaby Eradication Programme (NWEP). The NWEP has two primary objectives. First, to conduct sustained lethal control operations to reduce the numbers of dama and Bennett’s wallabies within their respective containment areas to mitigate the damage they cause and to reduce dispersal pressure, which is assumed to be density-dependent. Second, to conduct surveillance to locate low-density populations of wallabies outside the containment areas and subsequently implement eradication and surveillance to confirm eradication. The research in this paper contributes to the second objective, the eradication of outlying populations.
Key to successful eradication (or elimination, if reinvasion is possible) programs is delimiting the extent of the target area and deciding when local eradication has been achieved so that removal efforts within the target area can be stopped (Ramsey et al. 2009; Latham et al. 2021; Anderson et al. 2022). This is a critical element of an eradication program because absence of evidence of the pest does not necessarily indicate absence of the pest, especially when insufficient survey effort has been made to collect evidence (Anderson et al. 2013). Moreover, a cost-effective eradication program should stop removal efforts as soon as the pest is believed to have been eradicated, and then continue surveillance to build up confidence that eradication has been achieved (by calculating the probability of eradication or absence; Ramsey et al. 2009; Anderson et al. 2013; Latham et al. 2021). Therefore, a successful eradication program requires effective surveillance.
Many methods may be suitable for surveillance, e.g. camera traps, detection dogs searching for live animals or their signs, or thermal imaging (infrared) and night vision technology used from the ground or an aerial platform such as a helicopter or unmanned aerial vehicle (Swann et al. 2004; Havens and Sharp 2016; Glen and Veltman 2018; Latham et al. 2021; Anderson et al. 2022; Mackenzie et al. 2022). The efficacy and suitability of available survey methods vary on the basis of the target species, habitat, geographical terrain, and the conditions under which each survey method is carried out, e.g. time of day, weather, and season (Caughley 1977; Cilulko et al. 2013; Green et al. 2013; Meek et al. 2015; Kays et al. 2019; Latham et al. 2021). Before including a survey method into the surveillance component of an eradication program, their efficacy needs to be quantified.
To determine their efficacy for use in a pest eradication program, it is necessary to estimate two quantities for each survey method (Latham et al. 2021; Anderson et al. 2022). First is the detection probability, which refers to the probability of an individual device or person/dog detecting a specific animal (or its sign) given the animal is present in the detection range at a specified time. Second is the surveillance system sensitivity (SSe), which is the probability that multiple devices or people/dog search paths will detect a specific animal (or its sign) given that it is present anywhere within the total area of interest. The SSe is derived from empirical data on the detection probability, functionally scaling it to an operational management unit on the basis of the overall surveillance effort conducted.
Here, we empirically determined the detection probabilities of detection dogs and handlers searching for faecal pellet groups of dama wallaby in three habitats: native forest, pine (Pinus radiata) forest, and pasture at the forest margin. We subsequently derived SSe and used this information along with the cost (per hour) of using detection dogs and handlers to estimate the cost per hectare required to have confidence (using a target probability of 0.95) that a wallaby population has been eradicated, or that a suspected new population is actually absent if no wallabies are detected.
Methods
Study area
We assessed the detection probabilities of detection dogs and handlers searching for faecal pellet groups of dama wallaby in forest fragments and adjacent pasture on three adjoining dairy farms located between the eastern slopes of Maungatautari Mountain and the Waikato River, Waikato Region, North Island (Fig. 1). This part of the Waikato Region is not included within the geographical range of the dama wallaby (Latham and Warburton 2021). This was a critical requirement because we needed to know how many wallaby faecal pellet groups were available to be detected by the dogs (see ‘Deployment of faecal pellet groups’). If wallabies had been present in the chosen study area, our study design would have been confounded by naturally deposited faecal pellets in addition to those we had deployed.
Location of the study area in the Waikato Region, North Island, New Zealand (black dot on the subpanel). Within the study area, we identified patches of native forest, pine forest, and pasture–forest margin, within which we deployed faecal pellet groups from dama wallaby (Notamacropus eugenii) at a density of four faecal pellet groups per hectare (white and black dots, main panel).
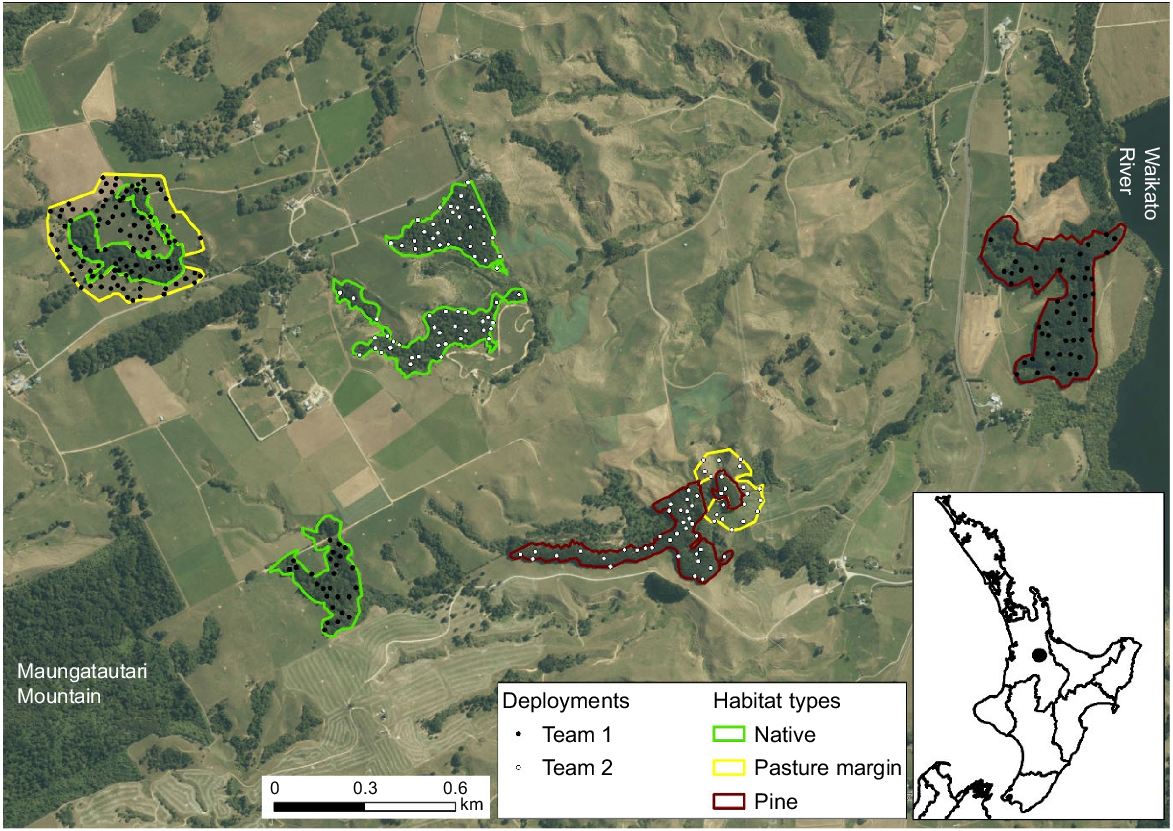
Spread across the three farms, we delineated four blocks of native forest, two of pine forest, and two of pasture adjacent to forest (either native or pine; Fig. 1). We split the polygons associated with these three habitats into two survey units of roughly equal size, i.e. each unit comprised two blocks of native forest (each ~5 ha), one block of pine forest (~10 ha), and one block of pasture margin (~10 ha). Most of the forested blocks had been fenced to prevent livestock from entering them; however, there were low numbers of red deer (Cervus elaphus) and fallow deer (Dama dama) in the area, and these were able to access forested habitats. In addition, brown hares (Lepus europaeus) and common brushtail possums (hereafter possums; Trichosurus vulpecula), and their faecal pellets, were present in all habitats. European rabbits (Oryctolagus cuniculus) were uncommon in, and immediately adjacent to, pasture. As the study sites were dairy farms, there were no naturally voided sheep pellets. Therefore, we deployed sheep pellets as an experimental control (see ‘Deployment of faecal pellet groups’ below).
Deployment of faecal pellet groups
We collected fresh wallaby faecal pellets from areas with high densities of dama wallaby in the containment area in the Bay of Plenty Region. We used rubber gloves for handling the pellets and stored the pellets in plastic bags before freezing them. To try to retain their freshness, we kept the collected, frozen wallaby pellets on ice in a chiller when they were transported between study sites.
Macropods can produce 20–90 pellet groups per day (Johnson et al. 1987). We deposited wallaby pellet groups at a density of four per hectare in all habitats. The locations for pellet group deployment were randomly generated, with locations at least 20 m apart. To try to limit human odour at the point of deployment, we used a 3-m telescopic pool cleaner with a pottle at the far end to place the pellets on the ground.
There was considerable variation in the size of individual wallaby pellets (10–20 mm in length). We deployed 10–15 pellets per group (with more pellets per group if they were smaller) to simulate the natural deposition of a dama wallaby pellet group. Although this number of pellets is at the upper end of the range for a single defaecation for macropods (eastern grey kangaroo, Macropus giganteus: mean = 5.5, range = 1–14; red-necked wallaby: mean = 3.8, range = 1–11; Johnson et al. 1987), we wanted to ensure that the level of odour emitted from the pellet groups was high, as some odour loss from the pellets could have occurred during collection, storage and handling.
In addition to the wallaby pellets, we deployed 20 mm pieces of dowel as an experimental control. We predicted that if detection dogs were following the scent trail of the human that had deployed the pellet groups rather than finding the wallaby pellets on the basis of their odour, the detection rates for pellets and dowel would be similar. We deployed one dowel per randomly chosen location at a density of one per hectare using the 3-m telescopic pool cleaner with a pottle not contaminated with odour from wallaby pellets. Finally, we also deployed pellet groups from domestic sheep at a density of one per hectare, using the methods described above. We predicted that although detection dogs may show no interest in human odour or dowels, they may be interested in faeces, irrespective of species, and, if so, detection rates for wallaby pellets and sheep pellets should be similar.
Surveys using a detection dog and handler
We assessed the detection probabilities of two detection dogs (one Belgian Malinois (team 1) and one Vizsla–German wire-haired pointer cross (team 2)) and handlers (to assess individual variability between dogs and handlers), with each pair searching for pellet groups in a different survey unit (described in ‘Study area’ above) that included the three habitats of interest. Although we attempted to select comparable survey units for both dog teams, we acknowledge that any dog team effect could be confounded by slight differences in habitat, forest understorey, and topography within the two groups of survey units. The dog handlers and detection dogs have considerable experience searching for dama wallabies, and the dogs are specifically trained to detect this species and their sign (see ‘Dog training and history of operational use’). Each survey was done over 3 days, and the dog handlers were instructed to conduct the surveys in the same way as they would under operational conditions.
A field technician from Manaaki Whenua – Landcare Research accompanied the dog handler on surveys to record data: a GPS track file of the area surveyed (determined from the path walked by the handler), and any indications made by the dogs on pellet groups or dowels. An indication by the dog on a pellet group or dowel was determined by the handler and included the dog responding to the odour and sitting or lying next to it. Any pellet groups indicated by the dog were subsequently removed to prevent the dog from repeatedly indicating the same pellet group. We also recorded weather conditions.
Dog training and history of operational use
The detection dogs and handlers used in the current field trial have been widely used by Waikato and Bay of Plenty regional councils for surveillance of dama wallaby. They have also been used by neighbouring regional councils that have received reports of possible or probable wallaby sightings in their regions, i.e. the dog–handler team searches the reported location(s) for evidence (faecal pellets) of wallabies. The dog–handler teams are experienced in searching multiple different habitats (pasture, scrub, and forest), often in rugged hill country. The primary search object for the dogs is dama wallaby faecal pellets, but the dogs will also indicate on live dama wallabies.
Many breeds of dogs are capable of being good at detecting wallaby faecal pellets. One key requirement is that a pup or young dog should show a willingness to work and respond positively to training. It is also important that they show a strong ‘prey drive’, i.e. an instinctive inclination to chase and capture ‘prey’ (in our case, dama wallaby faecal pellets).
Training is initially done using a toy that the dog is attracted to, before transitioning to the chosen search object (in our case, dama wallaby faecal pellets). A positive rewarding system is used during training and operational work. Food and toys are used to reward dogs for demonstrating the required behaviour on wallaby pellets during training. Toys are the primary means of reward for dogs that make positive detections of wallaby pellets during operational field work. The dogs do not work at the heel of the handlers, but rather search up to ~20 m from the handler.
Data analysis
We estimated the probability of a dog–handler team detecting a dama wallaby pellet group using two analytical approaches. First, we assumed that the detection probability was constant across the effective swathe width (w), i.e. the detection probability was constant up to a maximum perpendicular distance on either side of the observer. Second, we assumed that the detection probability decayed with lateral distance from the observer according to a half-normal curve.
For the first analytical method, we used a swathe (w) of 30 m (15 m either side of the observer) and used the detections (y = 1) and non-detections (y = 0) within this swathe width to fit a Bernoulli model with uninformative priors and no covariate effects. Using this approach, any pellet groups located at distances of more than w/2 from the path were discarded from the analysis. We accounted for search effort by defining surveillance system sensitivity (SSe) as a function of coverage c and constant detection probability using equations 4 and 5 from Latham et al. (2021):
where zi is distance traversed by the dog–handler team during survey i (i.e. ‘search effort’, in metres), w is the maximum width of the search swath (in metres), and (zi × w/A) measures the proportion of the total site area A (in square metres) that was effectively searched.
For the second analytical method, we calculated the distance from each deployed pellet group to the nearest dog–handler path (d, in metres), and used the detections (y = 1) and non-detections (y = 0) to estimate parameters for the following function:
where g0 is the probability of detecting a pellet group located on the path that the dog–handler team walked and σ is a spatial decay parameter describing how detection probability decays with lateral distance from the path. Parameters g0 and σ were estimated for all habitats combined, as well as for each habitat category or dog–handler team identity separately. The overall g0 and σ were used to estimate the ‘effective sweep width’ (R, in metres; Robe and Frost 2002; Latham et al. 2021) using the equation from Glen et al. (2018):
R is a measure of detectability describing a region on either side of an observer that is effectively searched as the observer (in this case, a dog and handler) moves along a transect in a single pass, allowing us to treat a survey as if it were a complete census of the effective search swathe. We then re-estimated SSe using the relationship ci = (zi/A) × R and Eqn 1 above. Finally, we calculated the integral of the half-normal detection function out to a distance of 15 m, to provide an estimate that is directly comparable to the constant detection probability within a 30 m swathe.
For each analytical method, models were fitted in a Bayesian framework using Markov Chain Monte Carlo (MCMC) simulation with uninformative priors to obtain posterior mean parameter estimates and 95% credible intervals. Models were fitted using JAGS software with three chains and run for 100,000 iterations (then thinned by an interval of 10 iterations) after a burn-in period of 10,000 iterations.
The method described above does not survey for the pest per se, but rather searches for their faecal pellets. In this instance, the detection probability is not affected as the pellet groups replace the live animals as the search object (Glen and Veltman 2018). Similarly, the surveillance system sensitivity can be estimated for a target area using the data we collected. However, because a wallaby defaecates multiple times per day, a detection dog is not actually searching for a single pellet group, but any one (or more) of multiple pellet groups deposited by the target individual per day, each of which can remain detectable for multiple days. Therefore, the SSe based on a single faecal pellet group will be highly conservative.
To account for multiple defaecations deposited by a single individual, we simulated the location of a single wallaby’s home range within a hypothetical 100-hectare area surveyed by a 1-km transect by dog and handler. To this area, we overlaid a square grid of 50 m × 50 m resolution and applied Eqns 1 and 2 (equations 4 and 5 from Latham et al. 2021) to each cell to derive the sensitivity of detecting a single pellet group in cell j given the coverage of that cell (2500 m2) by the dog and handler path (Sej). We then placed a wallaby’s home-range centre in cell k and distributed the total number of pellets groups available to be detected (40 pellet groups, see below) across all grid cells according to probabilities defined by a half-normal function of the distance of each cell to the wallaby’s home-range centre and parameter σHR, which is the spatial decay parameter (in metres) for a wallaby’s home-range kernel. The cell-level sensitivity (SeUj,k) for cell j, when the wallaby has its home-range centre in cell k and deposited pj,k pellet groups in cell j, is given by:
And the system-level sensitivity across all cells in the grid when the wallaby has its home-range centre in cell k, is given by:
The overall system sensitivity for the dog and handler (SSeDog) searching for multiple pellet groups deposited by a single wallaby was calculated as the mean of SSeUk across all possible cells k.
For ease of comparison with other studies we report all SSe standardised to a 1-km search transect within a 100-hectare survey area (see Latham et al. 2021 for a comparable methodology for Bennett’s wallaby). We report SSe based on a single pellet group and 20 voided pellet groups per wallaby per day detectable over 2 days, but stress that for operational purposes, the latter is the more appropriate value. In our calculations, we assumed an average σHR = 108 m (equivalent to a 22-ha home range; Latham and Warburton 2021); however, because dama wallaby home-range size can range widely (between 10 ha and 39 ha; Latham and Warburton 2021), we also present alternative SSe estimates for a range of potential σHR values. Likewise, because the range of reported macropod defaecation rates is wide (20–90 pellet groups per day; Johnson et al. 1987), we present alternative SSe estimates for a range of potential detectable pellet groups.
Finally, we calculated the cost per unit of surveillance sensitivity for declaring wallabies locally eliminated from a particular site with a probability of 0.95 following the methods described in Latham et al. (2021). For these calculations we assumed a cost of NZ$65 per hour for the handler and dog (this hourly rate is based on the cost of using detection dogs and handlers in the current study; it excludes mileage), and that they could survey 3 km per hour. All other parameters followed the values reported in table 5 in Latham et al. (2021): a cost of NZ$50 per hour for the ground hunter with dogs surveying 4 km per hour and a swathe of 200 m; a cost of NZ$1800 per hour for the helicopter observers surveying 60 km per hour and a swathe of 300 m; and a cost of NZ$1800 per hour for the thermal imaging camera mounted on a helicopter surveying 60 km per hour and a swathe of 100 m. Surveillance costs from Latham et al. (2021) were corrected for inflation since 2018, when the study was conducted.
Results
We deployed 198 wallaby faecal pellet groups, 55 dowels, and 46 sheep faecal pellet groups. There were 103 detections, all of which were of dama wallaby pellet groups, i.e. neither of the dogs indicated on dowels or sheep pellets.
Assuming a constant probability of detection within a 30-m swathe, we found that the parameter estimate was 0.640 (95% CI = 0.561–0.714; Table 1). Assuming a lateral decay, we found that the probability of detection was 0.824 (95% CI = 0.732–0.901) at the centre of the path and decayed with lateral distance from the observer out to a distance of ~30 m (Fig. 2). The estimate for the equivalent detection probability derived from integrating the half-normal function between 0 and 15 m was 0.453 (95% CI = 0.377–0.580).
| Estimation method | Median | 95% Credible Interval | Median | 95% Credible Interval | R | Standardised SSe | |
|---|---|---|---|---|---|---|---|
| 1. Constant detection probability within the swathe | |||||||
| P(detection|presence) | |||||||
| (a) Swathe = 30 m | 0.640 | 0.561–0.714 | – | 0.019 | |||
| 2. Decreasing detection probability with increasing distance from path | |||||||
| g0 | σ | ||||||
| (a) Intercept-only | 0.824 | 0.732–0.901 | 6.754 | 5.467–8.720 | 13.954 | 0.014 | |
| (b) By habitat: | |||||||
| Native forest | 0.863 | 0.669–0.982 | 5.327 | 3.744–9.316 | 11.517 | 0.011 | |
| Pine forest | 0.892 | 0.713–0.999 | 6.441 | 4.898–9.185 | 14.409 | 0.014 | |
| Pasture margin | 0.796 | 0.648–0.912 | 8.860 | 5.654–18.274 | 17.675 | 0.018 | |
| (c) By dog–handler team: | |||||||
| Team 1 | 0.873 | 0.764–0.948 | 6.033 | 4.722–8.079 | 13.197 | 0.013 | |
| Team 2 | 0.728 | 0.546–0.887 | 9.179 | 5.875–27.900 | 16.752 | 0.017 | |
R, effective sweep width (see text for a more detailed description of this parameter).
Note: The detection probability was estimated using two different analytical methods: (1) assuming a constant probability of detection over the entire swathe, and (2) assuming that detection probability decays with lateral distance from the observer according to a half-normal curve.
Estimated relationship between distance from the search path and the probability of detecting a dama wallaby (Notamacropus eugenii) faecal pellet group using detection dogs and handlers in Waikato Region, New Zealand. The left panel shows a half-normal detection function fitted to the detection data but discriminated by the habitat type in which the pellet group was deployed. The right panel shows a half-normal detection function fitted to the same data but discriminated by dog–handler team. Note: shaded areas are 95% credible intervals for the predictions.
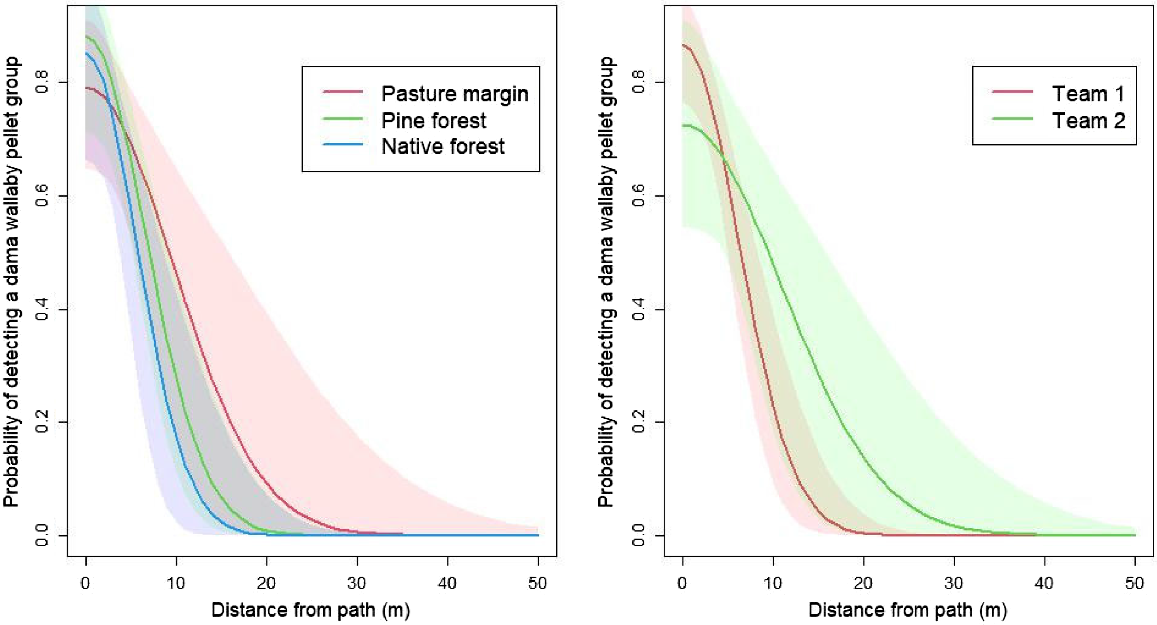
The probability of detecting a pellet group close to the path was slightly higher in both of the forested habitats than in the pasture margin, but the detection range was wider in the pasture margin (Fig. 2, left panel). The credible intervals for the difference in g0 and σ between habitat types spanned zero, suggesting there were no statistically significant differences in the detection functions between habitats. Similarly, the probability of detection close to the path was higher for team 1 than for team 2, but the detection range was wider for team 2 (Fig. 2, right panel). However, the credible intervals for the difference in g0 and σ between the two teams spanned zero, suggesting there were no statistically significant differences in the detection functions between them.
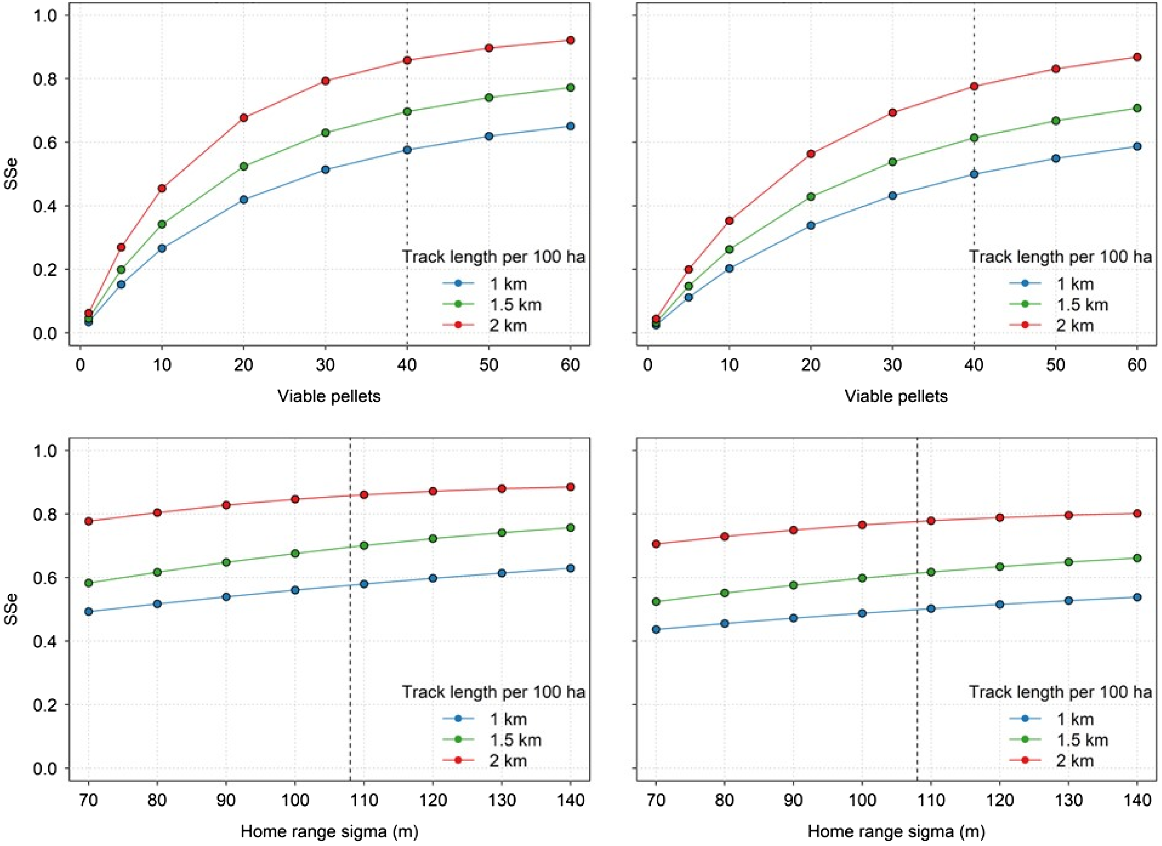
Simulations to incorporate multiple pellet groups around a wallaby home range yielded a standardised SSe of 0.582 for the 30 m swathe (assuming a constant probability of detection of 0.640), or an SSe of 0.466 using the equivalent detection probability (0.453) derived from the half-normal function. These estimates were consistent regardless of the home range parameter (σHR) used but varied widely depending on the number of viable pellet groups available to be detected (Fig. 3).
Sensitivity analysis showing the influence of the number of viable pellet groups and the home range parameter (σHR) on the surveillance system sensitivity (SSe) for a 1-, 1.5-, and 2-km transect surveyed by a dog and handler in a 100-ha survey area. Surveillance system sensitivity is shown for different values of viable pellets (top panels) and σHR (bottom panels), and for a constant detection probability over a swathe of 30 m (left panels) and the equivalent detection probability derived from a half-normal function (right panels). The vertical dashed line shows the values that were assumed for the costs presented in Table 2. As the number of viable pellets increases, the sensitivity of the survey method increases rapidly, as there are a larger number of objects to be searched. Conversely, the SSe is moderately constant across increasing values of σHR because even though the objects to be searched are distributed more widely, there is a constant number of viable pellets available to be detected.
Assuming a constant probability of detection and a prior probability of wallaby absence of 0.5, we estimated that the surveillance cost to achieve a 95% probability of dama wallaby eradication using detection dogs searching for a single pellet group in a 100-hectare area would be NZ$2492 (i.e. NZ$24.92 per ha). Using the equivalent probability of detection estimated from the half-normal function, this cost increased to NZ$3525 (i.e. NZ$35.25 per ha; Table 2). If the presence of multiple pellet groups voided by a single wallaby in the surveyed area is considered, the costs of surveillance to achieve the same level of confidence in dama wallaby eradication are reduced to NZ$0.54 per ha (assuming a constant probability of detection over a 30-m swathe) or NZ$0.72 per ha (using the equivalent probability of detection estimated from the half-normal function). The large reduction in cost between surveillance for single vs multiple pellets groups results from the substantial reduction in the length of transect required to be searched (Table 2). We note, however, that these estimated costs are only indicative as they are exclusive of any overhead or set-up costs.
| Detection method | Length of transect required (km) | Surveillance cost per 100 ha (NZ$) | Surveillance cost per ha (NZ$) | Wallaby species | Source | |
|---|---|---|---|---|---|---|
| Faecal pellet detection dogs – single pellet group from a single wallaby | ||||||
| (a) Constant detection, 30 m swathe | 153 | 2492 | 24.92 | Dama | This study | |
| (b) Half-normal equivalent detection, 30 m swathe | 217 | 3525 | 35.25 | Dama | This study | |
| Faecal pellet detection dogs – multiple pellet groups from a single wallaby | ||||||
| (a) Constant detection, 30 m swathe | 2.5 | 54.2 | 0.54 | Dama | This study | |
| (b) Half-normal equivalent detection, 30 m swathe | 3.3 | 71.5 | 0.72 | Dama | This study | |
| Ground hunter with dogs | ||||||
| (a) Swathe = 100 m | 40 | 576 | 5.76 | Bennett’s | Derived from table 5, Latham et al. (2021) | |
| (b) Swathe = 200 m | 25 | 367 | 3.67 | Bennett’s | table 5, Latham et al. (2021) | |
| Helicopter observers | 68 | 2464 | 24.64 | Bennett’s | table 5, Latham et al. (2021) | |
| Thermal imaging camera | 140 | 4927 | 49.27 | Bennett’s | table 5, Latham et al. (2021) | |
| Camera traps | NA | 938 | 9.38 | Bennett’s | table 5, Latham et al. (2021) | |
Surveillance costs from Latham et al. (2021) have been corrected for inflation since 2018, when the study was conducted.
Note: The estimated cost for the thermal imaging camera should be considered preliminary. It is based on a detection probability that used the camera in a fixed position in a helicopter – an approach not considered optimal by thermal operators. A subsequent assessment must determine if detection probabilities are higher when operators manoeuvre the camera to perceived best habitats for wallabies.
Discussion
Information on detection probabilities for different survey methods in relevant habitats is essential for confirming the absence of a pest or for an eradication program. These data enable managers to determine how much surveillance is needed to be sure eradication (or absence) has been achieved, using, for example, a probability (confidence level) of 0.95 or 0.99 (Ramsey et al. 2009; Anderson et al. 2013). If the estimated detection probability is low, more surveillance effort is needed to be 95% (or 99%) sure that eradication has been achieved than if the estimated detection probability is high.
However, the required surveillance effort is also affected by the effective swathe width (Glen and Veltman 2018). For example, a survey method with a moderate detection probability but wide effective swathe width may require less surveillance effort to confirm eradication, compared to a survey method with a higher detection probability but narrower effective swathe width (see Table 2 and fig. S4 in Latham et al. 2021). This relationship is important because it affects the amount of surveillance effort needed and, therefore, the per unit area costs of surveillance.
We assessed the detection probabilities for two detection dogs and their handlers searching for pellet groups, a survey method commonly used for dama wallaby surveillance in New Zealand. We found that the detection probability of dogs searching for a single faecal pellet group was relatively high (at least 45%, but up to 64%). Similar research that assessed the detection probability of detection dogs searching for live Bennett’s wallabies in the South Island also found that dogs had a high efficacy for surveillance (detection probability from a swathe width of 350 m = 0.54; 95% CI = 0.41–0.67; Table 2, Latham et al. 2021).
Importantly, the slightly higher detection probability (0.64) that we report for dogs searching for dama wallaby faecal pellets (compared to dogs searching for live Bennett’s wallabies) is an artefact of the different total swathe width used for calculations (30 m vs 350 m, respectively). If, for example, we use a total swathe width of 100 m (instead of 350 m) for dogs searching for Bennett’s wallaby, the detection probability increases from 0.54 to ~0.75 (fig. S4 in Latham et al. 2021). This result suggests that live wallabies probably emit more odour than faecal pellets. Moreover, live wallabies will also produce movement and sound as they move away from approaching dogs and surveyors. These factors will contribute to the higher detection probability for live wallabies. Furthermore, because the wallaby faecal pellets in our study were deployed by people, they lacked the scent trails from wallabies that would ordinarily be associated with naturally voided pellet groups. If the detection dogs had the additional cue of wallaby scent trails to help them find the pellets, we predict the detection probability would have been higher than reported here. Therefore, our estimated detection probability for dama faecal pellets should be considered conservative.
The probability of detection of dama wallaby pellets groups can be affected by many factors, such as weather, habitat, topography, characteristics of the search object, and the ability of the dog and/or handler (Smith et al. 2005; Clare et al. 2015; Glen and Veltman 2018). We found that the detection functions did not differ significantly among habitats or between different detection dogs and handlers that searched different areas. This result held even with a moderate shower of rain (~8 mm) the evening before the second dog and handler conducted their search. This suggests that the odour of the deployed pellets is resilient to light rainfall. Neither of the dogs indicated on dowels or sheep pellets. This strongly suggests that both dogs were searching for the object on which they were trained (i.e. live dama wallabies and their pellets) rather than cueing in on human odour or showing interest in the faeces of other animal species. Not only were sheep pellets ignored, but naturally deposited pellets of red deer, fallow deer, rabbits, brown hares, and possums were also ignored, i.e. the dogs did not noticeably indicate them. Despite consistent results between dog–handler teams, the low sample of teams assessed is a limitation of our study design. This limitation primarily stems from the lack of trained dog–handler teams available for this type of work (which to our knowledge was three teams total from two different providers at the time the study was conducted).
Experimental studies using detection dogs to search for different species of wildlife have reported variable estimates of detection distance (Glen and Veltman 2018). For example, dogs were able to detect faecal pellets of brocket deer (Mazama spp.) from no further than 7.2 m (Oliveira et al. 2012), whereas they could detect desert tortoises (Gopherus agassizii) from as far as 62.8 m (Cablk et al. 2008). Detection distances can be influenced by wind, humidity, ground cover, and the species being searched for (Glen and Veltman 2018). Because the dogs that we assessed were not at the heel of the handlers, we do not know the detection distance per se. However, Fig. 2 suggests that detection distances in the current study were more comparable to those for brocket deer than desert tortoises (Cablk et al. 2008; Oliveira et al. 2012). Again, this suggests that live animals emit more odour than do faecal pellets.
Probabilities of detection used for confirming absence, or that eradication has been achieved, are ordinarily derived from areas where the target species occurs at low population densities. This is because the behaviour and ecology of the pest can differ with density (e.g. the home ranges of possums are generally larger at low population densities; Efford et al. 2016), thereby potentially biasing the probability of detection (Anderson et al. 2022). For example, the detection parameter σ, which scales the probability of detection to home-range size, is larger for large home-range sizes, which in turn would result in a comparatively low probability of detection (Anderson et al. 2022). If a probability of detection was estimated using a high-density population with small home-range sizes, the probability of detection may be unrealistically high when applied to a low-density population. From an operational perspective, this would mean that managers would risk putting insufficient surveillance effort into confirming eradication, because the probability of detection used for estimating the required surveillance effort was not biologically realistic for the target pest population.
A limitation of our study is that we do not know if our simulation of a wallaby population using human-deployed faecal pellet groups reflected a low density of wallabies, which would be appropriate for assessing detection probabilities (Latham et al. 2021; Anderson et al. 2022). In particular, we do not know if a density of four pellet groups per hectare emulates naturally deposited pellet groups in a very low-density population. Nevertheless, a power analysis suggested this density was needed to detect meaningful differences in detection probabilities between habitats and detection dogs and handlers with reasonable statistical power (≥0.8), should such differences exist. Therefore, our study represents a possible trade-off between having an appropriately low density of the pest and achieving sufficient statistical power to detect meaningful differences in the parameters of interest.
By scaling the instantaneous probability of detection for each pellet group to the multiple pellet groups voided by a single wallaby around its home range, the standardised SSe increased substantially, from 0.019 to 0.582 (constant detection probability) or from 0.014 to 0.466 (equivalent detection probability derived from half-normal function). This represents a 30–33-fold increase in surveillance system sensitivity compared to the sensitivity of searching for a single faecal pellet group, which translated to significant reductions in the distance required to be searched and in the cost of this surveillance method to confidently confirm dama wallaby eradication.
Although we are uncertain about the exact number of pellets groups that will be available to be detected in a particular situation, our simulations assumed the lower range of potential defaecations deposited by macropods (Johnson et al. 1987), which we deem has produced conservative estimates. It is also possible that the underlying model that we used to distribute the simulated pellet groups around a home-range centre does not reflect biological defaecations made by dama wallaby. If, for example, wallabies use latrines rather than defaecating randomly within the environment, the reported increase in SSe would be less pronounced as the pellet groups would be aggregated in a few latrine sites. Given faecal pellet depositions have previously been used to assess habitat use (not selection for latrine sites) for Notamacropus species (Wiggins and Bowman 2011), we do not believe that this will have influenced our results.
The estimated costs (using a target 95% confidence in wallaby eradication) of using detection dogs searching for dama wallaby faecal pellets are comparable to detection dogs searching for live Bennett’s wallabies, but substantially less than for other mobile survey methods for which costs have been preliminarily estimated (i.e. over NZ$20.00 per ha for helicopter observers and a thermal imaging camera operated from a helicopter; Latham et al. 2021, Table 2). The estimated cost (NZ$9.38 per ha; Table 2) of using camera traps for surveillance of Bennett’s wallaby was also higher than for dogs detecting pellet groups, even without accounting for additional costs such as the purchase of trail cameras and processing the images.
Using a target 99% probability of eradication for dogs searching for multiple available pellet groups almost doubles the cost of surveillance per unit area (NZ$1.39 per ha). Given the relative cost-effectiveness of detection dogs relative to other surveillance methods, the per unit area cost of surveillance would be even higher for other mobile surveillance methods if a target value of 99% was used. The high costs of achieving a 99% confidence in eradication are often unaffordable, and therefore there is a trade-off between the costs of control to achieve eradication and the expenditure for validating eradication (Gormley et al. 2016).
In summary, detection dogs and handlers have high efficacy for surveillance of wallaby faecal pellet groups. Although the effective swathe width of dogs searching for a faecal pellet group was narrower than that of dogs searching for live wallabies, once corrected to account for defaecation rates, SSe was very high and per unit area costs were low. Therefore, the method has high efficacy for confirming eradication, or that a suspected new population is actually absent if undetected. Usually, dog handlers do not carry firearms when they conduct surveys. This means that if a fresh wallaby sign or a live wallaby is detected during a pellet survey, no attempt can be made to eliminate it from the area. Instead, professional hunters must be mobilised and sent to the location of the sign or wallaby and attempt to locate and kill the wallaby (or wallabies). Despite having high efficacy, detection dogs and handlers will be unlikely to be able to survey all of the areas affected or potentially affected by invading wallabies, simply because the area comprises many tens of thousands of hectares and there are too few detection dogs and handlers trained to do the work. In these instances, we recommend strategically using detection dogs in concert with larger-scale surveillance methods, such as helicopters or unmanned aerial vehicles using thermal imaging and night vision technology.
Data availability
Data can be found in: Latham ADM, Latham MC, Peace J, Gormley AM (2024) Dama wallaby faecal pellet data from North Island, New Zealand [Dataset]. Manaaki Whenua Landcare Research – Datastore. https://doi.org/10.7931/hzf0-8363.
Declaration of funding
Funding for this project was provided by the Tipu Mātoro National Wallaby Eradication Programme under Ministry for Primary Industries (MPI) Contract 23170, Waikato Regional Council (WRC), and Manaaki Whenua – Landcare Research (MWLR) Strategic Science Investment Funding.
Acknowledgements
We thank landowners/managers Geoff Scott, Sam Le Cren and Simon Clarke for allowing us to conduct this study on their properties. We thank Guus Knopers and the team at K9 Detection Services/Wildlife Contractors Ltd for providing detection dogs and handlers and for conducting the surveys. We thank Travis Ashcroft (MPI), Dave Byers and Alastair Fairweather (WRC), and the Scott family (Puketawa) for project advice and logistical support. Finally, we thank Travis Ashcroft (MPI), Rachelle Binny (MWLR), Simon Howard (MWLR), Chris Jones (MWLR), Ray Prebble (MWLR), Bruce Warburton (MWLR), two anonymous reviewers, and the Tipu Mātoro National Wallaby Eradication Programme research advisory group for their input into an earlier version of this manuscript.
References
Anderson DP, Ramsey DSL, Nugent G, Bosson M, Livingstone P, Martin PAJ, Sergeant E, Gormley AM, Warburton B (2013) A novel approach to assess the probability of disease eradication from a wild-animal reservoir host. Epidemiology and Infection 141, 1509-1521.
| Crossref | Google Scholar | PubMed |
Anderson DP, Pepper MA, Travers S, Michaels TA, Sullivan K, Ramsey DSL (2022) Confirming the broadscale eradication success of nutria (Myocastor coypus) from the Delmarva Peninsula, USA. Biological Invasions 24, 3509-3521.
| Crossref | Google Scholar |
Cablk ME, Sagebiel JC, Heaton JS, Valentin C (2008) Olfaction-based detection distance: a quantitative analysis of how far away dogs recognize tortoise odor and follow it to source. Sensors 8, 2208-2222.
| Crossref | Google Scholar | PubMed |
Caughley G (1977) Sampling in aerial survey. The Journal of Wildlife Management 41, 605-615.
| Crossref | Google Scholar |
Cilulko J, Janiszewski P, Bogdaszewski M, Szczygielska E (2013) Infrared thermal imaging in studies of wild animals. European Journal of Wildlife Research 59, 17-23.
| Crossref | Google Scholar |
Clare JDJ, Anderson EM, Macfarland DM, Sloss BL (2015) Comparing the costs and detectability of bobcat using scat-detecting dog and remote camera surveys in central Wisconsin. Wildlife Society Bulletin 39, 210-217.
| Crossref | Google Scholar |
Dolman PM, Wäber K (2008) Ecosystem and competition impacts of introduced deer. Wildlife Research 35, 202-214.
| Crossref | Google Scholar |
Donlan CJ, Tershy BR, Campbell K, Cruz F (2003) Research for requiems: the need for more collaborative action in eradication of invasive species. Conservation Biology 17, 1850-1851.
| Crossref | Google Scholar |
Efford MG, Dawson DK, Jhala YV, Qureshi Q (2016) Density-dependent home-range size revealed by spatially explicit capture–recapture. Ecography 39, 676-688.
| Crossref | Google Scholar |
English HM, Caravaggi A (2020) Where’s wallaby? Using public records and media reports to describe the status of red-necked wallabies in Britain. Ecology and Evolution 10, 12949-12959.
| Crossref | Google Scholar | PubMed |
Glen AS, Veltman CJ (2018) Search strategies for conservation detection dogs. Wildlife Biology 2018, 1-9.
| Crossref | Google Scholar |
Glen AS, Russell JC, Veltman CJ, Fewster RM (2018) I smell a rat! Estimating effective sweep width for searches using wildlife-detector dogs. Wildlife Research 45, 500-504.
| Crossref | Google Scholar |
Gormley AM, Holland EP, Barron MC, Anderson DP, Nugent G (2016) A modelling framework for predicting the optimal balance between control and surveillance effort in the local eradication of tuberculosis in New Zealand wildlife. Preventive Veterinary Medicine 125, 10-18.
| Crossref | Google Scholar | PubMed |
Green SJ, Tamburello N, Miller SE, Akins JL, Côté IM (2013) Habitat complexity and fish size affect the detection of Indo-Pacific lionfish on invaded coral reefs. Coral Reefs 32, 413-421.
| Crossref | Google Scholar |
Havlin P, Caravaggi A, Montgomery WI (2018) The distribution and trophic ecology of an introduced, insular population of red-necked wallabies (Notamacropus rufogriseus). Canadian Journal of Zoology 96, 357-365.
| Crossref | Google Scholar |
Johnson CN, Jarman PJ, Southwell CJ (1987) Macropod studies at Wallaby Creek. 5. Patterns of defecation by eastern gray kangaroos and red-necked wallabies. Australian Wildlife Research 14, 133-138.
| Crossref | Google Scholar |
Jones HP, Holmes ND, Butchart SHM, Tershy BR, Kappes PJ, Corkery I, Aguirre-Muñoz A, Armstrong DP, Bonnaud E, Burbidge AA, Campbell K, Courchamp F, Cowan PE, Cuthbert RJ, Ebbert S, Genovesi P, Howald GR, Keitt BS, Kress SW, Miskelly CM, Oppel S, Poncet S, Rauzon MJ, Rocamora G, Russell JC, Samaniego-Herrera A, Seddon PJ, Spatz DR, Towns DR, Croll DA (2016) Invasive mammal eradication on islands results in substantial conservation gains. Proceedings of the National Academy of Sciences of the United States of America 113, 4033-4038.
| Crossref | Google Scholar |
Kays R, Sheppard J, Mclean K, Welch C, Paunescu C, Wang V, Kravit G, Crofoot M (2019) Hot monkey, cold reality: surveying rainforest canopy mammals using drone-mounted thermal infrared sensors. International Journal of Remote Sensing 40, 407-419.
| Crossref | Google Scholar |
Latham ADM, Latham MC, Warburton B (2019) Current and predicted future distributions of wallabies in mainland New Zealand. New Zealand Journal of Zoology 46, 31-47.
| Crossref | Google Scholar |
Latham ADM, Latham MC, Norbury GL, Forsyth DM, Warburton B (2020) A review of the damage caused by invasive wild mammalian herbivores to primary production in New Zealand. New Zealand Journal of Zoology 47, 20-52.
| Crossref | Google Scholar |
Latham ADM, Warburton B, Latham MC, Anderson DP, Howard SW, Binny RN (2021) Detection probabilities and surveillance sensitivities for managing an invasive mammalian herbivore. Ecosphere 12, e03772.
| Crossref | Google Scholar |
Lazell JD, Jr, Sutterfield RW, Giezentanner WD (1984) The population of rock wallabies (genus Petrogale) on Oahu, Hawaii. Biological Conservation 30, 99-108.
| Crossref | Google Scholar |
Macdonald N, Nugent G, Edge K-A, Parkes JP (2019) Eradication of red deer from Secretary Island, New Zealand: changing tactics to achieve success. In ‘Island invasives: scaling up to meet the challenge’. Occasional Paper SSC no. 62. (Eds CR Veitch, MN Clout, AR Martin, JC Russell, CJ West) pp. 256–260. (IUCN: Gland, Switzerland)
Mackenzie HR, Latham MC, Anderson DP, Hartley S, Norbury GL, Latham ADM (2022) Detection parameters for managing invasive rats in urban environments. Scientific Reports 12, 16520.
| Crossref | Google Scholar | PubMed |
Meek PD, Ballard G-A, Fleming PJS (2015) The pitfalls of wildlife camera trapping as a survey tool in Australia. Australian Mammalogy 37, 13-22.
| Crossref | Google Scholar |
Murphy EC, Russell JC, Broome KG, Ryan GJ, Dowding JE (2019) Conserving New Zealand’s native fauna: a review of tools being developed for the Predator Free 2050 programme. Journal of Ornithology 160, 883-892.
| Crossref | Google Scholar |
Nugent G, Gormley AM, Anderson DP, Crews K (2018) Roll-back eradication of bovine tuberculosis (TB) from wildlife in New Zealand: concepts, evolving approaches, and progress. Frontiers in Veterinary Science 5, 277.
| Crossref | Google Scholar | PubMed |
Oliveira MLd, Norris D, Ramírez JFM, Peres PHdF, Galetti M, Duarte JMB (2012) Dogs can detect scat samples more efficiently than humans: an experiment in a continuous Atlantic Forest remnant. Zoologia (Curitiba) 29, 183-186.
| Crossref | Google Scholar |
Parkes J, Murphy E (2003) Management of introduced mammals in New Zealand. New Zealand Journal of Zoology 30, 335-359.
| Crossref | Google Scholar |
Putman RJ, Moore NP (1998) Impact of deer in lowland Britain on agriculture, forestry and conservation habitats. Mammal Review 28, 141-164.
| Crossref | Google Scholar |
Ramsey DSL, Parkes J, Morrison SA (2009) Quantifying eradication success: the removal of feral pigs from Santa Cruz Island, California. Conservation Biology 23, 449-459.
| Crossref | Google Scholar | PubMed |
Relva MA, Nuñez MA, Simberloff D (2010) Introduced deer reduce native plant cover and facilitate invasion of non-native tree species: evidence for invasional meltdown. Biological Invasions 12, 303-311.
| Crossref | Google Scholar |
Robertson PA, Adriaens T, Lambin X, Mill A, Roy S, Shuttleworth CM, Sutton-Croft M (2017) The large-scale removal of mammalian invasive alien species in Northern Europe. Pest Management Science 73, 273-279.
| Crossref | Google Scholar | PubMed |
Russell JC, Innes JG, Brown PH, Byrom AE (2015) Predator-free New Zealand: conservation country. BioScience 65, 520-525.
| Crossref | Google Scholar | PubMed |
Smith DA, Ralls K, Cypher BL, Maldonado JE (2005) Assessment of scat-detection dog surveys to determine kit fox distribution. Wildlife Society Bulletin 33, 897-904.
| Crossref | Google Scholar |
Swann DE, Hass CC, Dalton DC, Wolf SA (2004) Infrared-triggered cameras for detecting wildlife: an evaluation and review. Wildlife Society Bulletin 32, 357-365.
| Crossref | Google Scholar |
Tobin PC, Kean JM, Suckling DM, McCullough DG, Herms DA, Stringer LD (2014) Determinants of successful arthropod eradication programs. Biological Invasions 16, 401-414.
| Crossref | Google Scholar |
Towns DR, Broome KG (2003) From small Maria to massive Campbell: forty years of rat eradications from New Zealand islands. New Zealand Journal of Zoology 30, 377-398.
| Crossref | Google Scholar |
Warburton B (1986) Wallabies in New Zealand: history, current status, research, and management needs. Forest Research Institute Bulletin 114, 1-29.
| Google Scholar |
Wiggins NL, Bowman DMJS (2011) Macropod habitat use and response to management interventions in an agricultural–forest mosaic in north-eastern Tasmania as inferred by scat surveys. Wildlife Research 38, 103-113.
| Crossref | Google Scholar |
Wodzicki K, Flux JEC (1967) Guide to introduced wallabies in New Zealand. Tuatara 15, 47-59.
| Google Scholar |