

Genetic analysis reveals spatial structure in an expanding introduced rusa deer population
Scarlett Li-Williams A # , Katarina C. Stuart A # , Sebastien Comte B , David M. Forsyth B , Michelle Dawson C D , William B. Sherwin A and Lee A. Rollins A *
A Evolution & Ecology Research Centre, School of Biological, Earth and Environmental Sciences, The University of New South Wales, Sydney, NSW 2052, Australia.
B Vertebrate Pest Research Unit, NSW Department of Primary Industries, 1447 Forest Road, Orange, NSW 2800, Australia.
C South-East Local Land Services, 84 Crown Street, Wollongong East, NSW 2520, Australia.
D Cultural and Ecosystem Adaptation Team, NSW Office of Energy and Climate Change, 12 Darcy Street, Parramatta, NSW 2124, Australia.
Handling Editor: Graham Nugent
Wildlife Research 50(9) 757-769 https://doi.org/10.1071/WR22128
Submitted: 14 July 2022 Accepted: 11 June 2023 Published: 10 July 2023
© 2023 The Author(s) (or their employer(s)). Published by CSIRO Publishing. This is an open access article distributed under the Creative Commons Attribution-NonCommercial-NoDerivatives 4.0 International License (CC BY-NC-ND)
Abstract
Context: Rusa deer (Cervus timorensis), originally introduced in the 1860s, are still spreading in eastern Australia. The expanding peri-urban rusa deer population in the Illawarra region of New South Wales, Australia is having undesirable impacts on human and ecological communities, but the spatial structure of this population has not been investigated. Genetic information on invasive species is potentially useful in identifying management units to mitigate undesirable impacts.
Aims: The aim of this study was to investigate population structure, characterise dispersal, and determine if natural and human-made landscape features affected gene flow in rusa deer invading the Illawarra region of New South Wales.
Methods: We used reduced representation sequencing (DArT-Seq) to analyse single nucleotide polymorphisms distributed throughout the genomic DNA of rusa deer culled during a management program. We used admixture and Principal Component Analyses to investigate population structure with respect to natural and human-made landscape features, and we investigated whether our genetic data supported the presence of sex-biased dispersal.
Key results: Genetic diversity was highest in the north, near the original introduction site. A railway line demarcated restricted gene flow. Surprisingly, the Illawarra escarpment, a prominent landscape feature, did not restrict gene flow. There was no evidence of sex-biased dispersal and seven individuals were identified as genetic outliers.
Conclusions: The genetic structure of the Illawarra rusa deer population is consistent with individuals spreading south from their introduction site in Royal National Park. The population is not panmictic, and a landscape feature associated with urbanisation was associated with increased spatial genetic structure. Outliers could indicate hybridisation or secondary incursion events.
Implications: Rusa deer can be expected to continue invading southwards in the Illawarra region, but landscape features associated with urbanisation might reduce dispersal across the landscape. The genetic structuring of the population identified three potential management units on which to prioritise ground shooting operations.
Keywords: geographical range, invasive species, molecular ecology, population biology, population management, rusa deer, spatial structure, wildlife management.
Introduction
Deer (family Cervidae) have been widely introduced in Australia, and six species currently have self-sustaining wild populations (Forsyth et al. 2004; Moriarty 2004a). These species are red deer (Cervus elaphus), sambar deer (Cervus unicolor), rusa deer (Cervus/Rusa timorensis), chital deer (Axis axis), hog deer (Axis porcinus) and fallow deer (Dama dama). The distribution and abundance of invasive deer in Australia are increasing (Moriarty 2004a; Davis et al. 2016; Crittle and Millynn 2020; Cunningham et al. 2022). Most of these species occur in south-eastern Australia, where they have a wide range of undesirable economic, social and environmental impacts (Davis et al. 2016; Forsyth et al. 2017; Cripps et al. 2019; see other articles in this issue).
There is particular concern arising from non-native deer colonising peri-urban areas in eastern Australia (Burgin et al. 2015; Soulsbury and White 2015). The major impacts of peri-urban deer in Australia are road and rail collisions, damage to gardens, fences and ecological restoration projects, and stress to residents and authorities caused by illegal hunting (Burgin et al. 2015; Soulsbury and White 2015; Dawson 2017). The main method used to manage peri-urban deer populations is professional ground-based shooting (Dawson 2017; Bengsen et al. 2020; Hampton et al. 2022). Peri-urban environments are composed of a mosaic of land-use types, typically including residential, industrial, farming and reserves (Stout et al. 1997; Ciach and Fröhlich 2019). This results in spatially patchy opportunities for ground-based shooting operations (Stout et al. 1997; Bengsen et al. 2020). Options for monitoring changes in the distribution and abundance of deer in peri-urban areas are also limited. For example, the risks of vandalism and theft preclude the use of motion-sensitive cameras (Anton et al. 2018; Meek et al. 2019; Forsyth et al. 2022). Visual surveys using spotlight or thermal vision equipment are more suitable and accurate for open areas (Gill et al. 1997; Hodnett 2005; Pinkston 2009), which are scarce in peri-urban landscapes. Most monitoring programs rely on indirect indices of abundance such as faecal pellet counts or community reporting of deer sightings, but these are of limited use for understanding how deer move in the landscape (Amos et al. 2014; Forsyth et al. 2022); thus, little is known about peri-urban deer population dynamics in Australia.
Rusa deer, native to Indonesia, have been introduced to many tropical islands in the Indo-Pacific region, as well as to Australia and New Zealand (Moriarty 2004a; Chalmers 2018; Martins et al. 2018). Within Australia, their distribution includes eastern Victoria and eastern New South Wales, including the alpine region, the Illawarra region, and isolated populations near Port Macquarie and Foster (Hill et al. 2023). Rusa deer are the third largest deer species in Australia (140 kg and 70 kg for males and females, respectively (Moriarty 2004b; Hampton et al. 2022)) and can live up to 20 years (Forsyth et al. 2004; Ingleby 2022). The preferred habitat of rusa deer in Australia is woodland and forest (Hall and Gill 2005). Breeding can occur throughout the year and females give birth to a single fawn annually from 2 years of age (Woodford and Dunning 1992; Dryden 2000; Moriarty 2004b; Hedges et al. 2015). In Australia, rusa deer home ranges were estimated to be <8 km2 in Royal National Park (Moriarty 2004b) and <4 km2 in peri-urban areas north of Brisbane, Queensland (Amos et al. 2023). Most dispersal is by males aged 1 or 2 years (Moriarty 2004b).
Population genetic structure is defined by the relative distribution of genetic variation (i.e. differences in allele frequencies) among individuals within a species or population (Laikre et al. 2005). Understanding population genetic structure can improve knowledge of a species’ ecology and demography, help determine the source of invasive populations and track their subsequent spread (Lizarralde et al. 2008; Rollins et al. 2006; Shimatani et al. 2010). Analysis of population genetic data can also be used to identify landscape features impacting gene flow within a widespread population (Fraser et al. 2019), and to characterise dispersal (Lawson Handley et al. 2011). This information can then be used to prioritise areas for management programs (Youngson et al. 2003; Rollins et al. 2009; Hindrikson et al. 2017). In Australia, population genetic data have been used to examine spatial structure in sambar deer populations in Victoria (Davies et al. 2022), but to our knowledge this method has not been applied to rusa deer.
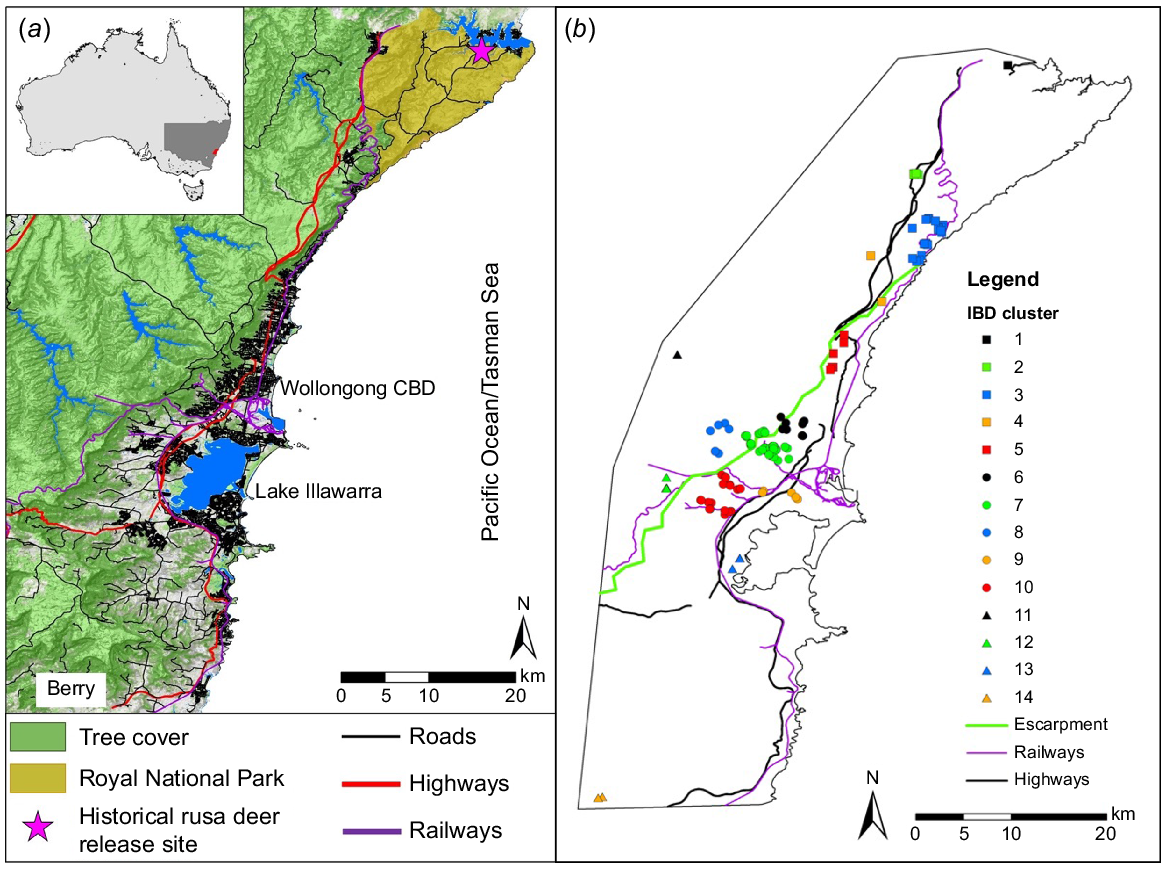
The focus of this study is the Illawarra region in New South Wales (Fig. 1), where the mix of non-urban areas, densely populated urban areas and major infrastructure (such as highways and railways) has resulted in multiple adverse interactions with deer (Dawson 2017). The region spans from Sydney in the north to Berry in the south (~90 km). There are conflicting accounts of the origins of rusa deer in the Illawarra region, but a herd was introduced to Royal National Park, north of the Illawarra region, during 1904–1906 (Moriarty 2004b) (Fig. 1a). Microsatellite data from that population indicated the presence of low genetic diversity compared with the speculated source population in New Caledonia and with other species of deer (Webley et al. 2004). The Royal National Park population is suspected to have subsequently invaded southwards (Webley et al. 2004). The increasing distribution and abundance of deer in the Illawara region, coupled with a high-density human population, has resulted in road and rail collisions, safety and health concerns and numerous complaints from residents here (Gilmour et al. 2016; Dawson 2017; Wollongong City Council 2020) and elsewhere (Department of Agriculture Water and the Environment 2011). For example, during the 2010–11 financial year, at least 212 deer were struck by trains (Gilmour et al. 2016). The Illawarra Wild Deer Management Program (IWDMP) was established in 2011 with the objective of reducing these impacts by culling deer using professional vehicle-based shooters (Dawson 2017; Bengsen et al. 2020; Hampton et al. 2022).
Location of our study area in the Illawarra region of New South Wales, Australia. (a) The Illawarra region has natural features such as Lake Illawarra and the Illawarra escarpment, and human-made features such as roads, railways and high-density housing. (b) Escarpment and groups (described in Supplementary File 1) used for IBD and FST analyses are shown.
As with any pest animal control operation, it is important to understand whether the control effort needs to be widespread or if it can be focused in spatially discrete management units that would not be rapidly repopulated from adjacent units. Therefore, in this study, we addressed the following three key questions about rusa deer in the Illawarra region: (1) Do deer in the Illawarra region represent a single, panmictic population? (2) Do natural or human-made landscape features act as barriers to dispersal? (3) Is there evidence of sex-biased dispersal? For each main question, we investigated the predictions described in Table 1.
| Question | Prediction | Justification | Fig. 2. Map | Total number of subgroups (T) used and sub-group descriptions | Number of total samples used |
|---|---|---|---|---|---|
Question 1: Do deer in the Illawarra region represent a single, panmictic population? | Prediction 1A Large distance: Large geographic distances across the Illawarra region will result in major genetic subdivision | Deer have been reported to travel >200 km (Long et al. 2005; Diefenbach et al. 2008) and rusa deer may move seasonally (Spaggiari and de Garine-Wichatitsky 2006). Gene flow may align with geographical distances and may show evidence of dispersal patterns (Sexton et al. 2014) | 1A | 1A: T = 3 Group 2A1: North group Group 2A2: Middle group Group 2A3: South group | 165 F = 86, M = 79, A = 133, J = 32 |
Prediction 1B Isolation by distance (IBD): There will be a positive relationship between genetic and geographical distances across the Illawarra region | NA | 1B: T = 14 See Supplementary File 1 for group assignment | 165 F = 86, M = 79, A = 133, J = 32 | ||
Question 2: Do natural or human-made landscape features influence dispersal? | Prediction 2A Escarpment: The escarpment will act as a barrier to dispersal | Steep slopes and topographical roughness can act as barriers to animal movement (Reddy et al. 2017; Reddy et al. 2019). | 2A | 2A: T = 2 Group 2A1: Above the escarpment Group 2A2: Below the escarpment | 125 F = 64, M = 61, A = 101, J = 24 |
Prediction 2B Railways and highways: The railway and highways will act as a barrier to dispersal | Roads and railways have caused habitat fragmentation impacting deer (Kuehn et al. 2006; Garcia-Gonzalez et al. 2012). Furthermore, fences around these transportation structures may impact movement of deer (Latch et al. 2021). | 2B | 2B: T = 3 Group 2B1: North group separated by rail from 2B3 and by road and rail from 2B2 Group 2B2: Separated by road and railway from Group 2B1 and 2B3 Group 2B3: South group separated by rail from 2B1 and by road and rail from 2B2 | 110 F = 61, M = 49 A = 92, J = 18 | |
Prediction 2C Narrow corridor: The narrowing corridor between the Illawarra escarpment and the Tasman Sea will show evidence of predominant dispersal in one direction (Northwards or Southwards) | Narrow corridors and stretches of land can impact movement of animals (Riva et al. 2018). | 2C | 2C: T = 3 Group 2C1: North group Group 2C2: Middle group Group 2C3: South group | 106 F = 61, M = 45, A = 84, J = 22 | |
Question 3: Is there evidence of sex-biased dispersal? | Prediction 3 Sex-biased dispersal: There is sex-biased dispersal present across identified genetic groups | Male-biased dispersal is common in deer populations (Spaggiari and de Garine-Wichatitsky 2006; Pérez-Espona et al. 2008). | NA | 3: T = 3 Group 2B3, 2C1, 2C3 | 101 F = 60, M = 41 A = 101, J = 0 |
The sample sites and PCAs for each prediction are shown in Fig. 2. The total number of subgroups (T) and the subgroup number descriptions are provided, as are the number of samples used in total, with the number of females (F), males (M), adults (A) and juveniles (J). For sample metadata see Supplementary File 1.
Materials and methods
Study area
The Illawarra region (Fig. 1) is a coastal stretch of land south of Royal National Park adjacent to Sydney. The region is 7000 km2 (AdaptNSW NSW Governmnent 2022) and ~320 000 people live there, including ~220 000 in the city of Wollongong (The Australian Bureau of Statistics 2020). The region is divided east–west by the Illawarra escarpment (or Illawarra Range; Fig. 1b), a steep outcrop ranging from 300 m above sea level (asl) in the north to >700 m asl in the south. The cliff-like slopes of the escarpment become more moderate in steepness above the city of Wollongong (Young 1979), where main roads cross them. Above the escarpment (to the west), there is a large plateau covered by continuous native bushlands dominated by tall eucalypt forests surrounding large artificial water reservoirs that supply Sydney and the Illawarra region (NPWS 2002). Public access is limited to maintain high water quality. The steep slopes of the escarpment consist of a mosaic of moist forest and rainforest communities, some unique to the Illawarra region (Ashcroft 2009). The narrow coastal plain between the escarpment and the Tasman Sea is almost completely urbanised north of the City of Wollongong, with high-density roading and housing covering most of the foothills of the escarpment (Fig. 1). Further south, the coastal plain widens into a grassy flood plain between the escarpment and the Lake Illawarra (Young 1979), and is less urbanised than north of the City of Wollongong.
The climate is mild marine, with 1500–1600 mm annual rainfall (NSW Government, Office of Environment and Heritage 2014). In summer, average temperatures range from 20 to 22°C along the coast and 18–20°C on the escarpment. In winter, temperatures range from 12 to 14°C along the coast and 4–6°C near the escarpment (NSW Government, Office of Environment and Heritage 2014).
Rusa deer tissue samples
During 2019 and 2020, ear tissue samples were collected from rusa deer shot during vehicle-based ground shooting operations organised by the IWDMP. The shooting methodology is detailed in Hampton et al. (2022). Operations were conducted at night and throughout the year except on weekends and public holidays. The shooters were asked to collect samples from deer spread throughout the study area, rather than from a few high deer-density sites. Tissue samples were collected using commercially available Allflex Tissue Sampling Units (TSU, Allflex Australia Pty Ltd, Capalaba, Queensland). For each tissue sample, we recorded the collection date, deer age (adult [>18 months] or juvenile [<18 months]), deer sex (based on external genitalia and the presence of antlers) and the GPS coordinates of the sampling site. To maximise coverage of the study area in our genetic data set, we selected samples evenly across all sites, while ensuring an equal sex ratio. Our final sample size of tissues collected for sequencing was 178.
DNA extraction and sequencing
DNA was extracted from ear tissue by Diversity Array Technology Pty Ltd (Canberra, Australia), using a NucleoMag Tissue Extraction Kit (Macherey-Nagel, Duren, Germany). DNA was double-digested using the restriction enzymes Pstl and Sphl, barcodes were added for disaggregation of samples and the fragments sequenced by DArT-seq (Diversity Array Technology Pty Ltd, Canberra) (Kilian et al. 2012; Georges and Gruber 2019). DNA could not be successfully extracted and sequenced for four deer, resulting in genetic data for a total of 174 deer.
Sequence data were analysed on the computational cluster at the University of New South Wales (PVC (Research Infrastructure), UNSW Sydney 2010). We used a reference-based variant calling approach to analyse fastq files using stacks v2.2 (Catchen et al. 2013). We used the program process_radtags in stacks to process the raw data to generate cleaned reads. We used process_radtags to check barcode intactness and for error correction, and then used fastqc v0.11.9 (Andrews 2010) to assess read quality using a sliding window (15% of the read) approach.
There are no reference genomes available for rusa deer, so we mapped reads to the hog deer genome (Axis porcinus, GCA_003798545.1) using the burrows-wheeler aligner (BWA) v0.7.17 software package (Li and Durbin 2009). The hog deer genome was selected based on the phylogeny and topology of the intrafamilial relationships among deer (Pitra et al. 2004). We used bwa align (‘aln’ command) (Li and Durbin 2009) to align the reads to the genome and trimmed the first five nucleotides (‘-B 5’ command) based on the fastqc results. We used the populations program (Catchen et al. 2013) in stacks to call single nucleotide polymorphisms (SNPs). We conducted several filtering steps prior to the initial analysis.
We performed initial quality filtering using the population program in stacks, using a minimum loci log likelihood value of −10 (‘--lnl_lim -10’ command), and we retained one random SNP per locus (‘--write_random_snp’ command). We applied additional filtering parameters with VCFTools v0.1.16 (Danecek et al. 2011) to the variant file produced by the population program in stacks, with minimum genotype quality score of 15 (‘--minGQ 15’ command), a maximum locus depth of 50 (‘--maxDP 50’ command) and minimum locus depth of 2 (‘--minDP 2’ command). Following these filtering steps, there were 62 461 SNPs remaining in the dataset. Using VCFTools, we identified and removed two individuals that had a high level of missingness (over 70%; ‘--missing-indv’ command). Following this step, 172 individuals were retained for all downstream analyses (Supplementary File 1), including 88 females (74 adults and 14 juveniles) and 84 males (64 adults and 20 juveniles). We chose a minimum minor allele frequency (‘--maf’ command) of 1% and maximum missing (‘--max-missingness’ command) of 0.3. This resulted in a data set including 12 949 SNPs.
Analysis
To evaluate population structure across the study site, we conducted an initial admixture analysis with all samples across the study site. admixture v. 1.3.0 (Alexander et al. 2009) produced maximum likelihood estimations of the individual ancestries and representative K-values (a key user-defined parameter of hypothesised number of populations). For all admixture analyses throughout this study, a random seed generated from the current time (‘-s time’), and K-values 1–10 were generated for each admixture analysis. Using admixture’s cross-validation procedure (‘--cv flag’ command), we selected appropriate admixture plots based on examining the K-values’ CV error and selecting the K that corresponded with the lowest CV error. Plots were visualised using the python script distruct v2.3 (Chhatre 2018). In addition to this, we also performed Principal Component Analysis (PCA) using snprelate v1.24.0 (‘snpgdsPCA’) (Zheng et al. 2012) in r v3.6.3 (R Core Team 2020) and visualised the results using ggplot2 v3.4 (Wickham 2016).
We removed outlier individuals identified in the initial admixture and PCA analyses before we conducted downstream analyses, which left a total of 165 individuals. Taking into consideration the current rusa deer distribution in New South Wales (Crittle and Millynn 2020) and number of samples per sampling site and location, we assigned individuals to geographic groups using hierarchical clustering with a maximum distance of 5 km (R-package stats v 4.2.2) (Murtagh and Legendre 2014). No individual was assigned to more than one of these 14 groups (Fig. 1b, Supplementary File 1). We estimated relatedness values for all pairs of individuals using the dartR v1.9.6 (Gruber et al. 2018) function ‘gl.grm’.
To answer Question 1 (Table 1, Do deer in the Illawarra region represent a single, panmictic population?), two predictions were tested. To test Prediction 1A: Large Distance, we investigated whether large geographic distances across the Illawarra region result in major genetic subdivision, and to test Prediction 1B: Isolation By Distance (IBD), we investigated whether there is a relationship between geographical and genetic distances (Table 1). All individuals passing quality filters were included in these analyses, excluding outliers.
To test Prediction 1A: Large Distance, we conducted admixture analysis (Fig. 2A) and produced a PCA (as above; Supplementary File 2, Fig. S1). A pairwise matrix of fixation indices (FST) was created using the ‘gl.fst.pop’ function in dartR to estimate levels of genetic differentiation across our study site. For this analysis, individuals were assigned to the same 14 groups described above (Supplementary File 1). For Prediction 1B: IBD, we used a Mantel test performed in dartR function ‘gl.ibd’ with 999 permutations. We visualised patterns of IBD by plotting transformed pairwise differentiation (FST/1–FST; (Rousset 1997) against log-transformed geographic distance), again using dartR.
Location of rusa deer samples used to answer Question 1A and Questions 2A–C (Table 1). The admixture plots below the maps indicate population genetic structure and contain genetic data from individuals included on the corresponding map, with individuals ordered in the plots from north to south (left to right). admixture analysis determines the optimal number of ancestral genetic groups that explain patterns in a genetic data set, with each ancestral genetic group being represented by a separate colour. To visualise this information, each vertical bar within an admixture plot represents an individual, with the proportion of colours within the bar representing the likelihood that that individual was descended from each genetic group; for example, a vertical bar in the admixture plot that is all blue indicates an individual with no mixed ancestry, while a vertical bar that contains blue, red, and purple indicates an individual of mixed ancestry. Ordering individuals based on their sampling location allows us to see broad trends within and across sampling groups. For all panels, the colours and shapes on maps correspond to those indicated below the associated admixture plot, as well as the PCA plots presented in Supplementary File 2, Figs S2 and S3. Map 1A: deer sampled in the north (Group 1A1), central (Group 1A2), and south of the Illawarra region (Group 2A3) for Prediction 1A: Large Distance. Map 2A: Deer sampled above (Group 2A1) and below (Group 2A2) the escarpment (shown in green) used to test Prediction 2A: Escarpment. Map 2B: Deer sampled north of the Unanderra-Moss Vale railway (Group 2B1), between Lake Illawarra and highways/railways (Group 2B2), and south of the Unanderra-Moss Vale railway (Group 2B3) used to test Prediction 2B: Railways and Highways. Map 2C: deer sampled north of the narrow corridor (Group 2C1), within the narrow corridor (Group 2C2) and south of the narrow corridor (Group 2C3) used to test Prediction 2C: Narrow Corridor.
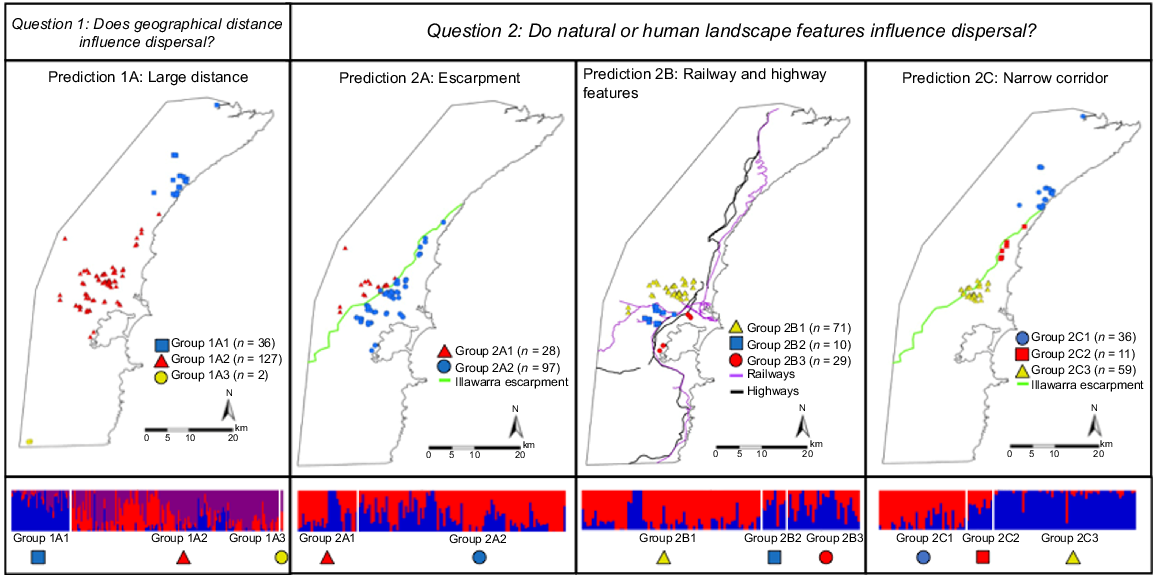
To answer Question 2 (Table 1, Do natural and human-made landscape features influence dispersal?), we tested three predictions including different subgroups of individuals (Table 1, Fig. 2.2A–C). To test Prediction 2A: Escarpment, we investigated whether the steep slopes of the escarpment above the city of Wollongong act as a barrier to dispersal. The individuals included in this analysis were those found above (Group 2A1, Fig. 2.2A) or below (Group 1A2, Fig. 2.1A) the Illawarra escarpment (group assignments described in Supplementary File 1).
To test Prediction 2B: Railways and Highways, we investigated whether the railways and highways act as barriers to dispersal. We assigned individuals to three groups (group assignments described in Supplementary File 1) based on their proximity to the railways and highways near the city of Wollongong and Lake Illawarra (Fig. 2.2B). Groups 2B1 and 2B3 were sampled on each side of the Unanderra–Moss Vale railway line (north and south, respectively), and west of the main highways and railways. The Group 2B2 was sampled east of the main highways and railways, in a densely urbanised area from Lake Illawarra to the Wollongong CBD (Fig. 2.2B). These railways and highways were partially fenced, but fence material and height varied.
To test Prediction 2C: Narrow Corridor, we investigated whether the narrow corridor between the steepest part of the escarpment (north of the city of Wollongong) and the Tasman Sea reduced dispersal of rusa deer (Table 1, Fig. 2.2C). The individuals included in this prediction were those sampled north of the corridor close to Royal National Park (Group 2C1, Fig. 2.2C), those sampled within the corridor (Group 2C2, Fig. 2.2C) and those sampled south of the corridor close to the city of Wollongong (Group 2C3, Fig. 2.2C; group assignments described in Supplementary File 1). Additionally, we calculated genetic diversity of the north and south groups, using a random subsample of 34 individuals from each group and estimating expected heterozygosity, number of private variants (only found in one site) and percentage of polymorphic loci within each site using the populations program in stacks.
To answer Question 3 (Table 1, Is there evidence of sex-biased dispersal?), we selected three groups of individuals that were determined through admixture analysis to be genetically distinct from one another (these groups were 2B3, 2C1, and 2C3, described in Supplementary File 1), which was comprised of 60 adult females and 41 adult males. We used the R package hierfstat (‘sexbias.test’) to calculate the assignment index (AI) statistic (mean (mAIC), variance (vAIC), FST, and FIS were assessed, with the settings alternative = ‘two.sided’, nperm = 100) (Goudet et al. 2002).
Results
Initial analyses
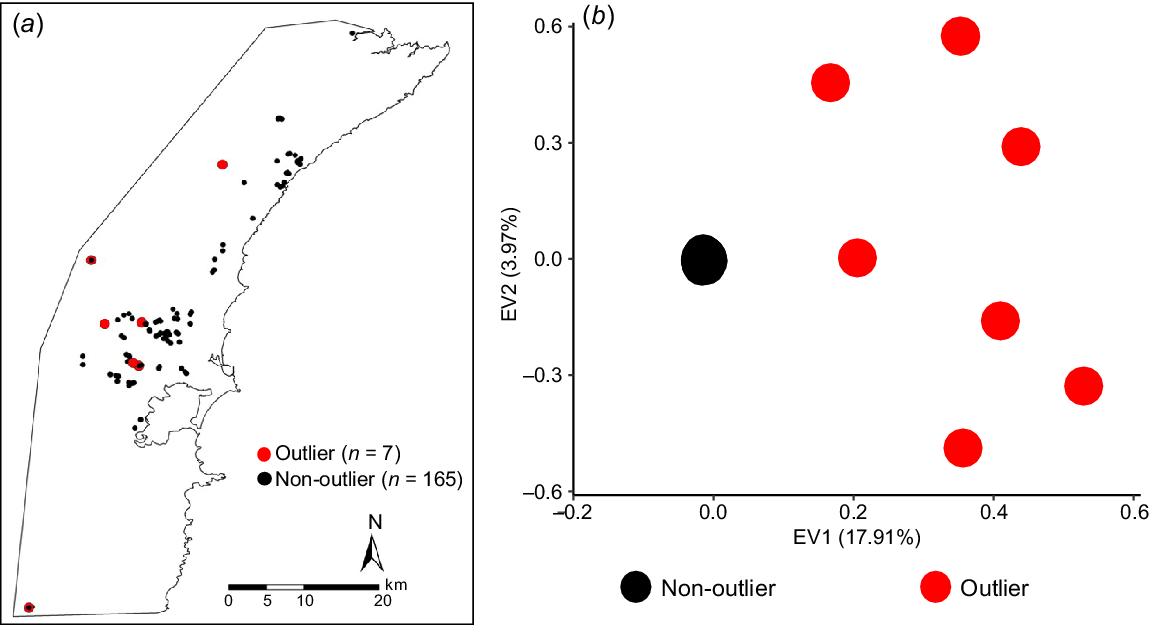
When all 172 individuals were included, we identified seven individuals in the PCA and admixture analyses that were genetically dissimilar to all remaining samples (n = 165), and to one another (Fig. 3; Supplementary File 2, Fig. S1). Outliers were geographically dispersed (Fig. 3) and included four adult males, one juvenile male, one adult female and one juvenile female.
The genetic outliers identified during our initial analysis of rusa deer sampled in the Illawarra region. (a) Filled circles indicate sampling locations of all deer (n = 172) included in this study (outliers are indicated by red, all other samples by black). (b) PCA analysis of genetic differences based on single nucleotide polymorphism data shows outliers in red (n = 7) and all other samples in black (n = 165).
Question 1: Do deer in the Illawarra region represent a single, panmictic population?
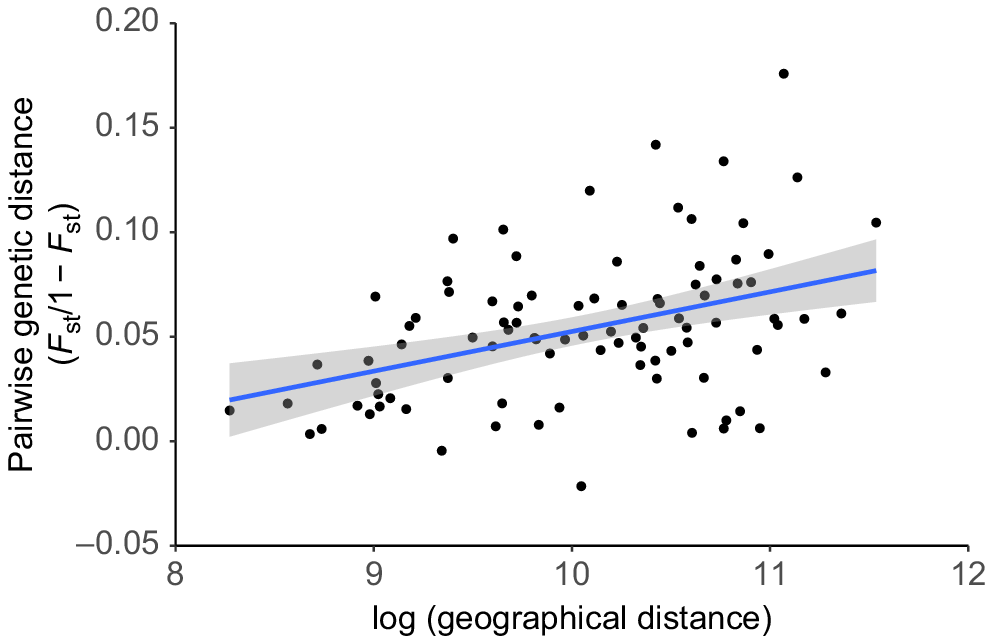
Both the admixture and PCA analysis showed evidence of genetic differentiation between individuals in the northern group (Group 1A1) and the middle group (Group 1A2; Fig. 2.1A admixture plot; Supplementary File 2, Figs S2 and S3). The two individuals sampled farthest to the south of our study area (both adult males; Group 1A3) were genetically similar to Group 1A2 (Fig. 2.1A admixture plot; Supplementary File 2, Figs S2 and S3), despite being separated from this group by >25 km. Overall, pairwise relatedness values across our study were low (highest value was 0.36; only 12 of 13 530 pairs had a value that exceeded 0.25). The Mantel test revealed a weak but statistically significant positive relationship between genetic and geographic distance (Mantel statistic r = 0.404, P = 0.01; Fig. 4). Pairwise FST values ranged between 0.00 and 0.15, and most were significant (pairwise FST and associated P-values are reported in Supplementary File 3).
Isolation by distance (IBD) analysis of 165 rusa deer included in this study (excluding seven genetic outliers). Individuals were grouped based on geographical proximity (n = 14 groups, Supplementary File 1). The result of the Mantel test showed a significant positive relationship between geographic and genetic distance (r = 0.404, P = 0.01). Each point in this graph represents a pairwise comparison between two geographic groups. Within a population displaying IBD, we would expect two groups that have a small geographic distance between them to also have a low genetic distance between them (and vice versa). The genetic distance measurement used in this analysis is based on fixation index (FST), which is a pairwise comparison that captures the total amount of genetic variance between groups as a proportion of the total genetic variance across both groups.
Question 2: Do natural or human-made landscape features influence dispersal?
The prediction that the Illawarra escarpment acts as a barrier to gene flow was not supported; samples from above (Group 2A1) and below (Group 2A2) the escarpment were genetically indistinct (Fig. 2.2A admixture plot; Supplementary File 2, Figs S2 and S3). However, the Unanderra–Moss Vale railway line was associated with reduced gene flow between the group of samples north of the railway and the group south of the railway (Fig. 2.2B admixture plot; Supplementary File 2, Figs S2 and S3). In contrast, the 10 samples collected close to Lake Illawarra (Group 2B2) clustered with the group south of the Unanderra–Moss Vale railway (Group 2B3), despite being separated by two highways and a busy railway (Fig. 2.2B admixture plot; Supplementary File 2, Figs S2 and S3).
The analysis of samples along the narrow corridor between the escarpment and the Tasman Sea showed evidence of genetic differentiation. We found two distinct genetic clusters in both the PCA and admixture analyses (Fig. 2.2C admixture plot; Supplementary File 2, Figs S2 and S3) for the north (Group 2C1) and south groups (Group 2C3). The 11 samples collected at the narrowest part of the corridor (Group 2C2) contained mixed ancestry from both the northern and southern groups (Fig. 2.2C admixture plot; Supplementary File 2, Figs S2 and S3). There was slightly higher genetic diversity in the northern group (expected heterozygosity = 0.21 and 65.7% polymorphic loci) compared with the southern group (expected heterozygosity = 0.19 and 59.2% polymorphic loci). In addition, the northern group had >2.5 times more private variants than the southern group (1281 and 449, respectively).
Discussion
We have described population genetic structure and patterns of gene flow in rusa deer sampled within the Illawarra region and tested specific predictions about whether natural and human-made landscape features act as barriers to dispersal. We found no evidence of the Illawarra escarpment acting as a barrier to gene flow, but individuals sampled north and south of the narrow coastal corridor between the escarpment and the Tasman Sea showed signs of genetic differentiation. Genetic diversity was highest nearest Royal National Park (the original rusa deer introduction site) compared with sites sampled further south. Close to the city of Wollongong, we found reduced gene flow between the area to the north of a railway and the area directly to the south of that railway. We identified evidence of population structure across the whole region that appears to have been caused by isolation by distance, but we did not find evidence of sex-biased dispersal.
We identified seven genetic outliers that were not only different to most samples in our study but also genetically distinct from one another. The outliers could be hybrids with other deer species. Fallow deer, red deer, sambar deer and chital deer all have wild populations established in New South Wales (Crittle and Millynn 2020; NSW Department of Planning Industry and Environment 2021). Rusa and sambar deer commonly hybridise (Chalmers 2018; Martins et al. 2018; King and Forsyth 2021). These specific individuals have additionally been identified as likely sambar–rusa hybrids in Hill et al. (2023). These outliers could also be immigrants from rusa deer populations outside our study area that established from individuals distinct from those descended from the 1904–1906 introduction in Royal National Park. The initial release of rusa deer in Royal National Park was the first of multiple introductions across New South Wales (Bentley 1998; Moriarty 2004b). The broad distribution of the outliers across the Illawarra region (but mostly above the escarpment) suggests that these individuals may have moved into the Illawarra region from genetically distinct, nearby populations or from human-mediated releases. Tissue samples from other rusa deer populations in New South Wales and from other introduced species of deer in Australia are needed to test these possibilities.
Question 1: Do deer in the Illawarra region represent a single, panmictic population?
Our admixture analyses indicated that there was population genetic structure across the study area, but FST values indicated that differentiation between most sampling sites was low. After removing the seven individual outliers, genetic distance between sampling sites was weakly correlated to the geographical distance between them. This accords with what is known of the home range size of rusa deer in Australia (i.e. <8 km2; Moriarty 2004b; Amos et al. 2023), so our study area far exceeds home range size (approximately 85 km from two furthest sample points). Although the pattern of IBD we observed was significant, the large variance in the strength of this relationship indicates that other factors are also important for population structure in this species. A more comprehensive study of landscape features may better explain these patterns. The analyses discussed below indicate that there is finer-scale population structure.
Question 2: Do natural or human-made landscape features influence dispersal?
Surprisingly, we found no evidence that the escarpment was a barrier to gene flow. Steep environmental gradients commonly influence gene flow, and animal movement patterns often follow prominent physical features of the landscape (Pérez-Espona et al. 2008). This includes escarpments in Australia that have been found to impede gene flow in other invasive mammal species such as feral pigs (Loving 2022). However, in New Zealand, rusa deer live on steep forested slopes (Allen et al. 2015). Our results suggest that deer are likely to continue to move across this landscape feature in the southern Illawarra region. We note that most of our samples were collected below the escarpment, and we were unable to collect any samples above the escarpment at its northern extent, where the slope is steepest (Young 1979). Deliberate (illegal) translocation could also explain this result. Additional sampling of deer above the escarpment, especially in the north, may clarify whether this landscape feature affects rusa deer population structure.
Despite close geographic proximity, there was genetic clustering of deer on either side of the Unanderra–Moss Vale railway. This is interesting, because this railway is an infrequently used freight line, and is only partially fenced. Railways and roads may act as significant barriers or facilitators to gene flow in deer populations (Coulon et al. 2006; Long et al. 2010; Frantz et al. 2012; Robinson et al. 2012), but some studies have noted that these anthropological features need to be interpreted carefully because they are often associated with natural landscape features that could affect movement (Pérez-Espona et al. 2008). The genetic differentiation that we observed could be due to deer not wanting to cross the railway line due to the risk of collision and/or because they are scared by the loud noises made by trains (Drolet et al. 2016; Bhardwaj et al. 2022), but another railway in our study did not appear to impede gene flow (see below). The genetic clustering on either side of the Unanderra–Moss Vale railway might also represent larger-scale differences in landscape features affecting deer movement. This railway is associated with a major change in the landscape. North of the railway there is mostly high-density residential housing that encroaches the lower forested slopes of the escarpment. South of the railway, the landscape becomes flatter and more open with extensive industrial areas and pasture paddocks. Rusa deer generally prefer dense vegetation cover as refuge during the day (Moriarty 2004b; Spaggiari and de Garine-Wichatitsky 2006); therefore, the region south of the railway might be a lower quality habitat that deer avoid.
We found no evidence of population structure in samples separated by major highways and a busy railway near Lake Illawarra. Major highways have a varying impact on gene flow in deer, acting as barriers in some studies but not others (Long et al. 2010; Meisingset et al. 2013; Peterson et al. 2017). In our study, there is irregular fencing along these anthropological features, and this may be an additional factor contributing to the permeability of these landscape features (Olsson 2007; Hepenstrick et al. 2012; Huijser and Begley 2022). Reasons for deer moving across human-made structures associated with high mortality risks, such as roads and railways, include searching for food and shelter, and seeking mating opportunities (Ando 2003). It is likely that the rusa deer moving across these structures have learned behaviours (e.g. flight responses) to reduce the risks of collisions with trains and road vehicles, as seen in other mammals (Borda-de-Água et al. 2017; Bhardwaj et al. 2022). Our study investigated the impacts of only three human-made landscape features. Substantially increasing the number of rusa deer samples, and their geographic spread, would help better understand the influence of human-made landscape features on gene flow.
We examined a subset of samples near the original introduction site in Royal National Park and contiguous sites to the south, including a geographically intermediate site along the narrow corridor of land between the escarpment and the coast (Table 1, Groups 2C1–2C3). The deer sampled across these areas exhibited population genetic structure, and it appears that individuals in the narrow corridor are genetically intermediate to those to the north and those to the south. The genetic diversity is higher in the northern sites, near the original introduction site in Royal National Park (Bentley 1998; Moriarty 2004b; Webley et al. 2004). There is less genetic diversity further south (Group 2C3), which is expected if deer in this area are more recently established following dispersal from sites to the north. Our genetic diversity data suggest that more southerly sites resemble patterns expected of range-edge populations (Brussard 1984; Phillips et al. 2008; Langin et al. 2017), supporting the prediction that the rusa deer population is expanding south and west from Royal National Park. Despite lower genetic diversity in the south, we still identified 449 private genetic variants in these samples. Given the results of Hill et al. (2023), these variants are unlikely to be due to hybridisation with other species but could result from admixture following immigration from different populations of rusa deer, from introgression following hybridisation events, or could represent rare alleles that exist in the north but were not sampled.
Question 3: Is there evidence of sex-biased dispersal?
Male-biased dispersal is commonly observed in deer (Spaggiari and de Garine-Wichatitsky 2006; Pérez-Espona et al. 2010), but we did not find any genetic evidence that rusa deer dispersal in our study area was sex-biased. The method we used compares the variance of how well individuals of each sex genetically assign to the group from which they were sampled. In studies like ours, where population differentiation is low, the accuracy of assignment may be lower than in populations with high levels of genetic differentiation. The two adult male deer sampled in the far south of our study area (seen in Fig. 2, Group 1A3) were genetically similar to individuals sampled ~25 km to the north. These individuals could have been dispersers and/or illegal translocations. More samples from this area are needed to determine if they were dispersers.
Management implications
Although we found low overall levels of genetic differentiation in rusa deer sampled across the Illawarra region, we identified three spatially segregated genetic clusters that could inform management (Supplementary File 2, Fig. S4). The clustering indicates reduced mixing of deer in each unit with deer from outside that unit, as identified by genetic structure associated with populations to the north versus the south of the narrow corridor between the escarpment and the sea (Prediction 2C) and genetic structure across one of the corridors of major highway and rail (Prediction 2B). Vehicle-based shooting in peri-urban landscapes is limited by the need to minimise actual and perceived risks to people (e.g. shooting does not occur on weekends and public holidays), and by the cost. Deer killed during management operations can be replaced by in situ births and/or immigration. In the management units identified in our study, immigration is limited (i.e. low genetic mixing with outside populations), and therefore only local recruitment can compensate for population reduction by shooting. Thus, concentrating the culling within a particular management unit is expected to have a greater long-term impact on local deer abundance, compared with spreading the culling effort across the whole region.
Interestingly, we found that approximately 4% of the samples included in our study were genetic outliers and are likely to be hybrids with another deer species (Hill et al. 2023). It would be useful to identify their origin so that future incursions can be limited (e.g. by culling in the population of origin). Management of an invasive population is more cost-effective when implemented at the start of the invasion, during the well-characterised ‘lag period’ that precedes exponential population growth (Sakai et al. 2001), rather than when a population is well-established.
Additionally, it appears that there is ongoing gene flow from outside our study area, because 449 genetic variants we found in samples taken near the city of Wollongong (Fig. 2.2C) were not found in any of the 36 individuals sampled close to Royal National Park (Group 2C1). If the rusa deer sources outside the Illawarra region could be identified, managers might consider culling in the population of origin or take legal actions to prevent further introductions.
Data availability
Raw read data are available on the sequence read archive at NCBI under the BioProject accession PRJNA983518 at https://www.ncbi.nlm.nih.gov/bioproject/PRJNA983518.
Conflicts of interest
David Forsyth is a guest Associate Editor of Wildlife Research but was blinded from the peer-review process for this manuscript. Michelle Dawson was an employee of a government agency involved with the management of deer in our study area, but her employment could not reasonably have interfered with the full and objective presentation of this research.
Declaration of funding
This study was funded by the Centre for Invasive Species Solutions projects ‘Management of wild dogs and deer in peri-urban landscapes: strategies for safe communities’ (PO1-L-003) and ‘Cost-effective management of wild deer’ (PO1-L-001) and NSW Department of Primary Industries (Biosecurity and Food Safety and the Special Purpose Pest Management Rate). LAR was supported by the UNSW Scientia program.
Acknowledgements
We thank Stephen Wentworth (South East Local Land Services), Helen Jessup (NSW Parks and Wildlife Services), Jacob Adams (WaterNSW) and the contract shooters who collected the rusa deer tissue samples, and Holly Trim for assistance in the lab. Constructive comments made by the Associate Editor and two reviewers greatly improved this paper.
References
AdaptNSW NSW Government (2022) Climate change in the Illawarra. Available at https://www.climatechange.environment.nsw.gov.au/illawarra#:~:text=The%20Illawarra%20region%20covers%20an,km2%20south%20of%20Sydney [Accessed 29 June 2022]
Alexander DH, Novembre J, Lange K (2009) Fast model-based estimation of ancestry in unrelated individuals. Genome Research 19, 1655-1664.
| Crossref | Google Scholar |
Allen RB, Forsyth DM, Allen RKJ, Affeld K, MacKenzie DI (2015) Solar radiation determines site occupancy of coexisting tropical and temperate deer species introduced to New Zealand forests. PLoS ONE 10, e0128924.
| Crossref | Google Scholar |
Amos M, Baxter G, Finch N, Lisle A, Murray P (2014) I just want to count them! Considerations when choosing a deer population monitoring method. Wildlife Biology 20, 362-370.
| Crossref | Google Scholar |
Amos M, Pople A, Brennan M, Sheil D, Kimber M, Cathcart A (2023) Home ranges of rusa deer (Cervus timorensis) in a subtropical peri-urban environment in South East Queensland. Australian Mammalogy 45, 116-120.
| Crossref | Google Scholar |
Ando C (2003) The relationship between deer-train collisions and daily activity of the sika deer, Cervus nippon. Mammal Study 28, 135-143.
| Crossref | Google Scholar |
Andrews S (2010) FastQC: a quality control tool for high throughput sequence data. Babraham Institute. Available at http://www.bioinformatics.babraham.ac.uk/projects/fastqc [Accessed 20 May 2021]
Anton V, Hartley S, Wittmer HU (2018) Evaluation of remote cameras for monitoring multiple invasive mammals in New Zealand. New Zealand Journal of Ecology 42, 74-79.
| Crossref | Google Scholar |
Bengsen AJ, Forsyth DM, Harris S, Latham ADM, McLeod SR, Pople A (2020) A systematic review of ground-based shooting to control overabundant mammal populations. Wildlife Research 47, 197-207.
| Crossref | Google Scholar |
Bhardwaj M, Olsson M, Håkansson E, Söderström P, Seiler A (2022) Ungulates and trains–factors influencing flight responses and detectability. Journal of Environmental Management 313, 114992.
| Crossref | Google Scholar |
Brussard PF (1984) Geographic patterns and environmental gradients: the central-marginal model in Drosophila revisited. Annual Review of Ecology and Systematics 15, 25-64.
| Crossref | Google Scholar |
Burgin S, Mattila M, McPhee D, Hundloe T (2015) Feral deer in the suburbs: an emerging issue for Australia? Human Dimensions of Wildlife 20, 65-80.
| Crossref | Google Scholar |
Catchen J, Hohenlohe PA, Bassham S, Amores A, Cresko WA (2013) Stacks: an analysis tool set for population genomics. Molecular Ecology 22, 3124-3140.
| Crossref | Google Scholar |
Chhatre VE (2018) Distruct v2.3. A modified cluster membership plotting script. Available at http://distruct2.popgen.org
Ciach M, Fröhlich A (2019) Ungulates in the city: light pollution and open habitats predict the probability of roe deer occurring in an urban environment. Urban Ecosystems 22, 513-523.
| Crossref | Google Scholar |
Coulon A, Guillot G, Cosson J-F, Angibault JMA, Aulagnier S, Cargnelutti B, Galan M, Hewison AJM (2006) Genetic structure is influenced by landscape features: empirical evidence from a roe deer population. Molecular Ecology 15, 1669-1679.
| Crossref | Google Scholar |
Cripps JK, Pacioni C, Scroggie MP, Woolnough AP, Ramsey DSL (2019) Introduced deer and their potential role in disease transmission to livestock in Australia. Mammal Review 49, 60-77.
| Crossref | Google Scholar |
Cunningham CX, Perry GLW, Bowman DMJS, Forsyth DM, Driessen MM, Appleby M, Brook BW, Hocking G, Buettel JC, French BJ, Hamer R, Bryant SL, Taylor M, Gardiner R, Proft K, Scoleri VP, Chiu-Werner A, Travers T, Thompson L, Guy T, Johnson CN (2022) Dynamics and predicted distribution of an irrupting ‘sleeper’ population: fallow deer in Tasmania. Biological Invasions 24, 1131-1147.
| Crossref | Google Scholar |
Danecek P, Auton A, Abecasis G, Albers CA, Banks E, DePristo MA, Handsaker RE, Lunter G, Marth GT, Sherry ST, McVean G (2011) The variant call format and VCFtools. Bioinformatics 27, 2156-2158.
| Crossref | Google Scholar |
Davies C, Wright W, Wedrowicz F, Pacioni C, Hogan FE (2022) Delineating genetic management units of sambar deer (Rusa unicolor) in south-eastern Australia, using opportunistic tissue sampling and targeted scat collection. Wildlife Research 49, 147-157.
| Crossref | Google Scholar |
Davis NE, Bennett A, Forsyth DM, Bowman DMJS, Lefroy EC, Wood SW, Woolnough AP, West P, Hampton JO, Johnson CN (2016) A systematic review of the impacts and management of introduced deer (family Cervidae) in Australia. Wildlife Research 43, 515-532.
| Crossref | Google Scholar |
Dawson M (2017) Tools for managing wild deer: ground shooting in the Northern Illawarra Wild Deer Management Program. In ‘2016 National Wild Deer Management Workshop Proceedings, Canberra, Australia, 2017’. (Eds DM Forsyth, T Pople, B Page, A Moriarty, D Ramsey, J Parkes, A Wiebkin, C Lane) pp. 22–23. (Invasive Animals Cooperative Research Centre)
Department of Agriculture Water and the Environment (2011) Feral deer. Available at https://www.environment.gov.au/biodiversity/invasive-species/publications/factsheet-feral-deer [Accessed 20 March 2021]
Diefenbach DR, Long ES, Rosenberry CS, Wallingford BD, Smith DR (2008) Modeling distribution of dispersal distances in male white-tailed deer. Journal of Wildlife Management 72, 1296-1303.
| Crossref | Google Scholar |
Drolet A, Dussault C, Côté SD (2016) Simulated drilling noise affects the space use of a large terrestrial mammal. Wildlife Biology 22, 284-293.
| Crossref | Google Scholar |
Dryden GM (2000) Biology and production attributes of the farmed rusa deer. Asian-Australasian Journal of Animal Sciences 13, 69-72.
| Google Scholar |
Forsyth DM, Duncan RP, Bomford M, Moore G (2004) Climatic suitability, life-history traits, introduction effort, and the establishment and spread of introduced mammals in Australia. Conservation Biology 18, 557-569.
| Crossref | Google Scholar |
Forsyth DM, Comte S, Davis NE, Bengsen AJ, Côté SD, Hewitt DG, Morellet N, Mysterud A (2022) Methodology matters when estimating deer abundance: a global systematic review and recommendations for improvements. The Journal of Wildlife Management 86, e22207.
| Crossref | Google Scholar |
Frantz AC, Bertouille S, Eloy MC, Licoppe A, Chaumont F, Flamand MC (2012) Comparative landscape genetic analyses show a Belgian motorway to be a gene flow barrier for red deer (Cervus elaphus), but not wild boars (Sus scrofa). Molecular Ecology 21, 3445-3457.
| Crossref | Google Scholar |
Fraser D, Ironside KE, Wayne RK, Boydston EE (2019) Connectivity of mule deer (Odocoileus hemionus) populations in southern California: a genetic survey of a mobile ungulate in a highly fragmented urban landscape. Landscape Ecology 34, 1-19.
| Crossref | Google Scholar |
Garcia-Gonzalez C, Campo D, Pola IG, Garcia-Vazquez E (2012) Rural road networks as barriers to gene flow for amphibians: Species-dependent mitigation by traffic calming. Landscape and Urban Planning 104, 171-180.
| Crossref | Google Scholar |
Gill RMA, Thomas ML, Stocker D (1997) The use of portable thermal imaging for estimating deer population density in forest habitats. The Journal of Applied Ecology 34, 1273-1286.
| Crossref | Google Scholar |
Gilmour P, Bowden R, Denniss R (2016) Evaluation of the Northern Illawarra wild deer management program – report. First Person Consulting Pty Ltd. Available at https://www.aph.gov.au/DocumentStore.ashx?id=20a0bb4c-7c92-4a91-b159-5fe01ec7e512&subId=665019#:~:text=The%20NIWDMP%20appears%20to%20be,or%20downward%20trend%20in%20impacts [Accessed 26 June 2023]
Goudet J, Perrin N, Waser P (2002) Tests for sex-biased dispersal using bi-parentally inherited genetic markers. Molecular Ecology 11, 1103-1114.
| Crossref | Google Scholar |
Gruber B, Unmack PJ, Berry OF, Georges A (2018) dartr: an r package to facilitate analysis of SNP data generated from reduced representation genome sequencing. Molecular Ecology Resources 18, 691-699.
| Crossref | Google Scholar |
Hall GP, Gill KP (2005) Management of wild deer in Australia. Journal of Wildlife Management 69, 837-844.
| Crossref | Google Scholar |
Hampton JO, MacKenzie DI, Forsyth DM (2022) Animal welfare outcomes of professional vehicle-based shooting of peri-urban rusa deer in Australia. Wildlife Research in press.
| Crossref | Google Scholar |
Hedges S, Duckworth JW, Timmins R, Semiadi G, Dryden G (2015) Rusa timorensis. The IUCN red list of threatened species 2015: e.T41789A22156866. Available at http://dx.doi.org/10.2305/IUCN.UK.2015-2.RLTS.T41789A22156866.en
Hepenstrick D, Thiel D, Holderegger R, Gugerli F (2012) Genetic discontinuities in roe deer (Capreolus capreolus) coincide with fenced transportation infrastructure. Basic and Applied Ecology 13, 631-638.
| Crossref | Google Scholar |
Hill E, Murphy N, Li-Williams S, Davies C, Forsyth D, Comte S, Rollins L, Hogan F, Wedrowicz F, Crittle T, Thomas E, Woodford L, Pacioni C (2023) Hybridisation rates, population structure, and dispersal of sambar deer (Cervus unicolor) and rusa deer (Cervus timorensis) in south-eastern Australia. Wildlife Research in press.
| Google Scholar |
Hindrikson M, Remm J, Pilot M, Godinho R, Stronen AV, Baltrūnaité L, Czarnomska SD, Leonard JA, Randi E, Nowak C, Åkesson M, López-Bao Jé V, Álvares F, Llaneza L, Echegaray J, Vilà C, Ozolins J, Rungis D, Aspi J, Paule L, Skrbinšek T, Saarma U (2017) Wolf population genetics in Europe: a systematic review, meta-analysis and suggestions for conservation and management. Biological Reviews 92, 1601-1629.
| Crossref | Google Scholar |
Huijser MP, Begley JS (2022) Implementing wildlife fences along highways at the appropriate spatial scale: a case study of reducing road mortality of Florida Key deer. Nature Conservation 47, 283-302.
| Crossref | Google Scholar |
Kilian A, Wenzl P, Huttner E, Carling J, Xia L, Blois H, Caig V, Heller-Uszynska K, Jaccoud D, Hopper C (2012) Diversity arrays technology: a generic genome profiling technology on open platforms. In ‘Data production and analysis in population genomics’. (Eds F Pompanon, A Bonin) pp. 67–89. (Springer)
Kuehn R, Hindenlang KE, Holzgang O, Senn J, Stoeckle B, Sperisen C (2006) Genetic effect of transportation infrastructure on roe deer populations (Capreolus capreolus). Journal of Heredity 98, 13-22.
| Crossref | Google Scholar |
Laikre L, Palm S, Ryman N (2005) Genetic population structure of fishes: implications for coastal zone management. AMBIO: A Journal of the Human Environment 34, 111-119.
| Crossref | Google Scholar |
Langin KM, Sillett TS, Funk WC, Morrison SA, Ghalambor CK (2017) Partial support for the central–marginal hypothesis within a population: reduced genetic diversity but not increased differentiation at the range edge of an island endemic bird. Heredity 119, 8-15.
| Crossref | Google Scholar |
Latch EK, Gee KL, Webb SL, Honeycutt RL, DeYoung RW, Gonzales RA, Demarais S, Toby R (2021) Genetic consequences of fence confinement in a population of white-tailed deer. Diversity 13, 126.
| Crossref | Google Scholar |
Lawson Handley L-J, Estoup A, Evans DM, Thomas CE, Lombaert E, Facon B, Aebi A, Roy HE (2011) Ecological genetics of invasive alien species. BioControl 56, 409-428.
| Crossref | Google Scholar |
Li H, Durbin R (2009) Fast and accurate short read alignment with Burrows–Wheeler transform. Bioinformatics 25, 1754-1760.
| Crossref | Google Scholar |
Lizarralde MS, Bailliet G, Poljak S, Fasanella M, Giulivi C (2008) Assessing genetic variation and population structure of invasive North American beaver (Castor Canadensis Kuhl, 1820) in Tierra Del Fuego (Argentina). Biological Invasions 10, 673-683.
| Crossref | Google Scholar |
Long ES, Diefenbach DR, Rosenberry CS, Wallingford BD, Grund MD (2005) Forest cover influences dispersal distance of white-tailed deer. Journal of Mammalogy 86, 623-629.
| Crossref | Google Scholar |
Long ES, Diefenbach DR, Wallingford BD, Rosenberry CS (2010) Influence of roads, rivers, and mountains on natal dispersal of white-tailed deer. The Journal of Wildlife Management 74, 1242-1249.
| Crossref | Google Scholar |
Martins RF, Schmidt A, Lenz D, Wilting A, Fickel J (2018) Human-mediated introduction of introgressed deer across Wallace’s line: historical biogeography of Rusa unicolor and R. timorensis. Ecology and Evolution 8, 1465-1479.
| Crossref | Google Scholar |
Meek PD, Ballard GA, Sparkes J, Robinson M, Nesbitt B, Fleming PJS (2019) Camera trap theft and vandalism: occurrence, cost, prevention and implications for wildlife research and management. Remote Sensing in Ecology and Conservation 5, 160-168.
| Crossref | Google Scholar |
Meisingset EL, Loe LE, Brekkum Ø, Van Moorter B, Mysterud A (2013) Red deer habitat selection and movements in relation to roads. The Journal of Wildlife Management 77, 181-191.
| Crossref | Google Scholar |
Moriarty A (2004a) The liberation, distribution, abundance and management of wild deer in Australia. Wildlife Research 31, 291-299.
| Crossref | Google Scholar |
Murtagh F, Legendre P (2014) Ward’s hierarchical agglomerative clustering method: which algorithms implement Ward’s criterion? Journal of classification 31, 274-295.
| Crossref | Google Scholar |
NSW Department of Planning Industry and Environment (2021) Feral deer. Available at https://www.environment.nsw.gov.au/topics/animals-and-plants/pest-animals-and-weeds/pest-animals/feral-deer [Accessed 12 March 2021]
Peterson BE, Storm DJ, Norton AS, Van Deelen TR (2017) Landscape influence on dispersal of yearling male white-tailed deer. The Journal of Wildlife Management 81, 1449-1456.
| Crossref | Google Scholar |
Phillips BL, Brown GP, Travis JMJ, Shine R (2008) Reid’s paradox revisited: the evolution of dispersal kernels during range expansion. The American Naturalist 172, S34-S48.
| Crossref | Google Scholar |
Pinkston R (2009) Military thermal technology adapted to wildlife control and management. In ‘Proceedings of the 13th Wildlife Damage Management Conference’. (Ed. JR Boulanger) pp. 121–125. (UNL Digital Commons) doi:10.13140/RG.2.2.22383.02727
Pitra C, Fickel J, Meijaard E, Groves C (2004) Evolution and phylogeny of old world deer. Molecular Phylogenetics and Evolution 33, 880-895.
| Crossref | Google Scholar |
Pérez-Espona S, Pérez-Barbería FJ, McLeod JE, Jiggins CD, Gordon IJ, Pemberton JM (2008) Landscape features affect gene flow of Scottish Highland red deer (Cervus elaphus). Molecular Ecology 17, 981-996.
| Crossref | Google Scholar |
Pérez-Espona S, Pérez-Barbería FJ, Jiggins CD, Gordon IJ, Pemberton JM (2010) Variable extent of sex-biased dispersal in a strongly polygynous mammal. Molecular Ecology 19, 3101-3113.
| Crossref | Google Scholar |
Reddy PA, Cushman SA, Srivastava A, Sarkar MS, Shivaji S (2017) Tiger abundance and gene flow in Central India are driven by disparate combinations of topography and land cover. Diversity and Distributions 23, 863-874.
| Crossref | Google Scholar |
Reddy PA, Puyravaud J-P, Cushman SA, Segu H (2019) Spatial variation in the response of tiger gene flow to landscape features and limiting factors. Animal Conservation 22, 472-480.
| Crossref | Google Scholar |
Riva F, Acorn JH, Nielsen SE (2018) Narrow anthropogenic corridors direct the movement of a generalist boreal butterfly. Biology Letters 14, 20170770.
| Crossref | Google Scholar |
Robinson SJ, Samuel MD, Lopez DL, Shelton P (2012) The walk is never random: subtle landscape effects shape gene flow in a continuous white-tailed deer population in the Midwestern United States. Molecular Ecology 21, 4190-4205.
| Crossref | Google Scholar |
Rollins LA, Woolnough AP, Sherwin WB (2006) Population genetic tools for pest management: a review. Wildlife Research 33, 251-261.
| Crossref | Google Scholar |
Rollins LA, Woolnough AP, Wilton AN, Sinclair R, Sherwin WB (2009) Invasive species can’t cover their tracks: using microsatellites to assist management of starling (Sturnus vulgaris) populations in Western Australia. Molecular Ecology 18, 1560-1573.
| Crossref | Google Scholar |
Rousset F (1997) Genetic differentiation and estimation of gene flow from F-statistics under isolation by distance. Genetics 145, 1219-1228.
| Crossref | Google Scholar |
Sakai AK, Allendorf FW, Holt JS, Lodge DM, Molofsky J, With KA, Baughman S, Cabin RJ, Cohen JE, Ellstrand NC, McCauley DE, O’Neil P, Parker IM, Thompson JN, Weller SG (2001) The population biology of invasive species. Annual Review of Ecology and Systematics 32, 305-332.
| Crossref | Google Scholar |
Sexton JP, Hangartner SB, Hoffmann AA (2014) Genetic isolation by environment or distance: which pattern of gene flow is most common? Evolution 68, 1-15.
| Crossref | Google Scholar |
Shimatani Y, Fukue Y, Kishimoto R, Masuda R (2010) Genetic variation and population structure of the feral American mink (Neovison vison) in Nagano, Japan, revealed by microsatellite analysis. Mammal Study 35, 1-7.
| Crossref | Google Scholar |
Soulsbury CD, White PCL (2015) Human–wildlife interactions in urban areas: a review of conflicts, benefits and opportunities. Wildlife Research 42, 541-553.
| Crossref | Google Scholar |
Spaggiari J, de Garine-Wichatitsky M (2006) Home range and habitat use of introduced rusa deer (Cervus timorensis russa) in a mosaic of savannah and native sclerophyll forest of New Caledonia. New Zealand Journal of Zoology 33, 175-183.
| Crossref | Google Scholar |
Stout RJ, Knuth BA, Curtis PD (1997) Preferences of suburban landowners for deer management techniques: a step towards better communication. Wildlife Society Bulletin 25, 348-359.
| Google Scholar |
The Australian Bureau of Statistics (2020) Region summary: Illawarra. Available at &https://dbr.abs.gov.au/region.html?lyr=sa4&rgn=107 [Accessed 20 June 2022]
Webley LS, Zenger KR, English AW, Cooper DW (2004) Low levels of genetic variation within introduced Javan rusa deer (Cervus timorensis russa) in Australia. European Journal of Wildlife Research 50, 137-140.
| Crossref | Google Scholar |
Wollongong City Council (2020) Deer. Available at https://www.wollongong.nsw.gov.au/about/environment/pest-animals/deer [Accessed 6 June 2021]
Youngson AF, Jordan WC, Verspoor E, McGinnity P, Cross T, Ferguson A (2003) Management of salmonid fisheries in the British Isles: towards a practical approach based on population genetics. Fisheries Research 62, 193-209.
| Crossref | Google Scholar |
Zheng X, Levine D, Shen J, Gogarten SM, Laurie C, Weir BS (2012) A high-performance computing toolset for relatedness and principal component analysis of SNP data. Bioinformatics 28, 3326-3328.
| Crossref | Google Scholar |