

Spatial and temporal distribution and environmental determinants of freeze-thaw erosion intensity in Qiangtang grasslands, China
Gaobo Zhang A # , Xiaohuang Liu B C # , Jinjie Wang A * , Jiufen Liu B C , Xiaofeng Zhao B C , Hongyu Li B C , Ran Wang B C , Xinping Luo B C , Liyuan Xing B C , Chao Wang C and Honghui Zhao C
A
B
C
Handling Editor: Rosa Maria Poch
Abstract
Analysing freeze-thaw erosion is of great significance to ecological environment protection and land resource utilisation in high altitude areas.
We used seven indicators (temperature, precipitation, vegetation cover, elevation, slope, slope orientation, and sand content) to calculate the freeze-thaw erosion intensity index for different seasons from 2000 to 2019.
We used a graded weighted evaluation model and a geographical detector method to analyse spatiotemporal pattern and driving factors of freeze-thaw erosion intensity in Qiangtang grasslands.
(1) From 2000 to 2019, the total area of freeze-thaw erosion was higher in the non-growing season than in the growing season. The area of moderate and above-average freeze-thaw erosion increased over time in the non-growing season but decreased in the growing season. The spatial distribution of freeze-thaw erosion was mainly determined by the annual range of precipitation and temperature, which reflect the intensity and frequency of freezing and thawing cycles. (2) Vegetation cover was an indirect factor that influenced the soil moisture and stability. The slope was another important factor that affected the spatial distribution of freeze-thaw erosion in different regions.
The results show that in 2000–2019 the area of freeze-thaw erosion showed a downward trend. The erosion degree in the non-growing season is on the rise.
Our study provides new insights into the dynamics and mechanisms of freeze-thaw erosion in Qiangtang grasslands and contributes to the understanding and management of water and climate change impacts on this region.
Keywords: driving force analysis, environmental determinants, freeze-thaw erosion, geographic detector method, growing season, non-growing season, Qiangtang grasslands, spatio-temporal analysis.
Introduction
Freeze-thaw erosion mostly occurs in high latitude, high altitude, cold climate areas, and is the third largest soil erosion type in China (after water and wind erosion) (Wu et al. 2018; Zhang et al. 2021). The freeze-thaw action destroys the soil structure, promotes the formation of gullies, affects the water and heat exchange between frozen soil and the atmosphere, causes high sediment loss under low water content, and threatens the environment and land resources. This phenomenon is common in high latitude regions and high altitude mountains around the world (Barnes et al. 2016; Lu et al. 2019).
The Qinghai–Tibet Plateau is known as the roof of the world and the water tower of Asia. The world’s third polar region with the Qinghai–Tibet Plateau as the core is one of the regions most affected by global warming (Lu et al. 2021). It is also the most concentrated and intense area of freeze-thaw erosion in China (Guo et al. 2017; Vickers 2017; Guo et al. 2019). Its freeze-thaw erosion area accounts for 86.36% of the whole country. In recent decades, the climate of the Qinghai–Tibet Plateau has been warming. The freeze-thaw erosion on the Qinghai–Tibet Plateau is also more sensitive and prominent in response to climate change (Cui et al. 2023).
In the 21st century, freeze-thaw erosion research in China has developed rapidly. Numerous scholars have conducted research on freeze-thaw erosion in the Qinghai–Tibet Plateau region. Some scholars used the evaluation factor of freeze-thaw erosion intensity to analyse the characteristics of freeze-thaw erosion in this area, and found that permafrost in low altitude areas is distributed in areas with high precipitation and high vegetation (Kong and Yu 2013; Fan et al. 2022). Yan et al. (2014) conducted visual interpretation based on the characteristics of different freeze-thaw erosion intensities in remote sensing images, so as to carry out grading evaluation of freeze-thaw erosion intensity. However, there is no uniform standard for remote sensing interpretation of freeze-thaw erosion, and the interpretation of results are greatly affected by subjectivity (Yan et al. 2014). Li et al. (2011) used ArcGIS to complete the evaluation of freeze-thaw erosion intensity in the Sanjiangyuan area, and put forward the evaluation standard of freeze-thaw erosion intensity suitable for the Sanjiangyuan area. Wang et al. (2017) obtained the freeze-thaw erosion intensity grade of Xinghai Basin by using the analytic hierarchy process, and analysed the spatial distribution characteristics of freeze-thaw erosion in the study area. Chen et al. (2023) evaluated the sensitivity of freeze-thaw erosion on the Qinghai–Tibet Plateau from 2000 to 2019. Combined with the desertification trend of the Qinghai–Tibet Plateau during the study period, a method for determining the degraded area of freeze-thaw desertification was constructed (Chen et al. 2023). Cui et al. (2023) analysed the temporal and spatial distribution characteristics of freeze-thaw erosion on the Qinghai–Tibet Plateau from 2003 to 2020 by using the weighted method, as well as the change process and main driving factors of erosion intensity at different levels. It provides a theoretical basis for the treatment of freeze-thaw erosion on the Qinghai–Tibet Plateau (Cui et al. 2023).
Affected by global change, the Qinghai–Tibet Plateau, as a potentially vulnerable area, has a wider range of high-confidence environmental impacts, including increased natural disasters caused by glacier melting, permafrost degradation, and ecosystem changes (Wu 2021). Compared with the change in temperature and precipitation between years, the difference in climate change patterns between the growing season and the non-growing season may have a greater impact on ecosystems (Wang et al. 2018). Li et al. (2022) showed that the response of dominant species and sub-dominant species to asymmetric temperature increases in the growing season/non-growing season was not significant (Liu et al. 2021). Precipitation in the non-growing season will promote the growth of secondary dominant species and promote the biomass of dominant species in alpine meadows. Liu et al. (2021) conducted an inversion study on the vegetation coverage of an alpine grassland in the growing season/non-growing season for Dangxiong County. The results showed that the vegetation coverage in the growing season was 20–80% and most of the grassland coverage in the non-growing season was less than 40%. Affected by climate change, there are differences in factors such as precipitation and vegetation between the growing and non-growing seasons. Under the influence of these factors, there will also be differences in the spatiotemporal distribution of freeze-thaw erosion.
Most of the existing studies focus on the definition and classification of freeze-thaw erosion in Tibet, Sanjiangyuan Nature Reserve, and other regions on the Qinghai–Tibet Plateau (Liu et al. 2017; Li et al. 2023). Previous studies have shown that freeze-thaw erosion is mostly analysed throughout the year in terms of time (Zhao et al. 2012; Li et al. 2023). However, freeze-thaw erosion in the growing season and non-growing season is affected by climate, vegetation, and other factors, and previous studies are still lacking. In the Qiangtang Plateau area, scholars have carried out a lot of studies on environmental factors such as climate, vegetation, and precipitation (Hasbagan et al. 2019; Li et al. 2023). However, there are few studies on the characteristics and driving force of freeze-thaw erosion intensity. On this basis, this article selects seven factors affecting freeze-thaw erosion from 2000 to 2019 (annual temperature range, precipitation, vegetation coverage, elevation, slope, slope direction, and sand content), and based on the climate and vegetation characteristics of the research area, we take June–September as the growth season, conduct spatiotemporal change and driving force analysis of freeze-thaw erosion intensity from October to May of the following year as a non-growing season.
Study area and methods
The study area
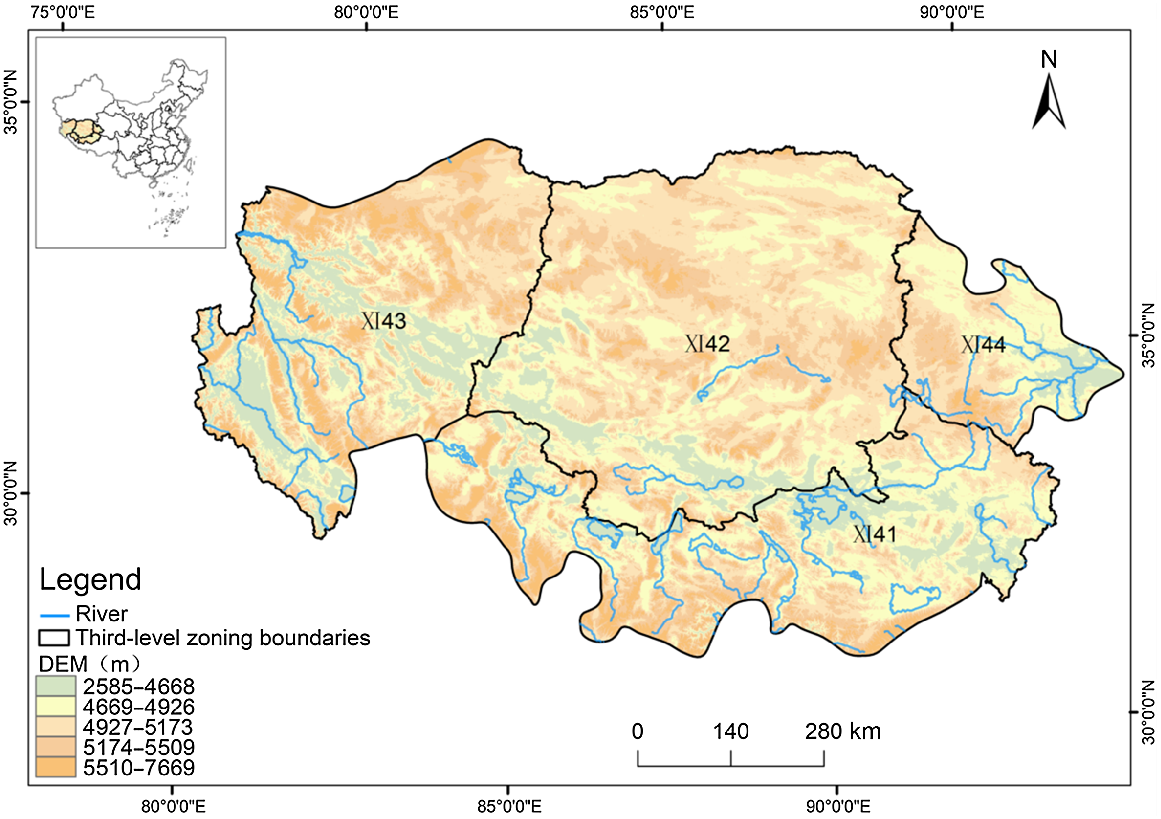
The range of the Qiangtang Plateau grassland subarea is 78°25′−93°30′E, 29°29′−36°28′N (Fig. 1). It belongs to the secondary comprehensive division of natural resources. It is located on the north side of the Qinghai–Tibet Grassland natural resources region. The area is approximately 719,000 km2, accounting for 59.8% of the total area of the Tibet Autonomous Region (Zhang et al. 2020a; Liu et al. 2022). The mean elevation of the study area is approximately 5000 m. The slope is 0–17° and the climate tends to be cold and dry. It is the harshest alpine region in the middle and low latitudes in the northern hemisphere. The annual average temperature range in the non-growing season and the growing season was 16°C and 3°C, respectively, and the average annual precipitation was 48 mm and 168 mm, respectively. The land cover can be categorised as alpine meadow, alpine grassland, and alpine desert. The soil texture is mainly sandy, loamy sandy, and sandy loam (Wu and Zhao 2019). The main ecosystems are dominated by alpine meadows and alpine grasslands. Affected by global climate change and human activities, the region faces ecological problems, such as glacier melt and grassland degradation, and thus the plateau is unstable. Freeze-thaw erosion is one of the main environmental problems (Huang et al. 2016).
The geographical location of the study area. XI41: Grassland and lake areas covered by high mountains on the Qiangtang Plateau; XI42: The eastern part of the Qiangtang Plateau is covered with grassland and Gobi Desert; XI43: Low coverage grassland and bare rock areas on Ali Mountain; XI44: Qiangtang Plateau alpine low-cover grasslands and lakes.
Data sources
The main data and sources used in this study are shown in Table 1. The slope and aspect of freeze-thaw erosion influencing factors were calculated by using DEM data. Vegetation coverage was calculated by NDVI data. Annual range of temperature was calculated by temperature data. Annual average precipitation was calculated by precipitation data. The freeze-thaw erosion area was analysed by sand soil content data. The freeze-thaw disaster data obtained from field investigation were used to study the effects of different degrees of freeze-thaw erosion on freeze-thaw disasters in the Tuotuo River area. In order to ensure that these indicators have good consistency in the spatial direction, all indicators use the Albert projection. All data are cut and resampled. In order to maintain spatial consistency, the spatial resolution of the data is 1 km.
| Data | Resolution | Sources | |
|---|---|---|---|
| DEM | 90M | The ‘SRTMDEM 90M Resolution Digital Elevation Model’ published by the Geospatial Data Cloud Platform of the Computer Network Information Center of the Chinese Academy of Sciences (https://www.gscloud.cn/). | |
| NDVI | 1KM | China Monthly Vegetation Index (NDVI) Spatial Distribution Dataset (http://www.resdc.cn/). | |
| Sand soil content | 1KM | Spatial distribution data of soil texture in China (http://www.resdc.cn/). | |
| Temperature | 1KM | 1-km monthly mean temperature dataset for China (1901–2022) (https://data.tpdc.ac.cn/). | |
| Precipitation | 1KM | Monthly Precipitation Dataset with 1 km Resolution in China from 1901 to 2022 (http://www.geodata.cn/). | |
| Land use/cover change | 30M | The 30 m annual land cover dataset and its dynamics in China from 1990 to 2019 (Yang and Huang 2021). | |
| The freeze-thaw disaster data | The freeze-thaw disaster data in the Tuotuo River area were collected by the research team in field investigations. |
Study methods
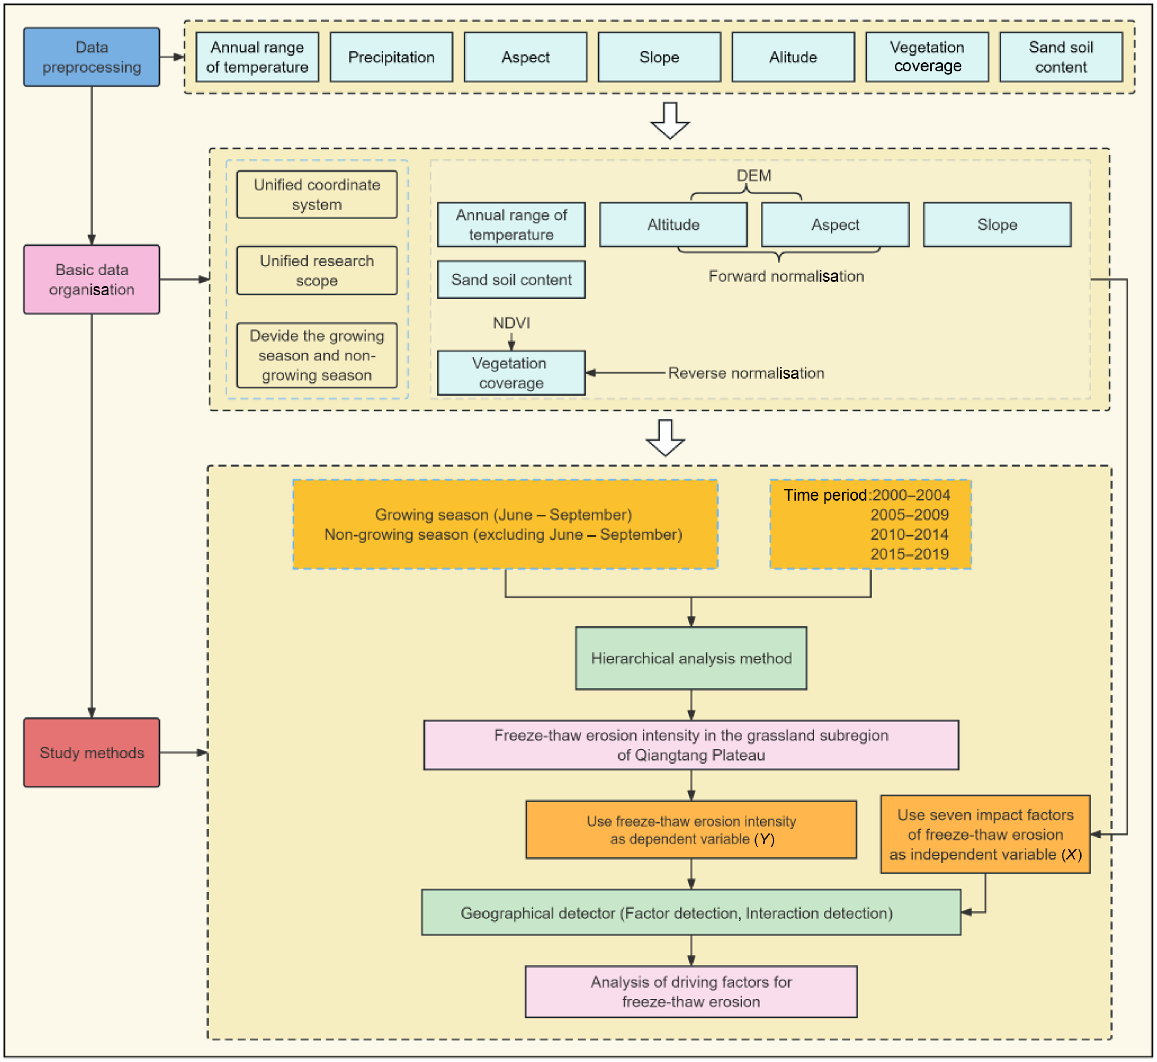
In this paper, the freeze-thaw erosion research used a graded weighted evaluation model (Wang et al. 2017). We standardised the values of evaluation factors with different units and dimensions. The weight of each factor was determined by the analytic hierarchy process and the freeze-thaw erosion intensity index was calculated by the weighted sum of the standardised value. Finally, the geographical detector (Wang and Xu 2017; Han et al. 2021) was used to quantitatively analyse the driving factors of the spatial distribution of freeze-thaw erosion in the grassland sub-region of the Qiangtang Plateau in 2000–2004, 2005–2009, 2010–2014, and 2015–2019. Technology roadmap is shown in Fig. 2.
Since different evaluation factors have different units and dimensions (Wang and Xu 2017), the evaluation of freeze-thaw erosion intensity will be affected. Therefore, it was necessary to standardise the evaluation factors. The standardised treatment method for each evaluation factor is as follows:
where Ii refers to the standardised value of each evaluation factor; I refers to the original value of each evaluation factor; Imin is the minimum value of the original value of each evaluation factor; and Imax is the maximum value of the original value of each evaluation factor.
Based on previous research experience and the relative importance of each evaluation factor (Yan et al. 2018; Bartczak et al. 2021), we determined the judgment matrix of evaluation factors for freeze-thaw erosion. Then, we used a hierarchical analysis method to calculate the weights and perform consistency tests. Consistency ratio (CR) = 0.016 < 0.1, which passes the consistency test. Table 2 shows the weights of each evaluation factor.
| Factor | Annual range of temperature (°C) | Precipitation (mm) | Vegetation coverage (%) | Aspect (°) | Slope (°) | Altitude (m) | Sand soil content (%) | |
|---|---|---|---|---|---|---|---|---|
| Weight | 0.315 | 0.124 | 0.079 | 0.198 | 0.198 | 0.035 | 0.052 |
Finally, the comprehensive evaluation index was obtained by using the weighted sum method. The weighted sum formula of each evaluation factor is as follows:
where I is the comprehensive evaluation index of freeze-thaw erosion; Ii is the assignment of factor i; Wi is the weight of the first factor; and n is the number of evaluation factors. Using formula 2, the comprehensive evaluation index of freeze-thaw erosion in the grassland sub-region of the Qiangtang grasslands is obtained. The comprehensive evaluation index for the non-growing season is between 0.00 and 0.97, and the growing season is between 0.00 and 0.95. The natural break point method is used to re-classify the comprehensive evaluation index, which is divided into five grades: slight, mild, moderate, severe, and intense erosion.
The main advantages of using a geographical detector are that they can probe both numerical and qualitative data and associated interactions. The freeze-thaw erosion intensity was the dependent variable. The seven impact factors of freeze-thaw erosion were the independent variables. Half of the standard deviation of the data was the step length to determine a boundary point from the middle point to both ends, and then the standard deviation was used as the step length to determine the same distance from the two boundary points to both ends. Then, attribute values of each impact factor were classified into five equal ranges (Li et al. 2015). The independent variable factors were reclassified into five levels and were changed from numerical quantity to type quantity, as shown in Table 3. Then, through factor detection and interaction detection, the impact of various factors and their interaction on freeze-thaw erosion was quantitatively analysed. The core of factor detection is that if there is an independent variable x that affects a dependent variable y, then the spatial distribution of the independent variable and the spatial distribution of the dependent variable should have convergence. The calculation is:
where q is the value of the probe force of the probe factor against the independent variable, q∈[0,1]. The larger the q value, the stronger the independent variable x can explain the dependent variable y. N and σ2 represent the total sample size and the variance of the study area, respectively. L represents the number of probe partitions. Ni and σ2 represent the sample size and the variance for the different partitions.
| Factor type | Property value classification | ||||||||||
|---|---|---|---|---|---|---|---|---|---|---|---|
| 1 | 2 | 3 | 4 | 5 | |||||||
| NGS | GS | NGS | GS | NGS | GS | NGS | GS | NGS | GS | ||
| Annual range of temperature (°C) | 0–15 | 0–2.2 | 15–16 | 2.2–2.7 | 16–18 | 2.7–3.7 | 18–19 | 3.7–4.2 | 19–25 | 4.2–10 | |
| Precipitation (mm) | 0–5 | 4–40 | 5–27 | 40–100 | 27–73 | 100–221 | 73–95 | 221–281 | 95–600 | 281–1000 | |
| Vegetation coverage (%) | 80–100 | 54–100 | 60–80 | 43–54 | 40–60 | 21–43 | 20–40 | 10–21 | 0–20 | 0–10 | |
| Sand soil content (%) | 0–36 324–360 | 36–72 288–324 | 72–108 252–288 | 108–144 216–252 | 144–216 | ||||||
| Altitude (m) | 0–4 | 4–10 | 10–17 | 17–26 | 26–71 | ||||||
| Slope (°) | 2585–4683 | 4683–4844 | 4844–5166 | 5166–5327 | 5327–7669 | ||||||
| Aspect (°) | 0–53 | 53–59 | 59–71 | 71–77 | 77–94 | ||||||
As shown in Table 4, interaction detection determines the type and direction of interaction by calculating the q value of independent variables x1 and x2 for dependent variable y and the q value of x1 and x2 for y after the interaction and then comparing the q value of a single factor with the q value of double factor after the interaction. The interaction relationship can be divided into nonlinear weakening, single-factor nonlinear weakening, two-factor enhancement, independence, and nonlinear enhancement (Jiao et al. 2022).
| Judgment basis | Interaction type | Judgment basis | Interaction type | |
|---|---|---|---|---|
| Nonlinear weakening | Independence | |||
| Single-factor nonlinear weakening | Nonlinear enhancement | |||
| Two-factor enhancement |
x1, x2 denote the selected driving factors; ∩ denotes the interaction of x1 and x2.
Range of freeze-thaw erosion
Freeze-thaw erosion area refers to the area characterised by strong freeze-thaw action and the corresponding freeze-thaw erosion landform. The key to judging whether an area belongs to the freeze-thaw erosion area is to see whether the erosion power of the area is mainly of freeze-thaw action. In this paper, the formula adopted by the first national water conservancy general survey on water and soil loss is used to determine the lower boundary of the altitude of the freeze-thaw area on the Qinghai–Tibet Plateau. The annual average temperature of the area above this boundary is below 0°C and the surface is in a state of freezing or freeze-thaw replacement for more than 6 months of the year (Ni et al. 2021; Wang and Gao 2022).
The calculation is:
where H is the elevation (m) at the lower boundary of the freeze-thaw erosion zone; X is the longitude (°N); and Y is the latitude (°E).
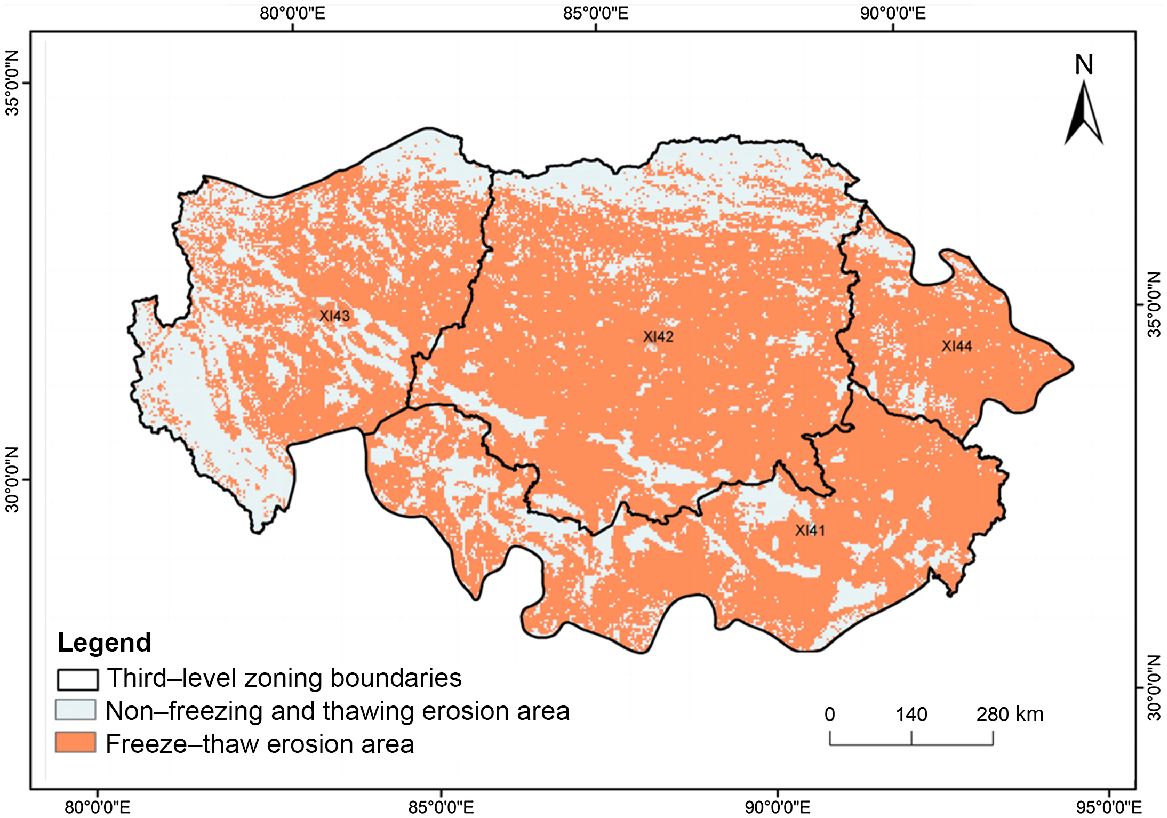
We used formula 4 to extract the basic range of the freeze-thaw erosion zone, as shown in Fig. 3.
Results
Division of the growing season and non-growing season
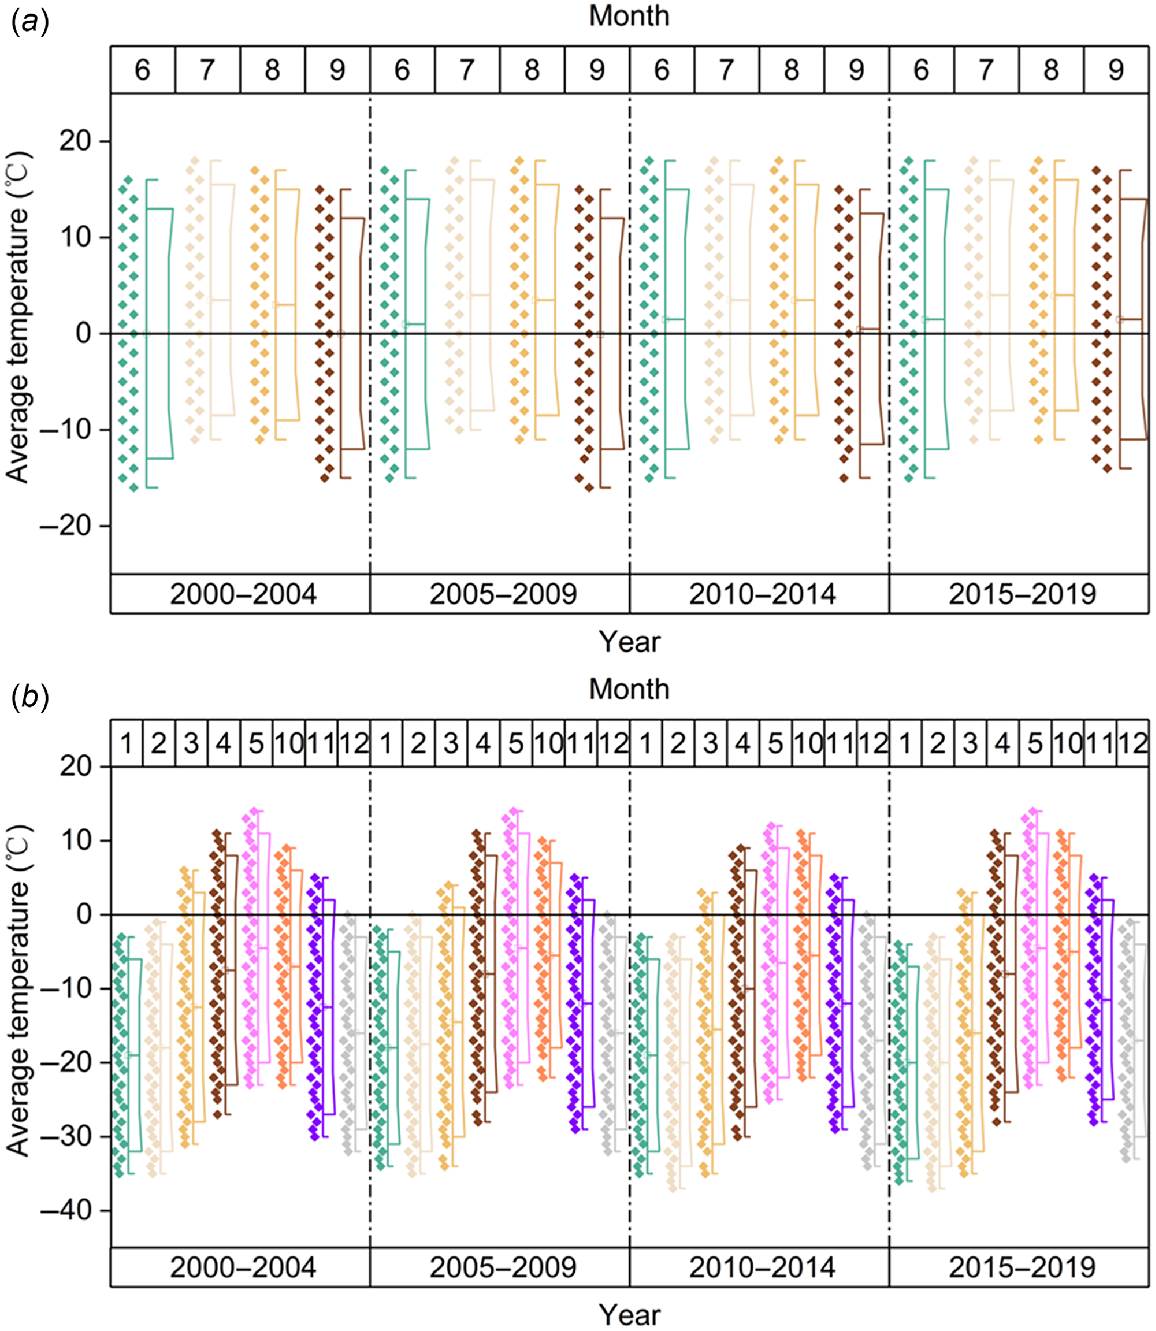
The average temperature in the extraction research area from 2000 to 2019 is shown in Fig. 4a, b. The average temperature in the growing season fluctuates around 0°C, and the average temperature in July and August is higher. The average temperature in the growing season increases over time. The average temperature in the non-growing season is mostly below 0°C, with the average temperature in April, May, and October being higher. When the temperature is ≤0°C, the surface is frozen. The freeze-thaw effect is strong with the drastic change of temperature between day and night, and the freeze-thaw effect is the strongest when the temperature fluctuates around 0°C. The freezing and melting of water in the rock voids or cracks are frequent, which deepens and expands the cracks so that the rock collapses into rock debris (Liu et al. 2021). There are obvious differences in temperature between the growing season and the non-growing season. Temperature is the primary influencing factor of freeze-thaw erosion (Li and Fang 2016).
Space and time variation of freeze-thaw erosion
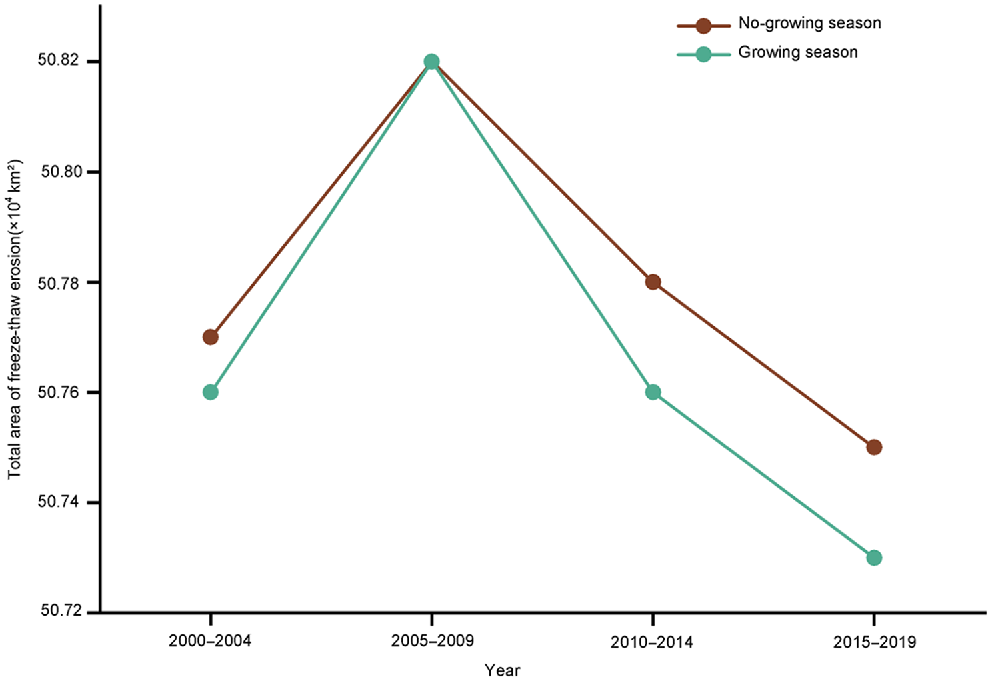
The change of freeze-thaw erosion area in the grassland sub-region of the Qiangtang grasslands in different periods is shown in Fig. 5. The total area of freeze-thaw erosion in the non-growing season and the growing season in 2015–2019 was 507,500 km2 and 507,300 km2, respectively. The maximum area of freeze-thaw erosion in the non-growing season and the growing season in 2005–2009 was 508,200 km2. The total area of freeze-thaw erosion in the non-growing season was higher than that in the growing season in the rest of the period.
Moderate and above freeze-thaw erosion area in non-growing season is shown in Table 5, and the areas accounted for the largest proportion in 2015–2019, reaching 92.75%, which is 23% higher than the lowest period of the same grade. The area of moderate and below freeze-thaw erosion is the largest in 2005–2009, reaching 31.25%. The non-growing season from 2000 to 2009 was dominated by moderate erosion, and then the area of severe erosion increased and became the main erosion type. The area of moderate and above freeze-thaw erosion in the growing season accounted for the largest proportion in 2000–2004, reaching 83.85%, which is 10.97% higher than the lowest period of the same grade. The area of moderate and below freeze-thaw erosion in the growing season accounted for the largest proportion in 2010–2014, reaching 27.12%. The growing season is dominated by moderate erosion from 2000 to 2019. The area of moderate erosion and severe erosion in the non-growing season and the growing season does not change significantly with time. The area of severe erosion in the non-growing season fluctuates, and the area of severe erosion in the growing season has decreased fluctuation, but the difference is not obvious. The proportion of freeze-thaw erosion areas below moderate and freeze-thaw erosion areas above moderate in the non-growing season is higher than that in the growing season. The freeze-thaw erosion in the growing season is dominated by moderate erosion and severe erosion. The non-growing season is dominated by moderate erosion before 2005 and severe erosion after 2010.
| NGS | GS | |||||
|---|---|---|---|---|---|---|
| Freeze and melt erosion grade | Area (104 km2) | Accounting for the proportion of erosion zone (%) | Area (104 km2) | Accounting for the proportion of erosion zone (%) | ||
| 2000–2004 | Micro-erosion | 6.21 | 12.23 | 1.04 | 2.05 | |
| Mild erosion | 8.38 | 16.50 | 7.16 | 14.11 | ||
| Moderate erosion | 20.20 | 39.79 | 17.14 | 33.76 | ||
| Severe erosion | 8.00 | 15.76 | 17.69 | 34.86 | ||
| Intensive erosion | 7.99 | 15. 73 | 7.73 | 15.23 | ||
| Total | 50.77 | 100.00 | 50.76 | 100.00 | ||
| 2005–2009 | Micro-erosion | 7.04 | 13.85 | 2.90 | 5.70 | |
| Mild erosion | 8.84 | 17.40 | 9.03 | 17.76 | ||
| Moderate erosion | 20.70 | 40.73 | 16.30 | 32.07 | ||
| Severe erosion | 7.60 | 14.96 | 15.68 | 30.86 | ||
| Intensive erosion | 6.63 | 13.06 | 6.92 | 13.61 | ||
| Total | 50.82 | 100.00 | 50.82 | 100.00 | ||
| 2010–2014 | Micro-erosion | 1.40 | 2.75 | 3.61 | 7.12 | |
| Mild erosion | 3.13 | 6.16 | 10.16 | 20.01 | ||
| Moderate erosion | 16.15 | 31.81 | 16.36 | 32.22 | ||
| Severe erosion | 9.99 | 19.67 | 14.87 | 29.30 | ||
| Intensive erosion | 20.11 | 39.60 | 5.77 | 11.36 | ||
| Total | 50.78 | 100.00 | 50.76 | 100.00 | ||
| 2015–2019 | Micro-erosion | 0.48 | 0.95 | 1.17 | 2.30 | |
| Mild erosion | 3.20 | 6.31 | 8.16 | 16.09 | ||
| Moderate erosion | 17.24 | 33.97 | 17.66 | 34.81 | ||
| Severe erosion | 10.74 | 21.17 | 17.54 | 34.57 | ||
| Intensive erosion | 19.09 | 37.61 | 6.20 | 12.23 | ||
| Total | 50.75 | 100.00 | 50.73 | 100.00 | ||
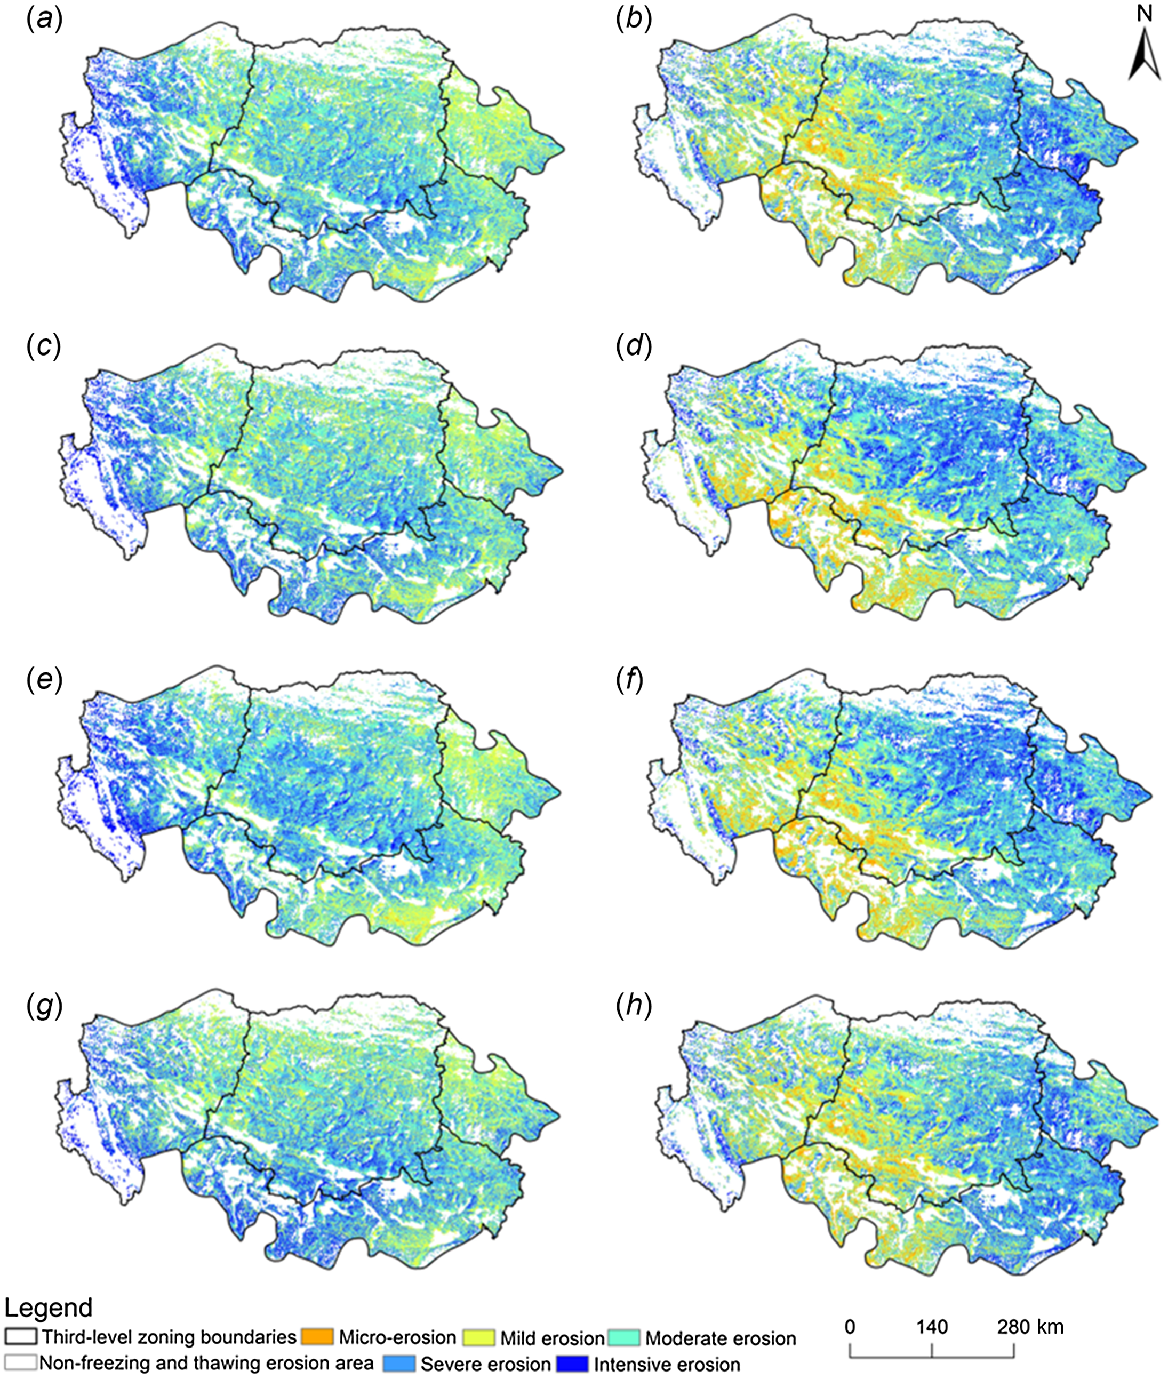
Due to the differences in temperature, precipitation, vegetation coverage, and other factors, the freeze-thaw erosion areas in the growing season and non-growing season are different. The non-freeze-thaw erosion areas are mainly distributed in the northern part of the study area, between the Himalayas and the Ali Plateau, and between the northern Tibetan Plateau and the Gangdise Mountains. The freeze-thaw erosion areas in other regions are distributed, and the non-freeze-thaw erosion areas are scattered in the middle. This is because the average annual temperature between the Himalayas and the Ali Plateau and some parts of the central region is relatively high and the altitude is relatively low. Glacial and desertification areas are distributed in the north. In the non-growing season, moderate erosion, severe erosion, and intense erosion are mainly distributed in the southwest of the grassland sub-region of the Qiangtang Plateau. The annual temperature range in this area is 0–18°C, the precipitation is 27–73 mm, and the slope of the moderately eroded area is 4–10°. The slope of the moderately eroded area is 26–71°, and the elevation is ≥4844 m. The slope direction is mixed between the sunny slope and the shady slope, whereas the slight erosion areas are only on the shady slope.
The evaporation and temperature difference of the sunny slope is much greater than that of the shady slope. The degree of freeze-thaw erosion is greater than that of the shady slope (Huang et al. 2021). Compared with the freeze-thaw erosion below moderate, the annual temperature, precipitation, slope, elevation, and freeze-thaw erosion degree of moderate, severe, and intense erosion areas are higher (Fan et al. 2022; Zhai and Fang 2023).
In the growing season, moderate erosion, severe erosion, and intense erosion are mainly distributed in the northeast of the grassland sub-region of the Qiangtang Plateau, where the annual temperature range is generally 2.7–10°C, the precipitation is 40–1000 mm, the slope of the moderately eroded area is 0–4°, the slope of the moderately eroded area is 26–71°, and the elevation of the moderately eroded area is 2585–4683 m. The elevation of the freeze-thaw erosion area above the moderate level is 5327–7669 m, which leads to a higher degree of freeze-thaw erosion (Zhang et al. 2022). The annual temperature difference, precipitation, slope, and elevation are the important factors leading to the higher degree of freeze-thaw erosion (Du et al. 2009; Lu et al. 2019).
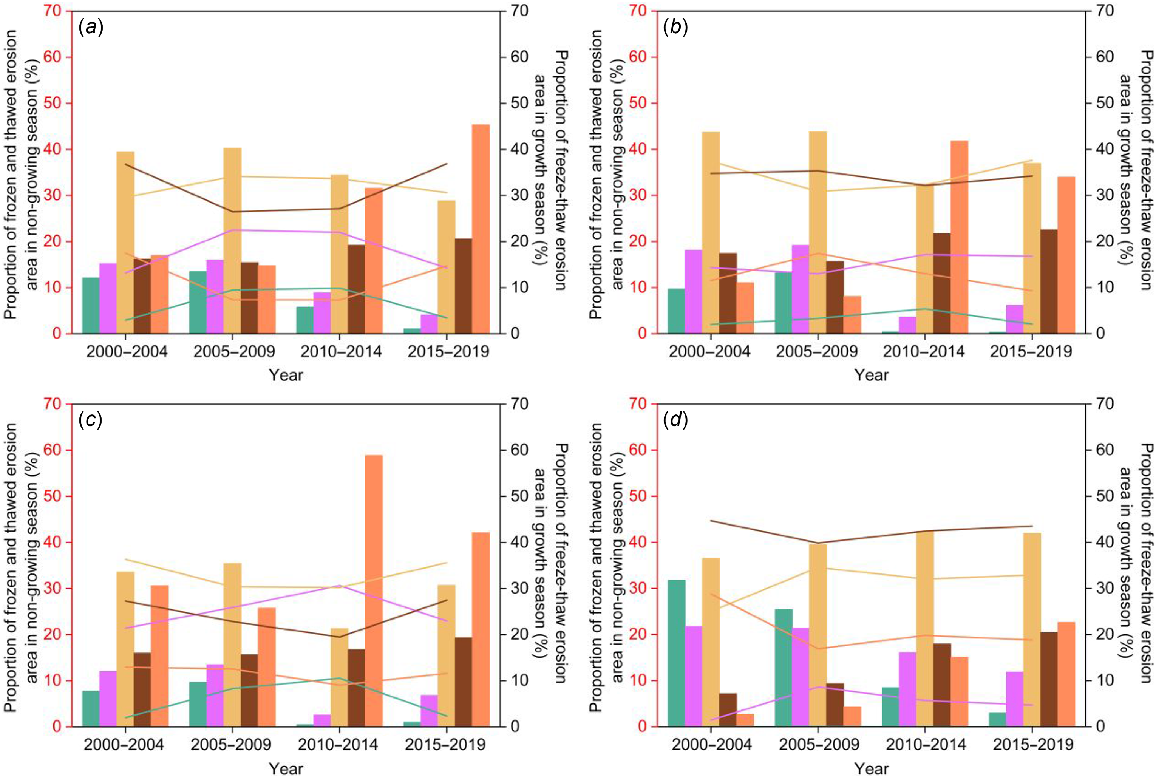
The distribution of freeze-thaw erosion in the study area is shown in Fig. 6. There are obvious differences between the freeze-thaw erosion distribution in the non-growing season and the third-level natural resource zoning in the growing season. According to the freeze-thaw erosion changes in the third-level natural resource zoning in Fig. 7, it is concluded that the severe erosion in the non-growth season is concentrated in the XI43 area. The annual temperature difference in the non-growing season is 15–19°C, the elevation is 4844–5327 m, the precipitation <0–73 mm, and the vegetation coverage is 0–60%. The slope direction is mainly semi-shaded slopes and semi-sunny slopes, with a gradient of 10–26°, and the sand content is approximately 71–94%. The area of severe erosion is the largest in 2010–2014, mainly because the vegetation coverage is lower than in other periods, and the annual temperature range is higher than in other periods. Moderate erosion in the non-growing season accounts for a large proportion of the four third-level natural resource divisions. In the growing season, XI41, XI42, and XI43 are mainly moderately eroded. XI44 has the largest proportion of heavily eroded area, with an elevation of 2585–4683 m and vegetation coverage of 54–100%. The slope direction is mainly sunny slope, with precipitation >221 mm, an annual temperature range of 2.7–4.2°C, and a sand content of 59–71%. In the growing season, the area has high precipitation, and the high sand content solar radiation of the sunny slope is higher than that of the shady slope; the evaporation and temperature differences are much greater than that of the shady slope. The degree of freeze-thaw erosion is also greater than that of the shady slope. Although the vegetation coverage is high, the inhibition of vegetation types on freeze-thaw erosion is weak, resulting in a large proportion of heavy erosion area in the growing season of the XI44 area.
Driving force analysis
It can be seen from Table 6 that the impact of driving factors on the change of freeze-thaw erosion varies in different periods. The slope, elevation, sand content, and precipitation in different periods from 2000 to 2019 have the strongest explanatory power on freeze-thaw erosion, followed by the annual range of slope direction and temperature, and the weakest explanatory power for vegetation coverage. The slope has the strongest explanatory power for the non-growing season freeze-thaw erosion. The explanatory power of the annual temperature range from 2000 to 2004 is weak, and then the explanatory power is significantly enhanced. This is because the annual temperature range from 2000 to 2004 is lower than that of other periods, and the greater the temperature difference, the more freeze-thaw erosion. The explanatory power of vegetation coverage in each period is the weakest because the vegetation coverage in the study area is greatly affected by temperature and precipitation. The temperature is low in the non-growing season, the precipitation is low, the vegetation coverage is low, and the inhibition of freeze-thaw erosion is weak. Over time, the explanatory power of vegetation coverage increased, which is due to the increased precipitation in the middle and high latitudes caused by global warming.
| Factor | Data | q | ||||
|---|---|---|---|---|---|---|
| 2000–2004 | 2005–2009 | 2010–2014 | 2015–2019 | |||
| X1 | Annual range of temperature (°C) | 0.691 | 0.915 | 0.914 | 0.946 | |
| X2 | Precipitation (mm) | 0.911 | 0.915 | 0.930 | 0.948 | |
| X3 | Vegetation coverage (%) | 0.499 | 0.503 | 0.514 | 0.519 | |
| X4 | Sand soil content (%) | 0.912 | 0.916 | 0.931 | 0.946 | |
| X5 | Altitude (m) | 0.912 | 0.917 | 0.931 | 0.948 | |
| X6 | Slope (°) | 0.918 | 0.923 | 0.933 | 0.951 | |
| X7 | Aspect (°) | 0.909 | 0.914 | 0.929 | 0.945 | |
Note: All items P < 0. 05.
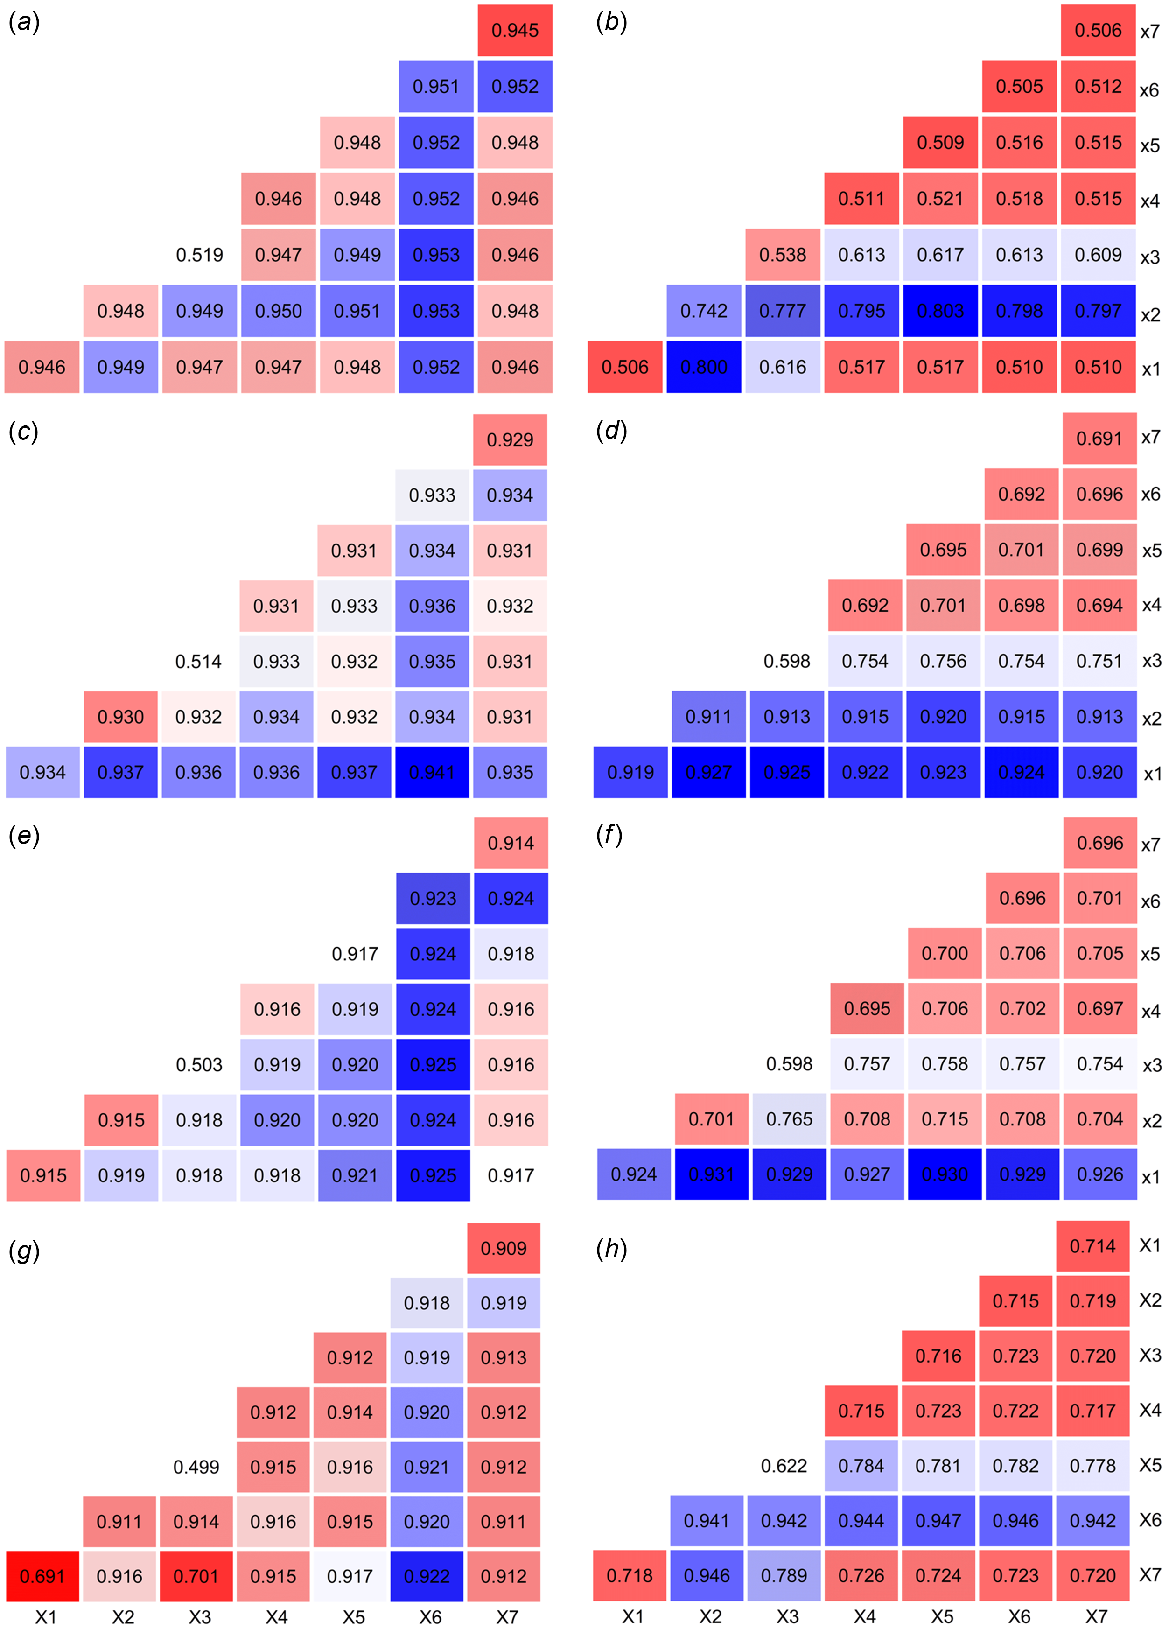
The impact of each driving factor on freeze-thaw erosion in the non-growing season has an enhanced interaction. There is a two-factor enhanced relationship between each factor, indicating that the freeze-thaw erosion change in the non-growing season in the study area is the result of the comprehensive action of all factors. The double-factor enhancement between slope and annual temperature range in 2000–2014 has the greatest impact on the change of freeze-thaw erosion. In 2015–2019, the double-factor enhancement between slope and precipitation has the greatest impact on the change of freeze-thaw erosion. The double-factor enhancement between the slope and the other six driving factors in 2000–2019 has a great impact on the freeze-thaw erosion change. The explanatory power of the single factor of vegetation coverage is low, but the explanatory power of interaction with climate and terrain factors is strong, which indicates that vegetation coverage is an indirect factor that affects the change of freeze-thaw erosion in the non-growing season. The research also shows that vegetation coverage can reduce freeze-thaw erosion by reducing soil temperature differences and stabilising the soil (Lu et al. 2019; Zhang et al. 2020b).
It can be seen from Table 7 that the impact of driving factors on the change of freeze-thaw erosion is different in different periods. The annual temperature range, precipitation, and elevation from 2000 to 2014 have the strongest explanatory power on freeze-thaw erosion, followed by sand content, slope, and aspect; vegetation coverage has the weakest explanatory power. In 2015–2019, the explanatory power of vegetation coverage increased and the explanatory power of slope decreased. On the whole, the precipitation in 2000–2004 and 2015–2019 has the strongest explanatory power on the freeze-thaw erosion in the growing season, which is due to the large precipitation in the growing season. Precipitation increases the water content of the soil, and the destructive effect of freezing on the soil will increase (Koren et al. 1999; Guo et al. 2015). At the same time, precipitation also transports freeze-thaw erosion products (Jiang et al. 2016), and plays a significant role in promoting the freeze-thaw effect (Luo et al. 2014; Yang and Huang 2021). The annual temperature range from 2005 to 2014 has the strongest explanatory power for the freeze-thaw erosion in the growing season because the annual temperature range is higher than in other periods. The explanatory power of vegetation coverage is the weakest from 2000 to 2014, which is due to the large area of alpine meadow and alpine grassland ecosystems in the area. With heavy rainfall in the growing season, the inhibition of freeze-thaw erosion is weak (Kang et al. 2018), and the interpretation of freeze-thaw erosion is weak. The explanatory power of vegetation coverage increased in 2015–2019, indicating that a series of ecological restoration measures such as ‘low grass and high grazing’ adopted by the local government has played a role (Hasbagan et al. 2019).
| Factor | Data | q | ||||
|---|---|---|---|---|---|---|
| 2000–2004 | 2005–2009 | 2010–2014 | 2015–2019 | |||
| X1 | Annual range of temperature (°C) | 0.718 | 0.924 | 0.919 | 0.506 | |
| X2 | Precipitation (mm) | 0.941 | 0.701 | 0.911 | 0.742 | |
| X3 | Vegetation coverage (%) | 0.622 | 0.598 | 0.598 | 0.538 | |
| X4 | Sand soil content (%) | 0.715 | 0.695 | 0.692 | 0.511 | |
| X5 | Altitude (m) | 0.716 | 0.700 | 0.695 | 0.509 | |
| X6 | Slope (°) | 0.715 | 0.696 | 0.692 | 0.505 | |
| X7 | Aspect (°) | 0.714 | 0.696 | 0.691 | 0.506 | |
Note: All items P < 0.05.
The impact of each driving factor on the freeze-thaw erosion in the growing season has an enhanced interaction, and there is a two-factor enhanced relationship between each factor, indicating that the freeze-thaw erosion change in the study area is the result of the comprehensive action of all factors. The double-factor enhancement between precipitation and the other six driving factors in 2000–2004 and 2015–2019 has a greater impact on the change of freeze-thaw erosion, and the annual temperature range in 2005–2014 and the double-factor enhancement between the other six driving factors have a greater impact on the change of freeze-thaw erosion. On the whole, the double-factor enhancement between precipitation and elevation in 2000–2004 and 2015–2019 has the greatest impact on freeze-thaw erosion, and the double-factor enhancement between precipitation and annual temperature range in 2005–2014 has the greatest impact. From 2000 to 2019, the explanatory power of the interaction between vegetation coverage and climate and terrain factors is stronger than that of the single factor of vegetation coverage, indicating that the vegetation coverage indirectly affects the freeze-thaw erosion change in the growing season, for the same reason as in the non-growing season. The explanatory power of vegetation coverage in each growing season to the single factor of freeze-thaw erosion is higher than in the non-growing season. This is due to the high precipitation in the growing season, rapid vegetation growth, and high vegetation coverage (Hasbagan et al. 2019; Cao et al. 2022).
From the interactive detection results, the interaction of precipitation in non-growing seasons, annual temperature range, vegetation coverage, and slope have the strongest explanatory power for the change of freeze-thaw erosion. The slope affects the amount of freeze-thaw erosion and the amount of erosion displacement. The larger the slope, the more and farther the freeze-thaw erosion products are transported (Yang and Huang 2021). The greater the precipitation, the more obvious the freeze-thaw erosion. The greater the temperature difference, the longer the duration, and the greater the degree of freeze-thaw erosion (Sun et al. 2021). Under the combined action of precipitation and gravity, the degree of freeze-thaw erosion in areas with a large slope increases, so more attention should be paid to areas with a large slope in the non-growing season.
The interaction of growth season elevation, annual temperature range, and precipitation has the strongest explanatory power for the change of freeze-thaw erosion. The greater the annual difference in elevation and temperature, the stronger the freeze-thaw erosion. The important driving force for the movement of freeze-thaw erosion products is the large precipitation in the growing season, which increases the possibility of freeze-thaw erosion. Therefore, more attention should be paid to the areas with high precipitation in the growing season. The vegetation coverage is inhibited by freeze-thaw erosion and indirectly affects the freeze-thaw erosion change. The vegetation coverage in the grassland sub-region of the Qiangtang Plateau is greatly affected by natural factors. Therefore, we should promote ecological restoration, using a combination of natural and artificial methods. Degraded alpine grassland meadows should be restored, grasslands and livestock should be balanced, some grassland grazing prohibited, and rotational grazing implemented (Hu 2020) (Fig. 8).
Analysis of freeze-thaw disasters in the Tuotuo River area
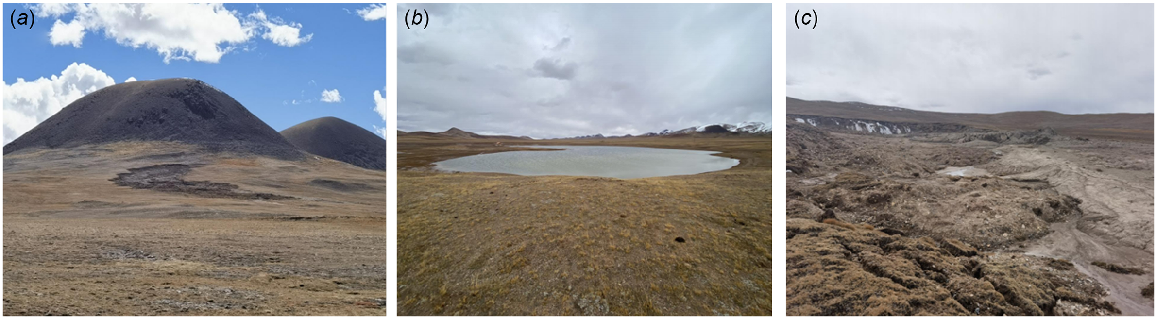
The types and distribution of freeze-thaw disasters were obtained in the Tuotuo River area from 3 to 5 October 2022. Fig. 5 shows that the area of freeze-thaw erosion changed little in 5 years, so the time-space distribution map of freeze-thaw erosion in the non-growing season of 2015–2019 and the observed data of freeze-thaw disasters are selected for overlay analysis. The freeze-thaw disaster area is located in the three-level natural resources division XI44, the high mountain and low-cover grassland and lakes on the Qiangtang Plateau. The annual temperature range in the non-growing season of the disaster area is 0–18°C, and the annual precipitation is 27–73 mm. The thawed mud flow is mainly distributed in the slightly eroded and moderately eroded areas; the slope direction is mainly semi-cloudy and sunny slopes, with a gradient of 5–29°. The thawed lakes and ponds are mainly distributed in moderately eroded and severely eroded areas, with relatively flat terrain. The vegetation is mainly alpine meadows, and the thawed collapse is mainly distributed in the slightly eroded and moderately eroded areas, with a gradient of 4–8°. The slope direction is mainly shady slopes and semi-shady slopes, with the main action force of gravity. Frost-heaving mounds and rock debris slopes are concentrated in slightly eroded areas, and the surrounding vegetation is poorly developed. The vegetation coverage in the non-growing season of the disaster area is relatively low, ranging from 0.08 to 0.2. The vegetation types are mainly alpine meadow, alpine meadow grassland, and mountain meadow, all of which have weak inhibition on freeze-thaw erosion (Fig. 9). Freeze-thaw disasters mainly include thawing mudflow, thawing lakes and ponds, and thawing collapse. The freeze-thaw erosion in the distribution area of these three kinds of freeze-thaw disasters is more serious than that in other freeze-thaw disaster areas. Freeze-thaw erosion will occur under the influence of temperature, precipitation, and so forth, leading to rock collapse. The resulting debris will be displaced under the action of gravity, ice, snow, water melting, and so forth, which may aggravate the freeze-thaw disaster (Teng et al. 2018) (Fig. 10).
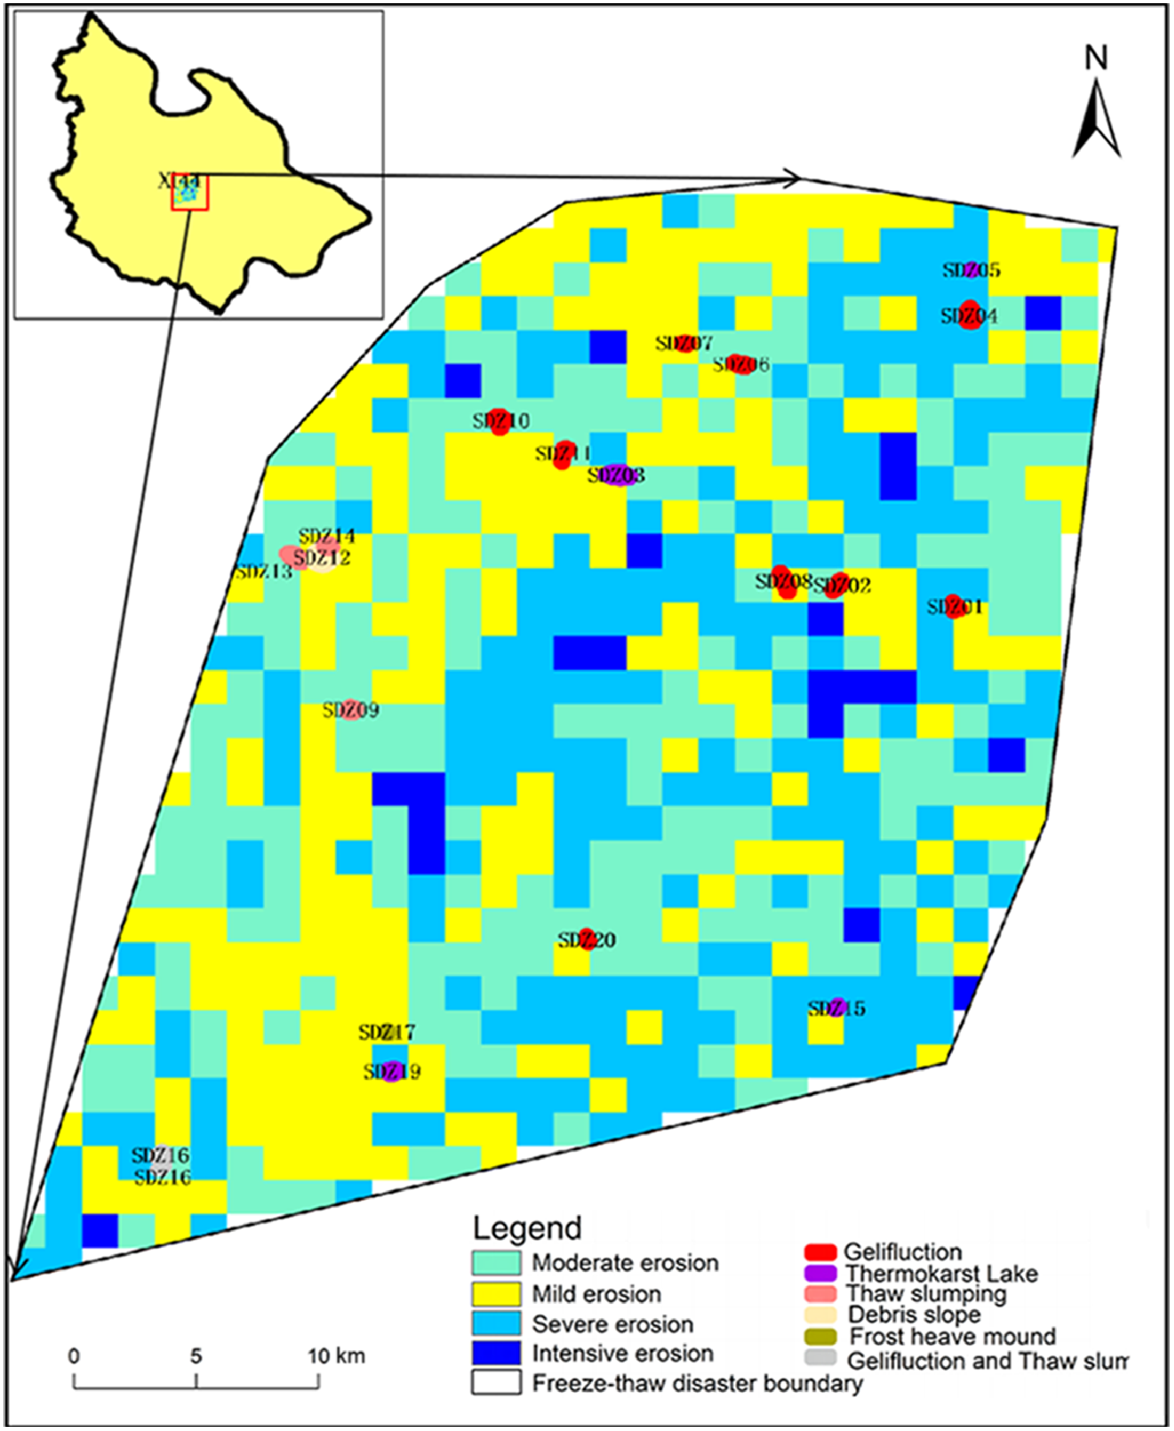
(a) The thawing mudflow caused by gravity GPS ID: GSDZ02; (b) Hot melt lake pond caused by hot melt disturbance GPS ID: GSDZ19 and Hot melt slip collapse caused by gravity GPS ID: GSDZ18; (c) Project name: Ecological environment investigation and evaluation in the Tuotuo River area of the Yangtze River.
Discussion and conclusions
Discussion
Previous studies have indicated that freeze-thaw erosion is often analysed based on a yearly timescale. Due to factors such as climate, variations in precipitation, temperature, and other elements can occur at different times. These factors can influence the intensity of freeze-thaw erosion, making it more scientifically meaningful to analyse it separately during the growing season and non-growing season.
This study analyses the spatiotemporal variations and driving factors of freeze-thaw erosion intensity in the grassland subzone of the Qiangtang Plateau. The findings indicate that natural factors have a significant influence on freeze-thaw erosion in the study area. During the non-growing season, slope gradient has the greatest impact on freeze-thaw erosion, with slopes greater than 17° experiencing moderate to severe erosion. Under the combined effects of precipitation, annual temperature differences, and other factors, freeze-thaw erosion is expected to intensify. The warming climate during the non-growing season is expected to impact the stability of ecosystems (De Boeck et al. 2007; Turner and Henry 2010) which could be a significant factor contributing to the increase in severe erosion areas. During the growing season, freeze-thaw erosion is primarily influenced by precipitation and annual temperature differences. With increased precipitation during this period, the moisture content of the soil increases, leading to greater soil damage during freezing (Teng et al. 2018). Precipitation also provides the driving force for the transportation of freeze-thaw erosion products (Xue et al. 2023), thus significantly promoting the freeze-thaw process. Additionally, a larger temperature difference increases the likelihood of freeze-thaw erosion occurring. It can be seen that the total area of freeze-thaw erosion showed a growing trend from 2000 to 2009, from Fig. 5. The total area of freeze-thaw erosion during both the non-growing season and the growing season was at its maximum from 2005 to 2009, and the freeze-thaw erosion areas were the same. This may be attributed to the increased precipitation and noticeable temperature rise during the growing season in this period, which facilitated the expansion of freeze-thaw erosion areas. During the non-growing season, the increase in freeze-thaw erosion areas may be influenced by the noticeable temperature rise. This also led to similar growth trends in freeze-thaw erosion in both periods (Du et al. 2020; Cao et al. 2022). Freeze-thaw erosion is also affected by soil properties, vegetation type, and other factors, which will be studied in these aspects.
The influencing factors of freeze-thaw erosion in this study are consistent with previous research. However, freeze-thaw erosion is influenced by climate and other factors, and the spatiotemporal distribution and primary influencing factors of freeze-thaw erosion vary across different periods. Vegetation can effectively inhibit freeze-thaw erosion. In the study area, vegetation coverage is greatly influenced by climate and grazing. Therefore, it is necessary to enhance the restoration of degraded alpine meadows, implement balanced grazing practices and rotational grazing in grasslands, restore degraded grassland ecosystems, and suppress the occurrence of freeze-thaw erosion (Duan et al. 2022; Zhou et al. 2023). In the Tuotuo River region, freeze-thaw disasters such as thawing mudflows are primarily caused by natural factors including climate. Thawing lakes and ponds are most affected by freeze-thaw erosion, and the impact of freeze-thaw erosion increases the likelihood of freeze-thaw disasters, thereby affecting the livelihood of local residents, as well as the construction of roads and water projects. Furthermore, remote sensing imagery and machine learning algorithms can be integrated to enhance the prediction and periodic monitoring of freeze-thaw disasters (Wang et al. 2010).
Conclusion
By selecting seven freeze-thaw erosion impact factors, such as annual temperature range, precipitation, and slope, as the evaluation indicators of freeze-thaw erosion in the grassland sub-region of the Qiangtang Plateau, the spatiotemporal distribution of freeze-thaw erosion intensity and freeze-thaw erosion driving factors in the non-growing season and growing season in the study area were analysed.
The total area of freeze-thaw erosion in the non-growing and growing season in the study area is 507,800 km2 and 507,700 km2, respectively. The non-growing season is dominated by moderate erosion before 2005 and severe erosion after 2010. Moderate or higher freeze-thaw erosion in the non-growing season is mainly distributed on the Ali Plateau, the southwest of the northern Tibetan Plateau, and the northern Gangdise Mountains. The growing season is dominated by moderate and severe erosion. Moderate or more freeze-thaw erosion in the growing season is mainly distributed on the Hoh Xili Mountain, the northern Gangdise Mountains, and the eastern part of the northern Tibetan Plateau; a small amount is found on the Ali Plateau.
Freeze-thaw erosion of moderate and above moderate categories in the non-growing season is mainly distributed in areas with an annual temperature range of 0–18°C, precipitation of 27–73 mm, vegetation coverage of 20–40%, sand content of 59–71%, moderate erosion area elevation of 4844–5166 m, moderate and above freeze-thaw erosion area elevation of 5327–7669 m, a slope of 17–71°, and slope direction of shady and sunny slopes. Freeze-thaw erosion above moderate in the growing season is mainly distributed in the annual temperature range of 2.7–10°C, precipitation of 281–1000 mm, vegetation coverage of 21–43%, sand content of 59–71%, and the elevation of moderate erosion area is 2585–4683 m. The elevation of the freeze-thaw erosion area above moderate level is 5327–7669 m, and the slope is 0–10°.
The driving factors of the non-growing and growing seasons have a double-factor strengthening relationship. The slope of the non-growing season has the strongest explanatory power for the single factor of freeze-thaw erosion change, and the interaction of precipitation, annual temperature range, and vegetation coverage, and the slope has the strongest explanatory power for freeze-thaw erosion change. The annual range of precipitation and temperature in the growing season has the strongest explanatory power for the single factor of freeze-thaw erosion change, and the interaction between precipitation and elevation and annual range of temperature has the strongest explanatory power for freeze-thaw erosion change. The single factor of vegetation coverage has weak explanatory power, but vegetation coverage indirectly affects the freeze-thaw erosion change.
Freeze-thaw erosion in the Tuotuo River area is mainly distributed in the moderately eroded area with a gradient of 4–29°. The vegetation coverage in the disaster area is relatively low in the non-growing season, ranging from 0.08 to 0.2. The vegetation types are mainly alpine meadow, alpine meadow grassland, and mountain meadow.
Data availability
The data that support this study are available in the Geospatial Data Cloud Platform (https://www.gscloud.cn), the Resource and Environment Science and Data Center (https://www.resdc.cn) the National Qinghai-Tibet Plateau Scientific Data Center (https://data.tpdc.ac.cn) the National Earth System Science Data Center (http://www.geodata.cn), and Earth System Science Data (https://doi.org/10.5194/essd-13-3907-2021). The freeze-thaw disaster data in the Tuotuo River area were collected by the research team in field investigations.
Declaration of funding
This study was supported by the Research on Integrated Technology System of Natural Resources Observation and Monitoring (no. DD20230514).
References
Barnes N, Luffman I, Nandi A (2016) Gully erosion and freeze-thaw processes in clay-rich soils, northeast Tennessee, USA. GeoResJ 9-12, 67-76.
| Crossref | Google Scholar |
Bartczak A, Kaczmarek H, Badocha M, Krzemiński M, Tyszkowski S (2021) Measured and predicted freeze-thaw days frequencies in climate change conditions in central Poland. PeerJ 9, e12153.
| Crossref | Google Scholar | PubMed |
Cao Y-N, Sun M-X, Chen M-R, He Y-T, Song H-L (2022) Effects of precipitation on the vegetation coverage in the northern Tibetan Plateau from 2000 to 2016. Acta Agrestia Sinica 30(3), 721-730.
| Crossref | Google Scholar |
Chen J, Lu Q, Liu Y, He C, Yan F (2023) Distribution and influencing factors of freeze-thaw desertification degradation areas on the Qinghai-Tibet Plateau. Soil and Water Conservation Research 30(03), 103-110.
| Crossref | Google Scholar |
Cui JJ, Xin ZB, Huang YZ (2023) Spatial and temporal variability of freeze-thaw erosion on the Tibetan Plateau from 2003 to 2020. Acta Ecologica Sinica 43(11), 4515-4526.
| Google Scholar |
De Boeck HJ, Lemmens CMHM, Gielen B, Bossuyt H, Malchair S, Carnol M, Merckx R, Ceulemans R, Nijs I (2007) Combined effects of climate warming and plant diversity loss on above- and below-ground grassland productivity. Environmental and Experimental Botany 60(1), 95-104.
| Crossref | Google Scholar |
Du E, Zhao L, Li R (2009) The application of ground penetrating radar to permafrost investigation in Qilian Mountains. Journal of Glaciology and Geocryology 31(2), 364-371.
| Google Scholar |
Du J, Niu XJ, Yuan L, Ci WDZ (2020) Changes in terrestrial ecological environment of Qiangtang National Nature Reserve, 1971–2017. Journal of Glaciology and Geocryology 42(03), 1017-1026.
| Google Scholar |
Duan C, Shi P, Zong N, Zhang X, Yu C (2022) Assessing rangeland sensitivity to degradation in North Tibet. Rangeland Ecology & Management 84, 86-97.
| Crossref | Google Scholar |
Fan J, Xu F, Zhang X, Zhang X, Liang B (2022) Evaluating the sensitivity and influential factors of freeze-thaw erosion in Tibet, China. Frontiers in Earth Science 10, 992842.
| Crossref | Google Scholar |
Guo B, Zhou Y, Zhu J, Liu W, Wang F, Wang L, Jiang L (2015) An estimation method of soil freeze-thaw erosion in the Qinghai–Tibet Plateau. Natural Hazards 78, 1843-1857.
| Crossref | Google Scholar |
Guo B, Zhang F, Yang G, Jiang L (2017) Improved method of freeze–thaw erosion for the Three-River Source Region in the Qinghai–Tibetan Plateau, China. Geomatics, Natural Hazards and Risk 8(2), 1678-1694.
| Crossref | Google Scholar |
Guo Y, Peng C, Zhu Q, Wang M, Wang H, Peng S, He H (2019) Modelling the impacts of climate and land use changes on soil water erosion: model applications, limitations and future challenges. Journal of Environmental Management 250, 109403.
| Crossref | Google Scholar | PubMed |
Han J, Wang J, Chen L, Xiang J, Ling Z, Li Q, Wang E (2021) Driving factors of desertification in Qaidam Basin, China: an 18-year analysis using the geographic detector model. Ecological Indicators 124, 107404.
| Crossref | Google Scholar |
Hasbagan G, Hu G, Gao Q, Jiangcun W, Danjiu L, Can M, Basang W, Yang F, Wei X, Yang Y (2019) Synergetic mode for grassland ecological management and animal husbandry development in Northern Tibet Plateau. Strategic Study of Chinese Academy of Engineering 21(5), 93-98.
| Crossref | Google Scholar |
Hu M (2020) The overall plan for major projects of national important ecosystem protection and restoration (2021-2035) has been officially released. Petroleum Refinery Engineering 50(7), 40.
| Google Scholar |
Huang K, Zhang Y, Zhu J, Liu Y, Zu J, Zhang J (2016) The influences of climate change and human activities on vegetation dynamics in the Qinghai-Tibet Plateau. Remote Sensing 8(10), 876.
| Crossref | Google Scholar |
Huang D, Zhou L, Fan H, Jia Y, Liu M (2021) Responses of aggregates and associated soil available phosphorus, and soil organic matter in different slope aspects, to seasonal freeze–thaw cycles in Northeast China. Geoderma 402, 115184.
| Crossref | Google Scholar |
Jiang C, Nie Z, Mu X, Wang F, Liu W (2016) Potential evapotranspiration change and its attribution in the Qinling Mountains and surrounding area, China, during 1960–2012. Journal of Water and Climate Change 7(3), 526-541.
| Crossref | Google Scholar |
Jiao L, Yang R, Zhang Y, Yin J, Huang J (2022) The evolution and determinants of ecosystem services in Guizhou – a typical Karst Mountainous Area in Southwest China. Land 11(8), 1164.
| Crossref | Google Scholar |
Kang L, Zhou T, Gan Y, Sun J, Wang J (2018) Spatial and temporal variation characteristics of soil erosion in the Qinghai-Tibet Plateau from 1984 to 2013. Chinese Journal of Applied and Environmental Biology 24(2), 245-253.
| Crossref | Google Scholar |
Kong B, Yu H (2013) Estimation model of soil freeze-thaw erosion in Silingco watershed wetland of northern Tibet. The Scientific World Journal 2013, 636521.
| Crossref | Google Scholar |
Koren V, Schaake J, Mitchell K, Duan Q-Y, Chen F, Baker JM (1999) A parameterization of snowpack and frozen ground intended for NCEP weather and climate models. Journal of Geophysical Research: Atmospheres 104(D16), 19569-19585.
| Crossref | Google Scholar |
Li Z, Fang H (2016) Impacts of climate change on water erosion: a review. Earth-Science Reviews 163, 94-117.
| Crossref | Google Scholar |
Li C, Ma J, Tang Z, Zhou W (2011) GIS based evaluation on intensity of freeze-thaw erosion in head water region of the three river source area. Soil and Water Conservation in China 4, 41-43.
| Google Scholar |
Li D, Wei X, Li Y (2015) Sensitivity evaluation of freeze - Thaw Erosion in Gansu Province based on RS and GIS. Research of Soil and Water Conservation 22(2), 1-6.
| Google Scholar |
Li Q, Liu Y, Kou D, Peng Y, Yang Y (2022) Substantial non-growing season carbon dioxide loss across Tibetan alpine permafrost region. Global Change Biology 28(17), 5200-5210.
| Crossref | Google Scholar | PubMed |
Li J, Wang G, Li K, Li Y, Guo L, Song C (2023) Impacts of climate change and freeze–thaw cycles on water and sediment fluxes in the headwater region of the Yangtze River, Qinghai–Tibet Plateau. Catena 227, 107112.
| Crossref | Google Scholar |
Liu D, Cao C, Dubovyk O, Tian R, Chen W, Zhuang Q, Zhao Y, Menz G (2017) Using fuzzy analytic hierarchy process for spatio-temporal analysis of eco-environmental vulnerability change during 1990–2010 in Sanjiangyuan region, China. Ecological Indicators 73, 612-625.
| Crossref | Google Scholar |
Liu J-L, Fan J-R, Zhang X-Y, Yang C, Xu F-B, Zhang X-X, Liang B (2021) Remote sensing estimation of vegetation cover in alpine grassland in the growing and non-growing seasons. Acta Prataculturae Sinica 30(9), 15-26.
| Crossref | Google Scholar |
Liu J, Xin Z, Huang Y, Yu J (2022) Climate suitability assessment on the Qinghai-Tibet Plateau. Science of The Total Environment 816, 151653.
| Crossref | Google Scholar | PubMed |
Lu Y, Zhang T, Liu Y, You Y, Feng C, Kong W (2019) Evaluation and spatial distribution characteristics of freeze-thaw erosion intensity in the Yalu Tsangpo River basin on the basis of geographic information system. Geomatics, Natural Hazards and Risk 10, 1047-1069.
| Crossref | Google Scholar |
Lu Y, Liu C, Ge Y, Hu Y, Wen Q, Fu Z, Wang S, Liu Y (2021) Spatiotemporal characteristics of freeze-thawing erosion in the source regions of the Chin-Sha, Ya-Lung and Lantsang Rivers on the basis of GIS. Remote Sensing 13(2), 309.
| Crossref | Google Scholar |
Luo D, Jin H, Lü L, Wu Q (2014) Spatiotemporal characteristics of freezing and thawing of the active layer in the source areas of the Yellow River (SAYR). Chinese Science Bulletin 59, 3034-3045.
| Crossref | Google Scholar |
Ni J, Wu T, Zhu X, Wu X, Pang Q, Zou D, Chen J, Li R, Hu G, Du Y, Hao J, Li X, Qiao Y (2021) Risk assessment of potential thaw settlement hazard in the permafrost regions of Qinghai-Tibet Plateau. Science of The Total Environment 776, 145855.
| Crossref | Google Scholar | PubMed |
Sun B, Ren F, Ding W, Zhang G, Huang J, Li J, Zhang L (2021) Effects of freeze-thaw on soil properties and water erosion. Soil and Water Research 16(4), 205-216.
| Crossref | Google Scholar |
Teng H, Liang Z, Chen S, Liu Y, Viscarra Rossel RA, Chappell A, Yu W, Shi Z (2018) Current and future assessments of soil erosion by water on the Tibetan Plateau based on RUSLE and CMIP5 climate models. Science of The Total Environment 635, 673-686.
| Crossref | Google Scholar | PubMed |
Turner MM, Henry HAL (2010) Net nitrogen mineralization and leaching in response to warming and nitrogen deposition in a temperate old field: the importance of winter temperature. Oecologia 162, 227-236.
| Crossref | Google Scholar | PubMed |
Vickers NJ (2017) Animal communication: when i’m calling you, will you answer too? Current Biology 27(14), R713-R715.
| Crossref | Google Scholar | PubMed |
Wang X, Gao B (2022) Frozen soil change and its impact on hydrological processes in the Qinghai Lake Basin, the Qinghai-Tibetan Plateau, China. Journal of Hydrology: Regional Studies 39, 100993.
| Crossref | Google Scholar |
Wang J, Xu C (2017) Geodetector: principle and prospective. Acta Geographica Sinica 72(1), 116-134.
| Crossref | Google Scholar |
Wang JS, Zhang XZ, Zhao YP, Qin SG, Wu JS (2010) Spatiotemporal pattern of alpine grassland productivity in Qiangtang Plateau. The Journal of Applied Ecology 21(6), 1400-1404.
| Google Scholar |
Wang Z, Sha ZJ, Ma YJ, Hu J, Zhai Y, Ma H (2017) Intensity and spatial distribution characteristics of soil freeze-thaw erosion in alpine steppe region based on GIS. Journal of Earth Environment 8(1), 55-64.
| Google Scholar |
Wang L, Yu H, Zhang Q, Xu Y, Tao Z, Juha A, Dai J (2018) Responses of aboveground biomass of alpine grasslands to climate changes on the Qinghai-Tibet Plateau. Journal of Geographical Sciences 28, 1953-1964.
| Crossref | Google Scholar |
Wu KN, Zhao R (2019) Soil texture classification and its application in China. Acta Pedologica Sinica 56(1), 227-241.
| Google Scholar |
Wu Y, Ouyang W, Hao Z, Lin C, Liu H, Wang Y (2018) Assessment of soil erosion characteristics in response to temperature and precipitation in a freeze-thaw watershed. Geoderma 328, 56-65.
| Crossref | Google Scholar |
Xue T, Zhang C, He Y, Chen X, Fu Y (2023) Study on soil erodibility and related factors of different land use types in the black soil area of Northeast China. International Core Journal of Engineering 9(5), 30-38.
| Crossref | Google Scholar |
Yan O, Shen W, Yang K, Lin N (2014) Evolution trend of freeze-thaw erosion in the Yarlung Zangbo River Basin in the past 20 years. Journal of Mountain Science 32(04), 417-422.
| Crossref | Google Scholar |
Yan M, Zhang W, Zhang Z, Wang L, Ren H, Jiang Y, Zhang X (2018) Responses of soil C stock and soil C loss to land restoration in Ili River Valley, China. Catena 171, 469-474.
| Crossref | Google Scholar |
Yang J, Huang X (2021) The 30 m annual land cover dataset and its dynamics in China from 1990 to 2019. Earth System Science Data 13(8), 3907-3925.
| Crossref | Google Scholar |
Zhai Y, Fang H (2023) Spatiotemporal variations of freeze-thaw erosion risk during 1991–2020 in the black soil region, northeastern China. Ecological Indicators 148, 110149.
| Crossref | Google Scholar |
Zhang H, Fan J, Huang L, Tang Y, Yue Y, Yang Y, Liu X (2020a) Theories and technical methods for the comprehensive regionalization of natural resources in China. Resources Science 42, 1870.
| Google Scholar |
Zhang S, Wang X, Xiao Z, Qu F, Wang X, Li Y, Aurangzeib M, Zhang X, Liu X (2020b) Quantitative studies of gully slope erosion and soil physiochemical properties during freeze-thaw cycling in a Mollisol region. Science of The Total Environment 707, 136191.
| Crossref | Google Scholar | PubMed |
Zhang L, Ren F, Li H, Cheng D, Sun B (2021) The influence mechanism of freeze-thaw on soil erosion: a review. Water 13(8), 1010.
| Crossref | Google Scholar |
Zhang G, Yang Y, Liu Y, Wang Z (2022) Advances and prospects of soil erosion research in the black soil region of northeast China. Journal of Soil and Water Conservation 36, 1-12.
| Google Scholar |
Zhao Y, Wang E, Cruse RM, Chen X (2012) Characterization of seasonal freeze-thaw and potential impacts on soil erosion in northeast China. Canadian Journal of Soil Science 92(3), 567-571.
| Crossref | Google Scholar |
Zhou H, Yang X, Zhou C, Shao X, Shi Z, Li H, Su H, Qin R, Chang T, Hu X, Yuan F, Li S, Zhang Z, Ma L (2023) Alpine grassland degradation and its restoration in the Qinghai–Tibet Plateau. Grasses 2(1), 31-46.
| Crossref | Google Scholar |