

Trenching and compost sustain grain yield increases over nine years on deep sands but at a cost
David J. M. Hall A * and Tom J. Edwards A
A
Abstract
Crops grown on deep sands on the south coast of WA are limited by soil physical and chemical properties including compaction and poor nutrition.
Crops grown on deep sands on the south coast of Western Australia are limited by soil physical and chemical properties including compaction and poor nutrition. Our aim was to determine what effects deep-placed organic amendments have on soil properties and crop production in a deep sand and whether such amendments are profitable.
A long-term field trial was conducted over nine years (2015–2023) to investigate soil amendments including lime (0 and 2 t ha−1) and composted chicken litter (0, 10 and 20 t ha−1) with and without incorporation in trenches (0.1 m wide, 0.5 m deep spaced at 0.9 m) in an incomplete factorial design on crop yields, soil chemistry, soil physical properties, root growth and economics.
Grain yields were increased by more than 1 t ha−1 yr−1 where compost and lime were incorporated to 0.5 m. Grain yields for the highest yielding treatments were at or near their rainfall limited yield potential. The yields for surface applied compost did not differ to those that were trenched. The yield increases were attributed to higher nutrient (N, P, K, S) supply, higher pH and organic carbon, reduced bulk density and soil strength within the trench lines, along with increased root activity. The time taken for the compost applied treatments to exceed the cumulative profits of the Control treatment ranged within 19–29 years assuming current prices, costs and yield trends.
Reduced bulk density and soil strength associated with trenching was found to persist within the trench lines for at least six years resulting in increased root growth at depth. The addition of composted chicken litter, either surface spread or incorporated in trenches increased grain yields more so than trenching alone.
The compost treatments, although having the highest grain yields, were not commercially viable at the rates applied. The trenched treatments had higher cumulative yields than those treatments that were not trenched. In the absence of compost, the trenched treatments were the most profitable with discounted returns AUD282 to AUD931 ha−1 higher than the Control over nine years.
Keywords: amelioration, auger trenching, compaction, compost, economics, grain yield, lime, sandy soils.
Introduction
There is a growing demand for soil management strategies that enhance chemical and physical fertility, providing long-term benefit to crop production on sandplain soils. Deep ripping (Henderson 1991), clay addition (Hall et al. 2010), lime (Oliver et al. 2021) and strategic inversion tillage (Davies et al. 2019; Hall et al. 2020) have been shown to profitably increase grain yields. However, in most seasons the resulting yields are still significantly less than the estimated rainfall-limited yield potential. This may be because the benefits of deep tillage are not persisting due to induced and natural re-compaction (Hall et al. 2020). Alternatively, the poor nutrient retention in sandy soils may limit the availability of essential nutrients at critical periods (Unkovich et al. 2020). Meta analyses of soil amelioration strategies suggest that improving the physical properties of a soil alone is insufficient to resolve soil constraints and that lasting remediation may only occur where chemical and biological amendments are also applied (Ning et al. 2022).
Deep placement of organic amendments (manures, composts and stubble) has increased crop yields on clay (Gill et al. 2008, 2012) and sandy soils (Moodie et al. 2019) in southern Australia. In a review on the effects of subsoil manuring in sodic clays, yield increases of 69% over four years were attributed to improved soil structure associated with increased soil aggregation, aggregate stability and root growth both within and between amended soil zones (Wang et al. 2020; Sale et al. 2021; Uddin et al. 2022).
In contrast, the literature associated with subsoil manuring in sands is sparse. Subsoil manuring in deep sands in the Victorian Mallee increased grain yields by more than 2 t ha−1 over 2 years (Moodie et al. 2019). This research reported that much of the yield improvement was due to deep tillage. However, addition of chicken litter (6.8 t ha−1: 252 N kg ha−1) also significantly increased grain yield more than other organic amendments (leguminous straws: 156 N kg ha−1) or mineral fertilizer (urea: 156 N kg ha−1). Despite this, researchers have questioned the relative benefit of organic versus mineral amendments adjusted to the same nutrient loading. Studies in England and Australia have shown that the benefits from organic amendments are most likely nutritional, with no grain yield advantage that exceeds that of mineral fertilizers when rates are adjusted to give identical nutrient quantities (Edmeades 2003; Celestina et al. 2019).
The method of deep placing amendments can also impact the soil strength and re-compaction. Deep sands in Western Australia are considered highly responsive to deep tillage but the effects are often transient and may not persist beyond three years (Davies et al. 2019). This is due to re-compaction caused by natural processes as well as induced by the weight of farm machinery passing over the soil (Hall et al. 2020). The digging of narrow trenches, also known as trenching or slotting, has the potential to persist for longer. This is attributed to the slot being protected from traffic by the more compact soils between the slots (Blackwell et al. 1989a, 1989b). Furthermore, amendments are often more evenly distributed within the trench when incorporated into trenches as they are formed using rotary digging systems (Jayawardane et al. 1994; Sale et al. 2021).
The aim of this paper was to determine the following: (a) whether deep-placed compost via slotting in a deep sand can reduce the yield gap (YG) between potential and actual yield, and ameliorate subsoil strength, (b) whether the production benefit could be attributed to improved nutrition compared to the amelioration of soil physical properties, (c) whether the benefits persist and (d) whether they are economically viable.
Materials and methods
The experiment was established in March 2015 at the Esperance Downs Research Facility (latitude −33.61°, longitude 121.781°) on a yellow subnatric Sodosol (Isbell 2021), with pale deep sand to 0.8 m overlying a sodic clay. The soil had a low nutrient retention with a cation exchange capacity ranging from 2.9 cmol+ kg−1 at 10 cm depth to less than 0.5 cmol+ kg−1 at 40 cm depth. The soil was acidic but not aluminium toxic, with pH greater than 4.6 throughout the profile. The soils was moderately water repellent recording a molarity of ethanol droplet (MED) rating of 2 (King 1981). The site was prone to periodic waterlogging due to the poor permeability of the underlying clay B horizon.
The experimental treatments were combinations of trenching (T) to 0.5 m, the use of composted and pelleted chicken litter at 10 or 20 t ha−1 (C10, C20) and the use of limesand (L; 70% neutralising value) at 2 t ha−1 in an incomplete factorial design. The trial had eight treatments (Table 1) replicated four times in a randomised block design.
| Treatment No. | Treatment | Abbreviation | |
|---|---|---|---|
| 1 | Control | Control | |
| 2 | Surface applied chicken litter compost (C) 10 t ha−1 | C10 | |
| 3 | Trench (T) 0.1 m wide by 0.5 m deep spaced 0.9 m apart. | T | |
| 4 | T + Limesand 2 t ha−1 (L) | TL | |
| 5 | T + C 10 t ha−1 | TC10 | |
| 6 | T + C 20 t ha−1 | TC20 | |
| 7 | T + L + C 10 t ha−1 | TLC10 | |
| 8 | T + L + C 20 t ha−1 | TLC20 |
All amendments were applied once in March 2015.
The limesand treatments were incorporated within the trenches and not surface applied. The rationale for this is that surface applications of limesand that are not incorporated have little effect on subsoil pH (Scott and Coombes 2006; Azam and Gazey 2020). The chicken litter compost (Multi Grow Organic 2000: 4.9% N, 0.9% P, 1.7% K, 0.5% S) treatment was either surface spread or incorporated to depth using a Trenchmaster® 150 three-point linkage auger trenching machine. Where trenched, the chicken litter pellets were applied to form a narrow heap along lines that marked proposed slots. A tractor with the trenching machine straddled the line to form the slots. Subsoil spoil from the auger trencher was mechanically mixed with the line of compost and graded back into the trench in one pass. Each plot was 4 m wide by 20 m long. The trenches were 0.5 m deep by 0.1 m wide and spaced at 0.9 m intervals resulting in four parallel trenches per plot. Surface spreading of the compost was done manually and then raked to obtain an even coverage.
Agronomic measurement
The experimental site was cropped between April and December to a barley–canola–wheat rotation during 2015–2023. Crops were sown with a 1.4 m wide cone seeder requiring three passes per plot. Crops were sown at rates of 90 kg ha−1 for cereals and 3 kg ha−1 for canola. Details of the crops, fertilizer inputs, seeding and harvest dates, growing season rainfall (GSR) and rainfall deciles are given in Table 2. Crop emergence measurements were made within 14 days of seeding by counting plants in five 0.5 m2 sample areas within each plot. Plant biomass was measured at anthesis (cereals) or mid-flowering (canola) by hand harvesting three 0.5 m2 sample areas per plot. Crop height and tiller numbers were measured on the biomass samples. Biomass subsamples collected post-tillering (cereals) and mid-flowering (canola) for treatments 1, 2, 3, 5 and 6 were analysed for macro- and micro-nutrients at the CSBP laboratory (Perth, Australia). Grain yields were calculated from harvest weights from two 1.7 m wide by 18 m plot header swaths within each plot.
| 2015 | 2016 | 2017 | 2018 | 2019 | 2020 | 2021 | 2022 | 2023 | ||
|---|---|---|---|---|---|---|---|---|---|---|
| Crop | Barley | Canola | Wheat | Barley | Canola | Wheat | Barley | Canola | Wheat | |
| Variety | Bass | ATR Wahoo | Mace | Planet | InVigor®4510 | Scepter | Maximus | Truflex ®4510 | Brumby | |
| Mineral fertilizer N:P:K:S (kg ha−1) | 42:12:11:6 | 46:11:0:59 | 41:6:50:11 | 48:9:0:14 | 58:9:0:56 | 100:9:0:14 | 123:20:40:8 | 80:20:40:75 | 144:12:31:0 | |
| Seeding date | 14th May | 3rd May | 30th May | 18th May | 15th May | 8th May | 17th May | 14th Apr | 2nd May | |
| Harvest date | 30th Nov | 26th Nov | 7th Dec | 30th Nov | 25th Nov | 3rd Dec | 1st Dec | 28th Oct | 23rd Nov | |
| GSR (mm) | 353 | 465 | 298 | 447 | 227 | 467 | 464 | 472 | 419 | |
| Rainfall decile | 3 | 9 | 2 | 9 | 1 | 9 | 9 | 10 | 6 | |
| Potential yield (t ha−1) A | 3.76 | 3.15 | 4.76 | 4.05 | 2.52 | 3.69 | 3.61 | 2.82 | 3.7 |
Soil measurements
Soil strength was measured in 2016 and 2021 within the Control, T, TL and TLC20 treatments using a Rimik® digital recording cone (130 mm2) penetrometer. Measurements were made to a depth of 0.6 m when the soil was at or near field capacity. Nine insertions were made both within and off the trenching lines, where applicable, in each plot.
At the conclusion of the trial (October 2023), soil pits were excavated in three of the four replicates at right angles to the plot run lines, for the Control, T, TL and TLC20 treatments. A wire grid (0.5 m deep by 1 m wide with 0.1 m × 0.1 m cells) was placed against the wall of the pit. Roots were visually rated on a scale of 0–5 based on abundance to a depth of 50 cm using a modified method of McDonald et al. (1990). Duplicate observations were made at each depth. Where trenched, the duplicate observations were collected within and between the trenches. Soil cores of known volume were hammered into the pit face at 10 cm intervals to 60–70 cm. The soil samples were oven dried at 105°C for 48 h and gravimetric and volumetric water contents were determined. Samples were analysed for pH (0.01M CaCl2), EC1:5 (dS m−1), organic carbon (%), nitrate and ammonium, phosphorus (P), potassium (K), sulfur (S) and micro-nutrients (B, Cu, Fe, Mn and Zn) using standard methods (CSBP 2022).
Rainfall-limited potential yield (PY) was calculated using the method of Oliver et al. (2009), which compensates for excess water in higher rainfall environments. Growing season rainfall was calculated between May and October for soils with a PAWC (plant available water capacity) upper limit of 130 mm. The water use efficiencies used with the Oliver method were 20 and 15 kg mm−1 ha−1 for cereals and canola respectively. The yield gap (YG) was the difference between the calculated PY and the actual yield.
Economic analysis
Treatment profits for each year were calculated in Australian dollars:
Average yearly commodity prices and variable growing costs for canola, wheat and barley were sourced for the Esperance Port Zone. Amendment costs for compost, limesand and trenching were $500 t−1, $35 t−1 and $150 ha−1 respectively. Profits were discounted at a rate of 5% to calculate the Net Present Value (NPV, $ ha−1) for each period (Year 1, Years 1–2, …Years 1–9) over the life of the experiment. To determine the time for the amended treatments to equal the profitability of the Control treatment, linear regressions of the following form were determined for each treatment:
The regression coefficients (a, b) for the Control and each treatment’s NPV were then used to solve for year (x) using the formula:
Statistical analysis
Two types of analysis of variance were done using Genstat® (VSN International 2022). Firstly, individual treatments were analysed within their randomised block structure. Secondly main treatments (compost, trenching and lime) were assessed. The chicken litter compost and trenching main treatments were analysed individually and in combination. The lime treatments were only applied in combination with trenching and analysed as a sub-treatment of trenching. The treatment function used in Genstat for analysing the main treatments and their interactions was Compost*(Trench/Lime). Linear regressions used in the economic analysis and corresponding coefficients were determined in Microsoft Excel. Where selected treatments (Control, T, TL and TLC20) were intensively sampled in September 2022, within and between trenches, then individual analyses of variance for soil chemical, physical and root ratings were done for each depth interval. Given that the Control treatment had no trenches then analyses of the ‘between trench’, which excluded the within trench measurements, were done for all four measured treatments. Trenching main treatment effects (within versus between trenches) were also analysed but only for T, TL and TLC20 treatments.
Results
Crop production
Grain yields were significantly increased compared to the Control in seven of the nine years due to the compost, lime and trenching treatments. The order in which the treatments increased yields over the Control based on the number of cropping years where there were significant differences to the Control follows: TLC20 (seven years) > TLC10 (six years) > TC10, TC20 (five years) > C10 (three years) > TL (two years) > T (one year). No compost, trenching or lime treatment combination had grain yields significantly lower than the Control in any year.
Compost, either deep incorporated or surface applied increased cumulative grain yield compared to the Control (Table 3). The TLC20 treatment had higher (P < 0.05) cumulative yields than the Control, T, TL and C10 treatments. The cumulative grain yield over nine years was increased by 9.62 t ha−1 for the highest producing treatment (TLC20), which was 30% greater than the cumulative yield of the Control (Table 3). There was no difference in cumulative yield between the deep-placed and surface-applied compost at the same rate of application. There were no differences between the two rates of deep-placed compost either with or without lime.
| 2015 Barley | 2016 Canola | 2017 Wheat | 2018 Barley | 2019 Canola | 2020 Wheat | 2021 Barley | 2022 Canola | 2023 Wheat | Cumulative total | ||
|---|---|---|---|---|---|---|---|---|---|---|---|
| Treatment effects | |||||||||||
| Control | 4.64 | 1.08 | 6.77 | 3.61 | 2.04 | 2.85 | 5.43 | 2.84 | 1.96 | 31.60 | |
| C10 | 4.38 | 1.87 | 7.46 | 4.21 | 2.52 | 3.69 | 5.42 | 3.27 | 2.17 | 35.33 | |
| T | 4.20 | 0.88 | 7.26 | 3.81 | 2.30 | 3.77 | 5.06 | 2.91 | 1.65 | 33.10 | |
| TL | 4.71 | 1.32 | 6.94 | 3.66 | 2.30 | 4.04 | 5.45 | 3.18 | 2.03 | 34.76 | |
| TC10 | 5.11 | 1.32 | 7.83 | 4.48 | 2.75 | 4.54 | 5.41 | 3.22 | 1.91 | 37.89 | |
| TC20 | 4.95 | 1.55 | 7.60 | 5.01 | 2.83 | 4.48 | 5.55 | 3.47 | 1.77 | 38.92 | |
| TLC10 | 4.79 | 1.98 | 7.52 | 4.29 | 2.66 | 4.89 | 5.51 | 3.32 | 2.16 | 38.28 | |
| TLC20 | 4.88 | 2.28 | 7.84 | 5.05 | 3.04 | 4.98 | 6.09 | 3.53 | 2.79 | 41.22 | |
| LSD5% | n.s. | 0.52 | 0.69 | 0.62 | 0.36 | 1.0 | 0.62 | 0.28 | 0.42 | 3.61 | |
| Main treatment effects | |||||||||||
| Compost | |||||||||||
| C0 | 4.52 | 1.09 | 6.99 | 3.69 | 2.22 | 3.55 | 5.31 | 2.98 | 1.88 | 33.16 | |
| C10 | 4.76 | 1.72 | 7.61 | 4.33 | 2.64 | 4.37 | 5.45 | 3.27 | 2.08 | 37.17 | |
| C20 | 4.92 | 1.92 | 7.71 | 5.03 | 2.94 | 4.73 | 5.82 | 3.50 | 2.28 | 40.07 | |
| Prob | n.s. | P < 0.001 | P < 0.003 | P < 0.001 | P < 0.001 | P < 0.003 | P < 0.05 | P < 0.001 | P = 0.002 | P < 0.001 | |
| Trenching | |||||||||||
| T0 | 4.51 | 1.48 | 7.11 | 3.91 | 2.28 | 3.37 | 5.43 | 3.06 | 2.06 | 33.46 | |
| T50 | 4.77 | 1.55 | 7.50 | 4.38 | 2.65 | 4.41 | 5.51 | 3.27 | 2.05 | 37.36 | |
| Prob | n.s. | n.s. | n.s. | n.s. | P < 0.05 | P < 0.002 | n.s. | n.s. | n.s. | P < 0.04 | |
| Main treatment interactions | |||||||||||
| C x T | n.s. | n.s. | n.s. | n.s. | n.s. | n.s. | n.s. | n.s. | n.s. | n.s. | |
| T x L | n.s. | P < 0.001 | n.s. | n.s. | n.s. | n.s. | n.s. | n.s. | n.s. | n.s. | |
| C x T x L | n.s. | n.s. | n.s. | n.s. | n.s. | n.s. | n.s. | n.s. | n.s. | n.s. | |
Values in bold are significantly (P < 0.05) different to the Control or the main treatment controls C0 and T0.
Grain yield increases for the compost main treatment were 7% higher than those for trenching. The C10 and C20 main treatments resulted in yield increases in six and eight of the nine years respectively when compared to the C0. In comparison, the T50 main treatment increased grain yields in only two years (Table 3). There was a significant (P < 0.001) positive interaction between trenching and lime in 2016 but this was the only time that this interaction occurred. Overall, the main treatment effects of trenching, compost and lime grain yield were additive.
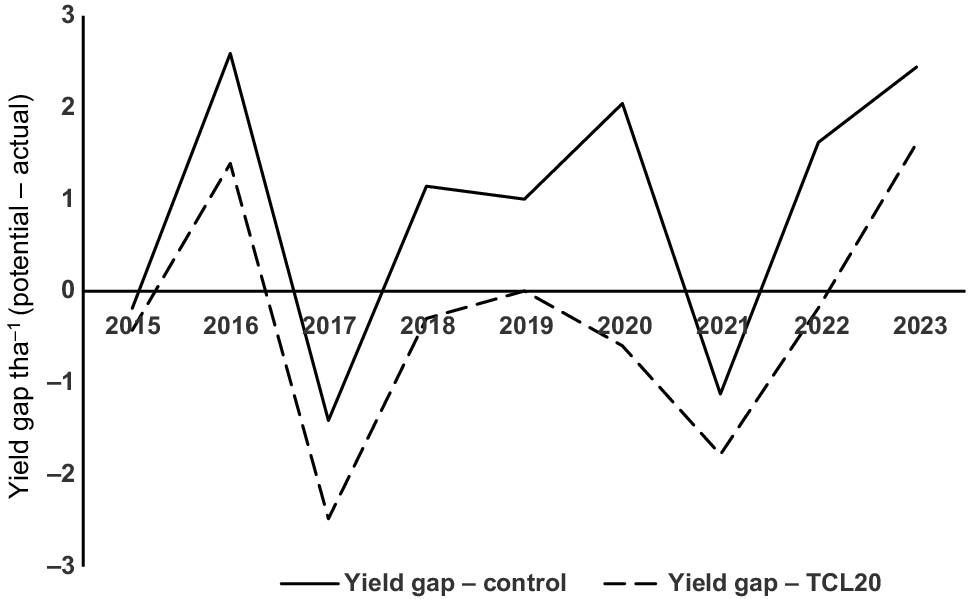
Calculated water-limited PYs for each crop are given in Table 3. The TCL20 treatment had the highest cumulative yield (41.22 t ha−1), and this was 107% of the PY (37.7 t ha−1). By contrast, the Control had the lowest cumulative yield, which was 81% (30.71 t ha−1) of the PY (Table 3). The cumulative grain yields for the C10, C20 and T50 main treatments were at or near PY. There was no discernible trend in YG between the highest and lowest yielding treatments over time (Fig. 1).
Foliar nutrient analysis
Macro-nutrient concentrations in whole tops were generally above critical levels for crop development in most years. The exceptions were N and K in 2015 and N in 2019, which were marginally below critical thresholds (Table 4). Across all years only the C10, TC10 and TC20 treatments had N, P, K and S values higher than the Control. The addition of chicken litter compost at the highest rate (C20) rate increased N, P and K concentrations in whole tops in 2015, P and K in 2017 and N and P in 2018. Surprisingly, N concentrations in the 2019 canola crop were significantly lower for the C10 and TC10 treatments than the Control. Trenching reduced N, P, K and S concentrations in barley in 2015, with the T50 main treatment having lower values than T0 (Table 4). The interaction between the C and T main treatments were also significant for all macro-nutrient concentrations in 2015, with nutrient concentrations in barley much higher where chicken litter was surface spread compared to trenched.
| 2015 Barley | 2017 Wheat | 2018 Barley | 2019 Canola | ||||||||||||||
|---|---|---|---|---|---|---|---|---|---|---|---|---|---|---|---|---|---|
| N | P | K | S | N | P | K | S | N | P | K | S | N | P | K | S | ||
| Treatment | |||||||||||||||||
| Control | 1.13 | 0.24 | 0.72 | 0.16 | 1.64 | 0.29 | 1.75 | 0.16 | 1.90 | 0.38 | 2.71 | 0.20 | 4.37 | 0.48 | 3.33 | 0.60 | |
| C10 | 1.62 | 0.46 | 2.49 | 0.26 | 1.95 | 0.39 | 2.28 | 0.18 | 2.04 | 0.45 | 3.17 | 0.20 | 3.64 | 0.48 | 3.24 | 0.58 | |
| T | 1.05 | 0.23 | 0.68 | 0.13 | 1.71 | 0.29 | 1.95 | 0.15 | 2.12 | 0.36 | 2.98 | 0.20 | 3.82 | 0.49 | 3.62 | 0.57 | |
| TC10 | 1.09 | 0.28 | 1.05 | 0.16 | 1.81 | 0.38 | 2.28 | 0.16 | na | na | na | na | 3.46 | 0.49 | 3.50 | 0.58 | |
| TC20 | 1.30 | 0.35 | 1.84 | 0.22 | 1.87 | 0.41 | 2.38 | 0.18 | 2.28 | 0.46 | 3.48 | 0.20 | 4.26 | 0.57 | 4.13 | 0.65 | |
| LSD 5% | 0.17 | 0.06 | 0.41 | 0.05 | 0.28 | 0.04 | 0.45 | n.s. | 0.26 | 0.03 | n.s. | n.s. | 0.69 | 0.05 | 0.61 | n.s. | |
| Critical threshold A | <1.25 | <0.15 | <1.25 | <0.15 | <1.7 | <0.15 | <1.8 | <0.15 | <1.25 | <0.15 | <1.25 | <0.15 | <4.2 | <0.25 | na | <0.58 | |
| Main treatment | |||||||||||||||||
| Compost | |||||||||||||||||
| C0 | 1.09 | 0.24 | 0.70 | 0.14 | 1.68 | 0.29 | 1.85 | 0.15 | 2.01 | 0.37 | 2.84 | 0.20 | 4.15 | 0.48 | 3.54 | 0.60 | |
| C10 | 1.35 | 0.37 | 1.77 | 0.21 | 1.87 | 0.38 | 2.28 | 0.17 | 2.04 | 0.45 | 3.17 | 0.20 | 3.64 | 0.50 | 3.43 | 0.60 | |
| C20 | 1.30 | 0.35 | 1.84 | 0.22 | 1.87 | 0.41 | 2.38 | 0.18 | 2.28 | 0.46 | 3.48 | 0.20 | 3.85 | 0.52 | 3.69 | 0.63 | |
| Prob | P < 0.001 | P < 0.001 | P < 0.001 | n.s. | n.s. | P < 0.001 | P < 0.01 | P < 0.05 | P < 0.05 | P < 0.001 | n.s. | n.s. | P < 0.05 | n.s. | n.s. | n.s. | |
| Trenching | |||||||||||||||||
| T0 | 1.37 | 0.35 | 1.60 | 0.21 | 1.77 | 0.33 | 1.98 | 0.17 | 1.97 | 0.42 | 2.94 | 0.20 | 4.01 | 0.48 | 3.28 | 0.59 | |
| T50 | 1.15 | 0.28 | 1.19 | 0.17 | 1.80 | 0.36 | 2.20 | 0.16 | 2.20 | 0.41 | 3.23 | 0.20 | 3.85 | 0.50 | 3.62 | 0.61 | |
| Prob | P < 0.001 | P < 0.001 | P < 0.001 | P < 0.05 | n.s. | n.s. | n.s. | n.s. | n.s. | n.s. | n.s. | n.s. | n.s. | n.s. | n.s. | n.s. | |
| Main treatment interaction | |||||||||||||||||
| C x T | P < 0.05 | P < 0.001 | P < 0.001 | P < 0.001 | n.s. | n.s. | n.s. | n.s. | n.s. | n.s. | n.s. | n.s. | n.s. | n.s. | n.s. | n.s. | |
Values in bold are significantly (P < 0.05) different to the Control. na = not available/measured.
The concentrations of micro-nutrients B, Cu and Zn were increased in the cereal crops where soils had been amended with chicken litter (C10 and C20) compared to those that had not (C0), while Mg was increased in all years measured except 2018 (Table 5). Trenching (T50) reduced Cu and Zn levels in 2015 and 2017 when compared to T0. The ranges in concentration of B, Mg and Cu in Controls for the cereal crops were lower than the recommended critical thresholds of 5, 0.15 and 6 mg kg−1 respectively, whereas Zn was generally above the recommended threshold of 5–25 mg kg−1 (Reuter and Robinson 1997).
| 2015 Barley | 2017 Wheat | 2018 Barley | 2019 Canola | ||||||||||||||
|---|---|---|---|---|---|---|---|---|---|---|---|---|---|---|---|---|---|
| B | Cu | Mg | Zn | B | Cu | Mg | Zn | B | Cu | Mg | Zn | B | Cu | Mg | Zn | ||
| Treatment | |||||||||||||||||
| Control | 2.75 | 1.41 | 0.12 | 11.19 | 3.05 | 2.15 | 0.13 | 18.06 | 4.77 | 4.03 | 0.11 | 29.66 | 26.62 | 4.44 | 0.25 | 43.97 | |
| C10 | 3.11 | 2.41 | 0.14 | 22.01 | 3.54 | 2.74 | 0.13 | 24.55 | 5.57 | 4.25 | 0.12 | 37.94 | 25.75 | 3.84 | 0.25 | 41.08 | |
| T | 2.81 | 0.97 | 0.12 | 9.53 | 2.75 | 2.19 | 0.12 | 19.24 | 4.79 | 3.65 | 0.11 | 28.05 | 26.21 | 3.86 | 0.23 | 39.14 | |
| TC10 | 2.63 | 1.27 | 0.13 | 11.63 | 3.42 | 2.64 | 0.13 | 24.48 | na | na | na | na | 26.93 | 3.82 | 0.25 | 36.66 | |
| TC20 | 3.21 | 1.85 | 0.14 | 14.73 | 3.51 | 2.56 | 0.13 | 24.04 | 5.39 | 4.49 | 0.11 | 36.68 | 26.39 | 4.19 | 0.28 | 44.31 | |
| LSD 5% | n.s. | 0.35 | n.s. | 3.25 | 0.41 | n.s. | n.s. | n.s. | n.s. | n.s. | n.s. | 3.87 | n.s. | n.s. | n.s. | n.s. | |
| Critical threshold A | <5 | <2.3 | <0.15 | <15 | <4 | <3 | <0.11 | <15 | <5 | <2.3 | <0.15 | <15 | 28 | 2.8 | na | na | |
| Main treatment | |||||||||||||||||
| Compost | |||||||||||||||||
| C0 | 2.78 | 1.19 | 0.12 | 10.36 | 2.78 | 1.19 | 0.12 | 10.36 | 4.78 | 3.84 | 0.11 | 28.86 | 26.89 | 4.03 | 0.24 | 39.42 | |
| C10 | 2.87 | 1.84 | 0.14 | 16.82 | 2.87 | 1.84 | 0.14 | 16.82 | 5.57 | 4.25 | 0.12 | 37.94 | 26.88 | 3.76 | 0.25 | 38.78 | |
| C20 | 3.21 | 1.85 | 0.14 | 14.73 | 3.21 | 1.85 | 0.14 | 14.73 | 5.39 | 4.49 | 0.11 | 36.68 | 26.11 | 3.90 | 0.27 | 38.80 | |
| LSD5% | 0.37 | 0.25 | 0.02 | 2.30 | 0.37 | 0.25 | 0.02 | 2.30 | 0.06 | 0.512 | n.s. | 2.73 | n.s. | n.s. | 0.02 | n.s. | |
| Trenching | |||||||||||||||||
| T0 | 2.93 | 1.91 | 0.13 | 16.60 | 2.93 | 1.91 | 0.13 | 16.60 | 5.17 | 4.14 | 0.11 | 33.80 | 26.18 | 4.14 | 0.25 | 42.52 | |
| T50 | 2.88 | 1.36 | 0.13 | 11.96 | 2.88 | 1.36 | 0.13 | 11.96 | 5.09 | 4.07 | 0.11 | 32.36 | 26.86 | 3.81 | 0.25 | 37.86 | |
| LSD5% | n.s. | 0.21 | n.s. | 2.00 | n.s. | 0.21 | n.s. | 2.00 | n.s. | n.s. | n.s. | n.s. | n.s. | n.s. | n.s. | 2.41 | |
| Main treatment interaction | |||||||||||||||||
| C x T | n.s. | P < 0.004 | n.s. | P < 0.001 | n.s. | n.s. | n.s. | n.s. | na | na | na | na | n.s. | n.s. | n.s. | n.s. | |
Values in bold are significantly (P < 0.05) different to the Control. na = not available/measured.
Soil chemistry and nutrition
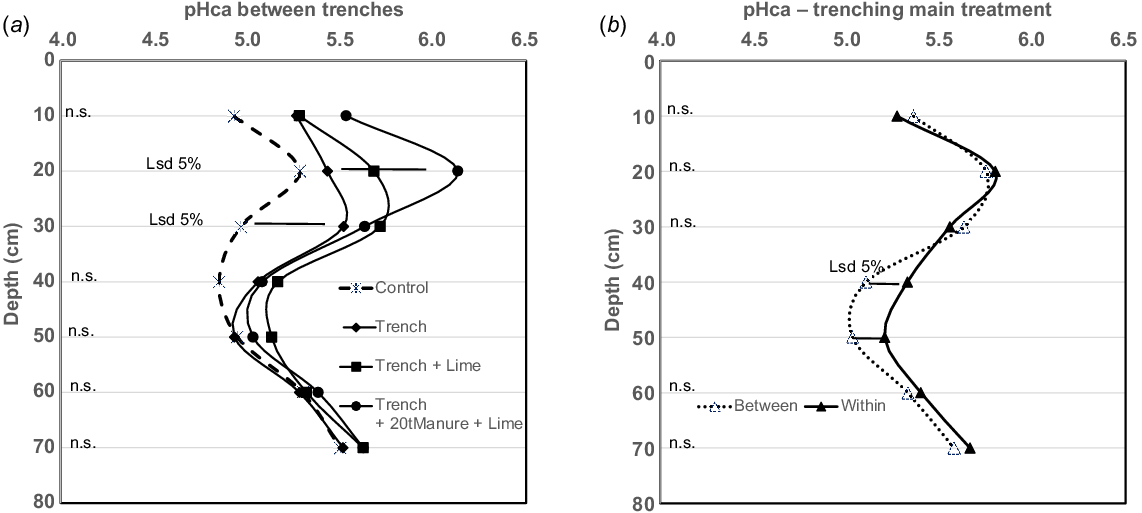
Soil pH CaCl2 ranged within 4.9−6.1 across all treatments to a depth of 70 cm. Even though lime was only applied in the trenches, significant increases in soil pH were found between the trenches. The TL and TLC20 had higher pH than the Control at depths of 20 and 30 cm (Fig. 2a). The T treatment also had higher pH at 30 cm depth than the Control. There were small but significant main treatment effects from trenching with increased pH at 40 and 50 cm depths for within-trench compared to between-trench measurements for T, TL and TL20 treatments (Fig. 3b).
Soil pHca values for (a) treatment effects between trenches and (b) trenching (between versus within) main treatment effects. Soil samples collected in September 2023, nine years after the trenching treatments were implemented.
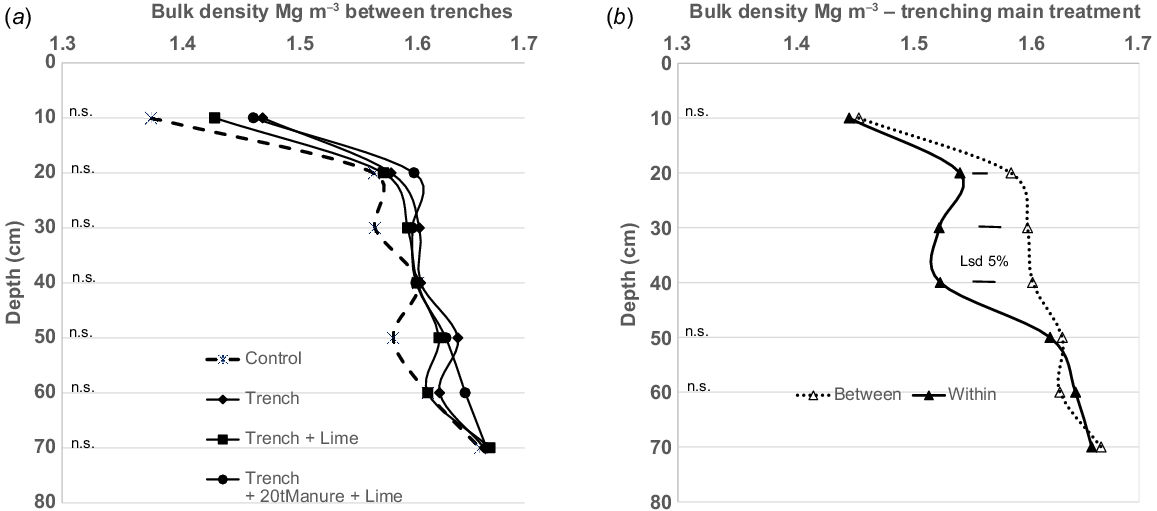
Bulk density values for (a) treatment effects between the trenches and (b) trenching (between versus within) main treatment effects. Soil samples collected in September 2023, nine years after the trenching treatments were implemented.
Soil organic carbon ranged from 1.1% in the topsoil to 0.2% at below 30 cm depth. Organic carbon was higher in the Control at 10 cm depth compared to the other measured treatments (T, TL and TLC20). No other significant differences were found between the treatments at any depth for organic carbon or available N, P, K and S when measured between trenches in September 2023 (data not presented).
No differences in soil pH, organic carbon or available N, P, K and S were found for trenched treatments (T, TL, TCL20) when averaged between and within the trenches at all depths to 70 cm. The only exception was available N at 70 cm (Supplementary data). Significant differences were found between and within the trenches. Within the trenches pHca was increased at 40 and 50 cm depth while organic carbon and available N and S were increased within depths of 20–40 cm. The P within the trenches was higher at 20 cm but lower at 40 cm depth within the trenches compared to between. Potassium was higher within trenches at 20 and 30 cm but lower at 50 cm depth compared to values between trenches (Supplementary data).
Soil physical properties and root rating index
Soil bulk density ranged within 1.38–1.46 Mg m−3 at 10 cm depth to 1.67 Mg m−3 at 70 cm depth. No differences in soil bulk density at any depth were found between the Control, T, TL and TLC20 treatments when averaged between trenches (Fig. 3a). However, the within-trench main treatment had lower density at 20–40 cm depths compared to the between-trench main treatment. The reduction in bulk density within the trenches ranged within 0.05–0.08 Mg m−3 (Fig. 3b).
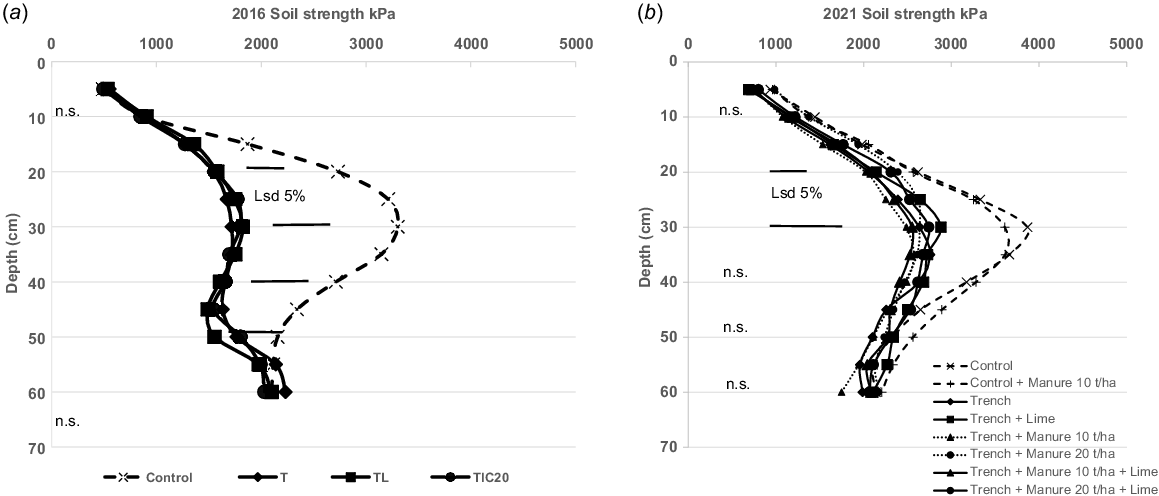
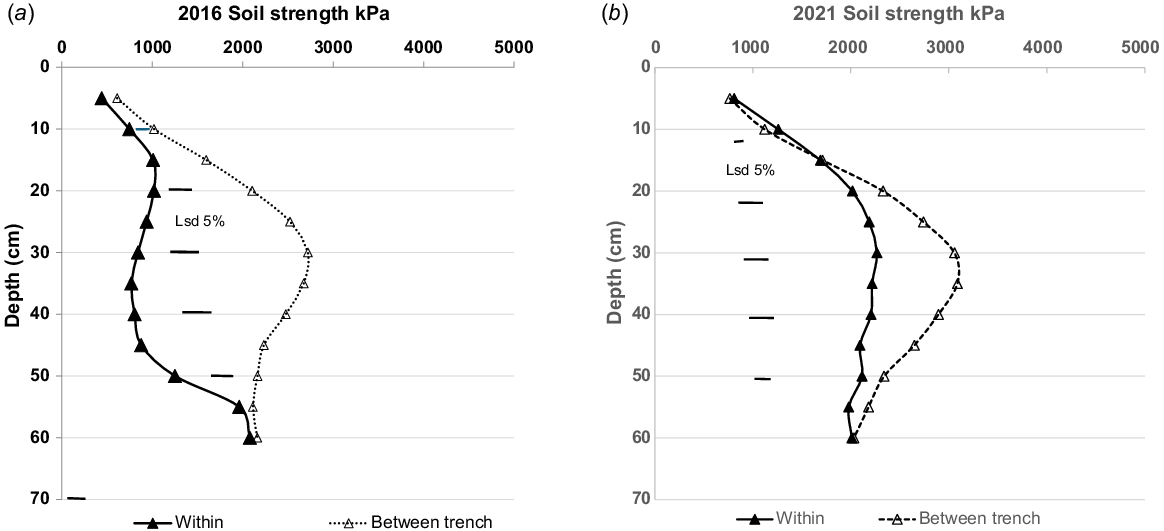
Soil strength exceeded 3300 kPa in 2016 and 3800 kPa in 2021 in the Control (Fig. 4a, b). In comparison, the average values for the T, TL and TLC20 treatments were less than 2000 and 2800 kPa in 2016 and 2021 respectively (Fig. 4a, b). The Control had higher soil strength values than the T, TL and TLC20 treatments for depths of 100–500 mm in each year. Maximum soil strength for the Control was at 300 mm depth in both years. In comparison, maximum soil strength for the T, TL and TLC20 treatments was at 600 mm in 2016 and 300 mm in 2021. There were no differences in soil strength between the T, TL and TLC20 treatments in either year.
Treatment effects in (a) 2016 and (b) 2021 for soil strength. Where treatments have been trenched the strength values presented have equal numbers of points within and between the trenches.
Main treatment effects on soil strength were assessed within, between and where no trenches had been applied. Soil strength within the trench barely exceeded 1000 kPa in 2016 (Fig. 5c, d). In comparison the between-trench and no-trenches (Control) measurements exceeded 2700 and 3300 kPa at 300 mm depth respectively. The within-trench main treatment had lower strength than the between and Control treatments for 100–500 mm depth. The between-trench treatments had lower soil strength than the Control (no trenches) for depths of 200–400 mm in 2016. By 2021 the Control exceeded 3800 kPa at 300 mm depth and had higher values than the within-trench main treatments at depths of 200–400 mm and the between-trench main treatments at depths of 250–350 mm. Soil strength for the within-trench main treatments were 700–1400 kPa higher in 2021 compared to 2016 at depths of 150–500 mm.
Soil strength recorded in (a) 2016 and (b) 2021 from within and between the trenched lines. Data presented are only from the treatments that were trenched.
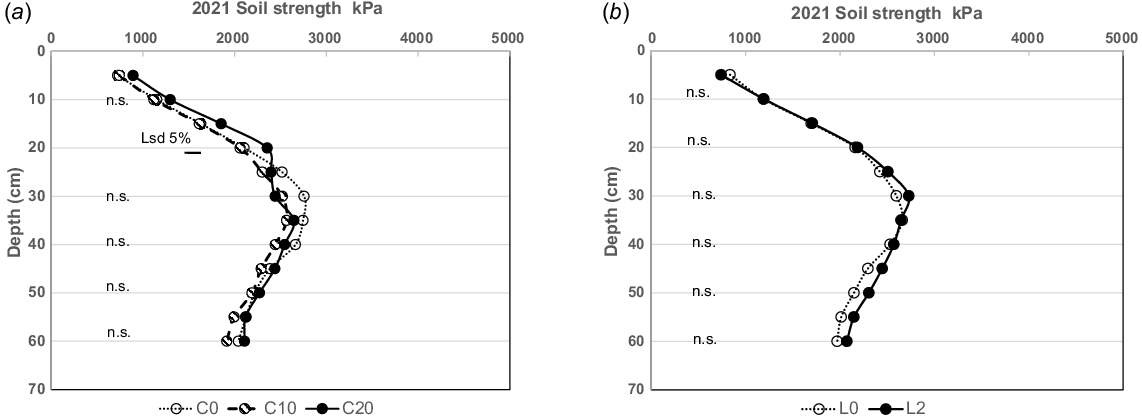
Overall, lime and compost had little effect on soil strength in 2021. There were no differences in soil strength between the L0 and L2 main treatments (Fig. 6b). Similarly, there was no differences in soil strength between the compost treatments (C0, C10) (Fig. 6a); however, the C20 main treatment had higher soil strength than the C0 and C10 at 20 cm depth (Fig. 6a).
Soil strength recorded in 2021 for the (a) compost main treatments and (b) lime main treatments. Data presented are only from the treatments that were trenched and include within and between-trench measurements.
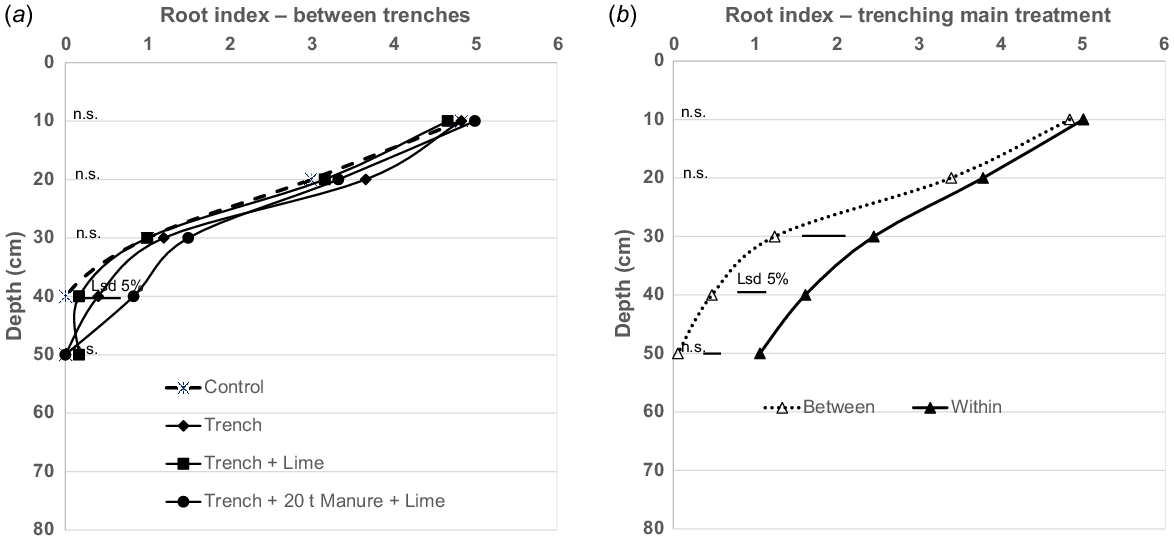
Root abundance index ranged from highly abundant (score 5) in the topsoil through to no roots (score 0) at 50 cm depth. Very few roots were found below 30 cm. The T, TL and TLC20 treatments had higher root numbers at 40 cm depth than the Control, which had no roots observed (Fig. 7a). The within-trench main treatment had higher root observations than the between-trench main treatment at depths of 30–50 cm (Fig. 7b).
Selected treatment effects where mean values for the trenched treatments include (a) within- and between-trench values and (b) trenching main treatment effects comparing values within and between the trenches on root abundance. Measurements made in October 2024, nine years after the trenching treatments were implemented.
Economics
Discounted cash flows for the duration of the experiment show that the T and TL were the only treatments more profitable than the Control (Table 6). The NPVs for the T and TL treatments were $232 and $684 ha−1 higher than the Control respectively. Where composted chicken litter had been applied at 10 t ha−1, NPVs were $2825–3387 ha−1 less than the Control. Where 20 t ha−1 of compost had been applied, NPVs were $6616–7370 ha−1 less than the Control.
| NPV Yr1 | NPV Yr2 | NPV Yr3 | NPV Yr4 | NPV Yr5 | NPV Yr6 | NPV Yr7 | NPV Yr8 | NPV Yr9 | a | b | r2 | Predicted years to equal control | ||
|---|---|---|---|---|---|---|---|---|---|---|---|---|---|---|
| Year | 2015 | 2016 | 2017 | 2018 | 2019 | 2020 | 2021 | 2022 | 2023 | |||||
| C | 826 | 994 | 2529 | 3282 | 3994 | 4394 | 5219 | 6386 | 6529 | 757.99 | 4.93 | 0.98 | 0.0 | |
| C10 | −4004 | −3364 | −1642 | −725 | 245 | 800 | 1623 | 3020 | 3252 | 937.19 | −4774.20 | 0.98 | 26.7 | |
| T | 570 | 616 | 2285 | 3093 | 3943 | 4716 | 5465 | 6668 | 6820 | 852.29 | −464.11 | 0.98 | 5.0 | |
| TL | 635 | 944 | 2524 | 3289 | 4140 | 4986 | 5815 | 7162 | 7317 | 894.32 | −381.61 | 0.99 | 2.8 | |
| TC10 | −3958 | −3647 | −1822 | −830 | 263 | 1239 | 2060 | 3430 | 3632 | 1023.70 | −5077.90 | 0.99 | 19.1 | |
| TC20 | −8759 | −8310 | −6553 | −5415 | −4283 | −3322 | −2473 | −964 | −735 | 1073.20 | −9900.80 | 0.99 | 31.4 | |
| TC10L | −4107 | −3400 | −1658 | −720 | 322 | 1388 | 2228 | 3653 | 3892 | 1050.60 | −5075.30 | 0.99 | 17.4 | |
| TC20L | −8845 | −7958 | −6136 | −4987 | −3738 | −2648 | −1687 | −148 | 193 | 1180.30 | −9896.50 | 0.99 | 23.4 |
Extrapolating the annual NPV over time suggests that it would take 19–31 years for the treatments where composted chicken litter was applied at 10 and 20 t ha−1 to be as profitable as the Control. This assumes that the current rates of yield increase over the Control could be sustained for that period (Table 6). Reducing the cost of the composted chicken litter treatment from $500 to $100 t−1 would result in all treatments being more profitable than the Control within eight years of application.
Discussion
This paper showed that the deep placement of compost through trenching in a deep sand can decrease the YG between potential and actual yield, ameliorate subsoil strength and that these benefits persist. However, these benefits are generally not economically viable. Each of these points will be discussed further below.
Yield
Grain yields were significantly increased on a deep sand Sodosol due to the ‘one off’ compost, lime and trenching treatments resulting in an average yield increase over nine years of 30% for the highest yielding treatment (TLC20) compared to the Control. The grain yields for the TCL20 treatment averaged 105% (annual range 62–141%) of the calculated water-limited yield potential compared to 79% (annual range 29–126%) for the Control. Other comparable studies comparing ‘one off’ deep manuring (8–20 t ha−1) treatments with Controls have shown average grain yield increases of −3.6% (Celestina et al. 2019), 20% (Tavakkoli et al. 2019) and 63% (Sale et al. 2021) on soils including Sodosols, Chromosols, Calcarosols and Vertosols in medium to high rainfall environments in southern Australia. There is considerable variability in yield response to deep manuring. Where positive effects on yield have been found, the authors have attributed the increased yields to improved nutrition, root growth, aggregate stability and soil porosity (Sale et al. 2021; Uddin et al. 2022). Part of this variability is likely due to seasonal rainfall and the interaction between the effects of deep tillage on seedbed condition and soil chemistry. Sale et al. (2021) noted that deep manuring was more likely to succeed in wetter seasons or environments. One reason for this is that excessive nutrition (N) can depress grain yields where soil water is depleted prior to grain fill (McDonald 1989). Of the three years reported by Celestina et al. (2019), two were considered much drier than average and may explain the lower yield response and high grain protein. In addition, deep tillage in clay soils can result in yield declines because of poor seedbed condition (cloddiness) affecting crop emergence or intractable subsoils being brought to the surface that are dispersive or toxic (Jayawardane and Chan 1994). This would be more likely to affect Sodosols, Vertosols and Calcarosols in dry seasons where subsoil sodicity, transient salinity and B toxicity are often present as co-constraints that reduce plant-available water. Consequently, the actual yields were only 20–97% of the calculated water-limited yield potential (Celestina et al. 2019).
Nutrients and soil structure
The compost treatments increased the concentrations of macro- and micro-nutrients in plant tissue more so than the trenched treatments. These increases resulted in soil nutrients increasing from sub-optimal to optimal levels. Partial nutrient budgets (not presented) suggest that the highest rates of compost were the only treatments to have a positive N partial budget in most years. Leaf tissue N and K values were close to being deficient where compost had not been applied. In comparison, P and S were positive for all treatments in all years. This was reflected in increased concentrations of macro-nutrients in leaf tissue in the seasons measured. In sandplain soils, K nutrition is often limiting, with responses to K expected in wheat crops for soil concentrations below 35 mg kg−1 (Ma et al. 2022). Based on this threshold and the low K concentrations in leaf tissue, it is likely that the Control treatment was below the critical threshold for K in some years.
Soil strength exceeded 3000 kPa at 30 cm depth in the Control. Such high values are known to prevent root growth (Hazelton and Murphy 2016). Soil strength was reduced within the trenches and remained significantly lower than the Control throughout the experiment. Interestingly, the inter-row values for the trenched treatments were also lower than the Control. This suggest that the reduction in soil strength, although diminished with time, was still evident at the end of nine years. Re-compaction of sandplain soils is a major issue and is due to both induced (traffic) and natural (slumping and effective stress) causes (Hall et al. 2020). The increased root growth and reduced bulk density within the trenches at nine years after the trial was implemented is further evidence that trenching can maintain improved soil physical conditions for crop growth. This confirms the hypothesis that trenching can reduce soil strength and that this benefit will be sustained.
The longer-term aim of the trenching system is for the amended zones to spatially progress beyond that which was initially ameliorated. Wang et al. (2020) showed that roots proliferated adjacent to and below the depth of amelioration resulting in the formation of macro-aggregates outside of the amended zone. Here we found increased soil pH and lower soil strength between trenches. An increase in soil pH at 30 cm between the trenches was also found for the T treatment where no lime had been applied in-trench. The reason for this is not clear as the value presented (Fig. 2a) is the mean of six measurements with no obvious outliers. Despite increased pH and lower soil strength, we were unable to show any enhanced root growth beyond the amended trenches.
In the present study, we attribute the increased grain production to improvements in soil chemistry and nutrition more so than from improved soil physical conditions. The evidence for this is that there were no significant differences in cumulative crop yields between surface-applied (C10) and the deep-placed compost treatments (TC10 ± L and TC20). Furthermore, the T50 main treatment resulted in significant yield increases in only two of the nine years compared to eight of the nine years for the C20 main treatment. The experiment presented was not designed to determine if the crop yield response to the composted chicken litter exceeded that of matched mineral fertilisers. We note, however, that in experiments where nutrients in organic and mineral fertilizers have been matched and applied either to the surface or incorporated to depth, no differences in crop production were found (Edmeades 2003; Celestina et al. 2019). This suggests that the benefits of the compost are more likely due to added nutrition and may have no economic advantage over mineral fertilizers.
In previous studies, improvements in root growth and increased macro-aggregate stability and dispersion (Wang et al. 2020) have been found when organic amendments were applied to clay soils. Improvements in soil aggregation and aggregate stability associated with organic amendments would appear to be influenced by soil texture, with soils with more than 34% clay more likely to show improved aggregation (Wagner et al. 2007) as a result of the increased protection of organic materials. In deep sands, reductions in soil strength and bulk density have been found with high rates (33–256 t ha−1 yr−1) of compost applied (Tester 1990). In our study, with less than 5% clay, there were no differences in soil strength, bulk density or root abundance between the differing rates of compost (0, 10 and 20 t ha−1) when measured within trenches between two and nine years after being applied. We conclude that improvements in grain yield found here on deep sands resulting from the compost treatments are more likely to be due to improvements in soil chemistry and nutrition as opposed to improved soil physical conditions.
Persistence of benefits and economic value of intervention
One of the key findings from this research was the persistence over nine years of increased grain yields in the treatments where composted chicken litter had been applied. The yield gap analysis showed no evidence that the benefits from the highest yielding treatment were increasing or declining over time relative to the Control. The persistence over four years of increased yields associated with deep-placed compost was also noted by Sale et al. (2019).
Analysis of the NPV of the trench and compost system suggests that there is a long lag period between implementation and for the profit to exceed that of the Control. For the highest yielding treatment (TCL20) the lag period exceeded 30 years. In contrast, Sale and Malcolm (2015) reported improved yield associated with composted chicken litter resulted in increased profitability over the Control within three years. The difference in profitability between their study and ours was due to the cost of the compost which was $16 t−1 in their experiment compared to $500 t−1 in this experiment. Farmers have shown that they are prepared to invest in high-cost soil ameliorative treatments, resulting in initial losses, where longer-term profitability is assured (Hall et al. 2020). However, for most growers such a long period between implementation and relative profit is not commercially viable. Assuming the yield benefit from the compost treatments remains, improving the profitability of the trench and compost system could be achieved if a cheaper source of compost could be found or if application rates could be reduced without compromising production benefits. There was no evidence to show that yield increases between the highest and lowest yield treatments declined with time. This suggests that the yield benefits from the composted chicken litter are likely to continue, albeit for an unknown period. There were no significant differences in yield in any year between the C10 and C20 main treatments. This suggest that the optimum rate may be lower than the rates used in this experiment. Based on the improvements in soil chemical and physical properties we suggest that the benefits would persist but are unable to predict for how long.
Conclusions
Compost and trenching improved crop yields on average by more than 1 t ha−1 yr−1. The yields achieved were at or near yield potential for the highest yielding treatments. Much of the yield improvement could be attributed to the addition of compost, above the implementation of subsoil trenches. The benefits from trenching (root abundance, reduction in soil strength and reduction in bulk density) persisted for as much as nine years. While we have no comparison with deep ripping at this site, farmer observations in these soils suggest that ripping is required every 3–5 years to maintain yields (Davies et al. 2019). This suggests that the trenching system may prolong the benefits of improved structure at depth. The only treatments to be more profitable than the Control were trenched without compost (T) or with lime (TL). There was no additional effect of compost on improving soil physical conditions (bulk density) when added to the trenches. The main benefit of the compost was through improved nutrient availability. Economic analysis suggested that, based on current costs and production trends, the chicken litter amendments would take 19–31 years to break even with the Control treatment.
Declaration of funding
This research was jointly funded by the Department of Primary Industries and Regional Development and the Grains Research Development Corporation projects DAW000242 (Subsoil Constraints) and DAW1902-003RTX (Re-Engineering) managed by Dr Gaus Azam.
Acknowledgements
We thank Chris Matthews for implementing and the successive years of managing this trial as a part of DPIRD’s research support unit. David Dodge, Sam Richards and Tony Dixon provided expert technical support, and we also thank Andrew van Burgel for his statistical recommendations.
References
Azam G, Gazey C (2020) Slow movement of alkali from surface-applied lime warrants the introduction of strategic tillage for rapid amelioration of subsurface acidity in south-western Australia. Soil Research 59(1), 97-106.
| Crossref | Google Scholar |
Blackwell J, Horn R, Jayawardane NS, White R, Blackwell PS (1989a) Vertical stress distribution under tractor wheeling in a partially deep loosened typic paleustalf. Soil and Tillage Research 13(1), 1-12.
| Crossref | Google Scholar |
Blackwell PS, Jayawardane NS, Blackwell J, White R, Horn R (1989b) Evaluation of soil recompaction by transverse wheeling of tillage slots. Soil Science Society of America Journal 53(1), 11-15.
| Crossref | Google Scholar |
Celestina C, Hunt JR, Sale PWG, Franks AE (2019) Attribution of crop yield responses to application of organic amendments: a critical review. Soil and Tillage Research 186, 135-145.
| Crossref | Google Scholar |
CSBP (2022) CSBP lab methods. Available at csbplab.com.au [updated May 2022]
Edmeades DC (2003) The long-term effects of manures and fertilisers on soil productivity and quality: a review. Nutrient Cycling in Agroecosystems 66(2), 165-180.
| Crossref | Google Scholar |
Gill JS, Sale PWG, Tang C (2008) Amelioration of dense sodic subsoil using organic amendments increases wheat yield more than using gypsum in a high rainfall zone of southern Australia. Field Crops Research 107(3), 265-275.
| Crossref | Google Scholar |
Gill JS, Clark GJ, Sale PW, Peries RR, Tang C (2012) Deep placement of organic amendments in dense sodic subsoil increases summer fallow efficiency and the use of deep soil water by crops. Plant and Soil 359, 57-69.
| Crossref | Google Scholar |
Hall DJM, Jones HR, Crabtree WL, Daniels TL (2010) Claying and deep ripping can increase crop yields and profits on water repellent sands with marginal fertility in southern Western Australia. Australian Journal of Soil Research 48(2), 178-187.
| Crossref | Google Scholar |
Hall DJM, Davies SL, Bell RW, Edwards TJ (2020) Soil management systems to overcome multiple constraints for dryland crops on deep sands in a water limited environment on the south coast of Western Australia. Agronomy 10(12), 1881.
| Crossref | Google Scholar |
Henderson CWL (1991) Sensitivity of eight cereal and legume species to the compaction status of deep, sandy soils. Australian Journal of Experimental Agriculture 31(3), 347-355.
| Crossref | Google Scholar |
Jayawardane NS, Chan KY (1994) The management of soil physical properties limiting crop production in Australian sodic soils – a review. Australian Journal of Soil Research 32(1), 13-44.
| Crossref | Google Scholar |
Jayawardane NS, Blackwell J, Kirchhof G, Muirhead WA (1994) Slotting – a deep tillage technique for ameliorating sodic, acid and other degraded subsoils and for land treatment of waste. In ‘Subsoil management techniques’. Advances in soil science. (Eds NS Jayawardane, BA Stewart) pp. 109–146. (Lewis: Boca Raton, FL, USA)
King PM (1981) Comparison of methods for measuring severity of water repellence of sandy soils and assessment of some factors that affect its measurement. Australian Journal of Soil Research 19(3), 275-285.
| Crossref | Google Scholar |
Ma Q, Bell R, Scanlan C, Neuhaus A (2022) Long-term rundown of plant-available potassium in Western Australia requires a re-evaluation of potassium management for grain production: a review. Crop & Pasture Science 73(9), 981-996.
| Crossref | Google Scholar |
McDonald GK (1989) The contribution of nitrogen fertiliser to the nitrogen nutrition of rainfed wheat crops in Australia: a review. Australian Journal of Experimental Agriculture 29(3), 455-481.
| Crossref | Google Scholar |
Ning T, Liu Z, Hu H, Li G, Kuzyakov Y (2022) Physical, chemical and biological subsoiling for sustainable agriculture. Soil and Tillage Research 223, 105490.
| Crossref | Google Scholar |
Oliver YM, Robertson MJ, Stone PJ, Whitbread A (2009) Improving estimates of water-limited yield of wheat by accounting for soil type and within-season rainfall. Crop & Pasture Science 60(12), 1137-1146.
| Crossref | Google Scholar |
Oliver YM, Gazey C, Fisher J, Robertson M (2021) Dissection of the contributing factors to the variable response of crop yield to surface applied lime in Australia. Agronomy 11(5), 829.
| Crossref | Google Scholar |
Sale P, Malcolm B (2015) Amending sodic soils using sub-soil manure: economic analysis of crop trials in the high rainfall zone of Victoria. Australian Farm Business Management Journal 12, 51-61.
| Crossref | Google Scholar |
Sale PW, Gill JS, Peries RR, Tang C (2019) Crop responses to subsoil manuring. I. Results in south-western Victoria from 2009 to 2012. Crop & Pasture Science 70(1), 44-54.
| Crossref | Google Scholar |
Sale P, Tavakkoli E, Armstrong R, Wilhelm N, Tang C, Desbiolles J, Malcolm B, O’Leary G, Dean G, Davenport D, Henty S (2021) Ameliorating dense clay subsoils to increase the yield of rain-fed crops. Advances in Agronomy 165, 249-300.
| Crossref | Google Scholar |
Scott BJ, Coombes NE (2006) Poor incorporation of lime limits grain yield response in wheat. Australian Journal of Experimental Agriculture 46(11), 1481-1487.
| Crossref | Google Scholar |
Tester CF (1990) Organic amendment effects on physical and chemical properties of a sandy soil. Soil Science Society of America Journal 54(3), 827-831.
| Crossref | Google Scholar |
Uddin S, Williams SW, Aslam N, Fang Y, Parvin S, Rust J, Van Zwieten L, Armstrong R, Tavakkoli E (2022) Ameliorating alkaline dispersive subsoils with organic amendments: are productivity responses due to nutrition or improved soil structure? Plant and Soil 480(1), 227-244.
| Crossref | Google Scholar |
Unkovich M, McBeath T, Llewellyn R, Hall J, Gupta VV, Macdonald LM (2020) Challenges and opportunities for grain farming on sandy soils of semi-arid south and south-eastern Australia. Soil Research 58(4), 323-334.
| Crossref | Google Scholar |
Wagner S, Cattle SR, Scholten T (2007) Soil-aggregate formation as influenced by clay content and organic-matter amendment. Journal of Plant Nutrition and Soil Science 170(1), 173-180.
| Crossref | Google Scholar |
Wang X, Sale P, Hayden H, Tang C, Clark G, Armstrong R (2020) Plant roots and deep-banded nutrient-rich amendments influence aggregation and dispersion in a dispersive clay subsoil. Soil Biology and Biochemistry 141, 107664.
| Crossref | Google Scholar |