Spatial variability of mineral surface area and carbon sequestration potential at the farm scale – a case study
Sam McNally A * , Joanna Sharp B , Peter Jaksons C , Craig Tregurtha B , Mike Beare
  B and Robyn White A
A
B
C
Abstract
The ability of soils to contribute to greenhouse gas mitigation requires the stock of carbon to be increased in the long term. Studies have demonstrated the potential of soils to increase in carbon at global to regional scales, with soil mineral surface area a key factor to this potential. However, there is limited knowledge on the distribution of mineral surface area and whether the distribution of soil carbon sequestration potential varies at the farm scale.
The aim of this study was to evaluate the spatial variability in mineral surface area and sequestration potential of SOC at a farm scale.
We used a case study farm to apply existing published methodology and assess the spatial distribution of the mineral surface area, the maximum amount of stable carbon that a soil could hold, and the subsequent potential for soil carbon sequestration at the farm scale. A total of 200 samples were collected across the farm using a balance accepted sampling design prior to analysis for total carbon, mineral surface area, and sequestration potential.
Despite being in a localised area, the farm demonstrated that the distributions of mineral surface area and total carbon were related to variation in the underlying soil type. When data were examined spatially, there were areas within the farm that had greater potential to stabilise more carbon and also regions where there were greater carbon stocks.
The spatial distribution of SOC, mineral surface area, and potential to increase MAOC was well represented by the spatial distribution of soil type within a farm. This case study demonstrated areas within the farm that had potential to increase the MAOC fraction.
This case study offers an approach that would give farmers and land managers knowledge to improve the understanding of the carbon dynamics across their farm and to identify areas that have greater potential to contribute to greenhouse gas mitigation and the areas that would be more susceptible to soil carbon loss. Using this approach could allow targeted management practices to be applied to specific regions on-farm to either increase soil carbon or protect existing stocks.
Keywords: carbon sequestration, carbon stabilisation, farm scale, mineral surface area, mitigation, soil carbon stocks, soil organic carbon, soil type.
Introduction
Soil carbon (C) provides essential ecosystem services important for providing food and fibre and regulation of climate (Trivedi et al. 2018). However, agricultural land use has significantly reduced the amount of C stored in the soil (Sanderman et al. 2017) and contributes to the increase in atmospheric carbon dioxide (CO2) concentrations. Reversing this flux of C, through the adoption of negative emission soil C sequestration practices, could contribute to the goal of reducing atmospheric CO2 concentrations.
The past decade has seen advances in the understanding of soil C, through the development of conceptual frameworks and new soil biogeochemical models that incorporate measurable pools of soil organic C (SOC; Cotrufo and Lavallee 2022). While soil C is complex in its nature and function, two physically distinct fractions are commonly identified: particulate organic C (POC) and mineral associated organic C (MAOC). These two fractions differ in their relative size (i.e. proportional mass), biochemical composition, biodegradability, and persistence (Gregorich et al. 2006, 2015; Lützow et al. 2006; Poeplau and Don 2013; Curtin et al. 2022). The fraction associated with soil minerals, MAOC (<53 μm), is considered to represent the more stable and persistent fraction of soil C, defined as having longer residence times, greater resistance to decomposition, and more resistance to changes in land management (Lavallee et al. 2020). The POC fraction (>53 μm) is less stable and more vulnerable to changes in management and land use (Gregorich et al. 2006; Poeplau and Don 2013).
The benefits of soil C sequestration for climate change mitigation depend on ensuring that the new C that is stored is stabilised and persistent. While soils are generally thought able to accumulate SOC, they are limited in the quantity of C that can be stabilised through association with mineral surfaces and can thus become saturated (Six et al. 2002; Stewart et al. 2007, 2008; Cotrufo et al. 2019). However, there is debate in the scientific community on whether the total C stock of a soil becomes saturated (Kirschbaum et al. 2018; Begill et al. 2023).
There is increasing interest in the measurement and management of soil C at various scales. At the global scale, the 4p1000 initiative (4per1000.org) recognises the potential for soil C sequestration to contribute to reducing atmospheric CO2 concentrations. At the national and farm scales, the development of protocols for monitoring soil C stocks (FAO 2019), the introduction of C accounting programmes [e.g. the Australian Carbon Credits (Carbon Farming Initiative) Act 2011], and voluntary C markets (e.g. Verra Verified Carbon Standard) have increased interest in soil C. While many of the protocols and programmes only relate to the total stocks of soil C, an improved understanding of the ability of soils to store C in a more persistent form would enhance the success of these programmes.
Many studies have attempted to estimate the additional amount of SOC that could be stored in soils at global (Georgiou et al. 2022), national (Angers et al. 2011; Beare et al. 2014; McNally et al. 2017), or regional scales (Wiesmeier et al. 2014, 2015; Emde et al. 2022). These estimates have been based on statistical relationships between SOC content and measured soil properties, such as silt and clay content (Hassink 1997; Angers et al. 2011; Wiesmeier et al. 2014; Georgiou et al. 2022) or mineral surface area (Beare et al. 2014; McNally et al. 2017; Emde et al. 2022). Furthermore, many of these studies base the estimates on additional storage of SOC within the mineral associated fraction of soil (e.g. silt and clay fraction). However, no previous studies have considered spatial variability in the stabilisation capacity (upper limit of MAOC) and sequestration potential of SOC at the farm scale, where differences in soil texture and properties may not be as variable as that observed at a regional or national scale, and the implications for SOC management to enhance SOC stocks at the farm scale.
An understanding of the current SOC stock and the potential for accumulation of SOC at the farm scale would allow land managers to make spatially explicit decisions and implement management change to increase their SOC stocks or reduce the losses of this SOC. In addition, more recent studies have called for more localised soil information to support and translate soil specific management options into SOC sequestration (Amelung et al. 2020). Management options that could be applied in a targeted manner, to soils with the potential to increase in SOC, include management of effluent or plant C inputs (Whitehead et al. 2018) or redistribution of biomass (Kirschbaum et al. 2020a). Alternatively, management practices known to decrease soil C stocks could be avoided from soils that have high SOC stocks or from soils that had high stocks relative to their mineral surface area.
The objective of this study was to apply previous methodology to evaluate the spatial variability in the mineral surface area and sequestration potential of SOC at a farm scale and assess how this variability might affect management decisions to increase farm-scale SOC stocks.
Methods
Site location
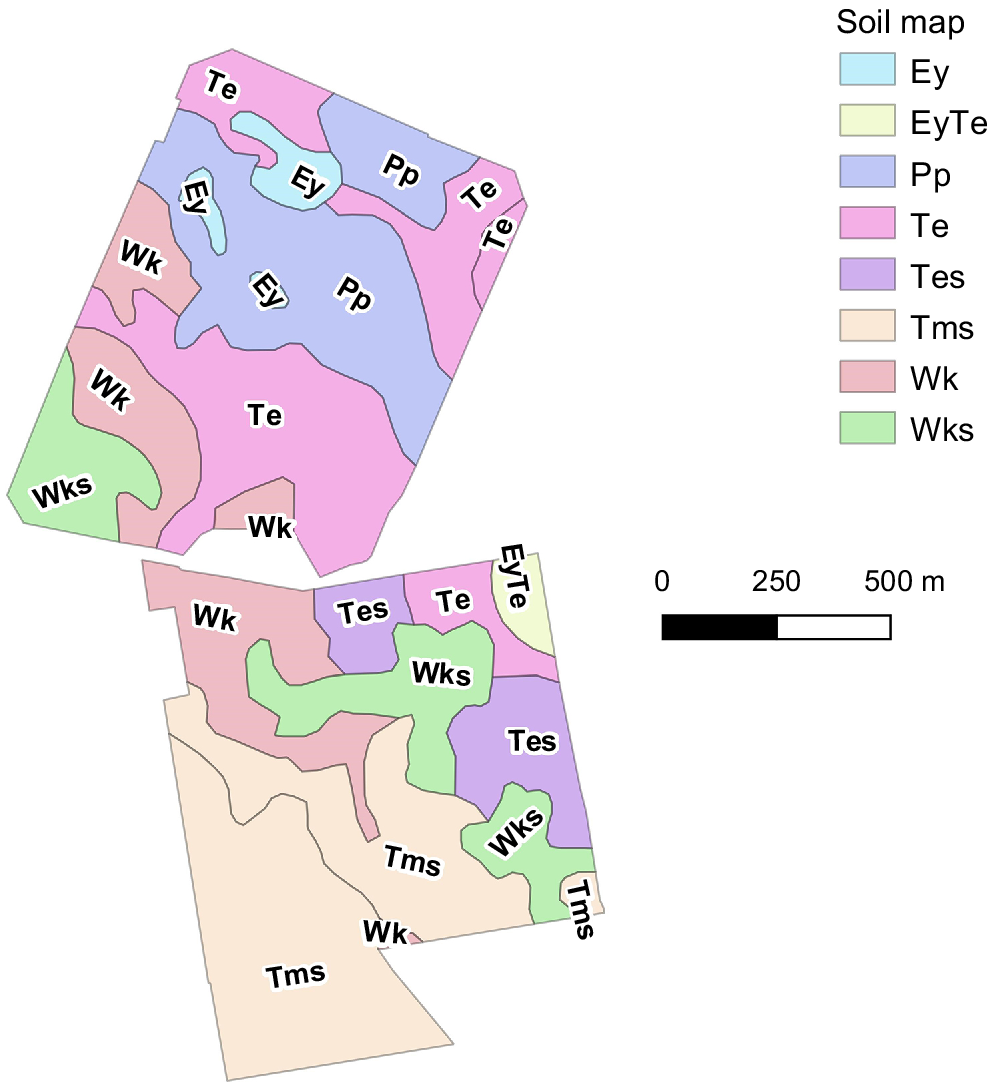
The study site was located at the Lincoln University Dairy Farm (LUDF) near Lincoln, Canterbury, New Zealand (43°38′41.41″S, 172°26′28.74″E). The farm is managed as a 160-ha milking platform utilising a high-quality irrigated pasture that is permanently grazed by dairy cows (3.4 cows ha−1). The farm is split into two distinct blocks (‘North’ and ‘South’), which are both approximately 80 ha in size (Fig. 1). The annual dry matter (DM) production of the farm is approximately 19 t DM ha−1 and total annual milk production is approximately 500 kg MS cow−1 (SIDDC 2023). The pasture composition across the farm is predominantly a grazed perennial ryegrass (Lolium perenne L.) and white clover (Trifolium repens L.) sward, although some paddocks contain other species such as timothy (Phleum pratense L.), plantain (Plantago lanceolata L.), and chicory (Cichorium intybus L.). The mean annual rainfall (30 years) of the site is 660 mm and mean monthly minimum and maximum temperatures are 4°C and 32°C respectively. The annual average irrigation input for the site is approximately 450 mm of water applied predominately over the summer period. The site had a range of soil types distributed across the farm (Fig. 1, Table 1), which are representative of some of the most common soil types found across the Canterbury Plains, New Zealand.
Aerial view of the case study dairy farm comprising two blocks (North and South) with the respective soil map describing the various soil types as described in Table 1.
| Soil type | NZSC | USDA equivalent | Abbreviation | Sand (%) | Silt (%) | Clay (%) | |
|---|---|---|---|---|---|---|---|
| Eyre – shallow, stony soil | Recent | Entisols, Inceptisols | Ey | 60 | 30 | 10 | |
| Eyre/Templeton – shallow | Recent | Entisols, Inceptisols | EyTe | 55 | 35 | 10 | |
| Paparua – deep | Pallic | Inceptisols, Alfisols | Pp | 50 | 35 | 15 | |
| Templeton – deep | Pallic | Inceptisols, Alfisols | Te | 30 | 55 | 15 | |
| Templeton – deep, slow drainage | Pallic | Inceptisols, Alfisols | Tes | 25 | 55 | 20 | |
| Temuka – very heavy, slow drainage | Gley | Aquic groups | Tms | 5 | 45 | 45 | |
| Wakanui – deep | Pallic | Inceptisols, Alfisols | Wk | 20 | 60 | 20 | |
| Wakanui – deep, slow drainage | Pallic | Inceptisols, Alfisols | Wks | 15 | 60 | 25 |
Sand, silt, and clay percentages obtained from Smap-online (Manaaki Whenua 2023);
NZSC, New Zealand Soil Classification; USDA, U.S. Department of Agriculture.
Field sampling
Soil sampling was carried out in November 2019. A representative sampling design was used to sample the entire farm (160 ha), based on a spatially balanced design adapted from the balanced acceptance sampling method of van Dam-Bates et al. (2018). A substantial amount of prior knowledge existed for the LUDF farm (e.g. soil and electromagnetic maps) that would have allowed a sampling design to be refined and constructed using other statistical approaches (e.g. stratified sampling). However, as we wanted this method to be representative and applicable to farmers, we made the decision that prior knowledge of the spatial variability of soils at this site would not be applied in this instance. Our aim was to ensure that the sampling strategy evaluated in this study would be suitable for application to other farms where there was limited prior knowledge of the soils, for which the balanced design approach was suitable.
Sampling site coordinates (i.e. latitude and longitude) were generated within the farm boundary. A fixed polygon, confined to the farm boundary, was defined and coordinates were randomly allocated in a balanced design to ensure a representative coverage across the farm. A total of 200 sites were randomly allocated and represented 100 sites in each of the North and South blocks. The random generation of coordinates was carried out using R (ver. 3.6, R-project.org). These coordinates for each sampling location were loaded into a GPS for on-site location in the field.
Sample locations were located for each of the 200 sampling sites, within 1 m accuracy, using a GPS (Trimble Geo 7X). In any instance where the sampling site was unsuitable (e.g. proximity to a fence line, gateway, building, or laneway) the site was moved to a new position within 15 m of the original site and the new location coordinates recorded.
At each location, five soil cores (0–0.15 m depth, 0.025 m Ø) were collected from within a 0.3 m radius circle. All five cores within each sample location were bulked together and stored in a cooler box prior to processing for laboratory analysis.
An independent subset of 20 sample coordinates was generated for bulk density analysis. These 20 locations were allocated using the information from the existing soil map to ensure that bulk density measurements were taken to represent all the soil types across the farm in at least two independent locations. We acknowledge that a smaller subset of cores for the purpose of determining bulk density was a limitation of the study but was a constraint of the available resources. The use of a larger diameter corer for future sampling to allow determination of both bulk density and soil C from the same sample would be advantageous.
Sample analysis
All soil samples were thoroughly homogenised by sieving (2 mm) prior to laboratory analysis. Soils were air dried for 7 days within a cabinet where air was constantly circulated, and the temperature maintained at 25°C. An industrial de-humidifier was used to remove moisture in the air such that the relative humidity remained below 30% throughout the drying process. The air-dried water content (ADWC) was determined on all samples following oven drying a subsample at 105°C for 16 h and calculating the mass differential before and after oven drying.
The mineral surface area was calculated from the ADWC of each soil using the relationship defined by Eqn 1 (Theng et al. 1999; Hedley et al. 2000; Parfitt et al. 2001):
where SA is the apparent surface area and 2 is the conversion factor as per Parfitt et al. (2001). Most of the moisture in the air-dried soils is associated with the mineral surfaces; however, there is also a confounding effect of water being adsorbed to existing organic C molecules. We accounted for, and removed, this confounding effect using the mathematical function described by Eqn 2 (Kirschbaum et al. 2020b):
where Am is the true mineral surface area of soil (m2 g−1) referred to as mineral surface area, fc is the contribution of SOC to the apparent surface area with a value of 0.43 ± 0.02 m2 g−1 mgC−1, and C is the total carbon concentration (mgC g−1) of soil.
Total carbon concentration (%) was determined by Dumas dry combustion of 0.5-g soil samples (2-mm sieved subsamples, air dried at 60°C) on a LECO TruMac CN analyser (LECO Corporation, St. Joseph, MI, USA).
Bulk density was determined using a subset of sample that represented the soil types across the farm. These bulk density samples (N = 20) were collected using a motorised coring device with a core diameter of 0.04 m. For each bulk density sample, two cores were collected and bulked by 0–0.15 m depth increment. The mass of soil was first recorded and then the sample homogenised through a 4-mm sieve. A thoroughly mixed subsample was removed and dried at 105°C for 16 h to determine the field moist water content. The bulk density of samples was then calculated and corrected to an oven dry mass basis (gsoil ODW cm−3). The bulk density values of each soil type were used to convert the soil C concentration results into soil C stocks. The individual soil samples across the farm were assigned a bulk density value, as measured, according to each individual soil type. Bulk density values were assigned by overlaying the soil map with sampling location in QGIS.
The total SOC stock of the farm was calculated by multiplying the mean SOC stocks for each soil type by the total area (ha) for each of the soil types. The area of each soil type was determined as the area within each polygon specific to that soil type.
The C concentration of the fine fraction, or mineral associated C, was estimated as 85% of the total C concentration. This relationship was previously demonstrated to be suitable for soils under long-term pasture in New Zealand (Beare et al. 2014; McNally et al. 2017). To be consistent with recent literature, the fine fraction C is defined as that associated with the <53 μm mineral fraction (Lavallee et al. 2020), hereafter refered to as the MAOC fraction.
The upper limit of MAOC (MAOCUL) was defined as the maximum amount of C that could be associated with soil mineral surfaces. This was calculated using a single variate quantile (τ = 0.9) regression model outlined in a previous study (eqn 3, McNally et al. 2017). The specific parameters used in the model for determining the upper limit in this study were defined by the following equation:
where log(MAOCUL) is the natural log of MAOCUL (mgC gsoil−1), log(Am) is the natural log of the mineral surface area (m2 g−1), and (Allophanic) refers to whether the sample was an Allophanic soil or not. If a soil is non-Allophanic, as for all the soils in the current study, the ‘Allophanic’ term is redundant and set to zero. The value of log(MAOCUL) was back-transformed using an exponential function to provide a value for MAOCUL (Eqn 4):
The amount of additional C that could be stored in the mineral fraction (MAOCPotential) was calculated as the difference between MAOCUL and the current MAOC concentration (Eqn 5):
The C loading ratio of the mineral surfaces was calculated as the quantity of MAOC relative to the mineral surface area (Eqn 6):
The distribution and spatial variability for a range of the measured soil properties were mapped using a combination of GIS (QGIS) and R (ver. 4.0; R Core Team 2018). Data were visually inspected in R using the e1071 (ver. 1.7-13), gstat (ver. 2.0-9), and geoR (ver. 1.81) packages. Also using the geoR package, models of each parameter were then fitted to the corresponding variogram. These models were then kriged onto a 30 m × 30 m grid across the study site using simple kriging for fixed covariance parameters using global neighbourhood from the geoR package. Kriged values were mapped with the gstat and ggplot2 packages and contour lines were added to aid interpretation.
The spatial mapping was carried out to provide a visual representation of the data associated with the various soil properties measured. This visual representation was completed to elucidate and assess areas, within the farm, that had greater potential to increase soil C stocks.
Results
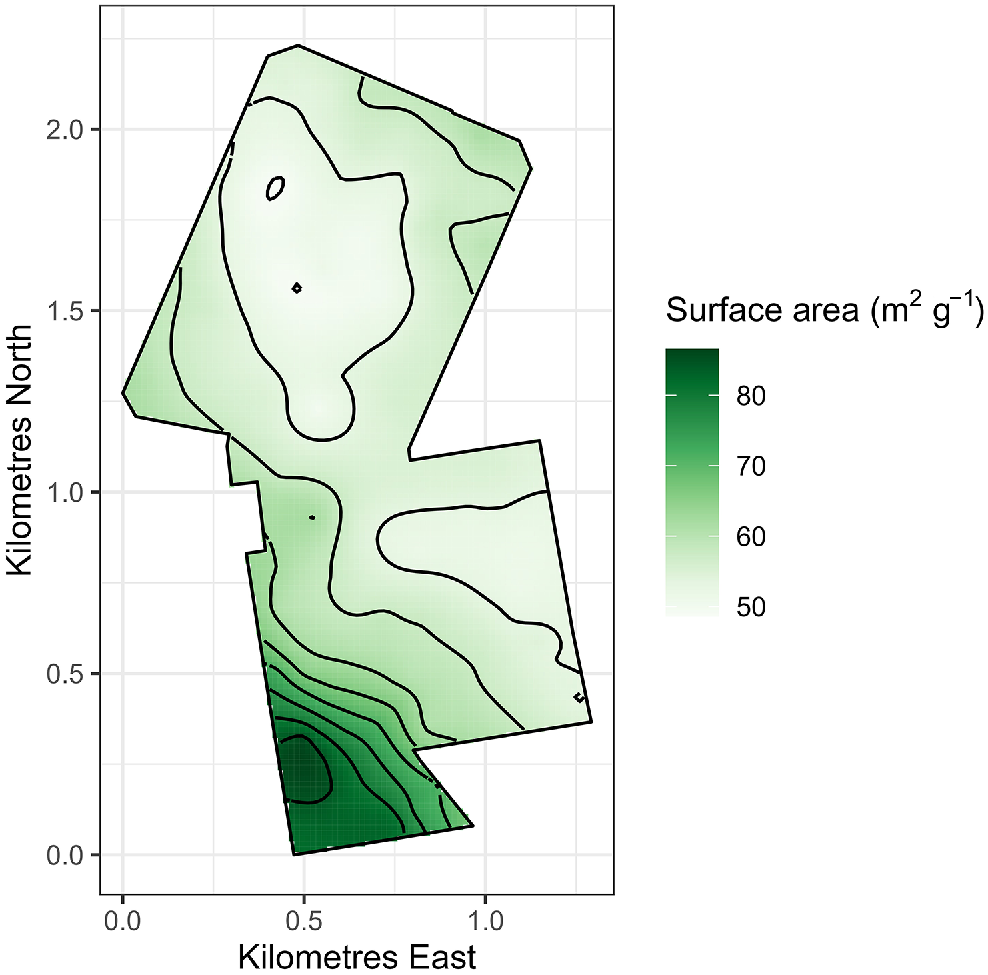
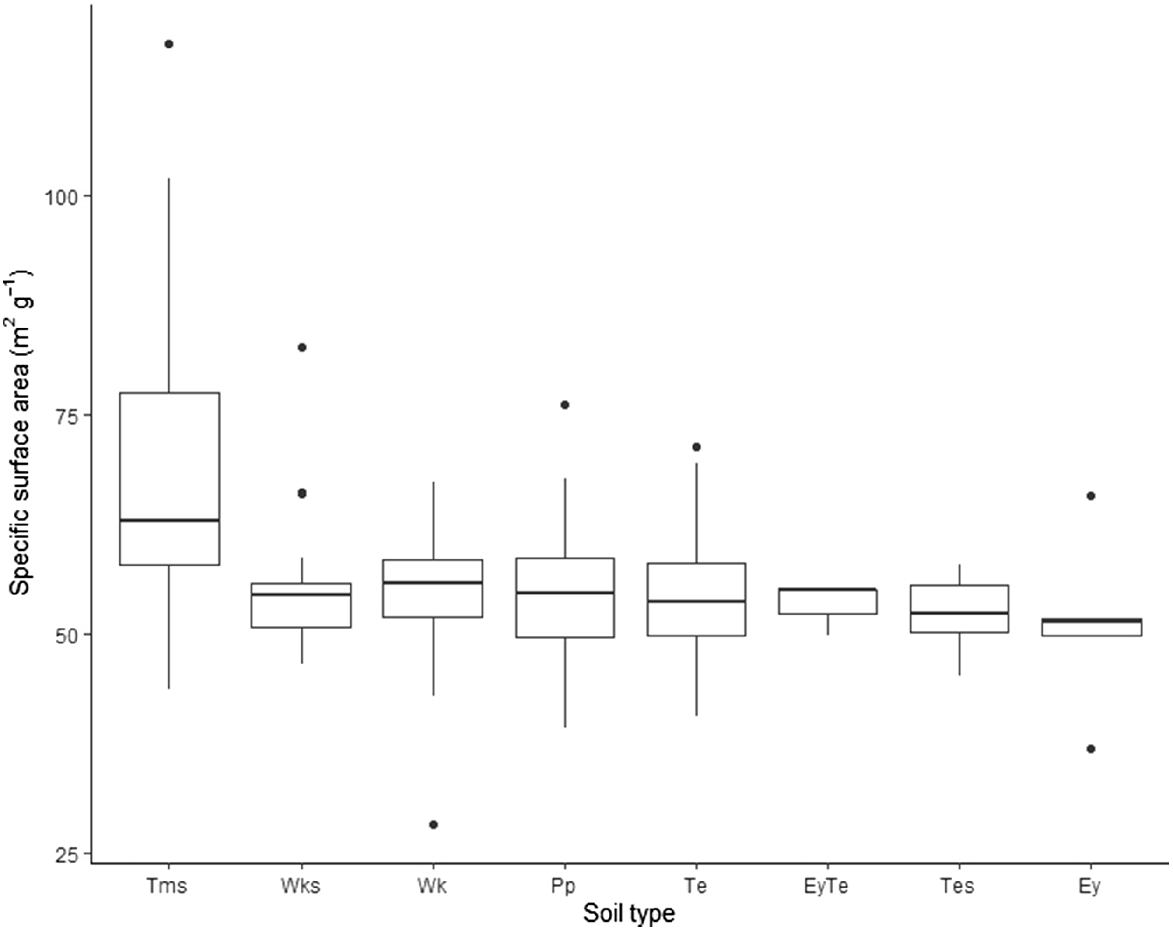
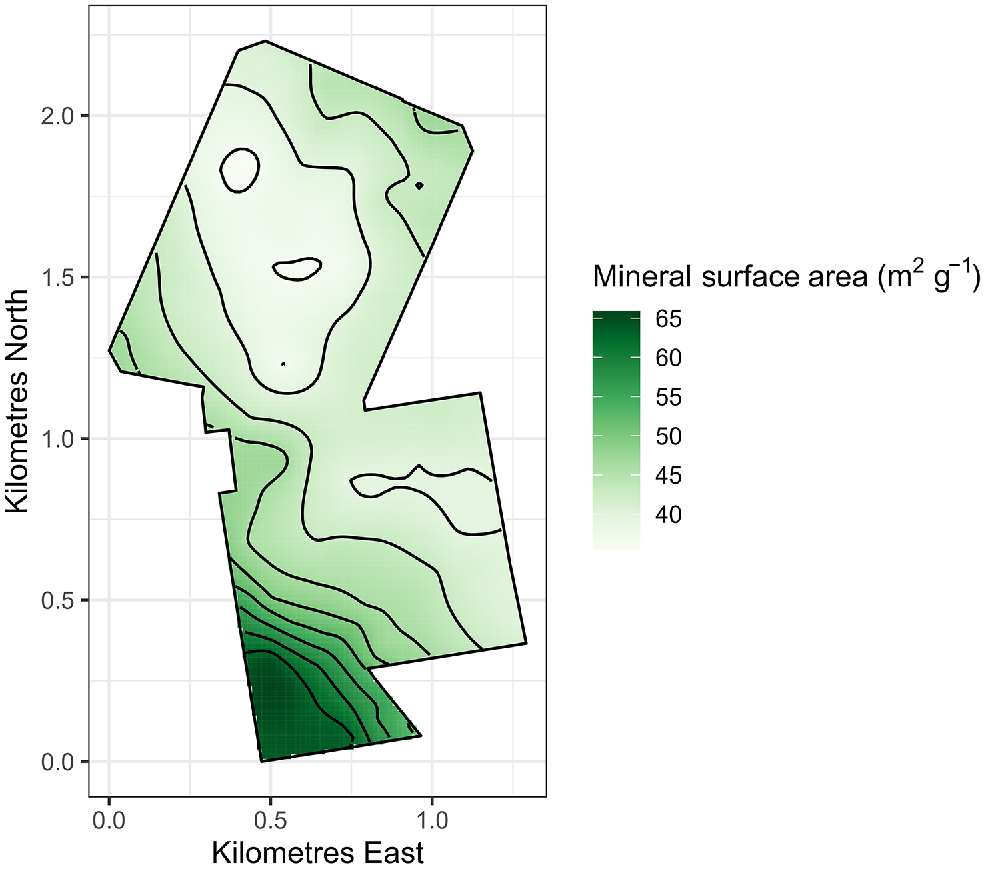
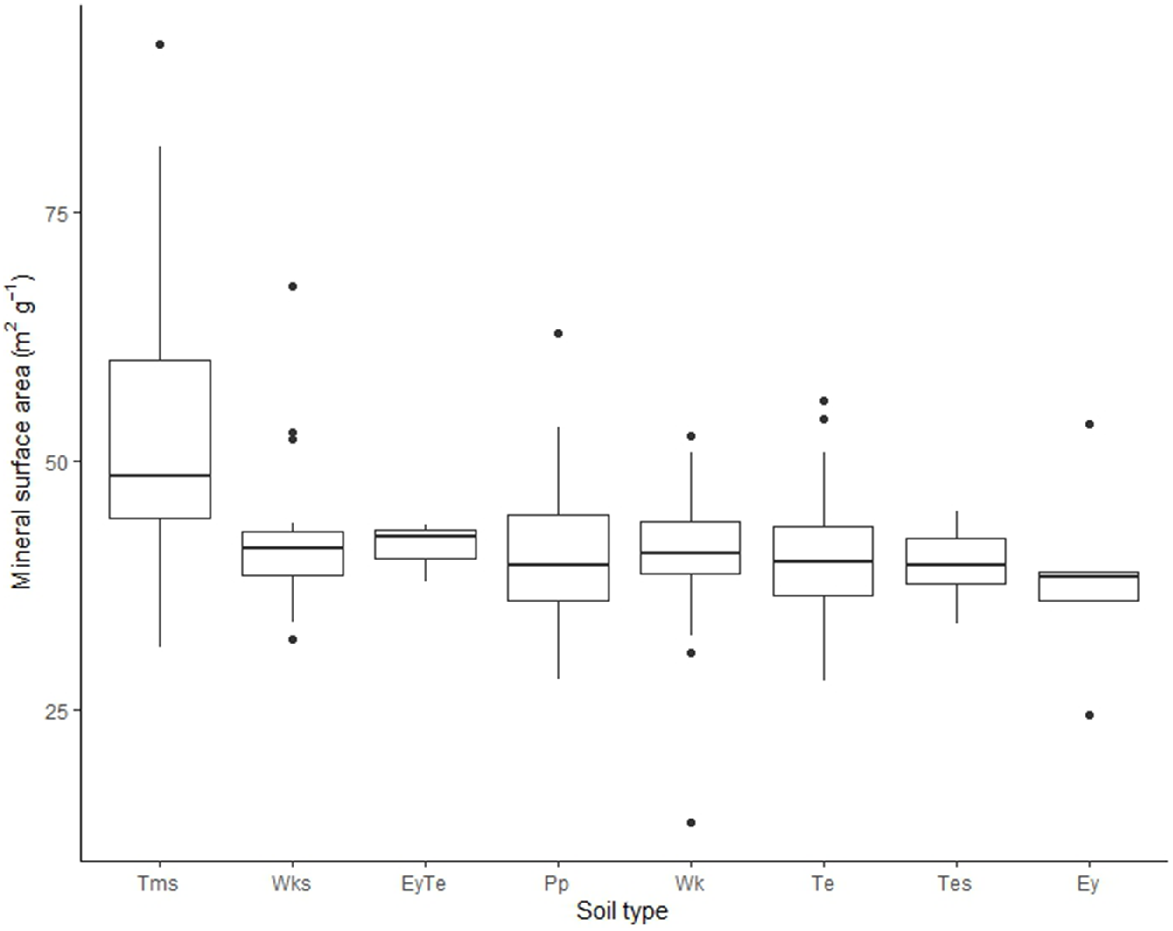
The apparent surface area of the soils in this study ranged within 28.6–117.30 m2 g−1 with a mean value of 57.86 m2 g−1 (Figs 2 and 3). The heavier textured Temuka soil type (Tms) had significantly higher surface areas than all the other soils (P < 0.001) with these remaining soil types not significantly different from each other. Adjusting for the effect of SOC content on the ADWC, as described by Kirschbaum et al. (2020b), resulted in a 25% reduction in the mean mineral surface area (57.86 m2 g−1) with values of 13.64–91.93 m2 g−1 (Figs 4 and 5). However, the distribution of mineral surface area across the farm was the same as that described for the apparent surface area.
Boxplots displaying the variability in apparent mineral surface area (m2 g−1) of individual soil types distributed across the farm. Refer to Table 1 for details of the individual soil types.
Contour plot of the mineral surface area (m2 g−1) distributed across the case study farm. The data presented are the result of the mineral surface area after removing the confounding effect of soil C as per Kirschbaum et al. (2020b).
Boxplots displaying the variability in mineral surface area (m2 g−1) of individual soil types across the farm after adjustment for the influence of soil organic C content. Refer to Table 1 for details of the individual soil types.
The spatial distribution of the C concentration across the farm also corresponded to soil type and mineral surface area, with the highest concentrations in soil types characterised as having heavier texture (Table 2) and greater mineral surface area (e.g. Temuka, Tms soil type). The total C concentration across the study site ranged within 2.0–5.9%, with an average concentration of 3.3% in the top 0.15 m of soil. The range in bulk density across the site was 1.20–1.42 gsoil cm−3, which is typical of these soil types under permanent pasture in the Canterbury region of New Zealand (Manaaki Whenua 2023).
| Soil typeA | N | Area (ha) | Mean C stock (t ha−1) | Mean MAOC stock (tC ha−1) | Total stock C (tC) | Mean MAOC loading ratio | |
|---|---|---|---|---|---|---|---|
| Ey | 5 | 3.9 | 59.5 | 50.5 | 233 | 0.71 | |
| EyTe | 3 | 2.0 | 54.6 | 46.4 | 109 | 0.58 | |
| Pp | 33 | 26.4 | 62.5 | 53.1 | 1650 | 0.68 | |
| Te | 44 | 35.9 | 63.7 | 54.2 | 2287 | 0.70 | |
| Tes | 10 | 10.6 | 62.6 | 53.2 | 664 | 0.63 | |
| Tms | 51 | 39.3 | 67.0 | 56.9 | 2637 | 0.62 | |
| Wk | 33 | 24.2 | 62.0 | 52.7 | 1500 | 0.70 | |
| Wks | 21 | 19.9 | 59.7 | 50.8 | 1188 | 0.64 | |
| Total | 200 | 162.2 | 63.3 | 53.8 | 10,267 | 0.66 |
N, number of sampling locations allocated to within the area.
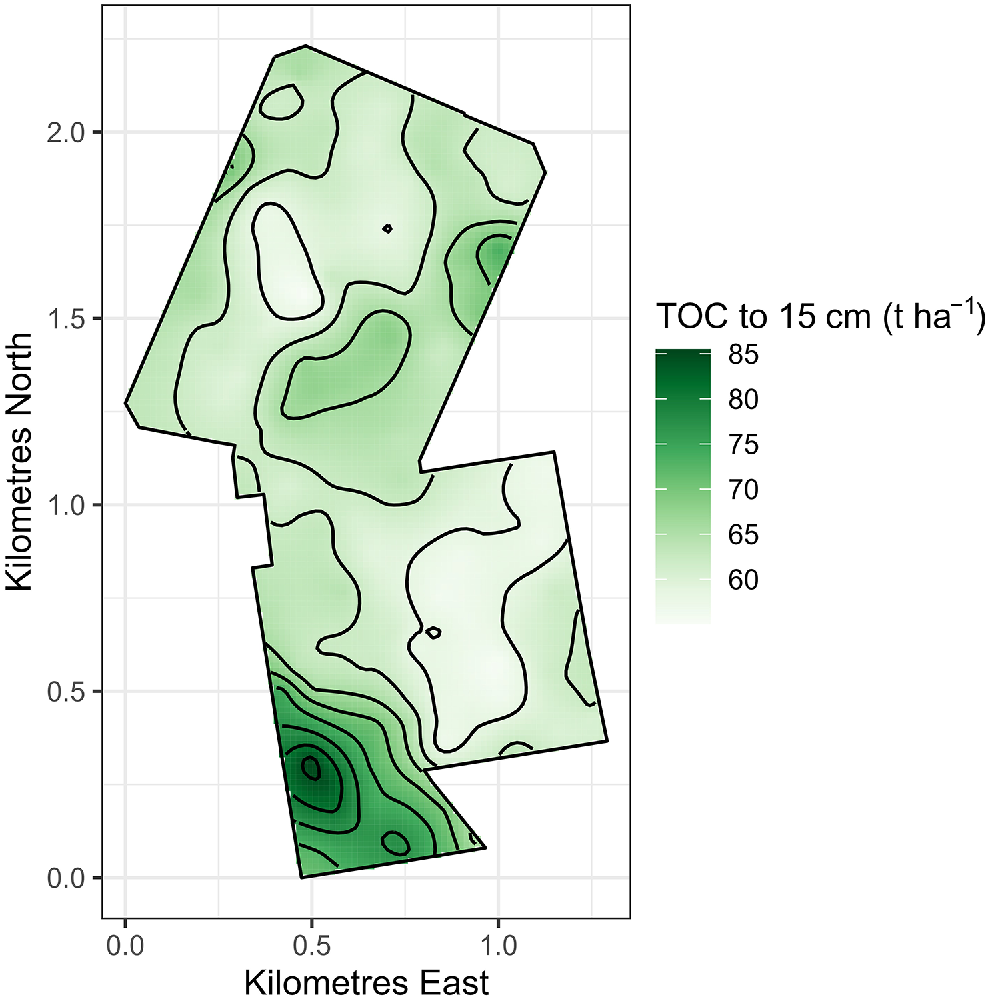
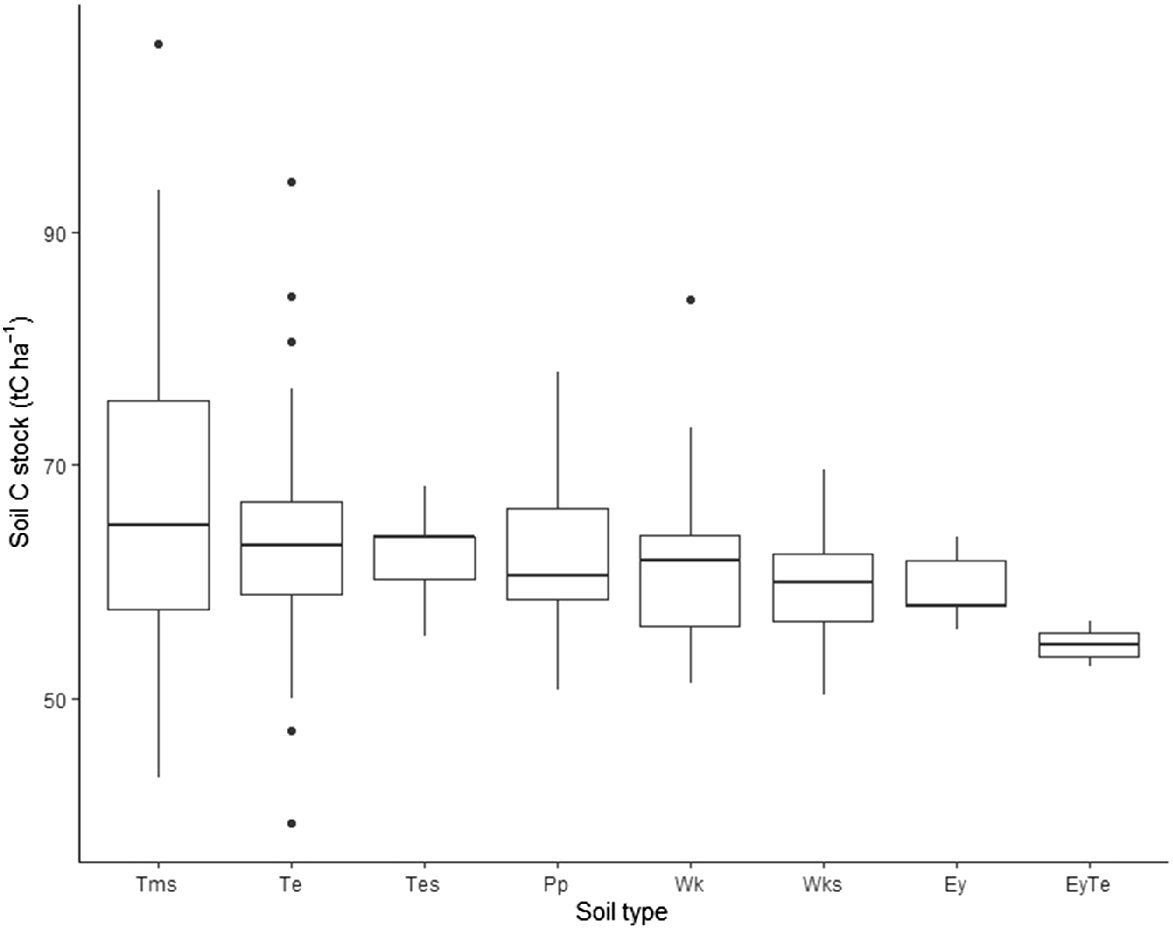
The range in total stock of C in the 0.15 m depth layer was 39–106 tC ha−1 with a mean of 63 tC ha−1 (Figs 6 and 7). The highest C stocks were associated with the heavier soil types (e.g. Temuka) found in the south-western corner of the farm and the lower stocks were associated with the lighter soil types (e.g. Eyre and Templeton soils). Therefore we demonstrated that, at the farm scale, C stocks display large variation driven by changes in soil type despite being under similar management.
Spatial distribution of total organic carbon stocks (TOC, tC ha−1) at the Lincoln University Dairy Farm (0.15 m depth). Please note the difference in the scale between the contour plot and boxplots. The boxplots reflect the entire range as opposed to the contour plot, which has smoothed the data in the interpolation process.
Total organic carbon stocks (tC ha−1) for the various soil types at the Lincoln University Dairy Farm (0.15 m depth). Refer to Table 1 for details of the individual soil types.
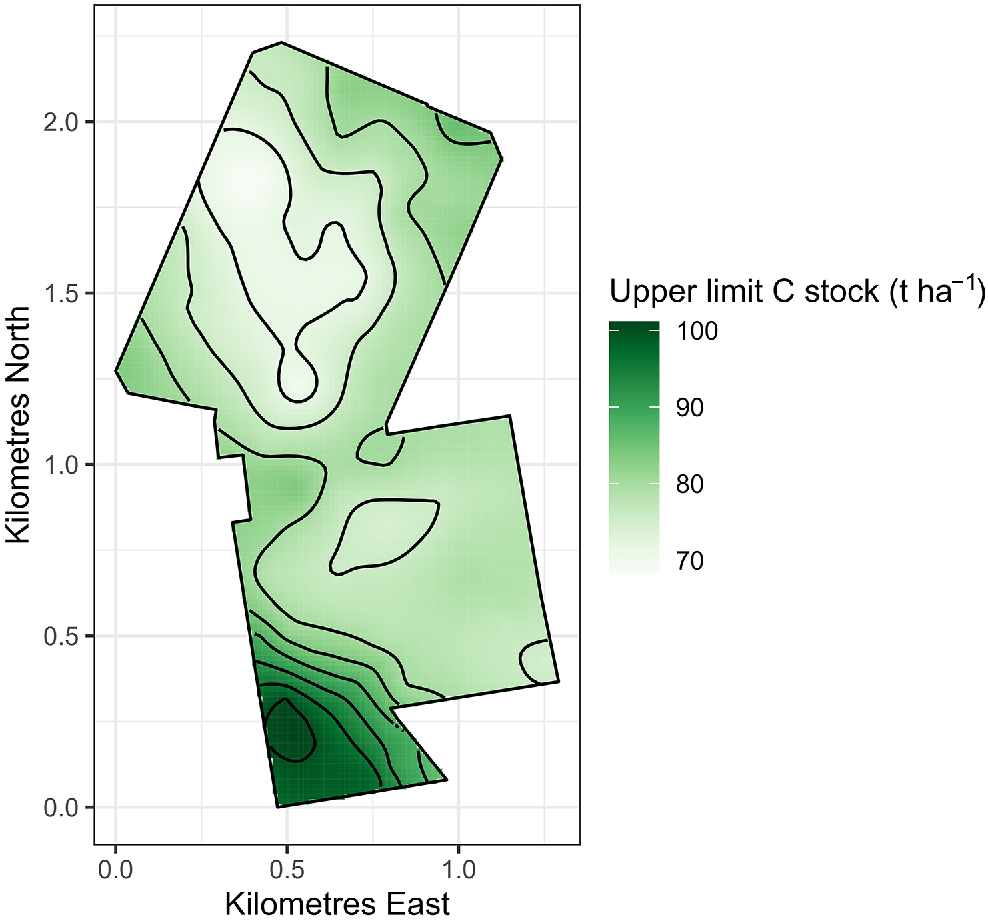
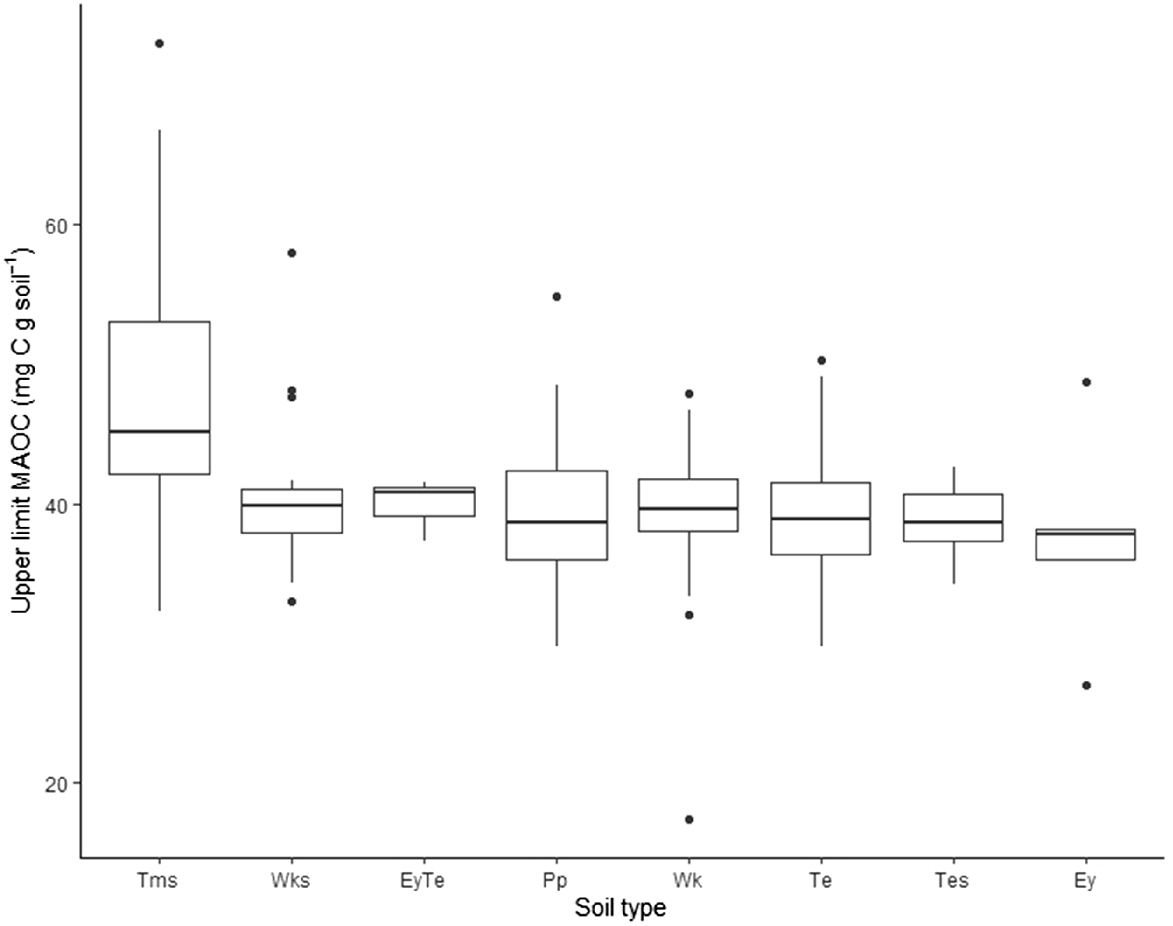
The maximum amount of MAOC that could be held, the MAOCUL, was calculated using a 90th quantile regression with mineral surface area. This statistical relationship was determined in previous studies (Beare et al. 2014; McNally et al. 2017). The MAOCUL in the soils of the current study ranged within 17.3–77.0 mgC gsoil−1 with a mean of 41.4 mgC gsoil−1 (Figs. 8 and 9). When these upper limit C concentrations were expressed as C stocks, the values were 31.8–131.5 tC ha−1 (Fig. 8), depending on mineral surface area. The distribution of this upper limit, for each soil, across the farm was used to explore the areas with greater potential to stabilise additional MAOC.
Spatial representation of the maximum amount of C (tC ha−1) that can be stored in the MAOC fraction.
Maximum amount of carbon (mgC g−1) that can be stored in the MAOC fraction by individual soil type across the farm. Refer to Table 1 for details of the individual soil types.
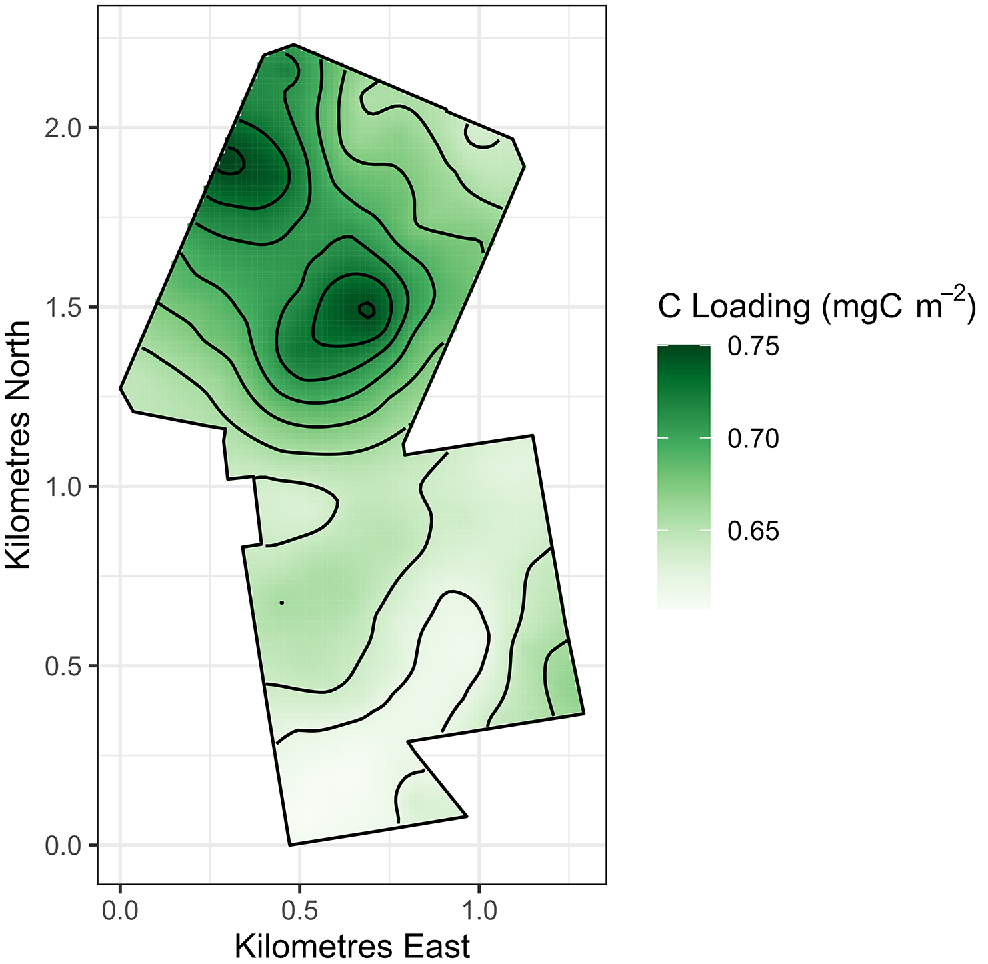
The total stock of SOC in the top 15 cm of soil across the whole farm, calculated by multiplying the mean stock of each soil type by its corresponding area, was approximately 10,267 tC. This stock equates to an average of 64 tC ha−1 over the farm. Within this total SOC stock, the average C loading, or MAOC/Am, of each soil type had values all below 1, with a range of 0.58–0.71 (mgC m−2 mineral surface area, Fig. 10). These ratios, all lower than 1, indicate that each soil type would have available mineral surface area to further stabilise additional SOC.
Discussion
Mineral surface area is a functionally significant measure of a soil’s ability to stabilise SOC (Beare et al. 2014; McNally et al. 2017; Kirschbaum et al. 2020a). This functional relationship was demonstrated, using soils across New Zealand, where mineral surface area explained 84% of MAOC variability (McNally et al. 2017). In a subsequent study, using samples from within a farm in New Zealand, 75% of the variation of total SOC was explained by mineral surface area (Kirschbaum et al. 2020a). In the current study, apparent mineral surface area explained 51% of the variability in the total SOC. After adjusting the apparent mineral surface area values, for the confounding effect of soil C (Kirschbaum et al. 2020b), the mineral surface area explained 35% of the variation in total SOC. The current study had a much narrower range in mineral surface area values (14–92 m2 g−1) compared to previous studies (~20–240 m2 g−1; McNally et al. 2017) which could be one reason for the lower proportion of the variance explained by mineral surface area. Further investigation would be required to understand the reason for the lower proportion of the variance in SOC explained by mineral surface area at this site.
The MAOC fraction represents the largest proportion of SOC in New Zealand grassland soils, with approximately 83% of the total SOC being in MAOC (McNally et al. 2017) or 84–86% of total SOC (e.g. Pallic, Recent, and Gley soils) for the same soils investigated in the current study (McNally et al. 2018). For the purposes of this study, we assumed that MAOC comprised approximately 85% of the total SOC, in grassland soils, based on the evidence from these previous studies (e.g. Beare et al. 2014; McNally et al. 2017). Although there was variability in both the mineral surface area and SOC, across the farm in the current study, the MAOCUL followed the same general patterns observed in the distribution of mineral surface area (Fig. 4) and total SOC (Fig. 6). The soils with the highest mineral surface area also had the highest MAOCUL values (i.e. south-western area of the farm). These results are consistent with other studies internationally. For example, in a study based in Canada, the MAOC upper limit was demonstrated to increase with increasing clay content (Emde et al. 2022). Furthermore, a large meta-analysis highlighted that soil properties such as silt and clay were the most important factor defining the capacity of SOC (Matus 2021). Numerous other studies have applied this relationship between SOC and silt and clay content to define the maximum amount of C that can be stored in the MAOC fraction (Hassink 1997; Angers et al. 2011; Wiesmeier et al. 2014). Therefore, at the farm scale, the distribution of soil type is likely to be the key driver of any potential to increase SOC, based on inherent soil properties that are important for SOC protection (e.g. silt and clay content or mineral surface area).
As an alternative to calculating MAOCUL using the quantile regression equation, we suggest that the loading of MAOC relative to the mineral surface area (i.e. MAOC/Am) could be a useful proxy of a soil’s ability to further increase the MAOC. The maximum C loading of mineral soils has been proposed as 1.0 mgC m−2 of mineral surface area (Feng et al. 2013) with mineral surface area being an important component of SOC storage. Therefore, MAOC/Am could be viewed as a simplified way of determining whether the mineral surfaces are at their maximum C loading and whether a soil may respond to additional C input. When MAOC/Am was explored spatially across the farm (Fig. 10), the C loading ranged within 0.38–1.32 mgC m−2 with a mean of 0.67 mgC m−2 for the entire farm (Table 2). The areas where the C loading was the greatest (i.e. Paparoa and Templeton soils, Figs 1 and 10) also corresponded to the areas which had the lowest MAOCUL (Fig. 8; e.g. centre of Northern block). While previous studies have predicted the capacity of a soil to store additional SOC in the stable fraction (Beare et al. 2014; McNally et al. 2017; Emde et al. 2022) these have all relied on a theoretical estimate based on quantile regression. However, the C loading using MAOC and mineral surface area (both measurable properties of a soil) means that MAOC/Am could be more meaningful and relevant to landowners, although further research is needed to investigate the efficacy of this approach.
The area with the lowest C loading was in the south-western corner of the farm, e.g. the Temuka soils, the same region that displayed the greatest potential to increase MAOC. Interestingly, the MAOC loading in the North block could in part be explained through historical effluent application. Parts of this block (within the pivot irrigation area) received effluent at an annual rate of 200 kg N ha−1. Assuming an effluent C:N ratio of 3.4 kg kg−1 as per effluent from a nearby dairy farm (Graham et al. 2022), the C input would have been increased by approximately 680 kg C ha−1 year−1 above that provided through plant inputs. This continued additional C input over time may have acted to load these mineral surfaces. The soil types within the North block had lower mineral surface areas compared to soils in the South block (e.g. Tms soil type, Fig. 4). Therefore, these soils should approach their theoretical maximum C loading sooner than the soils with higher mineral surface area, assuming similar rates of C input. It could be argued that applying effluent, or additional C, to soils that have higher mineral surface area and a lower MAOC loading would be more beneficial as these soils would have greater capacity to protect and retain these additional nutrients from losses. Applying effluent on the south-western area of the farm (e.g. Temuka soils) in the current study could lead to additional protection of C added due to the greater mineral surface area and lower C loading. However, these heavier soils are characterised as poorly drained compared to the soils in the North block, which are more free draining (Manaaki Whenua 2023). Therefore, while adding effluent to these heavier soils may help to increase soil C, the increased leaching risk and water logging of these soils would need to be carefully considered.
This C loading ratio may also act as an indicator for soils that are susceptible to loss of C. Previous studies have highlighted that as the C loading of mineral surfaces increases, the bond strength decreases, making the organic molecules more susceptible to microbial decomposition (Kögel-Knabner et al. 2008). Therefore, if a soil contains a C loading close to its protective capacity (i.e. defined by ratio close to 1.0 mgC m−2), the potential to further increase this stable fraction of C would be limited. However, these soils may be more susceptible to loss of SOC if changes of management occurred that either reduced C inputs or enhanced respiratory losses. Recent studies in New Zealand have demonstrated large losses of SOC and MAOC in cropping soils compared to grassland soils (McNally et al. 2017; Curtin et al. 2022), with a significant proportion of MAOC lost from these cropping soils (McNally et al. 2017). Therefore, the spatial distribution of this C loading, or the relative amount of MAOC in relation to the surfaces that act to protect it, would enable decision making that helps to protect these high SOC stocks. For example, avoiding management practices that enhance the decomposition of these SOC stocks (e.g. disturbances through forage cropping and extended fallow periods) on the soils that have high MAOC stocks relative to the mineral surface area would be critical.
While the areas that displayed the largest MAOCUL also had the highest SOC stocks, it could be assumed that the soils are at a steady state based on New Zealand’s soil C inventory model (McNeill et al. 2014) assumptions and that the current farm has been under long-term pasture management. This farm has well documented and relatively high levels of pasture production for many years (SIDDC 2023). Hence, a limitation to further increasing the MAOC in the soils of the current study could be driven by limitations in C input. The farm is irrigated and receives frequent nutrient additions resulting in a highly productive pasture with an average annual pasture production since 2016 of around 14.8 t DM ha−1 year−1 (SIDDC 2023). Increasing pasture production and C inputs beyond this current level of production would be challenging. However, using the distribution of MAOCUL, or the mineral surface area, would identify the areas on-farm that have greater potential to increase SOC where any practice that could lead to increases in SOC could be implemented.
This study applied a sampling approach based on the assumption of no prior knowledge of the site. This decision was made to capture data across the entire farm and understand the variability in soil properties such as mineral surface area and C concentration. However, one limitation to this approach is that it is expensive from both a labour and analysis standpoint, which would make this approach impractical and unviable in a commercial setting. Therefore, applying this approach using a stratified sampling such as that recommended for farm-scale monitoring (MPI 2020) would reduce cost and make it more viable for many farmers.
The information gained from this study would be useful to identify areas where soil C has the potential to be increased. However, while options to further increase SOC in New Zealand grassland soils are limited (Whitehead et al. 2018) they could be achieved by increasing C inputs through management practices such as effluent application, incorporation of supplementary feed, grazing management, and increasing root biomass. A modelling study demonstrated that feeding animals supplementary feed, in addition to pasture, could result in higher SOC through increasing the net C inputs of the system (Kirschbaum et al. 2017). However, no effect of importing supplementary feed on SOC was observed using eddy covariance measurements (Wall et al. 2019) and the production of the supplementary feed elsewhere, on-farm, results in large losses of SOC (Wall et al. 2020). While the results from these studies are contrasting, no baseline SOC was obtained that demonstrated that these soils had the capacity to increase in SOC. Therefore, future research investigating these management effects could benefit by establishing trials on soils that have capacity to increase in SOC. Consequently, understanding the distribution of SOC, mineral surface area, and areas of greater potential to protect additional C would greatly benefit the science community in addition to farmers. Furthermore, future research that applies this approach using a more stratified sampling would be beneficial to reduce sample size and cost and make the approach more viable and commercially practical.
Conclusion
The spatial distribution of SOC, mineral surface area, and potential to increase MAOC was well represented by the spatial distribution of soil type within a farm. This case study demonstrated that despite the farm operating at a very high level of pasture production and under the same management history, there are areas within the farm that had potential to increase the MAOC fraction. In addition, this case study highlights the potential of using the C loading ratio as a measure to identify soils with the potential to further increase SOC and soils that are more vulnerable to losing SOC. This information would allow more targeted and cost-effective approaches to increasing SOC rather than using a one-size-fits-all strategy across the entire farm. This case study also highlighted the ability of a model developed at the national scale (Beare et al. 2014; McNally et al. 2017) to be implemented at a smaller scale, which would be useful to farmers and land managers. The use of this approach would complement and enhance any farm-scale soil C monitoring (MPI 2020) or accounting programmes by highlighting soils with an additional ability to increase soil C or soils more vulnerable to losing soil C.
Declaration of funding
Funding was received from the New Zealand Agricultural Greenhouse Gas Research Centre (NZAGRC) and the Ministry of Business, Innovation and Employment (MBIE) Strategic Science Investment Fund.
Acknowledgements
This work was funded by the New Zealand Agricultural Greenhouse Gas Research Centre (NZAGRC) and the MBIE Strategic Science Investment Fund. We would also like to acknowledge Keith Cameron, Clare Buchanan, Peter Hancox, and the staff at the Lincoln University Dairy Farm for site access and providing necessary information to assist this project. We would also like to acknowledge Erin Lawrence-Smith for specific feedback and Peg Gosden, Rebekah Tregurtha, and Kathryn Lehto for their assistance with sample processing and laboratory analysis.
References
4per1000.org The 4per1000 initiative. Available at www.4per1000.org. [accessed 1 July 2024]
Amelung W, Bossio D, de Vries W, Kögel-Knabner I, Lehmann J, Amundson R, Bol R, Collins C, Lal R, Leifeld J, Minasny B, Pan G, Paustian K, Rumpel C, Sanderman J, van Groenigen JW, Mooney S, van Wesemael B, Wander M, Chabbi A (2020) Towards a global-scale soil climate mitigation strategy. Nature Communications 11, 5427.
| Crossref | Google Scholar | PubMed |
Angers DA, Arrouays D, Saby NPA, Walter C (2011) Estimating and mapping the carbon saturation deficit of French agricultural topsoils. Soil Use and Management 27, 448-452.
| Crossref | Google Scholar |
Beare MH, McNeill SJ, Curtin D, Parfitt RL, Jones HS, Dodd MB, Sharp J (2014) Estimating the organic carbon stabilisation capacity and saturation deficit of soils: a New Zealand case study. Biogeochemistry 120, 71-87.
| Crossref | Google Scholar |
Begill N, Don A, Poeplau C (2023) No detectable upper limit of mineral-associated organic carbon in temperate agricultural soils. Global Change Biology 29, 4662-4669.
| Crossref | Google Scholar | PubMed |
Cotrufo MF, Lavallee JM (2022) Soil organic matter formation, persistence, and functioning: a synthesis of current understanding to inform its conservation and regeneration. Advances in Agronomy 172, 1-66.
| Crossref | Google Scholar |
Cotrufo MF, Ranalli MG, Haddix ML, Six J, Lugato E (2019) Soil carbon storage informed by particulate and mineral-associated organic matter. Nature Geoscience 12, 989-994.
| Crossref | Google Scholar |
Curtin D, Beare MH, Qiu W (2022) Hot water extractable carbon in whole soil and particle-size fractions isolated from soils under contrasting land-use treatments. Soil Research 60(8), 772-781.
| Crossref | Google Scholar |
Emde D, Hannam KD, Midwood AJ, Jones MD (2022) Estimating mineral-associated organic carbon deficits in soils of the Okanagan Valley: a regional study with broader implications. Frontiers in Soil Science 2, 812249.
| Crossref | Google Scholar |
Feng W, Plante AF, Six J (2013) Improving estimates of maximal organic carbon stabilization by fine soil particles. Biogeochemistry 112, 81-93.
| Crossref | Google Scholar |
Georgiou K, Jackson RB, Vindušková O, Abramoff RZ, Ahlström A, Feng W, Harden JW, Pellegrini AFA, Polley HW, Soong JL, Riley WJ, Torn MS (2022) Global stocks and capacity of mineral-associated soil organic carbon. Nature Communications 13, 3797.
| Crossref | Google Scholar | PubMed |
Graham SL, Laubach J, Hunt JE, Mudge PL, Nuñez J, Rogers GND, Buxton RP, Carrick S, Whitehead D (2022) Irrigation and grazing management affect leaching losses and soil nitrogen balance of lucerne. Agricultural Water Management 259, 107233.
| Crossref | Google Scholar |
Gregorich EG, Beare MH, McKim UF, Skjemstad JO (2006) Chemical and biological characteristics of physically uncomplexed organic matter. Soil Science Society of America Journal 70, 975-985.
| Crossref | Google Scholar |
Gregorich EG, Gillespie AW, Beare MH, Curtin D, Sanei H, Yanni SF (2015) Evaluating biodegradability of soil organic matter by its thermal stability and chemical composition. Soil Biology and Biochemistry 91, 182-191.
| Crossref | Google Scholar |
Hassink J (1997) The capacity of soils to preserve organic C and N by their association with clay and silt particles. Plant and Soil 191, 77-87.
| Crossref | Google Scholar |
Hedley CB, Saggar S, Theng BKG, Whitton JS (2000) Surface area of soils of contrasting mineralogies using para-nitrophenol adsorption and its relation to air-dry moisture content of soils. Soil Research 38(1), 155-168.
| Crossref | Google Scholar |
Kirschbaum MUF, Schipper LA, Mudge PL, Rutledge S, Puche NJB, Campbell DI (2017) The trade-offs between milk production and soil organic carbon storage in dairy systems under different management and environmental factors. Science of the Total Environment 577, 61-72.
| Crossref | Google Scholar |
Kirschbaum MUF, Moinet GYK, Hedley CB, Beare MH, McNally SR (2018) Are soil carbon stocks controlled by a soil’s capacity to protect carbon from decomposition? In ‘Farm environmental planning – science, policy and practice’. Occasional Report No. 31. (Eds LD Currie, CL Christensen) (Fertilizer and Lime Research Centre, Massey University: Palmerston North, New Zealand) Available at http://flrc.massey.ac.nz/publications.html
Kirschbaum MUF, Moinet GYK, Hedley CB, Beare MH, McNally SR (2020a) A conceptual model of carbon stabilisation based on patterns observed in different soils. Soil Biology and Biochemistry 141, 107683.
| Crossref | Google Scholar |
Kirschbaum MUF, Giltrap DL, McNally SR, Liáng LL, Hedley CB, Moinet GYK, Blaschek M, Beare MH, Theng BKG, Hunt JE, Whitehead D (2020b) Estimating the mineral surface area of soils by measured water adsorption. Adjusting for the confounding effect of water adsorption by soil organic carbon. European Journal of Soil Science 71, 382-391.
| Crossref | Google Scholar |
Kögel-Knabner I, Guggenberger G, Kleber M, Kandeler E, Kalbitz K, Scheu S, Eusterhues K, Leinweber P (2008) Organo-mineral associations in temperate soils: integrating biology, mineralogy, and organic matter chemistry. Journal of Plant Nutrition and Soil Science 171(1), 61-82.
| Crossref | Google Scholar |
Lavallee JM, Soong JL, Cotrufo MF (2020) Conceptualizing soil organic matter into particulate and mineral-associated forms to address global change in the 21st century. Global Change Biology 26(1), 261-273.
| Crossref | Google Scholar | PubMed |
Lützow Mv, Kögel-Knabner I, Ekschmitt K, Matzner E, Guggenberger G, Marschner B, Flessa H (2006) Stabilization of organic matter in temperate soils: mechanisms and their relevance under different soil conditions – a review. European Journal of Soil Science 57(4), 426-445.
| Crossref | Google Scholar |
Manaaki Whenua (2023) S-map Online. Available at https://smap.landcareresearch.co.nz/ [accessed January 2023]
Matus FJ (2021) Fine silt and clay content is the main factor defining maximal C and N accumulations in soils: a meta-analysis. Scientific Reports 11, 6438.
| Crossref | Google Scholar | PubMed |
McNally SR, Beare MH, Curtin D, Meenken ED, Kelliher FM, Calvelo Pereira R, Shen Q, Baldock J (2017) Soil carbon sequestration potential of permanent pasture and continuous cropping soils in New Zealand. Global Change Biology 23(11), 4544-4555.
| Crossref | Google Scholar | PubMed |
McNally S, Beare M, Curtin D, Tregurtha C, Qiu W, Kelliher F, Baldock J (2018) Assessing the vulnerability of organic matter to C mineralisation in pasture and cropping soils of New Zealand. Soil Research 56, 481-490.
| Crossref | Google Scholar |
McNeill SJE, Golubiewski N, Barringer J (2014) Development and calibration of a soil carbon inventory model for New Zealand. Soil Research 52, 789-804.
| Crossref | Google Scholar |
Parfitt RL, Whitton JS, Theng BKG (2001) Surface reactivity of A horizons towards polar compounds estimated from water adsorption and water content. Australian Journal of Soil Research 39, 1105-1110.
| Crossref | Google Scholar |
Poeplau C, Don A (2013) Sensitivity of soil organic carbon stocks and fractions to different land-use changes across Europe. Geoderma 192, 189-201.
| Crossref | Google Scholar |
R Core Team (2018) ‘R: a language and environment for statistical computing.’ (R Foundation for Statistical Computing: Vienna, Austria) Available at https://www.R-project.org/
Sanderman J, Hengl T, Fiske GJ (2017) Soil carbon debt of 12,000 years of human land use. Proceedings of the National Academy of Sciences 114(36), 9575-9580.
| Crossref | Google Scholar | PubMed |
SIDDC (2023) Lincoln University Dairy Farm webpage. South Island Dairy Demonstration Centre. Available at https://www.ludf.org.nz/. [accessed 19 January 2023]
Six J, Conant RT, Paul EA, Paustian K (2002) Stabilization mechanisms of soil organic matter: implications for C-saturation of soils. Plant and Soil 241, 155-176.
| Crossref | Google Scholar |
Stewart CE, Paustian K, Conant RT, Plante AF, Six J (2007) Soil carbon saturation: concept, evidence and evaluation. Biogeochemistry 86, 19-31.
| Crossref | Google Scholar |
Stewart CE, Paustian K, Conant RT, Plante AF, Six J (2008) Soil carbon saturation: evaluation and corroboration by long-term incubations. Soil Biology and Biochemistry 40, 1741-1750.
| Crossref | Google Scholar |
Theng BKG, Ristori GG, Santi CA, Percival HJ (1999) An improved method for determining the specific surface areas of topsoils with varied organic matter content, texture and clay mineral composition. European Journal of Soil Science 50(2), 309-316.
| Crossref | Google Scholar |
Trivedi P, Singh BP, Singh BK (2018) Soil carbon: introduction, importance, status, threat, and mitigation. In ‘Soil carbon storage’. (Ed. BK Singh) pp. 1–28. (Academic Press) doi:10.1016/B978-0-12-812766-7.00001-9
van Dam-Bates P, Gansell O, Robertson B (2018) Using balanced acceptance sampling as a master sample for environmental surveys. Methods in Ecology and Evolution 9, 1718-1726.
| Crossref | Google Scholar |
Wall AM, Campbell DI, Mudge PL, Rutledge S, Schipper LA (2019) Carbon budget of an intensively grazed temperate grassland with large quantities of imported supplemental feed. Agriculture, Ecosystems & Environment 281, 1-15.
| Crossref | Google Scholar |
Wall AM, Campbell DI, Morcom CP, Mudge PL, Schipper LA (2020) Quantifying carbon losses from periodic maize silage cropping of permanent temperate pastures. Agriculture, Ecosystems & Environment 301, 107048.
| Crossref | Google Scholar |
Whitehead D, Schipper LA, Pronger J, Moinet GYK, Mudge PL, Calvelo Pereira R, Kirschbaum MUF, McNally SR, Beare MH, Camps-Arbestain M (2018) Management practices to reduce losses or increase soil carbon stocks in temperate grazed grasslands: New Zealand as a case study. Agriculture, Ecosystems & Environment 265, 432-443.
| Crossref | Google Scholar |
Wiesmeier M, Hübner R, Spörlein P, Geuß U, Hangen E, Reischl A, Schilling B, von Lützow M, Kögel-Knabner I (2014) Carbon sequestration potential of soils in southeast Germany derived from stable soil organic carbon saturation. Global Change Biology 20, 653-665.
| Crossref | Google Scholar | PubMed |
Wiesmeier M, Munro S, Barthold F, Steffens M, Schad P, Kögel-Knabner I (2015) Carbon storage capacity of semi-arid grassland soils and sequestration potentials in northern China. Global Change Biology 21, 3836-3845.
| Crossref | Google Scholar | PubMed |


