Measuring soil bulk density from shear wave velocity using piezoelectric sensors
Mohammad Omar Faruk Murad A C , Budiman Minasny A , Brendan Malone A B and Kip Crossing A
A School of Life and Environmental Sciences, The University of Sydney, NSW 2006, Australia.
B Commonwealth Scientific and Industrial Research Organisation (CSIRO), Acton, ACT 2601, Australia.
C Corresponding Email: mohammad.murad@sydney.edu.au
Soil Research 59(1) 107-117 https://doi.org/10.1071/SR19395
Submitted: 23 December 2019 Accepted: 28 July 2020 Published: 20 October 2020
Abstract
Bulk density and soil stiffness moduli are vital physical parameters related to soil compaction, porosity, moisture storage capacity, soil penetration resistance and structural integrity. Conventional methods for measuring soil density and stiffness moduli are destructive, time-consuming, complex, expensive and often require skilled operators to conduct the tests. A new soil density and stiffness moduli measurement technique that can evaluate soil density and stiffness moduli more rapidly, efficiently and precisely, at a low cost is introduced here. This study evaluated the use of shear wave velocity measurements using the piezoelectric extender and bender elements as a viable alternative to measure soil density and stiffness moduli of soil. To test this idea, soda-lime glass beads of <0.002, 0.04–0.07 and 1.00–1.30 mm in diameter were used to develop the empirical relationship between the shear wave velocity and the bulk density of soil in laboratory conditions. These empirical equations were then tested on sands and clayey soils for validation. Accuracy in terms of coefficient of determination (R2) and root mean squared error (RMSE) from the current and existing studies ranged within 0.91–0.93 and 0.073–0.177 g cm–3 respectively. Both shear and Young moduli were compared with the shear wave velocity of soil, with R2 and RMSE of 0.96–0.97 and 0.48–3.5 MPa respectively. The major advantage of this technique is that input and output signal data can be stored in a computer that can be used to calculate soil density and stiffness moduli automatically. This technique could play a vital role in improving crop yield and soil management practices.
Keywords: bulk density, piezoelectric sensor, shear wave velocity, stiffness moduli.
Introduction
Bulk density is one of the major soil physical parameters that indicate the soil’s capability to support its structural integrity and the movement of air, water, heat and solutes (Kramer and Boyer 1995). Bulk density can be an indication of soil compaction, which determines the rate of seed germination and root penetrability (Bengough et al. 2006). In addition, soil physical, chemical and biological measurements require density measurement in order to convert from a mass basis to a volumetric basis for soil quality assessment, such as soil carbon stocks (Arshad and Martin 2002; Adhikari et al. 2014).
Bulk density of soil is usually measured gravimetrically or indirectly using a gamma-ray absorption instrument. Core, clod and excavation methods are commonly used for direct techniques based on the gravimetric analysis. However, there are problems and shortcomings with the gravimetric basis method. The accountability of laboratory tests depends mostly on the ability to recreate the conditions found in the field. Because these tests require soil sampling, there is always a possibility that the samples will be disturbed in the sampling process, which could result in inaccurate test results. Another possible source of error in sampling is disturbance in the soil by compression during the insertion of the ring sampler.
Although gamma radiation is highly accurate, its radiation source limits its practical application (Lobsey and Viscarra Rossel 2016; Pires 2018; Sun et al. 2019). All types of nuclear gauges are potential health hazards, and strict regulations must be maintained during the measurements (Lobsey and Viscarra Rossel 2016). Similar to the methods based on gravimetric analysis, a small amount of disturbance can take place during this operation, where an access hole is required. The presence of stones in the soil causes difficulties either by preventing the insertion of access holes to the full depths or affecting the source–detector separation. In general, the bulk density of soil in the presence of stones may be overestimated. Also, the initial cost of gamma-ray gauges is very high compared with methods based on gravimetric analysis (Al-Shammary et al. 2018).
Strain level is the measure of deformation resulting from the application of an external stress (Puttlitz et al. 2019). Soils generally behave as a nonlinear and plastic material, but at strain levels below 0.001% are usually considered to be elastic and linear in nature (Raja and Maheshwari 2016; Camões Lourenço et al. 2017; Haeri and Fathi 2018; Mucciacciaro and Sica 2018). Soil exhibits a quasi-elastic behaviour at the strain range of ~10−6 to 10−5 (Danne and Hettler 2017; Mandolini 2018). Both the Young and shear moduli behave independently with the strain amplitude, related to a maximum limit value, and are known as initial shear (G0) and Young’s (E0) moduli. The G0 and E0 are essential parameters for evaluating the shear modulus and Young modulus of soil and are both related to soil bulk density.
There is a need for efficient and rapid soil density evaluation, at a low cost, which also must be balanced with appropriate precision and accuracy. This study will evaluate the use of shear wave velocity (VS) measurements using a piezoelectric sensor as a viable alternative to soil density and stiffness moduli estimation. Few studies have been conducted in which piezoelectric sensors were used to generate VS for engineering purposes (Chan n.d.; Zeng and Hlasko 2005; Muñoz and Caicedo 2013; Park et al. 2018; Yang et al. 2018). In this study, a low-cost system using a BitScope Micro Oscilloscope and Analyzer (BitScope Designs, St. Leonards, NSW, Australia) was used to automatically calculate soil density and stiffness moduli.
Background study and theory
The strain is the deformation in the direction of the applied force divided by the initial length of the material (Eqn 1) (Gilmore 2014). When the deformation in the material is too small, the material will return to its original state after withdrawing the stress applied to it, which is known as elastic deformation.

Because agricultural soil is generally subjected to low stresses compared with those that carry the foundation of a structure, a small amount of strain is produced. Thus, it is useful to study the stiffness moduli of soil at a low strain level. The stiffness moduli of soil (Young and shear moduli) are mechanical properties of soil that have a strong relationship with water content and bulk density of soil (Kézdi 1980). Bravo et al. (2012) studied three clay soil samples collected from a sugarcane field at different depths. They found that the Young modulus declined gradually when the water content exceeded 25% and increased rapidly under dry conditions; also, the state of plastic deformation was achieved by the loose soil at an average Young modulus of 40 MPa. Bravo et al. (2012) also found a nonlinear relationship between water content and the shear strength of a clayey soil at different depths of a sugarcane field. The shear strength of the soil decreases rapidly with the increasing water content. After 20% of water content, the void spaces between the soil particles are mostly filled with water, and the strength of soil mainly depends on pore water pressure.
In the laboratory, the triaxial test has been used to measure the stiffness modulus of soils (Kokusho 1980); however, this instrument is limited in its measurable response of strain range and has accuracy restrictions. Wetting deformation of coarse-grained soil varies typically with the cell pressure and wetting stress level, which is challenging to maintain in the triaxial test (Song and Jun-Gao 2007). Additionally, the principal stress on the soil specimen in triaxial tests does not continuously rotate, and the two loading conditions (compression and extension) are applied alternatively during each leading cycle. Moreover, the parts of the triaxial apparatus that are subjected to continuous movement are affected by mechanical friction and can become highly sensitive. As a result of the internal energy loss, it becomes unreliable for measuring soil modulus at a small strain level (Kokusho 1980).
Many studies have been done to overcome these issues. The VS is one essential parameter for determining the dynamic properties of soils. Like other types of body waves, shear waves (S-waves) travel through the inner layers of the soil surface (Voigt et al. 2005). The VS of granular soils at strain levels less than 0.001% has been widely used to evaluate different moduli of soil (Richart et al. 1970; Jardine and Sparks 1984; Burland 1989; Shibuya et al. 1992; Moore et al. 2003; Choi and Stewart 2005; Patel et al. 2008; Muñoz and Caicedo 2013; Gilmore 2014; Lee et al. 2014; Park et al. 2018; Yang et al. 2018). Also, VS can be used as a primary function of the bulk density of soil (Gardner et al. 1974; Potter and Stewart 1998; Keceli 2012).
A piezoelectric sensor is a type of sensor that exploits the piezoelectric effect. It monitors the variations of several physical properties such as pressure, acceleration, temperature, strain or force by converting the received signals into an electrical charge. Pierre Curie first noticed the piezoelectric effect in 1880; however, industrial application of these sensors did not start until nearly a 100 years later in the 1950s (Katzir 2003). The major component of a piezoelectric sensor is a piezoceramic material. When a high voltage passes through the piezoelectric sensor, its dimensions change due to expansion of the piezoceramic material. There are different piezoelectric materials that can be used for producing acoustic wave sensors. Among these, the most common materials are quartz and lithium tantalate (Drafts 2001). Commonly, piezoceramics are used as actuators, and polymer piezo films are used as sensing materials. For self-sensing actuators, piezoceramics can be used for both sensing and actuation (Dosch et al. 1992).
Farrar and Leonard (1965) demonstrated one of the first applications of piezoelectric transducers in S-wave testing in sand and clay. For generating and receiving signals, he used shear-plate transducers. That was the first time he used S-waves, rather than longitudinal waves, to study the possibility of stress wave propagation through soil.
In 1978, VS and S-wave attenuation in kaolinite clay sediments were measured using a ceramic bender transducer. For measuring VS, a single-cycle pulse with a peak-to-peak amplitude of 600 V and a frequency of 338 Hz was used. The received signal from the transducer was amplified by 40 dB before displaying it in an oscilloscope. Also, a bandpass filter of 200–1500 Hz was used to remove the electrical and environmental noise. A unique type of transducer was employed, consisting of two transverse-expansion mode piezoelectric crystals that can generate and receive signals from S-waves. Those bender transducers have been preferred to shear-plate transducers in many other studies (Horn 1980; Schultheiss 1981; Alba et al. 1984; Dyvik and Madshus 1985).
Based on earlier development in the field of piezoelectric transducers, Horn (1980) studied different dynamic properties of unconsolidated sediments in the laboratory. In that study, saturated sand sediments were subjected to S-wave propagation in a specially designed sedimentation chamber using a pair of piezoelectric ceramic transducers.
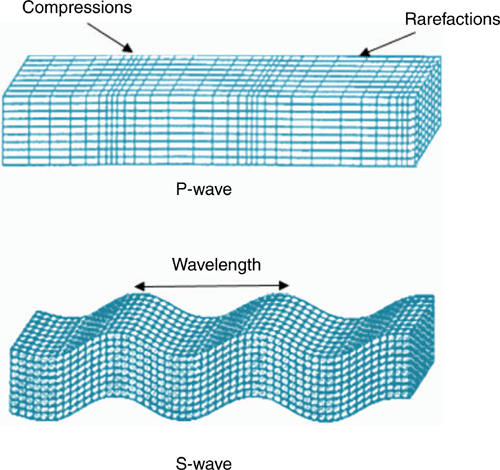
The working principle of all piezoelectric transducers is based on two different types of body waves: compressional (P) and S-waves. The wave generated when energy is applied at right angles to a medium is known as a P-wave. A particle moves in the direction of propagation of the wave (Fig. 1). Thus, the soil particles are subjected to alternative compression and tension or are pulled apart as the waves propagate. These are the fastest among the body waves. The S-wave is another type of body wave that generally forms when energy is applied in a direction parallel to the surface of a medium (Fig. 1). The S-waves do not propagate through fluids.
Gardner et al. (1974) found a strong correlation between VS and bulk density (ρ) and established the following empirical relationship:

Potter and Stewart (1998) estimated coefficients α and β on a shale-filled and a porous sand-filled channel in Alberta, Canada, and obtained α = 0.37 and β = 0.22.
Asten and Boore (2005) analysed data from previous studies and summarised two equations for different ranges of VS and P-wave velocity (VP) for determining ρ of soil.
When VP < 1.50 km s–1, ρ = 1.93 g cm–3
When 1.50 km s–1 ≤ VP < 6.0 km s–1,

When VP ≥ 6.0 km s–1

For VS, the same equations as for VP can be used to determine ρ.
For 0.30 km s–1 ≤ VS < 3.55 km s–1

For 3.55 km s–1 ≤ VS


Keceli (2012) modified Gardner’s equation using sedimentary rocks, which can be expressed as shown in Eqn 8.

Most studies for measuring ρ using piezoelectric sensors have been performed on sands for engineering purposes (Park et al. 2018; Yang et al. 2018). It is notable that this technique has not been utilised for measuring soil density in agricultural contexts.
Both time and frequency domain signal analysis techniques are used to evaluate shear and Young moduli of soil (Viggiani and Atkinson 1995; Greening and Nash 2004; Da Fonseca et al. 2008). The bender elements used in these studies were made of piezo-ceramic materials, and the maximum strain generated by a piezoelectric sensor was 0.001%, which lies within the elastic range of soils (Dyvik and Madshus 1985). Many other studies have been conducted on the measurement of small strain stiffness modulus by the velocities of elastic waves propagating through soil particles (Richart et al. 1970; Jardine and Sparks 1984; Burland 1989; Shibuya et al. 1992; Moore et al. 2003). The advantage of using elastic waves for the determination of stiffness modulus, and S-waves, is that the tests can be performed both in laboratory and field conditions in a non-destructive manner.
Materials and methods
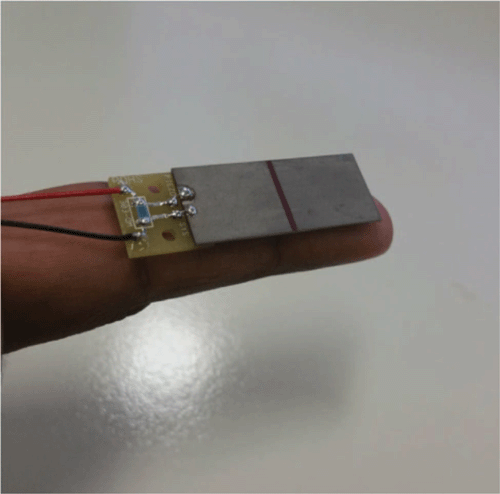
Piezo bender and extender elements are the main components of the piezoelectric technique for soil density measurement. These sensors were used as a transmitter for input signals and receiver for output signals. A standard quick-mount piezo bender (Q220-A4–303YB) (Fig. 2) and a piezo extender (Q220-A4–303XE) were used to produce and transmit the S-wave through the soil and to receive the S-wave and then a bitscope was used to convert from an electrical (analogue) to a digital signal.
|
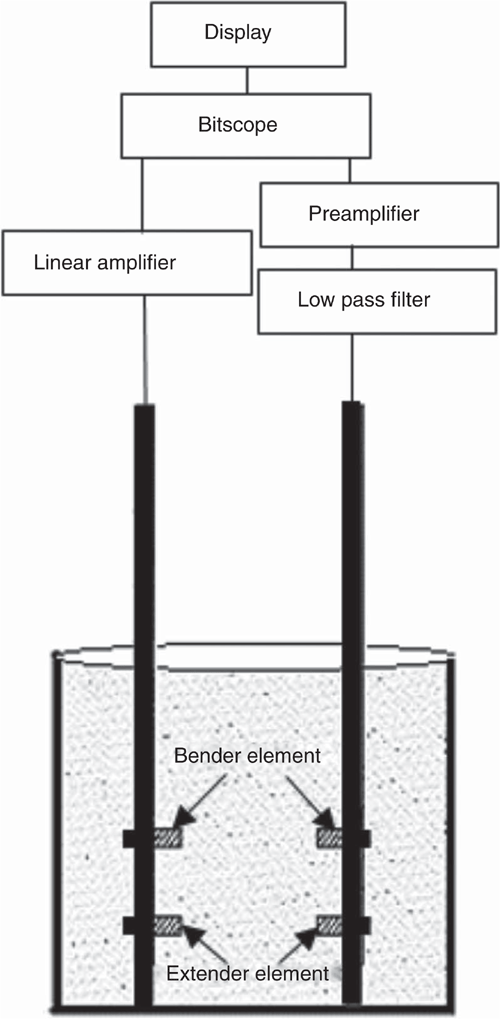
The transmitter and receiver of the piezo bender and extender sensors were attached to two steel probes. The sensors were separated by a distance of 60 mm. There was no joint between the probes to avoid the transmission of the waves through the joints (Fig. 3). In the future, the probes will be attached together using a steel connector with rubber vibration isolation joints to maintain constant clearance between the sensors.
|
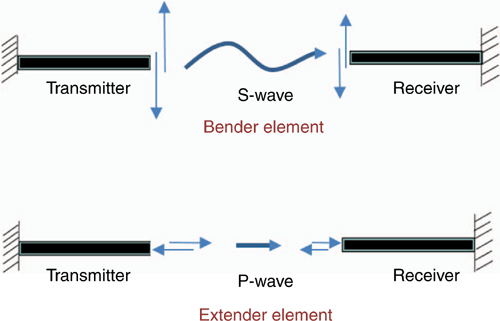
After setting up the bender and extender elements at a separation distance of 60 mm, BitScope software was used to trigger the input signal from the transmitter. Square waves were produced as input signals using a BitScope Micro Oscilloscope and Analyzer. The elastic stress waves released when activated by an alternating electric charge from the square waves caused one layer of the piezo sensor to expand and the other to contract, thus causing the sensor to flex (Fig. 4).
|
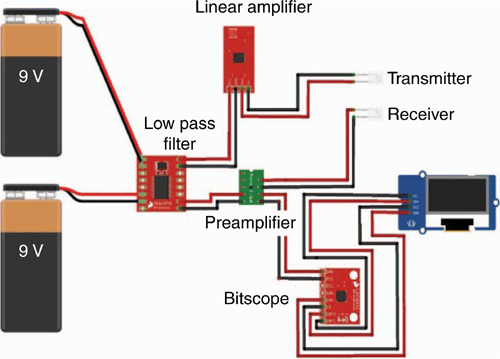
The transmitted signal was then received by the piezoelectric receiver to measure the strength and frequency of the waves. A linear amplifier was used to amplify the voltage before sending the signal to the receiver. The BitScope Micro Oscilloscope and Analyzer was used to collect the electrical signal, convert to a digital signal and produce a time-domain signal. The output signals were received and analysed as sine waves. A low pass filter was used to filter noise and unwanted electrical drift from the observed input and output signals. Both transmitting and receiving signals were amplified by a preamplifier before displaying the signals in the BitScope Micro Oscilloscope and Analyzer (Fig. 5).
|
The polarity of the input signal was changed to obtain the sine wave in the opposite direction. Theoretically, VS can be measured by dividing the distance between the sensors with the time required by the S-wave to travel this distance (Eqn 9) (Dyvik and Madshus 1985):

where LS is distance between the tip of the transmitter and the tip of the receiver and tS is travel time of the S-wave through distance LS.
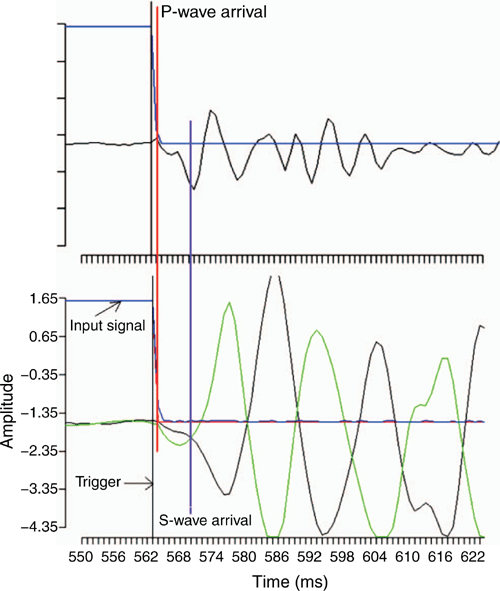
The S-wave arrival time was determined by measuring the time required by the wave to travel from the trigger and the first intersection between the sine waves obtained from different polarities. Fig. 6 shows the square waves in blue and red lines that were used as input signals. A trigger point was considered when the amplitude of the input signal started declining from the peak of the square wave.
|
The P-wave arrival time is considered to be the time required by the wave to travel from the trigger and the first point when the sine wave starts to form. The P-wave arrival time also helps to identify the S-wave arrival time when it is difficult to trace the first intersection point between the sine waves obtained from different polarity due to noise:

where LP is distance between the tip of the transmitter and the tip of the receiver and tP is travel time of the S-wave through distance LP.
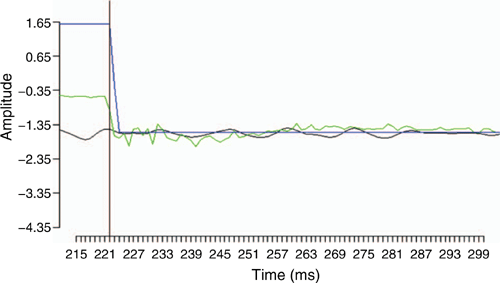
A low pass filter was used to remove all the unnecessary noise from the output signal. Without the filter, it was a challenge to distinguish between the actual signal and noise. Fig. 7 shows the output signal without the low pass filter. To obtain the travel time of both P- and S-waves, it is very important to identify the exact position of P- and S-wave arrival.
|
For designing the low pass filter, the Analog Filter Wizard (www.analog.com) was used. The low pass filter was designed for the passband of gain 100 V/V with –1 dB and 100 Hz (Fig. 8). Also, the stopband was selected as –40 dB and 700 Hz.
The second-order bandpass filter components (Fig. 9) from the Analog Filter Wizard were applied to filter out unwanted noise and to obtain smooth sine waves as output signals.
After application of the low pass filter, a considerable reduction of the noise in the output signals was observed (Fig. 10). The gain was optimised in such a way that the peak amplitude did not exceed the cut-off frequency.

|
There was also an issue of transmitting the electric signal through the soil medium when the sample was wet. Water particles in the soil sample can conduct electrical signals from the receiver to the transmitter. To counteract this problem, the piezoelectric sensors were required to be electrically insulated, but at the same time, the insulating material should not affect the generation of the mechanical waves. To satisfy these requirements, a liquid electrical tape was used as an insulation material.
In this study, glass beads were first used to develop empirical relationships between VS and ρ of soil in ideal laboratory conditions. Three different sizes of glass beads were used. Soda-lime glass beads of <0.002, 0.04–0.07 and 1.00–1.30 mm in diameter was considered as clays, silts and sands respectively. The experiments were done in the physical laboratory for soil in the Biomedical building, Australian Technology Park, Sydney. A small vibratory soil compaction table was used to compact the different-sized glass beads for 10, 20 and 30 min to create different densities. The glass beads and dry soil samples were weighed in the laboratory with a scale. The soil ρ was calculated using Eqn (11):

where M is soil mass and V is soil volume.
Afterward, sands and two types of clayey soils were used to validate the empirical equations that were derived using the glass beads. These soil samples were dried and crushed before sieving through a 2-mm sieve. The characteristics of these soils are given in Table 1. Similar to the glass beads, a vibratory table was used to compact the sandy and clayey soils for 10, 20 and 30 min.

|
The VS values obtained from tests with the glass beads and soils were used to measure the stiffness moduli using the empirical relationships between ρ and VS of soils. Shear modulus (G) of the soil was calculated using the following equation:

Both G and Poisson’s ratio are functions of the Young modulus (E). Poisson’s ratio was calculated from the relationship with G and bulk modulus (K) of soil (Eqn 15). E and K of soil were calculated using the following equation:

where,


Significant correlations of both K and E with VS were observed.
Results and discussion
VS at different compactions
Since soils act as elastic material at strain level less than 0.001%, the soil sample will return to its original shape after a shear force is applied. Adjacent layers of soil will undergo shear and cause propagation of the S-wave (Simic et al. 2012).
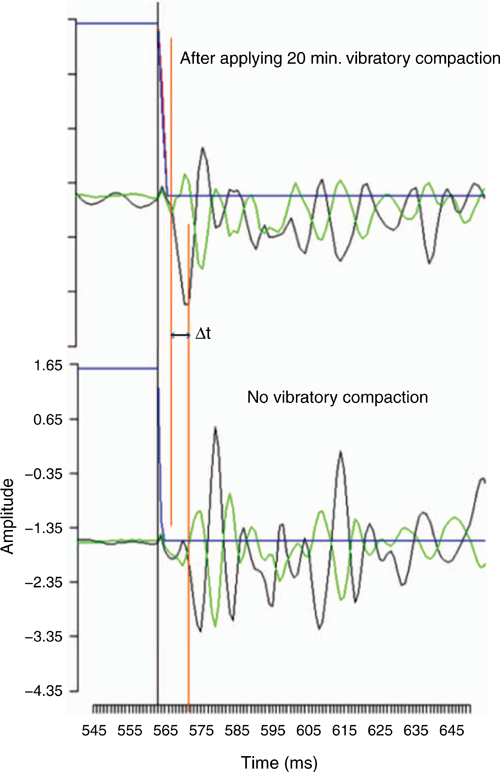
Fig. 11 shows a comparison of S-wave arrival time between 0 and 20 min of vibratory compaction of glass beads. The S-wave travelling time decreased with the increasing compaction applied on the glass beads using a vibratory feeder. Due to the compaction, the glass beads were closer to each other, which allowed the transfer of the body waves from the transmitter to the receiver faster than in a less compacted situation. The Δt indicates the differences between the glass beads with 20 min of vibratory compaction and no vibratory compaction (Fig. 11).
|
Predicting ρ
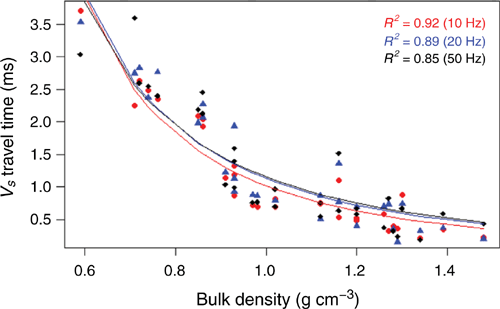
Once we established a method for determining VS, glass beads were compacted for 10, 20 and 30 min using a vibratory feeder to achieve ρ within the range of 0.59–1.48 g cm–3. The VS was measured using piezoelectric sensors to compare with the corresponding ρ of soil. In this study, three different frequencies (10, 20 and 50 Hz) of the input signal were used to find the optimum frequency for measuring VS. Nonlinear regression analysis was used to fit a nonlinear model that satisfied the relationship between the S-wave travel time and ρ.
There was a clear relationship between travel time and ρ (Fig. 12). The VS at 10 Hz provided a stronger relationship with ρ (R2 = 0.92); R2 values for 20 and 50 Hz were 0.89 and 0.85 respectively. This relationship indicates that the travel time for VS decreased with increasing ρ because the S-wave required more time to travel through less dense soil.
|
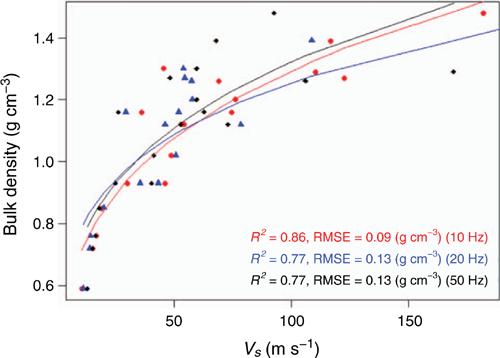
The travel time of the S-wave from the transmitter to the receiver was then converted to VS (Eqn 9). Empirical relationships between VS and ρ were derived (Fig. 13). Relationships were developed for three different frequencies of 10, 20 and 50 Hz. The ρ changed greatly with VS until around 1 g cm–3. After that, the slope of the trend line decreased with increasing VS.
|
Empirical Eqns 16–18 show the relationships between VS and ρ:


Maximum R2 and minimum root mean squared error (RMSE) for ρ were 0.86 and 0.09 g cm–3 respectively, at 10 Hz.
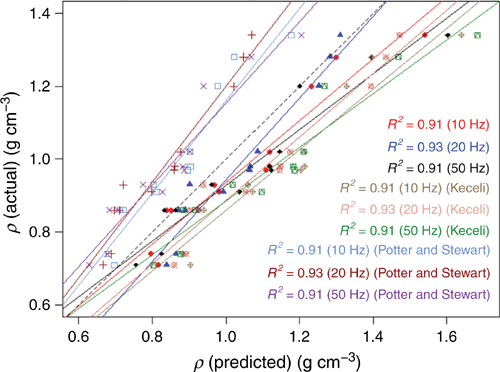
The accuracy of these relationships to predict ρ was tested on real soil compacted at different densities. In addition, the empirical relationships developed by Potter and Stewart (1998) and Keceli (2012) (Eqn 2) were also tested. The relationships between the prediction by different models with actual ρ are given in Fig. 14.
|
The R2 for 20 Hz was found to be a maximum for the density equations obtained from the glass beads and other studies, but the difference with other frequencies was small (Fig. 14). Table 2 shows the statistical comparisons of the density equations obtained from the tests with piezoelectric sensors and models from previous studies. All models showed a high linear relationship between the prediction using VS and ρ (R2 > 0.9). However, the model from Potter and Stewart (1998) under-predicted ρ. The R2 and RMSE between the different studies and frequencies ranged within 0.91–0.93 and 0.073–0.177 g cm–3 respectively. Empirical equations obtained from the piezoelectric sensor in this study (Eqns 2 and 18) provided minimum RMSE compared with other studies (RMSE = 0.073 g cm–3).

|
G and VS
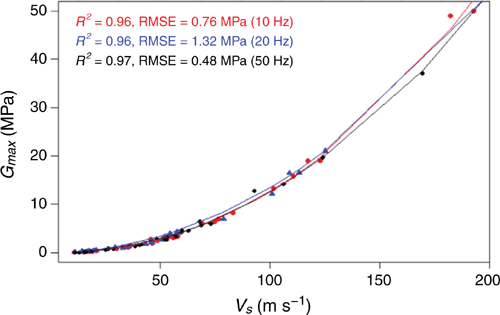
The VS is a function of G. The G of soil was calculated using Eqn 13 and plotted against VS (Fig. 15). Similar to soil ρ, a power regression analysis was done between G and VS. The G also increased with progressive VS. A linear increment was observed until 5 MPa and the slope of the trend line rose dramatically thereafter. The R2 and the RMSE of all three frequencies were very close, but the maximum R2 and minimum RMSE occurred for 50 Hz.
|
E and VS
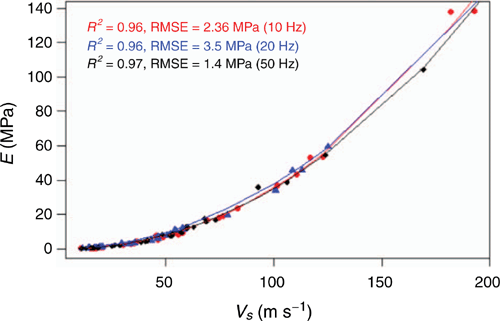
The K of soil was calculated from VS and VP using Eqn 14. Equation 15 was used to compute Poisson’s ratio from shear and bulk density of soil. E of soil was evaluated from Eqn 13 using G and Poisson’s ratio. Similar types of relationships were observed between VS and E of soil because G and Poisson’s ratio are direct functions of this modulus (Fig. 16). Similar to G, maximum R2 and minimum RMSE were 0.97 and 1.4 MPa for 50 Hz respectively.
|
Limitations
There were some limitations to this technique. The application of this technique in this study is limited to the laboratory setting. This prototype was evaluated using a limited number of crushed dried soil samples. Elastic wave propagation is affected by soil moisture, which was not investigated in the paper. More tests are required using different types of soil with various physical and chemical differences to check the dependency of this technique on these soil properties. Also, the shear and Young’s moduli obtained from this technique need to be validated against conventional methods. To apply this technique in the field, some modifications will be necessary for the design of the probe to withstand the pressure that will be exerted on the sensor while pushing the probes into the ground. This technique will require knowledge of the field moisture content for converting the field density to the bulk density of soil. Time-domain reflectometry or frequency domain reflectometry sensors can be used to evaluate field moisture to correct the field density of soil. In addition, a small amount of ambient noise in the operational environment, such as vibration from nearby machinery, can affect measurement of VS with this technique. This technique is non-destructive but invasive; soil cores are not required but the probes need to be driven into the soil, which may alter physical integrity of the soil.
Conclusions
Soil density and stiffness moduli are important parameters for soil management. The results showed that VS had a strong relationship with ρ and stiffness moduli. Piezoelectric sensors appear to be a rapid, cost-effective and convenient tool for investigating ρ. In addition, these sensors can also be used for measuring the stiffness of soil at a small strain level. This is an inexpensive method that can produce accurate data. One of the key features of this technique is that the input and output signal data can be stored on a computer to automatically calculate ρ and stiffness moduli. In the future, a robust soil probe system can be implemented based on this technique so that it can be used in the field to measure ρ and stiffness moduli. This should provide essential information regarding soil physical properties that are invaluable in agricultural contexts and for assessing soil function in general.
Conflicts of interests
The authors declare no conflicts of interest
Acknowledgements
The authors would like to thank the administration of the School of Life and Environmental Sciences and the Faculty of Engineering of the University of Sydney for supporting the laboratory experiments. The authors would also like to acknowledge University of Sydney International Scholarship (USydIS) for supporting the PhD research program.
References
Adhikari K, Hartemink AE, Minasny B, Kheir RB, Greve MB, Greve MH (2014) Digital mapping of soil organic carbon contents and stocks in Denmark. PLoS One 9, e105519| Digital mapping of soil organic carbon contents and stocks in Denmark.Crossref | GoogleScholarGoogle Scholar | 25137066PubMed |
Alba PD, Baldwin K, Janoo V, Roe G, Celikkol B (1984) Elastic-wave velocities and liquefaction potential. Geotechnical Testing Journal 7, 77–88.
| Elastic-wave velocities and liquefaction potential.Crossref | GoogleScholarGoogle Scholar |
Al-Shammary AAG, Kouzani AZ, Kaynak A, Khoo SY, Norton M, Gates W (2018) Soil bulk density estimation methods: a review. Pedosphere 28, 581–596.
| Soil bulk density estimation methods: a review.Crossref | GoogleScholarGoogle Scholar |
Arshad MA, Martin S (2002) Identifying critical limits for soil quality indicators in agro-ecosystems. Agriculture, Ecosystems & Environment 88, 153–160.
| Identifying critical limits for soil quality indicators in agro-ecosystems.Crossref | GoogleScholarGoogle Scholar |
Asten MW, Boore DM (2005) Blind comparisons of shear-wave velocities at closely-spaced sites in San Jose, California. In ‘Proceedings of a Workshop Held at the US Geological Survey’ Menlo Park, 1–5. U.S. Geological Survey, Reston, Virginia, United States.
Bengough AG, Bransby MF, Hans J, McKenna SJ, Roberts TJ, Valentine TA (2006) Root responses to soil physical conditions; growth dynamics from field to cell. Journal of Experimental Botany 57, 437–447.
| Root responses to soil physical conditions; growth dynamics from field to cell.Crossref | GoogleScholarGoogle Scholar | 16317041PubMed |
Bravo EL, Suárez MH, Cueto OG, Tijskens E, Ramon H (2012) Determination of basics mechanical properties in a tropical clay soil as a function of dry bulk density and moisture. Revista Ciencias Técnicas Agropecuarias 21, 5–11.
Burland JB (1989) Ninth Laurits Bjerrum Memorial Lecture: “Small is beautiful”—the stiffness of soils at small strains. Canadian Geotechnical Journal 26, 499–516.
| Ninth Laurits Bjerrum Memorial Lecture: “Small is beautiful”—the stiffness of soils at small strains.Crossref | GoogleScholarGoogle Scholar |
Camões Lourenço J, dos Santos JA, Pinto P (2017) Hypoelastic UR-free model for soils under cyclic loading. Soil Dynamics and Earthquake Engineering 97, 413–423.
| Hypoelastic UR-free model for soils under cyclic loading.Crossref | GoogleScholarGoogle Scholar |
Chan C-M (2012) On the intepretation of shear wave velocity from bender element tests. Acta Technica Corviniensis-Bulletin of Engineering 5, 29
Choi Y, Stewart JP (2005) Nonlinear site amplification as function of 30 m shear wave velocity. Earthquake Spectra 21, 1–30.
| Nonlinear site amplification as function of 30 m shear wave velocity.Crossref | GoogleScholarGoogle Scholar |
Da Fonseca AV, Ferreira C, Fahey M (2008) A framework interpreting bender element tests, combining time-domain and frequency-domain methods. Geotechnical Testing Journal 32, 91–107.
Danne S, Hettler A (2017) Total and quasi-elastic strains due to monotonous and low-cycle loading by means of experimental and numerical element tests. In ‘Holistic simulation of geotechnical installation processes’. (Ed. T Triantafyllidis) pp. 303–323. (Springer)
Dosch JJ, Inman DJ, Garcia E (1992) A self-sensing piezoelectric actuator for collocated control. Journal of Intelligent Material Systems and Structures 3, 166–185.
| A self-sensing piezoelectric actuator for collocated control.Crossref | GoogleScholarGoogle Scholar |
Drafts B (2001) Acoustic wave technology sensors. IEEE Transactions on Microwave Theory and Techniques 49, 795–802.
| Acoustic wave technology sensors.Crossref | GoogleScholarGoogle Scholar |
Dyvik R, Madshus C (1985) Lab measurements of Gmax using bender elements. In ‘Advances in the art of testing soils under cyclic conditions’. (Ed. V Khosla) pp. 186–196. (ASCE)
Farrar W, Leonard JL (1965) Foetal heart-beat detector (Patent No. 3,187,098). U.S. Patent and Trademark Office, Washington, D.C.
Gardner GHF, Gardner LW, Gregory AR (1974) Formation velocity and density-the diagnostic basics for stratigraphic traps. Geophysics 39, 770–780.
| Formation velocity and density-the diagnostic basics for stratigraphic traps.Crossref | GoogleScholarGoogle Scholar |
Gilmore C (2014) Materials science and engineering properties. Cengage Learning. Available at https://books.google.com.au/books?id=t7wTCgAAQBAJ [verified 12 August 2020].
Greening PD, Nash DFT (2004) Frequency domain determination of G 0 using bender elements. Geotechnical Testing Journal 27, 288–294.
Haeri SM, Fathi A (2018) Numerical modeling of rocking of shallow foundations subjected to slow cyclic loading with consideration of soil-structure interaction. Available at ArXiv Preprint ArXiv:1808.04492 [verified 12 August 2020].
Horn IW (1980) Some laboratory experiments on shear wave propagation in unconsolidated sands. Marine Georesources and Geotechnology 4, 31–54.
| Some laboratory experiments on shear wave propagation in unconsolidated sands.Crossref | GoogleScholarGoogle Scholar |
Jardine PM, Sparks DL (1984) Potassium-calcium exchange in a multireactive soil system: II. Thermodynamics. Soil Science Society of America Journal 48, 45–50.
| Potassium-calcium exchange in a multireactive soil system: II. Thermodynamics.Crossref | GoogleScholarGoogle Scholar |
Katzir S (2003) The discovery of the piezoelectric effect. Archive for History of Exact Sciences 57, 61–91.
| The discovery of the piezoelectric effect.Crossref | GoogleScholarGoogle Scholar |
Keceli AD (2012) Soil parameters that can be determined with seismic velocities. Jeofizik 16, 17–29.
Kézdi Á (1980) ‘Handbook of soil mechanics. Vol. 2. Soil testing’. (Elsevier Scientific Publishing: Barking, UK)
Kokusho T (1980) Cyclic triaxial test of dynamic soil properties for wide strain range. Soil and Foundation 20, 45–60.
| Cyclic triaxial test of dynamic soil properties for wide strain range.Crossref | GoogleScholarGoogle Scholar |
Kramer PJ, Boyer JS (1995) ‘Water relations of plants and soils.’ (Academic Press)
Lee C-J, Hung W-Y, Tsai C-H, Chen T, Tu Y, Huang C-C (2014) Shear wave velocity measurements and soil–pile system identifications in dynamic centrifuge tests. Bulletin of Earthquake Engineering 12, 717–734.
| Shear wave velocity measurements and soil–pile system identifications in dynamic centrifuge tests.Crossref | GoogleScholarGoogle Scholar |
Lobsey CR, Viscarra Rossel RA (2016) Sensing of soil bulk density for more accurate carbon accounting. European Journal of Soil Science 67, 504–513.
| Sensing of soil bulk density for more accurate carbon accounting.Crossref | GoogleScholarGoogle Scholar |
Mandolini A (2018) Change in elastic properties of sands under very large number of low amplitude multiaxial cyclic loading. PhD Thesis, University of Bristol.
Moore KP, Wong F, Gines P, Bernardi M, Ochs A, Salerno F, Angeli P, Porayko M, Moreau R, Garcia‐Tsao G, Jimenez W, Planas R, Arroyo V (2003) The management of ascites in cirrhosis: report on the consensus conference of the International Ascites Club. Hepatology (Baltimore, Md.) 38, 258–266.
| The management of ascites in cirrhosis: report on the consensus conference of the International Ascites Club.Crossref | GoogleScholarGoogle Scholar |
Mucciacciaro M, Sica S (2018) Nonlinear soil and pile behaviour on kinematic bending response of flexible piles. Soil Dynamics and Earthquake Engineering 107, 195–213.
| Nonlinear soil and pile behaviour on kinematic bending response of flexible piles.Crossref | GoogleScholarGoogle Scholar |
Muñoz JA, Caicedo A (2013) Design of a density sensor based on piezoelectric crystals for the identification of the density profile in a wastewater treatment plant settler. IFAC Proceedings Volumes 46, 288–292.
| Design of a density sensor based on piezoelectric crystals for the identification of the density profile in a wastewater treatment plant settler.Crossref | GoogleScholarGoogle Scholar |
Onajite E (2014) Understanding seismic wave propagation. In ‘Seismic data analysis techniques in hydrocarbon exploration’ (Ed. E Onajite) pp. 17–32. (Elsevier: Oxford) https://doi.org/10.1016/B978-0-12-420023-4.00002-2
Park S-S, Lee J-S, Lee D-E, Lee J-C (2018) Measurement of unit weight of dry sand using piezoelectric sensor. Applied Sciences (Basel, Switzerland) 8, 2277
| Measurement of unit weight of dry sand using piezoelectric sensor.Crossref | GoogleScholarGoogle Scholar |
Patel A, Bartake PP, Singh DN (2008) An empirical relationship for determining shear wave velocity in granular materials accounting for grain morphology. Geotechnical Testing Journal 32, 1–10.
Pires LF (2018) Soil analysis using nuclear techniques: a literature review of the gamma ray attenuation method. Soil & Tillage Research 184, 216–234.
| Soil analysis using nuclear techniques: a literature review of the gamma ray attenuation method.Crossref | GoogleScholarGoogle Scholar |
Potter CC, Stewart RR (1998) Density predictions using Vp and Vs sonic logs. CREWES Res. Rep 10, 1–10.
Puttlitz CM, Demir HV, Labus KM, Mcgilvray KC, Unal E. (2019, May 30) Displacement and deformation monitoring method and system without using any strain sensor, and components thereof. Google Patents.
Raja MA, Maheshwari BK (2016) Behaviour of earth dam under seismic load considering nonlinearity of the soil. Open Journal of Civil Engineering 6, 75–83.
| Behaviour of earth dam under seismic load considering nonlinearity of the soil.Crossref | GoogleScholarGoogle Scholar |
Richart FE, Hall JR, Woods RD (1970) ‘Vibrations of soils and foundations.’ (Prentice Hall: Englewood Cliffs, NJ, USA)
Schultheiss PJ (1981) Simultaneous measurement of P & S wave velocities during conventional laboratory soil testing procedures. Marine Georesources and Geotechnology 4, 343–367.
| Simultaneous measurement of P & S wave velocities during conventional laboratory soil testing procedures.Crossref | GoogleScholarGoogle Scholar |
Shibuya S, Tatsuoka F, Teachavorasinskun S, Kong XJ, Abe F, Kim Y, Park C (1992) Elastic deformation properties of geomaterials. Soil and Foundation 32, 26–46.
| Elastic deformation properties of geomaterials.Crossref | GoogleScholarGoogle Scholar |
Simic M, Ivanac G, Pustahija AH, Brkljacic B (2012) Shear wave ultrasound elastography: from physics to future. In ‘European Congress of Radiology 2012’
Song WEI, Jun-Gao ZHU (2007) Study on wetting behavior of coarse grained soil in triaxial test. Yantu Lixue 28, 1609–1615.
Sun X-L, Wang X-Q, Wang H-L (2019) Comparison of estimated soil bulk density using proximal soil sensing and pedotransfer functions. Journal of Hydrology 579, 124227
| Comparison of estimated soil bulk density using proximal soil sensing and pedotransfer functions.Crossref | GoogleScholarGoogle Scholar |
Viggiani G, Atkinson JH (1995) Interpretation of bender element tests. Géotechnique 45, 149–154.
| Interpretation of bender element tests.Crossref | GoogleScholarGoogle Scholar |
Voigt T, Grosse CU, Sun Z, Shah SP, Reinhardt H-W (2005) Comparison of ultrasonic wave transmission and reflection measurements with P-and S-waves on early age mortar and concrete. Materials and Structures 38, 729–738.
| Comparison of ultrasonic wave transmission and reflection measurements with P-and S-waves on early age mortar and concrete.Crossref | GoogleScholarGoogle Scholar |
Yang W, Kong Q, Ho SCM, Mo Y-L, Song G (2018) Real-time monitoring of soil compaction using piezoceramic-based embeddable transducers and wavelet packet analysis. IEEE Access: Practical Innovations, Open Solutions 6, 5208–5214.
| Real-time monitoring of soil compaction using piezoceramic-based embeddable transducers and wavelet packet analysis.Crossref | GoogleScholarGoogle Scholar |
Zeng XD, Hlasko H (2005) Cone penetrometer equipped with piezoelectric sensors for measurement of soil stiffness in highway pavement. Report for the Ohio Department of Transportation. Office of Research and Development, State Job No. 134185.


