

Genetic diversity of an undescribed cryptic maskray (Neotrygon sp.) species from Fiji
Kerstin Glaus A * , Epeli Loganimoce A , Gauthier Mescam B and Sharon A. Appleyard C
A
B
C
Abstract
The extinction risk of sharks and rays exceeds that of most other vertebrates. Genetic analyses can help identify conservation risks.
Identification of Fiji’s maskray and testing the null hypothesis of no genetic differentiation within the species over time.
Mitochondrial DNA cytochrome oxidase subunit 1 (COI) barcoding was used for species identification, and DArT-seq technology to monitor the genetic diversity. Cohort samples were collected in 2015 and 2022. A subset from each cohort was barcoded. The genetic survey was complemented by a size comparison between the two cohorts.
Barcoding of the COI gene showed a maximum similarity of 97.84% to Kuhl’s maskray (Neotrygon kuhlii) and 96.83% to the Coral Sea maskray (Neotrygon trigonoides), but no higher-level distinct species match to reference sequences in the Barcode of Life Datasystem. Genotyping of 56 individuals in two cohorts yielded 21,293 single nucleotide polymorphisms (SNPs), and 3871 SNPs per individual were retained. The neutral genetic diversity remained stable over time. The 2015 cohort showed positive inbreeding, with one full-sibling pair identified in each cohort. Body size comparisons indicated a significant reduction in disc length and width in the 2022 cohort.
The smaller body size of the 2022 cohort may hint at increased fishing pressure, but genetic diversity has not been affected. Thus, the null hypothesis is accepted.
These findings provide insights into the genetic diversity of Fiji’s maskray and enable a genetic comparison with current Neotrygon species known in the region. Taxonomy confirmation is needed, but the presence of a cryptic or potentially new maskray in Fiji seems plausible.
Keywords: batoids, COI barcoding, Dasyatidae, elasmobranchs, morphology, Oceania, single nucleotide polymorphisms, taxonomy.
Introduction
Globally, shark and ray populations are declining due to overfishing and climate pressures (Dulvy et al. 2021; Osgood et al. 2021). Despite considerable interspecific and intra-specific life-history variation (Last et al. 2016a; Bradley et al. 2017), many sharks and rays exhibit late maturity, low fecundity, long gestation, and slow growth, making them particularly vulnerable to fishing pressure (Cortés 2000). Additionally, their reliance on nurseries (Heupel et al. 2007) and philopatric behaviour (Chapman et al. 2015) increase the risk of local extirpation. Small populations are prone to inbreeding and genetic drift, resulting in a loss of genetic diversity (Rus Hoelzel et al. 2006; Allendorf et al. 2012). This, in turn, reduces the species’ ability to adapt to environmental changes and evolve (Frankham 2003; DiBattista 2008; Hernández et al. 2015). Therefore, it is crucial to preserve genetic diversity to avoid these adverse consequences.
Genetic data support conservation research and management, by facilitating the detection of genetically distinct populations, the measurement of genetic connectivity, and the identification of the risks associated with demographic change and inbreeding (Allendorf et al. 2012). Advances in the use of molecular markers have significantly improved the delineation of population structures in sharks and rays (Feldheim et al. 2001; Luikart et al. 2018; Ovenden et al. 2018). For example, extensive population structure in the white-spotted eagle ray (Aetobatus narinari) in the Indo-Pacific is evident (Schluessel et al. 2010). Also, there is a strong regional differentiation in the thornback ray (Raja clavata) between the Mediterranean basin, the Azores and the European continental shelf (Chevolot et al. 2006). High divergence across oceanic basins and lower differentiation along continuous coastal habitats was linked to the short-tailed stingray (Dasyatis brevicaudata) (Le Port and Lavery 2012). Strong ocean currents and bathymetry can limit connectivity in species with active dispersal; for example, the Indonesian through-flow current influenced genetic differences in species from the maskray complex (Neotrygon sp.) (Borsa et al. 2012; Puckridge et al. 2013), while the steep bathymetry of the Southern California Bight drove genetic differences in round stingrays (Urobatis halleri) (Plank et al. 2010), at small geographical scales. Generally, biogeographic barriers, ocean distances, behaviour – particularly reproductive philopatry – movement ecologies, and habitat preferences affect gene flow and genetic differentiation in elasmobranchs (Dudgeon et al. 2012; Hirschfeld et al. 2021; Devloo-Delva et al. 2023; Postaire et al. 2024).
However, the current elasmobranch literature on intraspecific genetic differentiation is skewed towards sharks (Hirschfeld et al. 2021), with stingrays (Myliobatoidei) (Aschliman et al. 2012) remaining one of the least understood groups of vertebrates in terms of molecular genetics (Beheregaray 2008). Furthermore, population genetic structures can vary spatially and temporally, affecting the accuracy of inferences based on changing spatial patterns over time (Kornfield et al. 1982; Lacson and Morizot 1991). Temporal genetic studies on shorter time scales, typically conducted over the course of a few years or within a single generation have primarily relied on seasonally recurring aggregations (Lieber et al. 2020) as well as the comparison of spatio-temporal genetic patterns within juvenile populations and between juvenile and adult cohorts (Glaus 2019; Kuguru et al. 2019; Liu et al. 2023). Collecting time-separated samples enables temporal genetic monitoring and assessing changes in genetic variation (Domingues et al. 2018). This can reveal significant temporal genetic differentiation, suggesting stochastic effects from a small effective population size or previously undetected genetic subpopulations or stocks (Hedgecock 1994). Furthermore, collecting samples at multiple time points reduces the likelihood of including closely related individuals within the sample. Thus, preventing genetic structure from being an artefact of related individuals sampled at the same location (Devloo-Delva et al. 2019). Altogether, documenting genetic diversity (and where analyses permit, the calculation of effective population sizes over time) is fundamental in marine conservation genetics and particularly critical for long-lived species such as rays (Waples et al. 2008; Goldman et al. 2012; Domingues et al. 2018).
Species of the genus Neotrygon, commonly known as ‘maskrays,’ are native to the Indo-West Pacific region (Last et al. 2016a). Neotrygon (Castelnau 1873) was previously treated as a subgenus of Dasyatis. Based on more recent morphological and molecular analyses, the subgenus was elevated to the generic level (Last et al. 2016b, 2016c), and now belongs to the family Dasyatidae. Molecular analyses have also revealed discrete genetic diversity within this group and indicated the occurrence of several cryptic species (Arlyza et al. 2013; Puckridge et al. 2013). Due to morphological ambiguity, it is often difficult to distinguish between closely-related maskrays (Arlyza et al. 2013; Puckridge et al. 2013). Thus far, at least 11 species have been described from the species complex’ under the genus Neotrygon (Last et al. 2016a, 2016c; Hata and Motomura 2024). Maskrays are demersal, inhabiting intertidal sand flats, coral reefs, lagoons and slopes and as many other stingrays, they are likely susceptible to habitat degradation (Jabado et al. 2018). According to the Red List criteria of the International Union for the Conservation of Nature, maskrays are assessed as: Data Deficient (Neotrygon ningalooensis (Ferretti and White 2015), Neotrygon kuhlii (Kyne and Finucci 2018); Least Concern (Neotrygon caeruleopunctata (Sherman et al. 2021a), Neotrygon leylandi (Pierce and Kyne 2015), Neotrygon orientalis (Sherman et al. 2022a), Neotrygon picta (Pierce et al. 2015), Neotrygon trigonoides (Sherman et al. 2021b), Neotrygon varidens (Sherman et al. 2022b); and Near Threatenend (Neotrygon annotata (Jacobsen et al. 2015), Neotrygon australiae (Sherman et al. 2021c).
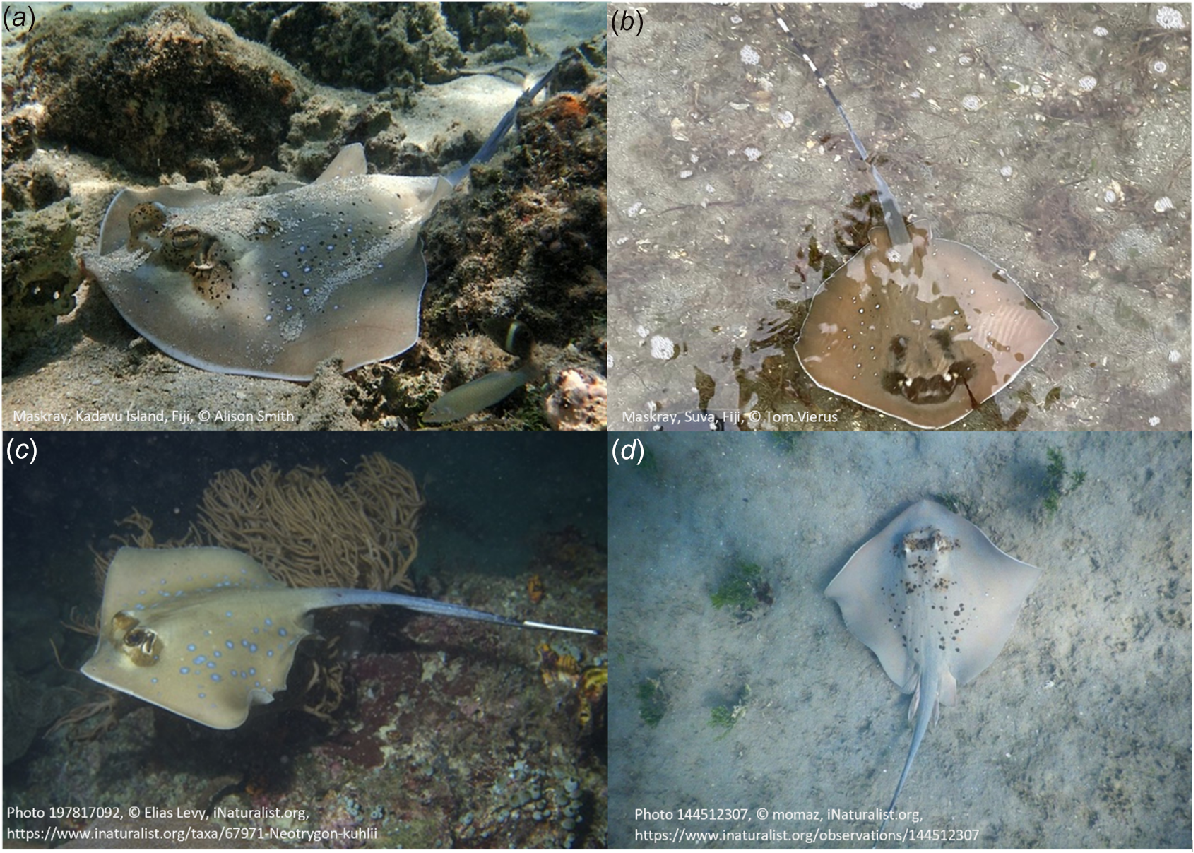
Fiji’s maskray (Fig. 1a, b) has traditionally been recognised as Kuhl’s maskray (N. kuhlii) (Fig. 1c), while its colour patterns rather resemble the Coral Sea maskray (N. trigonoides) (Fig. 1d). In-country species identification for the maskray in Fiji is lacking and so are data on its ecology, life-histories, and genetic-population structure. Hence, mitochondrial DNA (mtDNA) ytochrome oxidase subunit 1 (COI) barcoding (Ward et al. 2005) is required to verify Fiji’s maskray species. As the maskray is the most frequently caught and traded ray in the country’s small-scale fishery activities (Glaus et al. 2024a) combined with the low reproductive output of congeneric species (Pierce et al. 2009), it might be susceptible to even light fishing pressure.
Congeneric maskray species: (a, b) Fiji’s maskray, (c) Kuhl’s maskray, (d) Coral Sea maskray. Photo credit: (a) Alison Smith, (b) Tom Vierus, (c, d) both derive from iNaturalist.
This study used COI barcoding to identify Fiji’s maskray. Moreover, temporal monitoring of genetic diversity (utilising genome-wide single nucleotide polymorphism (SNP) markers), spanning 7 years through the analysis of time-separated samples was undertaken. The null hypothesis of no genetic differentiation within the species over time was tested. This documentation of the species’ temporal genetic diversity was complemented by comparing disc length (DL) and disc width (DW) between two temporal groups. Together, these results contribute valuable insights into the genetic diversity of Fiji’s maskray and enable a genetic comparison with current Neotrygon species known in the region.
Materials and methods
Sample collection
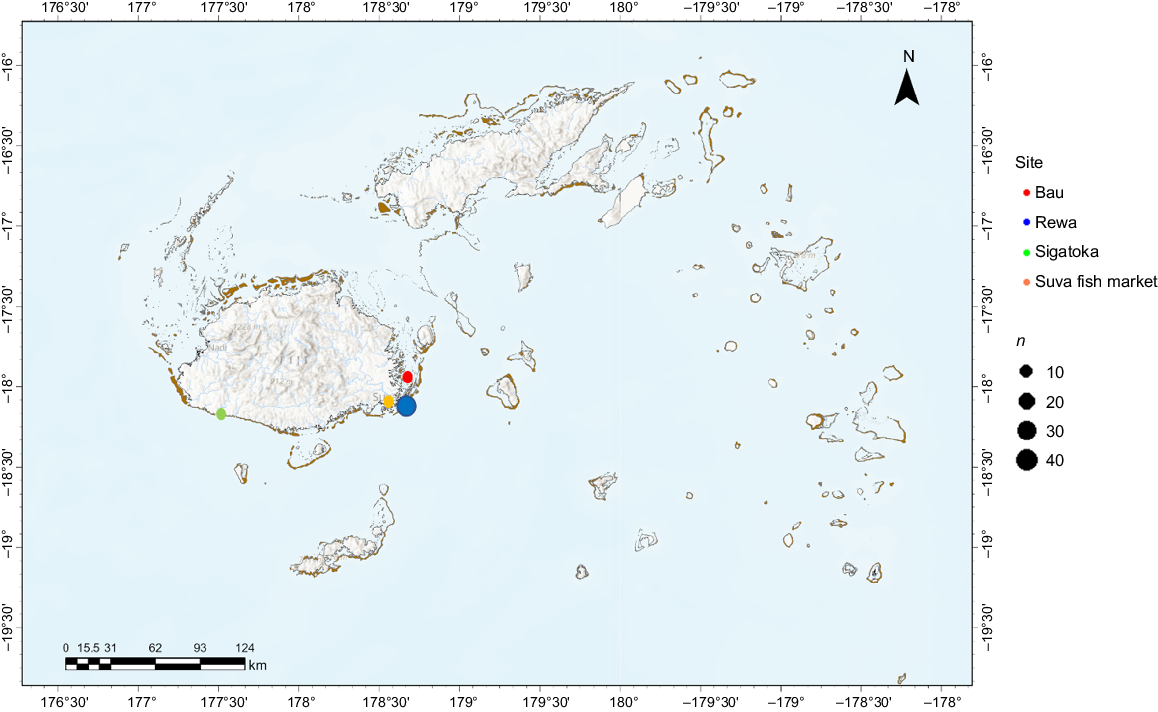
To obtain samples for molecular species identification, temporal genetic diversity analysis, and DL and DW measurements for size comparison, surveys at the Suva fish market on Fiji’s main island Viti Levu (Fig. 2) were conducted in 2015 and in 2022 (Glaus et al. 2024a). Additionally, the Sigatoka fish market (Fig. 2) was visited occasionally in 2022. The Suva fish market is Fiji’s prime market. A variety of reef fishes are sold alongside invertebrates such as octopus, freshwater mussels, crabs, and lobsters (Mangubhai et al. 2017; Tukana et al. 2023). The majority of rays sold there are caught within the Rewa Estuary, and Tailevu, including Bau (Fig. 2), but they also originate from nearby locations and as far as Kadavu, although precise catch locations and GPS data are unknown (Glaus et al. 2024a). In total, 49 samples were collected in 2015 and 40 in 2022. DW and DL size measurements were recorded whenever possible, while a subset of samples per cohort was used for DNA COI barcoding (see section below). Prior to sampling, market vendors were informed about the purpose of the surveys. DL and DW measurements and tissue sample collection were only conducted with the verbal permission of each respective vendor. In many rays, the disc includes the combined head, trunk, and pectoral fins (Last et al. 2016a). DL was measured from the tip of the head to the end of the pelvic fins, while DW was measured from the tip of the left pectoral fin to the tip of the right pectoral fin. Vendors were also asked to specify where the respective maskrays were captured. Tissue samples (fin clips, 1 cm2) were stored in 95% ethanol until DNA extraction. Samples then underwent polymerase chain reaction (PCR) amplification, library preparation and sequencing (Sanger sequencing for barcoding and Illumina sequencing for SNP genotyping). No maskrays were bought for this study to avoid any inadvertent incentives or demand.
Map of the Fiji Islands. Tissue samples of 89 maskrays were collected; 49 samples in 2015 and 40 samples in 2022. In total, 56 maskrays were genotyped successfully. Maskrays used for SNP genotyping were captured in the Rewa Estuary (blue, n = 45), Bau (red, n = 7) and Sigatoka (green, n = 2). Orange refers to the Suva fish market, where most tissue samples were acquired. Catch sites were unknown for two specimens sold at the Suva fish market.
mtDNA COI barcoding
The mtDNA COI gene is one of the most widely used gene markers for species identification (Ward et al. 2008). Tissue samples from both cohorts underwent COI barcoding. Specifically, seven samples from the 2015 cohort were barcoded at Diversity Arrays Technology, Australia, using DArT-MP proprietary processes, while 12 tissue samples were processed at ETH Zurich and sequenced at Microsynth, Switzerland. The same primers were used by Diversity Arrays Technology and by the ETH Zurich. For the latter, DNA was extracted with the Qiagen Blood and Tissue kit, following standard protocols (Qiagen Inc., Valencia, CA, USA). A 652-bp fragment from the 5′ region of the COI was PCR amplified using FishF2 (5′ -35′TCGACTAATCATAAAGATATCGGCAC3′), FishF2N (5′ATCTTTGGTGCATGAGCAGGAATAGT3′), and FishR2 (5′ACTTCAGGGTGACCGAAGAAGAATCAGAA3′) primers (Ward et al. 2005). Resulting sequences were identified by using the Identification Engine at the Barcode of Life Data System (BOLD) (Ratnasingham and Hebert 2007) and by Basic Local Alignment Search Tool (BLAST) (Madden 2003). See Table 1 for Accession numbers.
| 2015 cohort ID | BLAST similarity % | BLAST reference | BOLD similarity % | BOLD reference | Accession# | |
|---|---|---|---|---|---|---|
| SV_2015_37 | 97.15%, N. kuhlii | KU498038.1 | 97.10%, N. kuhlii | GBGC10627-13 | OR976143 | |
| SV_2015_4 | 97.10%, N. kuhlii | KU498038.1 | 97.10%, N. kuhlii | GBGC10627-13 | OR976144 | |
| SV_2015_38 | 96.99%, N. kuhlii | KU498038.1 | 96.94% N. kuhlii | GBGC10627-13 | OR976145 | |
| SV_2015_47 | 97.15%, N. kuhlii | KU498038.1 | 97.26%, N. kuhlii | GBGC10627-13 | OR976146 | |
| SV_2015_40 | 97.15%, N. kuhlii | KU498038.1 | 97.10%, N. kuhlii | GBGC10627-13 | OR976147 | |
| SV_2015_48 | 96.84%, N. kuhlii | KU498038.1 | 97.25%, N. kuhlii | GBGC10627-13 | OR976148 | |
| SV_2015_33 | 97.25%, N. kuhlii | KU498038.1 | 97.04%, N. kuhlii | GBGC10627-13 | OR976149 |
| 2022 cohort ID | BLAST similarity % | BLAST reference | BOLD similarity % | BOLD reference | Accession# | |
|---|---|---|---|---|---|---|
| SV_110622_4 | 96.71% N. kuhlii | KU498038.1 | 96.71% N. kuhlii; N. trigonoides; N. westpapuensis | LIFS993-08 ANGBF13149-18 SOPNG125-18 | OR839855 | |
| SV_230422_7 | 96.18% N. kuhlii; N. trigonoides | KU497960.1 KU498033.1 | 96.08% N. kuhlii; N. trigonoides | ANGBF13157-18 GBGC12837-13 | OR839856 | |
| SV_090422_1 | 96.91% N. kuhlii | KU498038.1 | 96.89% N. kuhlii | ANGBF13226-18 | OR840698 | |
| SV_260322_5 | 96.25% N. kuhlii | KU497960.1 | 96.25% N. kuhli | ANGBF13157-18 | OR839857 | |
| SV_130522_1 | 96.02% N. kuhlii; N. trigonoides | KU497960.1 KU498033.1 | 95.93% N. kuhlii; N. trigonoides | ANGBF13157-18 GBGC12837-13 | OR839858 | |
| SV_090422_3 | 96.77% N. kuhlii | AB485685.1 | 96.77% N. kuhlii | GBGC10609-13 | OR839859 | |
| SV_260322_1 | 95.87% N. kuhlii; N. trigonoides | KU498017.1 KU498033.1 | 96.83% N. kuhlii; N. trigonoides | ANGBF48132-19 ANGBF48182-19 | OR839860 | |
| SV_110622_1 | 96.68% N. kuhlii | KU498038.1 | 96.62% N. kuhlii; N. trigonoides | ANGBF13226-18 LIFS993-08 | OR839861 | |
| SV_210522_1 | 96.26% N. kuhlii | KC250643.1 | 96% N. kuhlii; N. trigonoides | ANGBF13226-18 LIFS993-08 | OR839862 | |
| SV_140422_1 | 95.59% N. trigonoides | KU498033.1 | 94.44% N. kuhlii; N. trigonoides | ANGBF13157-18 GBGC12837-13 | OR839863 | |
| SV_140422_4 | 96.72% N. kuhlii: N. trigonoides | KU497960.1 KU498033.1 | 97.84% N. kuhlii | GBGC10609-13 | OR839864 | |
| SV_110622_2 | 95.57% N. kuhlii; N. trigonoides | KU498017.1 KU498033.1 | 95.54% N. kuhlii; N. trigonoides | ANGBF48132-19 ANGBF48182-19 | OR839865 |
GenBank accession numbers given for samples from the 2015 and 2022 cohorts.
The COI sequences from the 19 specimens (across the two cohorts) were combined with a selection of publicly available COI data from 24 Neotrygon specimens available in BOLD and NCBI GenBank (BOLD Process IDs and GenBank Accession numbers are included here for each Neotrygon specimen). The final alignment comprised of 43 specimens of Neotrygon across 695 nucleotide positions. COI pairwise genetic distances were calculated in MEGA-X (Kumar et al. 2018) with the phenetic relationship among the specimens inferred by a maximum likelihood fitting tree with 10,000 bootstrap replications used following determination of the best fit nucleotide model of Hasegawa-Kishino_Yano (H-K-Y + G (Hasegawa et al. 1985). Additionally, newly sequenced Fijian Neotrygon individuals from this study were submitted to GenBank; Accession numbers are in Table 1.
DArT-Seq: extraction and SNP sequencing
SNP genotyping was also performed at Diversity Arrays Technology using DArT-Seq, where genomic DNA was extracted using standard robotic methods. DNA was then processed for reduced representation library construction, sequenced and genotyped by DArT-Seq following previously developed and tested complexity reduction protocols for scalloped hammerhead sharks (Sphyrna lewini) (Marie et al. 2019). Briefly, genome complexity reduction was achieved with a double restriction digest using a PstI and SphI methylation-sensitive restriction enzyme combination. Libraries were sequenced on an Illumina HiSeq 2500 platform, and raw reads obtained following sequencing were processed using Illumina CASAVA ver. 1.8.2 software for initial assessment of read quality and sequence representation. Enzymes and libraries were the same as used for S. lewini, albeit a different adapter sequence (NeotrygonP_ad_sp4) with shorter fragments was used. The DArT-PL proprietary software pipeline, DArTtoolbox was implemented for further filtering and variant calling to generate the final genotypes set.
SNP quality control filtering
Quality control filtering steps were performed on the dataset; these included (excluding duplicate SNPs possessing identical Clone IDs); removing loci with a call rate (proportion of individuals scored for a locus) < 90%; and maintaining SNPs with a read depth > seven and minor allele frequencies <2%. Detection of loci under selection was tested using BayeScan ver. 2.1 (Foll and Gaggiotti 2008). The most conservative neutral model in BayeScan was used to minimise falsely detected loci under selection (Lotterhos and Whitlock 2014). Runs consisted of 100,000 iterations with a burn-in length of 50,000 iterations (Foll and Gaggiotti 2008; Foll 2012). Once probabilities had been calculated for each locus, the BayeScan function plot_R was used in the R ver. 3.2.0 statistical package (Venables et al. 2009) to identify putative outlier loci. A range of false discovery rate (FDR) values from 0.01 to 0.20 were evaluated based on preliminary testing and recommendations by Gondro et al. (2013).
Allelic diversity, population structuring and relatedness
Allelic diversity indices including average observed (Ho), expected (He), and unbiased expected heterozygosity corrected for population sample size (Hn.b.) were computed in Genetix v.4.05.2 (Belkhir 1999), together with the inbreeding coefficient (FIS). Pairwise FST estimates (Reynolds et al. 1983) were calculated in Arlequin ver. 3.5.1.3 followed by correction of significance levels for pairwise testing (Excoffier and Lischer 2010). Also, an analysis of molecular variance (AMOVA) was performed in Arlequin ver. 3.5.2.2 (Excoffier 2015) using 10,000 permutations to estimate F-statistics to detect population genetic partitioning between cohorts. ML-Relate (Kalinowski et al. 2006) and COLONY (Jones and Wang 2010) were used for relatedness analysis within cohorts. For COLONY, a weak sibship prior was chosen as input parameter. The maskrays were analysed both as a single population comprising all specimens, as well as two separate populations representing the 2015 and 2022 cohorts.
The number of genetic groups in the Fiji maskray SNP dataset for the genotyped individuals was estimated using the Bayesian model-based clustering algorithm implemented in Structure (ver. 2.3.4) (Pritchard et al. 2000; Falush et al. 2003; Hubisz et al. 2009) run using an admixture model (without a priori knowledge of location) with correlated allele frequencies. Following preliminary model testing, Structure was run with K (number of clusters) set between 2, 8 and 10 independent runs per K. The Structure algorithm inferred the proportion of ancestry for each individual from each cluster; each independent run had a burn-in of 50,000 followed by 100,000 Markov chain Monte Carlo (MCMC) iterations.
The seven K Structure runs were then processed using the Greedy algorithm on the CLUMPAK (Clustering Markov Packager Across K) server (Kopelman et al. 2015) to find the preferred value of K (based on ΔK) (as per (Evanno et al. 2005) which demonstrated the uppermost level of structure in the SNP dataset. Clustering analysis on CLUMPAK was visualised with distruct (Rosenberg 2004).
K-means clustering and Discriminant Analysis of Principal Components (DAPC), a non-model based method in the R package adegenet ver. 1.4.2 (Jombart 2008; Jombart and Ahmed 2011) additionally provided description of genetic clusters in the SNP data (based on discriminant functions), whereby genetic proximity of individuals to clusters was determined based on all included neutral loci. An optimised a-score for DAPC was used to determine the number of principal components (n = 14 PCs) that were retained for the assignment analyses. The K-means clustering algorithm in adegenet (run for K = 1–K = 6) also compared clustering solutions based on Bayesian Information Criteria (BIC) after transformation of the data using a Principal Component Analysis (data not shown).
Morphology analysis
Histograms in R were used to visualise the DL and DW distribution in both cohorts (Wickham et al. 2019). Mean sizes-at-maturity in a congeneric maskray were 314 mm DW in females and 294 mm DW in males (Pierce et al. 2009). Here, only deviations from means were detected in two females and one male. The respective male belonged to the 2022 cohort and had calcified claspers, which suggest that it reached sexual maturity (Awruch 2015). Due to the uncertainties surrounding the application of size-at-maturity estimates from a congeneric maskray in Australia to the maskray species in Fiji, and acknowledging that size alone cannot reliably determine sexual maturity (as larger individuals may still be immature, while smaller ones could already have reached maturity (Pierce et al. 2009), all specimens in both cohorts were retained. Overall, the size-related dataset included 49 maskrays from the 2015 cohort and 40 maskrays from the 2022 cohort. To determine whether there was a significant difference in DL and DW between the two cohorts, Welch’s t-tests were performed in R (Wickham et al. 2019), due to unequal variances (West 2021).
Compliance with ethical standards
This research was approved by The University of the South Pacific (USP), by the Provincial Councils, and by Pacific-European Union Marine Partnership PEUMP Project Management. All sampling procedures were approved by the USP Research Committee and performed in accordance with relevant guidelines and regulations. Also, in accordance with protocols of the USP, Provincial Councils were consulted, to explain the research, objectives, methodologies and expected outcomes prior to the data collection.
Results
COI barcoding
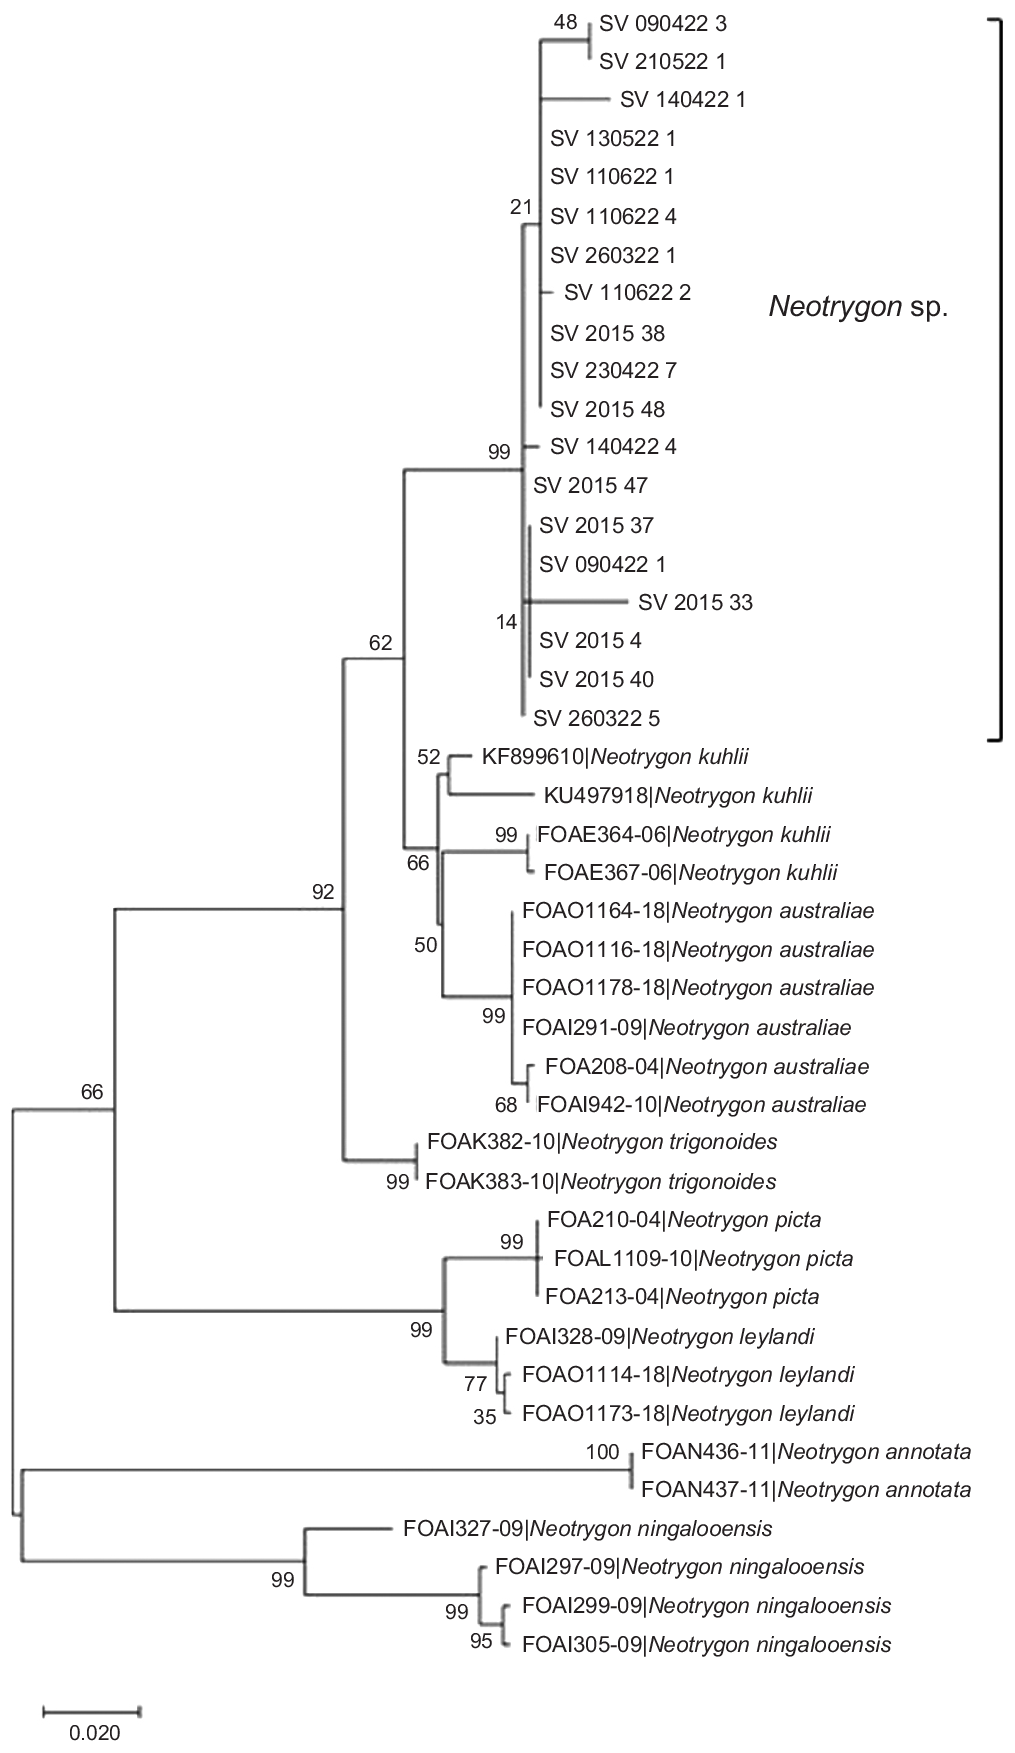
Only seven samples from the 2015 cohort (due to compromised samples and lower quality extracted DNA post sample processing), and a subset of 12 samples from the 2022 cohort underwent COI barcoding. For both cohort subsets, the molecular barcoding results did not yield a definitive species match. The closest match for both cohorts was with N. kuhlii at 97.25% for the 2015 cohort and at 97.84% for the 2022 cohort, respectively (Table 1). As these percentage matches demonstrate (Fig. 3), these 19 Fijian maskray specimens clustered together and separately to all other sequenced Neotrygon individuals.
Maximum-likelihood tree of eight species of Neotrygon, including Fiji maskrays sequenced at the COI mtDNA gene in 43 specimens and based on the H-K_Y model. Tree shown here has the highest log likelihood following 10,000 bootstrap replications. Each specimen is identified by either its BOLD Process ID or GenBank Accession Number. In this tree, each species forms a group. Numbers on nodes indicate bootstrap values.
SNP filtering
In total, 16 samples (also due to compromised samples and lower quality extracted DNA post sample processing) from the 2015 cohort and all 40 samples from the 2022 cohort were genotyped. Genotyping by sequencing resulted in 21,293 SNPs prior to quality control filtering (Carson et al. 2014), and 3871 filtered SNP loci. Among the SNPs that passed all quality control filters, no SNPs were identified as outlier loci putatively under positive selection (FDR 1%).
Genomic diversity, relatedness and DAPC
Except for Ho, which is higher in the 2022 cohort, population-level indices of genetic diversity, including Hn.b., He, were similar or identical across the two temporal cohorts (Table 2). Based on the 3871 SNP loci in the filtered data set screened across both cohorts, 1225 and 3807 loci were polymorphic in the 2015 and 2022 cohort, respectively. Additionally, a large number (n = 2498) of SNP loci in the 2015 cohort were not successfully genotyped (possibly due to poorer quality sample DNA, see above). Inbreeding estimates were higher in the 2015 cohorts, with a FIS value of 0.25, compared to a FIS value of 0.00 in the 2022 cohort. FST-estimates (FST = 0.003, P = 0.150) and AMOVA results (FST = −0.00296, P = 0.988) indicated there was no genetic differentiation between the two temporal cohorts (Table 2). Both cohorts yielded a single full-sibling pair, which were identified in COLONY and ML-Relate. COLONY results indicated a probability of 1.00, and hence a high confidence level in the inferred sibship dyads. No relatedness was detected between the two cohorts.
| Cohort | N | Ho | He | Hn.b. | FIS | Pairwise estimate | AMOVA | |
|---|---|---|---|---|---|---|---|---|
| 2015 | 16 | 0.22 | 0.30 | 0.30 | 0.27 | |||
| 2022 | 40 | 0.30 | 0.29 | 0.30 | 0.00 | |||
| All samples | 56 | 0.28 | 0.30 | 0.30 | 0.07 | FST = 0.003,P = 0.150 | FST = −0.00296,P = 0.988 |
Genotyping metrics: N (samples genotyped); Ho (observed heterozygosity); He (expected heterozygosity); Hn.b. (unbiased expected heterozygosity); FIS (inbreeding coefficient) per cohort; FST based on pairwise estimate and AMOVA.
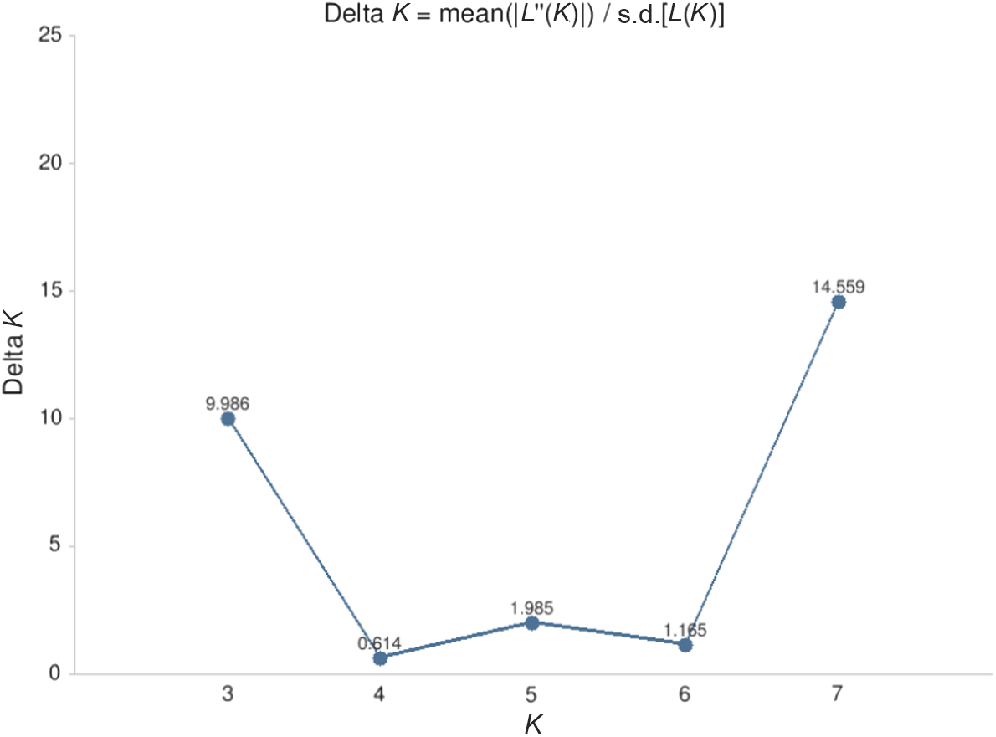
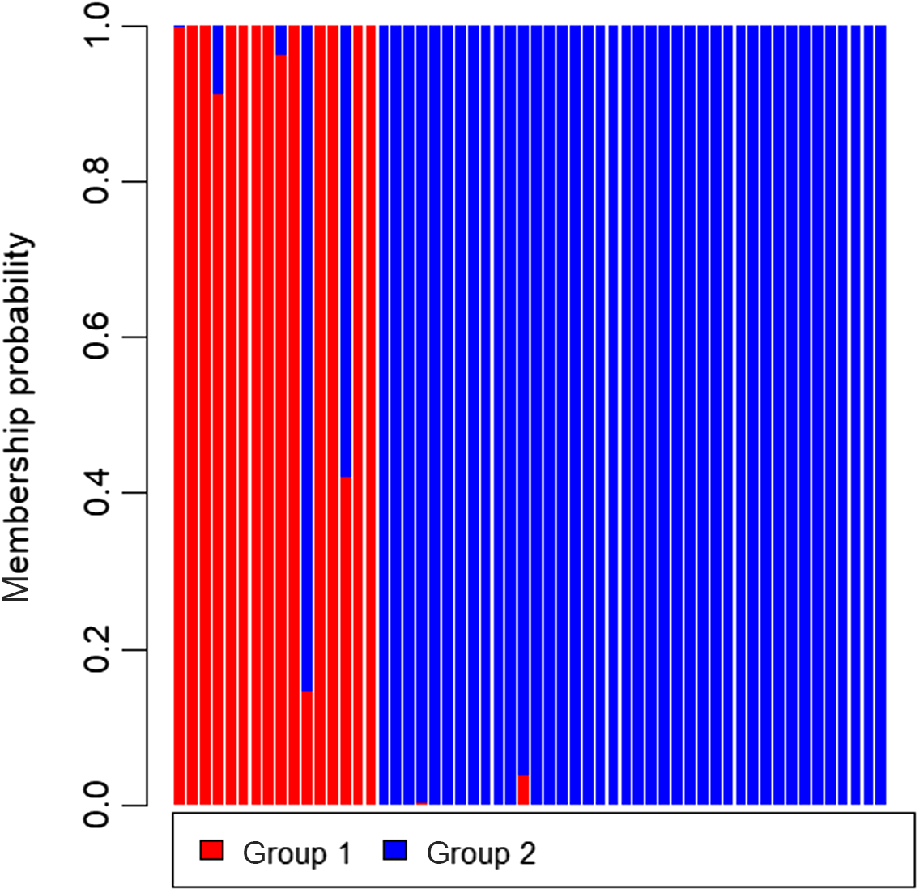
Based on Structure with the admixture model and correlated allele frequencies among the two cohorts, the ΔK Evanno criterion (Evanno et al. 2005) was identified as multi-modal peaks at K = 3 and 7 (Fig. 4), and the Probability K method by Pritchard et al. (2000) was identified as a single peak at K = 7 (see Supplementary material Fig. S1, Prob(K). = 1.000). Based on these two Bayesian Structure models, the optimal number of clusters in the data was somewhat unclear. The output from the summary Clumpak pipeline is given in Fig. S2. Based on DAPC, one linear discriminant function was identified. The DAPC density plot likely represents the difference in the numbers of polymorphic and of usable loci across the individuals (Fig. S3) with the composition plot highlighting that the two groups are not entirely separate, with several individuals from the 2015 cohort displaying membership probabilities more closely with that of the 2022 cohort (Fig. 5). Based on BIC, the number of clusters detected by DAPC was K = 2 (Fig. S4).
Morphology analysis
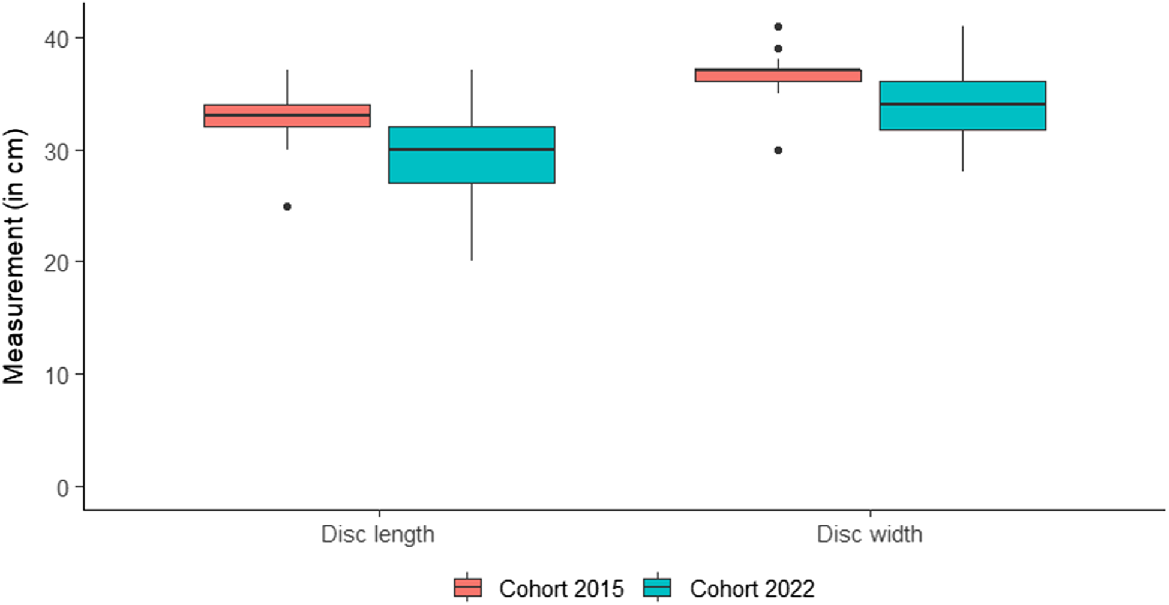
Welch’s t-test results showed that individuals from the 2022 cohort exhibited significantly smaller DL and DW compared to their conspecifics in the 2015 cohort (Table 3, Fig. 6).
| Specimens measured | DL (cm) | DW (cm) | |
|---|---|---|---|
| N 2015: 49 N 2022: 40 | |||
| T | 4.05 | 3.75 | |
| Mean 2015 | 32.88 | 36.70 | |
| Mean 2022 | 29.42 | 33.95 | |
| P | <0.001 | <0.001 |
Mean values for 2015 and 2022 are shown, indicating significant differences (P < 0.001) in disc length and width between the two cohort samples. T, t-test statistic.
Discussion
To our knowledge, this is the first study monitoring the genetic diversity in a stingray using time-separated samples. The mtDNA barcoding analysis did not yield conclusive species identification results, as it revealed a minimum genetic divergence of over 2% from the Kuhl’s and of over 3% from the Coral Sea maskray. In Australasian samples, it was demonstrated that 99% of the 210 species identified based on morphological characteristics could be distinguished using COI barcoding (Ward et al. 2008). However, the COI gene also has limitations for elasmobranchs due to its small size (655 bp) and relatively slow evolution rate (White et al. 2022). This limitation was addressed by suggesting the larger and faster-evolving ND2 gene (1044 bp) as a species-discriminating marker, which generally aligned with COI results but offered improved resolution in some cases where COI failed to distinguish between groups (Naylor et al. 2012). Although Ward et al. (2008) reported that approximately 96% of within-species sequences exhibited less than 2% divergence, considering this as threshold value for separate species can be misleading (White et al. 2022), as COI sequences in sharks and rays exhibit highly variable divergence rates both between and within species (Ward et al. 2008; Finucci et al. 2018).
Fiji’s maskray is widely distributed across the Fiji archipelago (Glaus et al. 2024b). The distribution of Kuhl’s maskray remains uncertain. Currently documented in the Solomon Islands within the Western Central Pacific (Last et al. 2016a), its presence might extend further across Oceania. The Coral Sea maskray inhabits regions in Queensland, Australia, and New Caledonia. However, also in this species, the extent of species distribution and potential overlap remains unclear. While personal observations (KG), photographic records, and morphological differences in specimens documented for this study, along with genetic results, suggest distinctiveness of Fiji’s maskray, definitive conclusions regarding distribution overlaps cannot be drawn. Overall, additional taxonomic clarification is necessary to identify Fiji’s maskray, including morphological analyses and the use of NADH dehydrogenase 2 (ND2) genetic markers. Indeed, ongoing investigations, including detailed morphological and morphometric analyses aim to clarify its taxonomic status and provide a more accurate species description (K. Glaus and S. Appleyard, pers. comm.).
Genetic diversity and variation over time
Genotyping of over 3800 nuclear SNPs provided the following insights into the genetic diversity present in the Fijian maskray. The maskray in Fiji exhibited low levels of genetic diversity (as detected by SNPs), as evidenced by the low values of observed and unbiased expected heterozygosity (Ho = 0.28, Hn.b. = 0.30). These SNP based diversity values are nevertheless higher than in other tropical sharks such as the Galapagos shark (Carcharhinus galapagensis) (0.188–0.193) (Pazmiño et al. 2017), and the bull shark (Carcharhinus leucas) (0.128–0.214) (Glaus et al. 2020), comparable to the grey reef shark (Carcharhinus amblyrhynchos) (0.139–0.312) (Momigliano et al. 2017), and very similar to the spotted eagle ray (A. ocellatus) from Fiji (0.310–0.320) (Glaus and Appleyard 2024). Lower genetic diversity of shark and ray species is probably more associated with bottlenecks and the slow rate of molecular evolution. Regardless of whether the cause is historical or cotemporary, the current levels of genetic diversity should be considered for conservation policies (Martin et al. 1992; Rus Hoelzel et al. 2006; Allendorf et al. 2008).
The lack of genetic differentiation between the two cohorts suggested that both stochastic effects due to a small effective population size, and genetic subpopulations were absent. Positive FIS values in the 2015 cohort indicated a significant deficit of heterozygotes in the 16 sampled individuals. This suggested the presence of some level of relatedness and family structure within the 2015 samples. Although the sample size for the 2015 cohort was almost 2.5-times smaller compared to the 2022 cohort, one full-sib pair was identified per cohort. In congeneric maskrays, age at maturity ranges 3–6 years (Jacobsen and Bennett 2010), with maximum age estimates of 13 years for females and 10 years for males (Pierce et al. 2009). Therefore, identifying at least half-sibling pairs across the two cohorts would have been possible. Non-random mating is one possibility for the positive FIS values in the 2015 cohort, which can result in a decrease in genetic diversity and an increase in the frequency of homozygous genotypes. However, genetic diversity remained consistent. Genetic diversity may have been preserved through the potential of gene flow between unsampled populations near our sample capture sites and the 2022 cohort. However, this cannot be confirmed as it is not known how many populations were sampled.
Furthermore, the results of the AMOVA analyses suggested despite a considerable number of SNPs in the 2015 cohort not being called (which could be attributed to the quality of the 2015 samples) there was no significant genetic differentiation between the two cohorts. The DAPC analysis indicated that differences in the number of polymorphic and usable loci between the two cohorts likely accounted for the observed variation. Additionally, while Structure was not helpful in suggesting the number of population groups based on Bayesian clustering inferred from the delta K statistic (likely due to the uneven sample size across the 2015 and 2022 and the difference in number of SNP loci successfully genotyped) (Puechmaille 2016), we prefer to consider individuals in the dataset demonstrated genetic proximity to two genetic clusters (Fig. 5), albeit with non-significant genetic differentiation among the 2015 and 2022 cohort. Overall, the limited quality and sample size of the 2015 cohort with only 16 individuals and the 7-year sampling regime may have impacted the significance of the results with regard to the lack of genetic variation. Therefore, longer-term sampling regimes and larger sample sizes are necessary to further investigate the genetic diversity in maskrays from Fiji and its potential implications for conservation.
Morphological comparison
The decreases in DL and DW could be reflective of population alterations, such as changes in birth rates, survival rates, or migration patterns. Sampling bias provides an additional explanation. While the sampling method remained consistent, the specimens in 2022 were measured throughout the year. In contrast, measurements in 2015 were conducted only in October and November, which may coincide with the species’ reproductive season (Pierce et al. 2009). However, when comparing specimens collected only during October and November in both cohorts, the size decrease in DL and DW for the 2022 cohort remained evident. The same applied when only randomly selected subsets of each cohort were used for DL and DW size comparisons. Thus, a sampling bias is unlikely. The variation in size could, however, be attributed to unequal sex ratios (Goldman et al. 2012), but the absence of recorded sex data for the 2015 cohort hindered the possibility of conducting DL and DW size comparisons and partitioning the dataset by sex.
The 2022 cohort was sampled 2 to 13 months after international travel restrictions were lifted in December 2021. The rapid collapse of Fiji’s tourism due to the COVID-19 pandemic severely undermined employment occupations, which led to urban-rural return migrations (Davila et al. 2021). This resulted in additional pressure on fishing resources and disputes over access and tenure (Connell 2021). Thus, probably more fishers were active in the Rewa Estuary and surrounding areas before and during the 2022 sampling period, than in 2015. Fishing efforts target larger individuals, which tend to be more fecund (Pauly et al. 1998). Particularly, females grow faster and reach larger sizes than males, as evident in many elasmobranchs (Klimley 1987; Francis 1996; Cortés 2000; Pierce and Bennett 2009; Pierce et al. 2009). The smaller size of the 2022 maskray cohort compared to 2015 may be a sign of increased fishing pressure, however the genetic diversity of the species has not decreased as found in this study. As catch monitoring time-series data for the maskray, as for other elasmobranchs, in Fiji are absent, it can neither be confirmed nor ruled out, whether the documented size decrease is indicative for increased fishing pressure.
Conclusion
Our study on Fiji’s maskray (Neotrygon sp.) suggests a potential new maskray species in the study area, which clearly requires further taxonomic resolution. Overall, the study resulted in two main findings: (1) detection of consistent genetic diversity over time; and (2) a significant reduction in body size after 7 years. The identification of the same level of genetic diversity over time indicated that the overall genetic makeup of the maskray population remained relatively constant. Consequently, the null hypothesis is accepted. As this was the first genetic study on maskrays in Fiji, our results enhance the understanding of the maskray’s genetic composition and emphasise the importance of ongoing monitoring efforts to gain deeper insights into the population dynamics of this species.
Data availability
The unfiltered SNP report, data on size distributions, and R scripts will be made available on the Data Dryad Digital Repository.
Declaration of funding
The work was funded through the Pacific-European Union Marine Partnership (PEUMP) programme within the PAGoDA Grant Agreement, key result area 6: ‘Capacity built through education, training and research and development for key stakeholder groups in fisheries and marine resource management’, implemented by the University of the South Pacific (USP), under the Institute of Marine Resources. The PEUMP Programme is a multilateral fund financed by the European Union (EU) and the Swedish International Development Cooperation Agency (Sida) aiming at building sustainable fisheries in the Pacific region.
Author contributions
KG and SA conceived the study. KG and GM did the field work. KG, SA and EL performed the population genetic analyses. KG wrote the first draft of the manuscript. All authors reviewed the manuscript and contributed to the final write-up.
Acknowledgements
We thank all the market vendors for their permission to take tissue samples and measurements. We also thank LoÏc Pellisier, Camille Albouy, and Sarah Thurnheer (ETH Zurich) for performing the COI barcoding; and Brian Stockwell (USP) for inputs during the results interpretation. Thanks to Tom Vierus and Alison Smith for the pictures of Fiji’s maskrays, which were included in Fig. 1. We acknowledge the USP PEUMP project team, the Provincial Councils, and Fiji’s Ministry of Fisheries. We thank the two anonymous reviewers for their comments and suggestions.
References
Allendorf FW, England PR, Luikart G, Ritchie PA, Ryman N (2008) Genetic effects of harvest on wild animal populations. Trends in Ecology & Evolution 23(6), 327-337.
| Crossref | Google Scholar | PubMed |
Arlyza IS, Shen K-N, Durand J-D, Borsa P (2013) Mitochondrial haplotypes indicate parapatric-like phylogeographic structure in blue-spotted maskray (Neotrygon kuhlii) from the Coral Triangle region. Journal of Heredity 104(5), 725-733.
| Crossref | Google Scholar | PubMed |
Beheregaray LB (2008) Twenty years of phylogeography: the state of the field and the challenges for the Southern Hemisphere. Molecular Ecology 17(17), 3754-3774.
| Crossref | Google Scholar | PubMed |
Belkhir K (1999) GENETIX, logiciel sous WindowsTM pour la génétique des populations. Available at http://www.univmontp2.fr/~genetix
Borsa P, Arlyza IS, Laporte M, Berrebi P (2012) Population genetic structure of blue-spotted maskray Neotrygon kuhlii and two other Indo-West Pacific stingray species (Myliobatiformes: Dasyatidae), inferred from size-polymorphic intron markers. Journal of Experimental Marine Biology and Ecology 438, 32-40.
| Crossref | Google Scholar |
Bradley D, Conklin E, Papastamatiou YP, McCauley DJ, Pollock K, Kendall BE, Gaines SD, Caselle JE (2017) Growth and life history variability of the grey reef shark (Carcharhinus amblyrhynchos) across its range. PLoS ONE 12(2), e0172370.
| Crossref | Google Scholar |
Carson AR, Smith EN, Matsui H, Brækkan SK, Jepsen K, Hansen J-B, Frazer KA (2014) Effective filtering strategies to improve data quality from population-based whole exome sequencing studies. BMC Bioinformatics 15(1), 125.
| Crossref | Google Scholar |
Chapman DD, Feldheim KA, Papastamatiou YP, Hueter RE (2015) There and back again: a review of residency and return migrations in sharks, with implications for population structure and management. Annual Review of Marine Science 7, 547-570.
| Crossref | Google Scholar | PubMed |
Chevolot M, Hoarau G, Rijnsdorp AD, Stam WT, Olsen JL (2006) Phylogeography and population structure of thornback rays (Raja clavata L., Rajidae). Molecular Ecology 15(12), 3693-3705.
| Crossref | Google Scholar | PubMed |
Connell J (2021) COVID-19 and tourism in Pacific SIDS: lessons from Fiji, Vanuatu and Samoa? The Round Table 110(1), 149-158.
| Crossref | Google Scholar |
Cortés E (2000) Life history patterns and correlations in sharks. Reviews in Fisheries Science 8(4), 299-344.
| Crossref | Google Scholar |
Davila F, Bourke RM, McWilliam A, Crimp S, Robins L, Van Wensveen M, Alders RG, Butler JRA (2021) COVID-19 and food systems in Pacific Island Countries, Papua New Guinea, and Timor-Leste: opportunities for actions towards the sustainable development goals. Agricultural Systems 191, 103137.
| Crossref | Google Scholar |
Devloo-Delva F, Maes GE, Hernández SI, Mcallister JD, Gunasekera RM, Grewe PM, Thomson RB, Feutry P (2019) Accounting for kin sampling reveals genetic connectivity in Tasmanian and New Zealand school sharks, Galeorhinus galeus. Ecology and Evolution 9(8), 4465-4472.
| Crossref | Google Scholar | PubMed |
Devloo-Delva F, Burridge CP, Kyne PM, Brunnschweiler JM, Chapman DD, Charvet P, Chen X, Cliff G, Daly R, Drymon JM, Espinoza M, Fernando D, Barcia LG, Glaus K, González-Garza BI, Grant MI, Gunasekera RM, Hernandez S, Hyodo S, Jabado RW, Jaquemet S, Johnson G, Ketchum JT, Magalon H, Marthick JR, Mollen FH, Mona S, Naylor GJP, Nevill JEG, Phillips NM, Pillans RD, Postaire BD, Smoothey AF, Tachihara K, Tillet BJ, Valerio-Vargas JA, Feutry P (2023) From rivers to ocean basins: the role of ocean barriers and philopatry in the genetic structuring of a cosmopolitan coastal predator. Ecology and Evolution 13(2), e9837.
| Crossref | Google Scholar |
DiBattista JD (2008) Patterns of genetic variation in anthropogenically impacted populations. Conservation Genetics 9, 141-156.
| Crossref | Google Scholar |
Domingues RR, Hilsdorf AWS, Gadig OBF (2018) The importance of considering genetic diversity in shark and ray conservation policies. Conservation Genetics 19, 501-525.
| Crossref | Google Scholar |
Dudgeon CL, Blower DC, Broderick D, Giles JL, Holmes BJ, Kashiwagi T, Krück NC, Morgan JAT, Tillett BJ, Ovenden JR (2012) A review of the application of molecular genetics for fisheries management and conservation of sharks and rays. Journal of Fish Biology 80(5), 1789-1843.
| Crossref | Google Scholar | PubMed |
Dulvy NK, Pacoureau N, Rigby CL, Pollom RA, Jabado RW, Ebert DA, Finucci B, Pollock CM, Cheok J, Derrick DH, Herman KB, Sherman CS, VanderWright WJ, Lawson JM, Walls RHL, Carlson JK, Charvet P, Bineesh KK, Fernando D, Ralph GM, Matsushiba JH, Hilton-Taylor C, Fordham SV, Simpfendorfer CA (2021) Overfishing drives over one-third of all sharks and rays toward a global extinction crisis. Current Biology 31(21), 4773-4787.e8.
| Crossref | Google Scholar | PubMed |
Evanno G, Regnaut S, Goudet J (2005) Detecting the number of clusters of individuals using the software STRUCTURE: a simulation study. Molecular Ecology 14(8), 2611-2620.
| Crossref | Google Scholar | PubMed |
Excoffier L, Lischer HEL (2010) Arlequin suite ver 3.5: a new series of programs to perform population genetics analyses under Linux and Windows. Molecular Ecology Resources 10(3), 564-567.
| Crossref | Google Scholar | PubMed |
Falush D, Stephens M, Pritchard JK (2003) Inference of population structure using multilocus genotype data: linked loci and correlated allele frequencies. Genetics 164(4), 1567-1587.
| Crossref | Google Scholar | PubMed |
Feldheim KA, Gruber SH, Ashley MV (2001) Population genetic structure of the lemon shark (Negaprion brevirostris) in the western Atlantic: DNA microsatellite variation. Molecular Ecology 10(2), 295-303.
| Crossref | Google Scholar | PubMed |
Ferretti F, White WT (2015) Neotrygon ningalooensis. The IUCN Red List of Threatened Species 2015: e.T195463A68636829. Available at https://dx.doi.org/10.2305/IUCN.UK.2015-4.RLTS.T195463A68636829.en [accessed 30 August 2024]
Finucci B, White WT, Kemper JM, Naylor GJP (2018) Redescription of Chimaera ogilbyi (Chimaeriformes; Chimaeridae) from the Indo-Australian region. Zootaxa 4375(2), 191-210.
| Crossref | Google Scholar | PubMed |
Foll M (2012) BayeScan v2. 1 user manual. Ecology 20(10), 1450-1462.
| Google Scholar |
Foll M, Gaggiotti O (2008) A genome-scan method to identify selected loci appropriate for both dominant and codominant markers: a Bayesian perspective. Genetics 180(2), 977-993.
| Crossref | Google Scholar | PubMed |
Frankham R (2003) Genetics and conservation biology. Comptes Rendus. Biologies 326, 22-29.
| Crossref | Google Scholar |
Glaus K, Appleyard S (2024) Genetic diversity, kinship, and polychromatism in the spotted eagle ray Aetobatus ocellatus of Fiji. Diversity in press.
| Google Scholar |
Glaus KBJ, Appleyard SA, Stockwell B, Brunnschweiler JM, Shivji M, Clua E, Marie AD, Rico C (2020) Insights into insular isolation of the Bull Shark, Carcharhinus leucas (Müller and Henle, 1839), in Fijian Waters. Frontiers in Marine Science 7, 586015.
| Crossref | Google Scholar |
Glaus K, Savou R, Brunnschweiler JM (2024a) Characteristics of Fiji’s small-scale ray fishery and its relevance to food security. Marine Policy 163, 106082.
| Crossref | Google Scholar |
Glaus K, Gordon L, Vierus T, Marosi ND, Sykes H (2024b) Rays in the shadows: batoid diversity, occurrence, and conservation status in Fiji. Biology 13(2), 73.
| Crossref | Google Scholar |
Hasegawa M, Kishino H, Yano T-A (1985) Dating of the human-ape splitting by a molecular clock of mitochondrial DNA. Journal of Molecular Evolution 22, 160-174.
| Crossref | Google Scholar | PubMed |
Hata E, Motomura H (2024) Neotrygon yakkoei, a new bluespotted maskray (Dasyatidae) from Japan. Ichthyological Research
| Crossref | Google Scholar |
Hedgecock D (1994) Temporal and spatial genetic structure of marine animal populations in the California Current. California Cooperative Oceanic Fisheries Investigations Reports 35, 73-81.
| Google Scholar |
Hernández S, Daley R, Walker T, Braccini M, Varela A, Francis MP, Ritchie PA (2015) Demographic history and the South Pacific dispersal barrier for school shark (Galeorhinus galeus) inferred by mitochondrial DNA and microsatellite DNA mark. Fisheries Research 167, 132-142.
| Crossref | Google Scholar |
Heupel MR, Carlson JK, Simpfendorfer CA (2007) Shark nursery areas: concepts, definition, characterization and assumptions. Marine Ecology Progress Series 337, 287-297.
| Crossref | Google Scholar |
Hirschfeld M, Dudgeon C, Sheaves M, Barnett A (2021) Barriers in a sea of elasmobranchs: from fishing for populations to testing hypotheses in population genetics. Global Ecology and Biogeography 30(11), 2147-2163.
| Crossref | Google Scholar |
Hubisz MJ, Falush D, Stephens M, Pritchard JK (2009) Inferring weak population structure with the assistance of sample group information. Molecular Ecology Resources 9(5), 1322-1332.
| Crossref | Google Scholar | PubMed |
Jabado RW, Kyne PM, Pollom RA, Ebert DA, Simpfendorfer CA, Ralph GM, Al Dhaheri SS, Akhilesh KV, Ali K, Ali MH, Al Mamari TMS, Bineesh KK, El Hassan IS, Fernando D, Grandcourt EM, Khan MM, Moore ABM, Owfi F, Robinson DP, Romanov E, Soares A-L, Spaet JLY, Tesfamichael D, Valinassab T, Dulvy NK (2018) Troubled waters: threats and extinction risk of the sharks, rays and chimaeras of the Arabian Sea and adjacent waters. Fish and Fisheries 19(6), 1043-1062.
| Crossref | Google Scholar |
Jacobsen IP, Bennett MB (2010) Age and growth of Neotrygon picta, Neotrygon annotata and Neotrygon kuhlii from north-east Australia, with notes on their reproductive biology. Journal of Fish Biology 77(10), 2405-2422.
| Crossref | Google Scholar |
Jacobsen IP, Kyne PM, Last PR (2015) Neotrygon annotata. The IUCN Red List of Threatened Species 2015: e.T60150A68636040. Available at https://dx.doi.org/10.2305/IUCN.UK.2015-4.RLTS.T60150A68636040.en. [accessed 30 August 2024]
Jombart T (2008) adegenet: a R package for the multivariate analysis of genetic markers. Bioinformatics 24(11), 1403-1405.
| Crossref | Google Scholar | PubMed |
Jombart T, Ahmed I (2011) adegenet 1.3-1: new tools for the analysis of genome-wide SNP data. Bioinformatics 27(21), 3070-3071.
| Crossref | Google Scholar | PubMed |
Jones OR, Wang J (2010) COLONY: a program for parentage and sibship inference from multilocus genotype data. Molecular Ecology Resources 10(3), 551-555.
| Crossref | Google Scholar | PubMed |
Kalinowski ST, Wagner AP, Taper ML (2006) ML-RELATE: a computer program for maximum likelihood estimation of relatedness and relationship. Molecular Ecology Notes 6(2), 576-579.
| Crossref | Google Scholar |
Klimley AP (1987) The determinants of sexual segregation in the scalloped hammerhead shark, Sphyrna lewini. Environmental Biology of Fishes 18, 27-40.
| Crossref | Google Scholar |
Kopelman NM, Mayzel J, Jakobsson M, Rosenberg NA, Mayrose I (2015) CLUMPAK: a program for identifying clustering modes and packaging population structure inferences across K. Molecular Ecology Resources 15(5), 1179-1191.
| Crossref | Google Scholar | PubMed |
Kornfield I, Sidell BD, Gagnon PS (1982) Stock definition in Atlantic herring (Clupea harengus harengus): genetic evidence for discrete fall and spring spawning populations. Canadian Journal of Fisheries and Aquatic Sciences 39(12), 1610-1621.
| Crossref | Google Scholar |
Kuguru G, Gennari E, Wintner S, Dicken ML, Klein JD, Rhode C, Bester-van der Merwe AE (2019) Spatio-temporal genetic variation of juvenile smooth hammerhead sharks in South Africa. Marine Biology Research 15(10), 568-579.
| Crossref | Google Scholar |
Kumar S, Stecher G, Li M, Knyaz C, Tamura K (2018) MEGA X: molecular evolutionary genetics analysis across computing platforms. Molecular Biology and Evolution 35(6), 1547-1549.
| Crossref | Google Scholar | PubMed |
Kyne PM, Finucci B (2018) Neotrygon kuhlii. The IUCN Red List of Threatened Species 2018: e.T116847578A116849874. Available at https://dx.doi.org/10.2305/IUCN.UK.2018-2.RLTS.T116847578A116849874.en [accessed 30 August 2024]
Lacson JM, Morizot DC (1991) Temporal genetic variation in subpopulations of bicolor damselfish (Stegastes partitus) inhabiting coral reefs in the Florida Keys. Marine Biology 110, 353-357.
| Crossref | Google Scholar |
Last PR, Naylor GJP, Manjaji-Matsumoto BM (2016b) A revised classification of the family Dasyatidae (Chondrichthyes: Myliobatiformes) based on new morphological and molecular insights. Zootaxa 4139(3), 345-368.
| Crossref | Google Scholar | PubMed |
Last PR, White WT, Seret B (2016c) Taxonomic status of maskrays of the Neotrygon kuhlii species complex (Myliobatoidei: Dasyatidae) with the description of three new species from the Indo-West Pacific. Zootaxa 4083(4), 533-561.
| Crossref | Google Scholar | PubMed |
Le Port A, Lavery S (2012) Population structure and phylogeography of the short-tailed stingray, Dasyatis brevicaudata (Hutton 1875), in the Southern Hemisphere. Journal of Heredity 103(2), 174-185.
| Crossref | Google Scholar | PubMed |
Lieber L, Hall G, Hall J, Berrow S, Johnston E, Gubili C, Sarginson J, Francis M, Duffy C, Wintner SP, Doherty PD, Godley BJ, Hawkes LA, Witt MJ, Henderson SM, de Sabata E, Shivji MS, Dawson DA, Sims DW, Jones CS, Noble LR (2020) Spatio-temporal genetic tagging of a cosmopolitan planktivorous shark provides insight to gene flow, temporal variation and site-specific re-encounters. Scientific Reports 10(1), 1661.
| Crossref | Google Scholar |
Liu SYV, Chen Y-Y, Cheng C (2023) Genetic structure and relatedness of juvenile sicklefin lemon shark (Negaprion acutidens) at Dongsha Island. Scientific Reports 13(1), 988.
| Crossref | Google Scholar |
Lotterhos KE, Whitlock MC (2014) Evaluation of demographic history and neutral parameterization on the performance of FST outlier tests. Molecular Ecology 23(9), 2178-2192.
| Crossref | Google Scholar | PubMed |
Marie AD, Herbinger C, Fullsack P, Rico C (2019) First reconstruction of kinship in a scalloped hammerhead shark aggregation reveals the mating patterns and breeding sex ratio. Frontiers in Marine Science 6, 676.
| Crossref | Google Scholar |
Martin AP, Naylor GJP, Palumbi SR (1992) Rates of mitochondrial DNA evolution in sharks are slow compared with mammals. Nature 357(6374), 153-155.
| Crossref | Google Scholar | PubMed |
Momigliano P, Harcourt R, Robbins WD, Jaiteh V, Mahardika GN, Sembiring A, Stow A (2017) Genetic structure and signatures of selection in grey reef sharks (Carcharhinus amblyrhynchos). Heredity 119(3), 142-153.
| Crossref | Google Scholar | PubMed |
Naylor GJP, Caira JN, Jensen K, Rosana KAM, White WT, Last PR (2012) A DNA sequence–based approach to the identification of shark and ray species and its implications for global elasmobranch diversity and parasitology. Bulletin of the American Museum of Natural History 2012(367), 1-262.
| Crossref | Google Scholar |
Osgood GJ, White ER, Baum JK (2021) Effects of climate-change-driven gradual and acute temperature changes on shark and ray species. Journal of Animal Ecology 90(11), 2547-2559.
| Crossref | Google Scholar | PubMed |
Pauly D, Christensen V, Dalsgaard J, Froese R, Torres F, Jr. (1998) Fishing down marine food webs. Science 279(5352), 860-863.
| Crossref | Google Scholar | PubMed |
Pazmiño DA, Maes GE, Simpfendorfer CA, Salinas-de-León P, van Herwerden L (2017) Genome-wide SNPs reveal low effective population size within confined management units of the highly vagile Galapagos shark (Carcharhinus galapagensis). Conservation Genetics 18, 1151-1163.
| Crossref | Google Scholar |
Pierce SJ, Bennett MB (2009) Validated annual band-pair periodicity and growth parameters of blue-spotted maskray Neotrygon kuhlii from south-east Queensland, Australia. Journal of Fish Biology 75(10), 2490-2508.
| Crossref | Google Scholar | PubMed |
Pierce SJ, Kyne PM (2015) Neotrygon leylandi. The IUCN Red List of Threatened Species 2015: e.T60156A68636690. Available at https://dx.doi.org/10.2305/IUCN.UK.2015-4.RLTS.T60156A68636690.en [accessed 30 August 2024]
Pierce SJ, Pardo SA, Bennett MB (2009) Reproduction of the blue-spotted maskray Neotrygon kuhlii (Myliobatoidei: Dasyatidae) in south-east Queensland, Australia. Journal of Fish Biology 74(6), 1291-1308.
| Crossref | Google Scholar | PubMed |
Pierce SJ, White WT, Jacobsen IP, Barratt PJ, Last PR, Kyne PM (2015) Neotrygon picta. The IUCN Red List of Threatened Species 2015: e.T195464A68636975. Available at https://dx.doi.org/10.2305/IUCN.UK.2015-4.RLTS.T195464A68636975.en. [accessed 31 August 2024]
Plank SM, Lowe CG, Feldheim KA, Wilson RR, Jr, Brusslan JA (2010) Population genetic structure of the round stingray Urobatis halleri (Elasmobranchii: Rajiformes) in southern California and the Gulf of California. Journal of Fish Biology 77(2), 329-340.
| Crossref | Google Scholar | PubMed |
Postaire BD, Devloo-Delva F, Brunnschweiler JM, Charvet P, Chen X, Cliff G, Daly R, Drymon JM, Espinoza M, Fernando D, Glaus K, Grant MI, Hernandez S, Hyodo S, Jabado RW, Jaquemet S, Johnson G, Naylor GJP, Nevill JEG, Pathirana BM, Pillans RD, Smoothey AF, Tachihara K, Tillet BJ, Valerio-Vargas JA, Lesturgie P, Magalon H, Feutry P, Mona S (2024) Global genetic diversity and historical demography of the Bull Shark. Journal of Biogeography 51, 632-648.
| Crossref | Google Scholar |
Pritchard JK, Stephens M, Donnelly P (2000) Inference of population structure using multilocus genotype data. Genetics 155(2), 945-959.
| Crossref | Google Scholar | PubMed |
Puckridge M, Last PR, White WT, Andreakis N (2013) Phylogeography of the Indo-West Pacific maskrays (Dasyatidae, Neotrygon): a complex example of chondrichthyan radiation in the Cenozoic. Ecology and Evolution 3(2), 217-232.
| Crossref | Google Scholar | PubMed |
Puechmaille SJ (2016) The program structure does not reliably recover the correct population structure when sampling is uneven: subsampling and new estimators alleviate the problem. Molecular Ecology Resources 16(3), 608-627.
| Crossref | Google Scholar | PubMed |
Ratnasingham S, Hebert PDN (2007) BOLD: the barcode of life data system (http://www.barcodinglife.org). Molecular Ecology Notes 7(3), 355-364.
| Crossref | Google Scholar | PubMed |
Reynolds J, Weir BS, Cockerham CC (1983) Estimation of the coancestry coefficient: basis for a short-term genetic distance. Genetics 105(3), 767-779.
| Crossref | Google Scholar | PubMed |
Rosenberg NA (2004) DISTRUCT: a program for the graphical display of population structure. Molecular Ecology Notes 4(1), 137-138.
| Crossref | Google Scholar |
Rus Hoelzel A, Shivji MS, Magnussen J, Francis MP (2006) Low worldwide genetic diversity in the basking shark (Cetorhinus maximus). Biology Letters 2(4), 639-642.
| Crossref | Google Scholar |
Schluessel V, Broderick D, Collin SP, Ovenden JR (2010) Evidence for extensive population structure in the white-spotted eagle ray within the Indo-Pacific inferred from mitochondrial gene sequences. Journal of Zoology 281(1), 46-55.
| Crossref | Google Scholar |
Sherman CS, Bin Ali A, Bineesh KK, Derrick D, Dharmadi, Fahmi, Fernando D, Haque AB, Maung A, Seyha L, Tanay D, Utzurrum JAT, Vo VQ, Yuneni RR (2021a) Neotrygon caeruleopunctata. The IUCN Red List of Threatened Species 2021: e.T104166988A175220257. Available at https://dx.doi.org/10.2305/IUCN.UK.2021-2.RLTS.T104166988A175220257.en [accessed 30 August 2024]
Sherman CS, Rigby CL, Derrick D (2021b) Neotrygon trigonoides. The IUCN Red List of Threatened Species 2021: e.T104167060A104167071. Available at https://dx.doi.org/10.2305/IUCN.UK.2021-2.RLTS.T104167060A104167071.en [accessed 31 August 2024]
Sherman CS, Rigby CL, Derrick D (2021c) Neotrygon australiae. The IUCN Red List of Threatened Species 2021: e.T104166970A104166982. Available at https://dx.doi.org/10.2305/IUCN.UK.2021-2.RLTS.T104166970A104166982.en. [accessed 30 August 2024]
Sherman CS, Bin Ali A, Bineesh KK, Derrick D, Dharmadi, Fahmi, Fernando D, Haque AB, Maung A, Seyha L, Tanay D, Utzurrum JAT, Vo VQ, Yuneni RR (2022a) Neotrygon orientalis (amended version of 2021 assessment). The IUCN Red List of Threatened Species 2022: e.T104167028A212575008. Available at https://dx.doi.org/10.2305/IUCN.UK.2022-1.RLTS.T104167028A212575008.en. [accessed 30 August 2024]
Sherman CS, Bin Ali A, Bineesh KK, Derrick D, Dharmadi, Fahmi, Fernando D, Haque AB, Maung A, Seyha L, Tanay D, Utzurrum JAT, Vo VQ, Yuneni RR (2022b) Neotrygon varidens (amended version of 2021 assessment). The IUCN Red List of Threatened Species 2022: e.T104167083A212575659. Available at https://dx.doi.org/10.2305/IUCN.UK.2022-1.RLTS.T104167083A212575659.en. [accessed 31 August 2024]
Tukana M, Prince J, Glaus KBJ, Marama K, Whippy-Morris C (2023) A baseline study of Fiji’s small-scale lobster fishery using value chain analysis and size at maturity thresholds. Marine Policy 149, 105513.
| Crossref | Google Scholar |
Waples RS, Punt AE, Cope JM (2008) Integrating genetic data into management of marine resources: how can we do it better? Fish and Fisheries 9(4), 423-449.
| Crossref | Google Scholar |
Ward RD, Zemlak TS, Innes BH, Last PR, Hebert PDN (2005) DNA barcoding Australia’s fish species. Philosophical Transactions of the Royal Society B: Biological Sciences 360(1462), 1847-1857.
| Crossref | Google Scholar |
Ward RD, Holmes BH, White WT, Last PR (2008) DNA barcoding Australasian chondrichthyans: results and potential uses in conservation. Marine and Freshwater Research 59(1), 57-71.
| Crossref | Google Scholar |
West RM (2021) Best practice in statistics: use the Welch t-test when testing the difference between two groups. Annals of Clinical Biochemistry: International Journal of Laboratory Medicine 58(4), 267-269.
| Crossref | Google Scholar | PubMed |
Wickham H, Averick M, Bryan J, Chang W, McGowan LDA, François R, Grolemund G, Hayes A, Henry L, Hester J, Kuhn M, Pedersen TL, Miller E, Bache SM, Muller K, Ooms J, Robinson D, Seidel DP, Spinu V, Takahashi K, Vaughan D, Wilke C, Woo K, Yutani H (2019) Welcome to the Tidyverse. Journal of Open Source Software 4(43), 1686.
| Crossref | Google Scholar |