

An extreme bushfire smoke pollution event: health impacts and public health challenges
Anthony Kolbe A and Kim L. Gilchrist A BA Population Health, Greater Southern Area Health Service
B Corresponding author. Email: kim.gilchrist@gsahs.health.nsw.gov.au
NSW Public Health Bulletin 20(2) 19-23 https://doi.org/10.1071/NB08061
Published: 25 February 2009
Abstract
Aims: To determine the health impacts of smoke and the effectiveness of public health advisories during a severe bushfire smoke event in Albury, NSW. Methods: The NSW Department of Environment and Climate Change provided PM10 data. A computer-assisted telephone survey using random digit dialling was conducted following the smoke event to assess health impacts and the effectiveness of advisories. Results: The smoke event lasted 38 days. The maximum daily PM10 level was 415 μg/m3. Public health advisories were based on alerts for air pollution issued by NSW Department of Health. From the survey, a total of 389 interviews were available for analysis. At least one health effect of the smoke was reported by 70% of respondents and 5% reported seeking medical treatment. Over 74% reported seeing, hearing or reading the health advisories. Behaviour change was significantly greater in this group (odds ratio = 2.74; 95% confidence interval 1.50–5.02). Conclusion: High rates of health effects may be experienced by populations exposed to bushfire smoke pollution. Public health advisories can support behaviour change to reduce exposure to bushfire smoke.
Smoke pollution from bushfires is associated with respiratory effects and the toxicity of particulate matter sourced from bushfires is similar to that originating from urban sources.1 An increase in the frequency of very high and extreme fire danger days in south-eastern Australia is predicted with climate change.2 Health impacts due to bushfire smoke pollution may also increase.
In early 2003, smoke from bushfires blanketed north-eastern Victoria and southern New South Wales (NSW). Smoke pollution was present continuously in the city of Albury, NSW for 38 days and in late January and early February extreme levels were experienced. Studies examining the health impact of severe bushfire smoke pollution in a community setting are limited in Australia and studies on presentations at emergency departments during smoke events have produced inconsistent results.3–5 Low level particulate pollution arising from vegetation burning in Australia has been associated with asthma symptoms and medication use.6
This paper describes a bushfire smoke event, the role of public health during the event and a survey conducted to determine the health impacts of the smoke and the effectiveness of public health advisories, which were published through the mainstream news media.
Materials and methods
To inform public health advisories, draft health alerts for air pollution from the NSW Department of Health and air quality data (PM10) provided by the NSW Department of Environment and Climate Change (DECC) were used. A community survey was conducted shortly after the pollution abated using a computer-assisted telephone interview (CATI) technique and random digit dialling. The event was defined as the 38-day period from when the daily PM10 result for the Albury Local Government Area (LGA) first exceeded 50 μg/m3 to when daily results were consistently below this level.
Air quality measurement
DECC operates an air quality monitoring site in Albury using a tapered element oscillating microbalance (TEOM), which provides a measure of particulate concentration by calculating the change in mass of a filter, detected by the alteration in the oscillation rate of the collection tube. The TEOM was set to provide a measure of particulate matter with an equivalent aerodynamic diameter of 10 μm or less (PM10). The daily PM10 result was calculated as the arithmetic mean of the 24 1-hour averages and was provided by DECC the following day. For calculation of the daily average at least 75% of the hourly averages must be available.
Survey methodology
The survey questionnaire was developed in consultation with the NSW Department of Health and interviews were undertaken by the Department’s CATI team. A pilot survey of 12 respondents was conducted. The common responses to the open ended questions of the pilot survey were used to identify the categories for responses in the main survey with allowance for other responses. Telephone numbers were selected randomly from a bank of numbers for the Albury LGA. Once the household was contacted the respondent was randomly selected from all household members. Respondents who did not speak English were excluded from the survey. (Census 2001 reported 0.3% of Albury LGA could not speak English well or not at all.7) Informed consent was obtained at the start of the interview. Information on pre-existing health conditions, as diagnosed by a medical practitioner, was self-reported. People aged 16 years and above were questioned. Where the selected household respondent was less than 16 years of age, a parent or carer was asked to complete the survey on the child’s behalf. The survey was conducted over a 2-week period in late February and early March 2003. The responses were weighted according to the December 2002 Estimated Resident Population for the Albury LGA and data were analysed using SAS Version 9.1. Ethical approval for the study was obtained through the Greater Murray Area Health Service Human Research Ethics Committee.
Results
Air quality results
NSW Health has adopted an air quality categorisation system developed by DECC for public health advice on air pollution.8 The DECC system reports air quality using a derived value called the air quality index (AQI).9 The maximum daily PM10 result during the bushfire smoke event was 415 μg/m3 (Figure 1), equivalent to an AQI of 830. The same day, the maximum hourly result of 938 μg/m3 was recorded. On 3 days, the average daily PM10 result was not able to be calculated as the monitoring device was rendered inoperable by the high pollution levels. For these 3 days, hourly results were possible for 13, 10 and 11 readings respectively. Using these readings, the average daily results for 20, 23 and 24 January 2003 were 263, 702 and 140 μg/m3 respectively. Based on the AQI categorisation and using the results from the complete daily averages and the three incomplete days, the air quality during the 38-day period, consisted of 15 days considered as ‘hazardous’, 6 days as ‘very poor’, 7 days as ‘poor’ and 9 as ‘fair’.

|
Public health advisories
Advisories were published through the mainstream news media and, initially, targeted people with existing cardiovascular or respiratory disease, elderly people and children. As the pollution worsened and reached levels considered very poor or hazardous, the advisories were directed at the whole community. Early advisories stated that at-risk individuals should avoid strenuous outdoor exercise, take their medication as prescribed, follow established action plans and seek medical attention if they experienced asthma, chest pain or shortness of breath. As the pollution worsened, the general public was advised to reduce the level of outdoor activity and, as hazardous levels were recorded, to stay indoors as much as possible. A fact sheet was prepared and sent to all general practitioners and hospitals in the affected area. Similar information was provided to all aged-care facilities, child-care facilities and, through the NSW Department of Education and Training, to schools. The local public health unit received enquiries during this period from schools, businesses, organisations and individuals seeking advice regarding outdoor events.
When PM10 results far exceeded the highest level of the health alerts, further action was considered. The use of clean air respite facilities was considered and a trial clean air room using air cleaning devices was established at Albury Base Hospital. The availability and cost of air cleaning devices was investigated.
Local supplies of disposable respiratory masks were identified and monitored. The use of masks was included in the public health advisories although, due to time constraints, information was not provided on the methods for fit testing. Consideration was given to the need for selected or mass evacuation and discussions were held with the local emergency management committee; however, public health surveillance did not support the need for mass evacuation.
Survey results
A total of 1463 calls were made to achieve 415 interviews. There were 97 refusals including both household and respondent refusals, giving a response rate of 81.1%. Twenty-six responses were excluded from the analysis because the selected respondent was not in Albury at the time of the bushfire smoke pollution, giving a final total of 389 interviews.
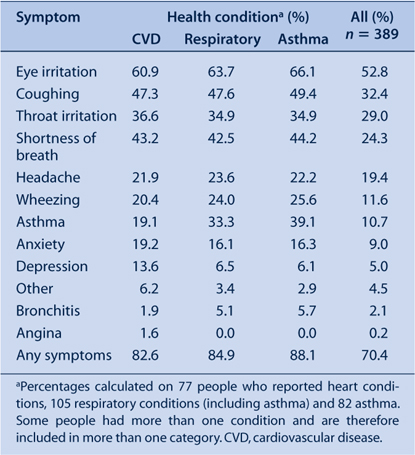
Of the people surveyed, 70% reported at least one health effect due to the smoke, equating to approximately 30 500 people in the Albury LGA. People reporting underlying health conditions such as cardiovascular or respiratory disease had higher rates of health effects with the highest rate in people reporting asthma (Table 1). 5% of respondents reported seeking medical attention because of the smoke.
|
People in the 40–74 years age group reported higher rates of health effects (Table 2). Over 74% of people surveyed reported that they were aware of the health advisories with television being the most likely source. Across most age groups, there were similar rates for people having seen, heard or read the public health advisories, although a lower rate in the over 75-years age group was reported (Table 2).

|
Of the people who reported being aware of the advisories, 53.5% stated that the main message was to remain indoors with a further 24.5% reporting that the advisories suggested reducing or avoiding outdoor activity. When asked who the advisories were aimed at, 65.5% of people reported “the whole community” or similar while 31.9% reported “people with respiratory problems” (multiple responses allowed).
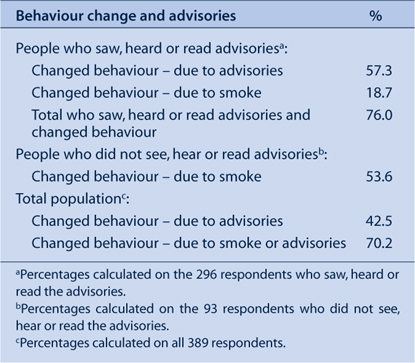
Over 70% of people surveyed reported changing behaviour during the smoke event. People who saw, heard or read the advisories were significantly more likely to report behaviour change than those who did not (odds ratio (OR) = 2.74; 95% confidence interval (CI) 1.50–5.02) (Table 3). The highest rate of behaviour change was reported by parents of children less than 16 years of age.
|
Most people who reported behaviour change stated that they either stayed inside, reduced outdoor activity or prevented smoke getting into homes (Table 4). Similar responses were found regardless of reported awareness of advisories. Over 14% of respondents reported leaving the area during the smoke event.

|
Discussion
This study demonstrates the widespread impact of an extreme bushfire smoke pollution event on a community. The symptoms reported by the respondents are consistent with other studies, as is the finding of increased reported symptom rates in those with existing cardiovascular and respiratory conditions.10–13 Public health advisories disseminated through mainstream media supported behaviour change to reduce exposure to bushfire smoke. These findings are also consistent with other studies.12,13
The survey of Albury residents was completed within 3 weeks of the particulate levels returning to normal. The timeliness of the survey should have served to minimise the possibility of recall bias. Due to extensive smoke pollution in southern NSW, it was assumed that the Albury LGA (an area of 106 sq km at the time) experienced uniform levels of pollution.
Public health advisories stated that symptoms related to smoke exposure included sore and itchy eyes, headache and sore throat, which may have served to influence the recall of symptoms reported. In interpreting the results of this survey, caution is appropriate since symptoms, exposures and behaviours were self-reported.
Despite the extreme pollution levels and the high proportion of residents experiencing symptoms, a small proportion of respondents reported seeking treatment for symptoms associated with the smoke pollution. Mott et al. reported that medical clinic visits for respiratory illness increased by 52% during a bushfire smoke pollution event lasting 70 days with PM10 levels exceeding 500 μg/m3 on 2 days.12
The relatively simple mitigation measures of remaining indoors and reducing outdoor physical activity achieved high recall rates and represented the main reported behaviour changes. Fine particles can penetrate houses, with the extent of indoor pollution dependent on the air exchange rate. Penetration of particles into houses can be reduced by keeping doors and windows closed and using air conditioners with efficient filters.14
The benefit of masks in mitigating the effect of smoke pollution remains uncertain. Kunzli et al. reported that wearing masks during a smoke pollution event had a beneficial effect.13 Mask use was reported to be ineffective and positively associated with outdoor exposure by Mott et al. who suggested that inconsistent use of masks and lack of appropriate fit testing as well as the variability in the effectiveness of masks chosen for use, may have been contributing factors to mask failure.12
The issuing of health advisories based on alert guidelines during bushfire smoke pollution events has a number of limitations. First, the daily average PM10 result relates to the previous 24-hour period, not the current situation. Second, during the event in Albury, conditions changed rapidly depending on the prevailing winds. For example on one day, the hourly average PM10 result was 57 μg/m3 at 7 am, 320 μg/m3 at 9 am and 780 μg/m3 at 11 am. Framing advisory information according to the categories was useful as pollution was increasing; however, when extreme pollution levels were reached and conditions changed quickly, the categories were irrelevant. Based on World Health Organization guidelines, public health staff undertook a rapid correlation of hourly PM10 results with visibility of known markers.14 Further research is required to examine the validity and utility of visibility estimates in supporting public health advisories on bushfire smoke pollution.
Acknowledgments
The authors acknowledge the funding provided through the Environmental Health Branch of the NSW Department of Health for the CATI survey and Dr Vicky Sheppeard and Ms Margo Barr for their assistance with the survey. The authors acknowledge the NSW Department of Environment and Climate Change for the provision of air quality data.
[1] Naeher LP, Brauer M, Lipsett M, Zelikoff JT, Simpson CD, Koenig JQ, et al. Woodsmoke Health Effects: A Review. Inhal Toxicol 2007; 19 67–106.
| Crossref | GoogleScholarGoogle Scholar | PubMed | CAS | (Cited 7 July 2008.)
[3] Churches T, Corbett S. Asthma and air pollution in Sydney. N S W Public Health Bull 1991; 2 72–3.
| Crossref | GoogleScholarGoogle Scholar | (Cited 7 July 2008.)
[9]
[10] Long W, Tate RB, Neuman M, Manfreda J, Becker AB, Anthonisen NR. Respiratory symptoms in a susceptible population due to burning of agricultural residue. Chest 1998; 113 351–7.
| Crossref | GoogleScholarGoogle Scholar | PubMed | CAS | (Cited 7 July 2008.)