

Managing biological, economic and social trade-offs in the Australian Southern and Eastern Scalefish and Shark Fishery
Florence Briton A B C , Olivier Thébaud A , Claire Macher A , Caleb Gardner D and Lorne Richard Little E *
E *
A
B
C
D
E
Abstract
Maximum sustainable yield and maximum economic yield are often advocated as desirable biological and economic objectives for fisheries management, and the analysis of trade-offs associated is often absent from scientific advice.
This work aims to demonstrate an operational approach for comparing trade-offs of not only biological, and economic objectives, but also social objectives, in this case for maintaining affordable fish prices for the Australian public.
We use a simulation model of the multi-species, the Australian Southern and Eastern Scalefish and Shark Fishery, characterised by technical and economic interactions among harvested stocks, and apply an eco-viability approach to identify catch limits on two key species of the fishery (tiger flathead and pink ling).
Several trade-offs are highlighted related to the distribution of benefits among vessel owners, fishing crews and consumers. Maximising the economic returns to vessel owners, which is the current management objective of the fishery, correspondingly reduces social benefits of providing employment as fishing crews and raises consumer prices.
Maximising fishery profits as a management objective comes at a social cost for crew members and fish consumers.
Analysing trade-offs with an eco-viability approach helps inform decisions regarding fisheries management, fully accounting for the different dimensions of biological, economic and social sustainability.
Keywords: eco-viability analysis, fisheries management, metiers, mixed fisheries, multi-species fisheries, SESSF, simulation modelling, technical interactions, trade-off evaluation.
Introduction
Since the Reykjavik Conference on Responsible Fisheries in the Marine Ecosystem in 2001, ecosystem-based fisheries management (EBFM) has been adopted in principle by many jurisdictions worldwide as the new standard for managing fisheries. EBFM recognises that harvested fish stocks are not independent resources, and that their connections in the socio-ecosystem should be accounted for when managing fishing activities (Leslie and McLeod 2007; Marasco et al. 2007). Particularly, in multi-species fisheries that catch more than one species, technical interactions have long been put forward as a critical obstacle to successful output management because species cannot always be caught in the proportions prescribed by their respective single-stock target reference points (Vinther et al. 2004; Ulrich et al. 2011, 2017). Even in jurisdictions where multi-species policy objectives have been formulated at the fishery level, the complexity and additional data requirements of the models needed to operationalise such objectives have often impeded their application in practice (Dichmont et al. 2010; Pascoe et al. 2015; Hoshino et al. 2018). For species that are not landed, discard mitigation policies (Karp et al. 2019), and discard bans in their strictest form, have been difficult to implement. Indeed, the prospect of fisheries ‘choking’ on species with low catch limits (Schrope 2010; Patrick and Benaka 2013) has triggered resistance to implementing effective discard policies in these fisheries (Fitzpatrick et al. 2019).
EBFM embraces the four pillars of sustainable development, namely ecological, economic, social and institutional (De Young et al. 2008). As the primary factor underpinning fisheries management and the development of EBFM, ecological sustainability has tended to eclipse the human dimensions (economic, social and institutional) (Symes and Phillipson 2009; Link et al. 2017; Stephenson et al. 2017). Hornborg et al. (2019) highlighted that the inclusion of the human dimension in EBFM has primarily addressed economic sustainability, with less attention given to social and institutional components. Even the economic dimension is far from addressed comprehensively because focus has generally been on aggregate economic performance of the catch sector, to the expense of wider societal economic benefits such as the surplus of consumers.
EBFM requires the development of methods to embrace this variety of social, economic, ecological and institutional objectives in the management process. Particularly well-suited to the purpose, viability theory, and specifically eco-viability in an ecological context, searches for solutions that are ‘good enough’, i.e that maintain the system within acceptable bounds (Oubraham and Zaccour 2018), rather than seeking solutions optimising an objective function. It thus echoes the theory of satisficing decision-making (Simon 1956). Eco-viability assessments of fisheries management options (Doyen et al. 2017) were initially applied ecologically, by explicitly specifying multiple objectives pertaining to stock abundance, levels of biodiversity (Cissé et al. 2013, 2015), or explicit conservation constraints on by-catch species (Gourguet et al. 2016). Economic viability has also been given particular attention, in terms of fleet profitability (Gourguet et al. 2013), lease price of quota in individual transferable quota (ITQ) managed fisheries (Péreau et al. 2012), or constraints imposed on the remuneration of fishing crews (Maynou 2019; Briton et al. 2020) or on depreciation of physical capital (Briton et al. 2020). Broader social viability objectives have sometimes been considered in terms of meeting food-security requirements (Eisenack et al. 2006; Cissé et al. 2013, 2015; Hardy et al. 2013), maintaining a level of activity in the fishery (Péreau et al. 2012; Gourguet et al. 2013), or providing recreational fishers with ‘trophy’ catches (Thébaud et al. 2014).
The work presented here builds on previous modelling work conducted by Briton et al. (2020) in the French demersal fishery in the Bay of Biscay and applies it to the Australian mixed-species Southern and Eastern Scalefish and Shark Fishery (SESSF). In particular, it explicitly explores management of the fishery to meet standard biological (as opposed to ecological or ecosystem) and economic constraints, while also considering the social objective of providing affordable consumer product, through the imposition of an upper limit on product price. Other social objectives such as equitable access and ownership have not been elucidated well enough to be in the scope of the exercise. We aim to develop a relatively simple, thus tractable, model that can demonstrate how the approach could be used for tactical management advice, while still capturing the key processes relating to joint production in the fishery, as well as effort dynamics, quota allocation and price responses to changes in landings, and the existing understanding of the population dynamics of target and by-product stocks. We thus adopt an intermediate-complexity approach, where selected components of a system are modelled in relation to the problem at hand, with the ability to use existing data for calibration (Plaganyi et al. 2014).
The Australian Southern and Eastern Scalefish and Shark Fishery (SESSF)
The SESSF is a multi-sector and multi-species fishery that operates in waters under federal jurisdiction as well as some state waters under specific arrangements. It is currently the largest Australian federal fishery in terms of volume caught, and the second-most profitable, accounting for 20% of the gross value of production (GVP) of Australian federal fisheries (Patterson et al. 2018). Approximately 30 species of shark and scalefish are commercially harvested, with a dozen accounting for more than 75% of the fishery GVP. Management in the fishery primarily relies on output controls on the key commercial stocks and several by-product species. Total allowable catches (TACs) are currently determined for 34 stocks and allocated as ITQs. Catch limits are complemented by several input controls such as limited entry, gear restrictions, spatial closures and trip limits for certain species. The fishery is commonly divided in four sectors represented by different gear types targeting specific group of species, namely the Gillnet Hook and Trap Sector (GHAT), the Commonwealth Trawl Sector (CTS), the Great Australian Bight Sector (GABS), and the East Coast Deep-Water Trawl Sector (ECDWTS). The two latter were not included in the present work because they are spatially separated from the other sectors and can thus be managed independently. Other sectors such as recreational and traditional have not been a significant part of the fishery in terms of production or value, but are being increasingly considered in Australian government policy (Department of Agriculture and Water and Resources 2018).
Like other Australian federal fisheries, management in the SESSF is subject to the objectives and directives of the recently revised Commonwealth Harvest Strategy Policy. The objective of this policy is the ‘ecologically sustainable and profitable use of Australia’s Commonwealth commercial fisheries resources (where ecological sustainability takes priority)’ (Department of Agriculture and Water and Resources 2018, p. 6). Fisheries are to be managed towards their maximum economic yield (MEY), which is defined as the ‘maximisation of net economic returns to the Australian community’ (Department of Agriculture and Water and Resources 2018). The apparent opposing nature of these objectives is captured in the policy by applying a limit depletion of fish stocks and a target of maximising return, and although the policy specifically states that fisheries management should benefit the entire Australian community, catch limits have so far been set so that profits of the commercial fishery are maximised. Nonetheless, the desire to account for the broader interests of society in the valuation of economic returns has been recognised and recent academic work conducted by Pascoe et al. (2018b) proposed to include consumer surplus and non-market costs associated with by-catch in the estimation of MEY. This seems particularly relevant for the SESSF, in which, unlike in other Australian fisheries, fish caught are primarily destined to the national market.
Methods
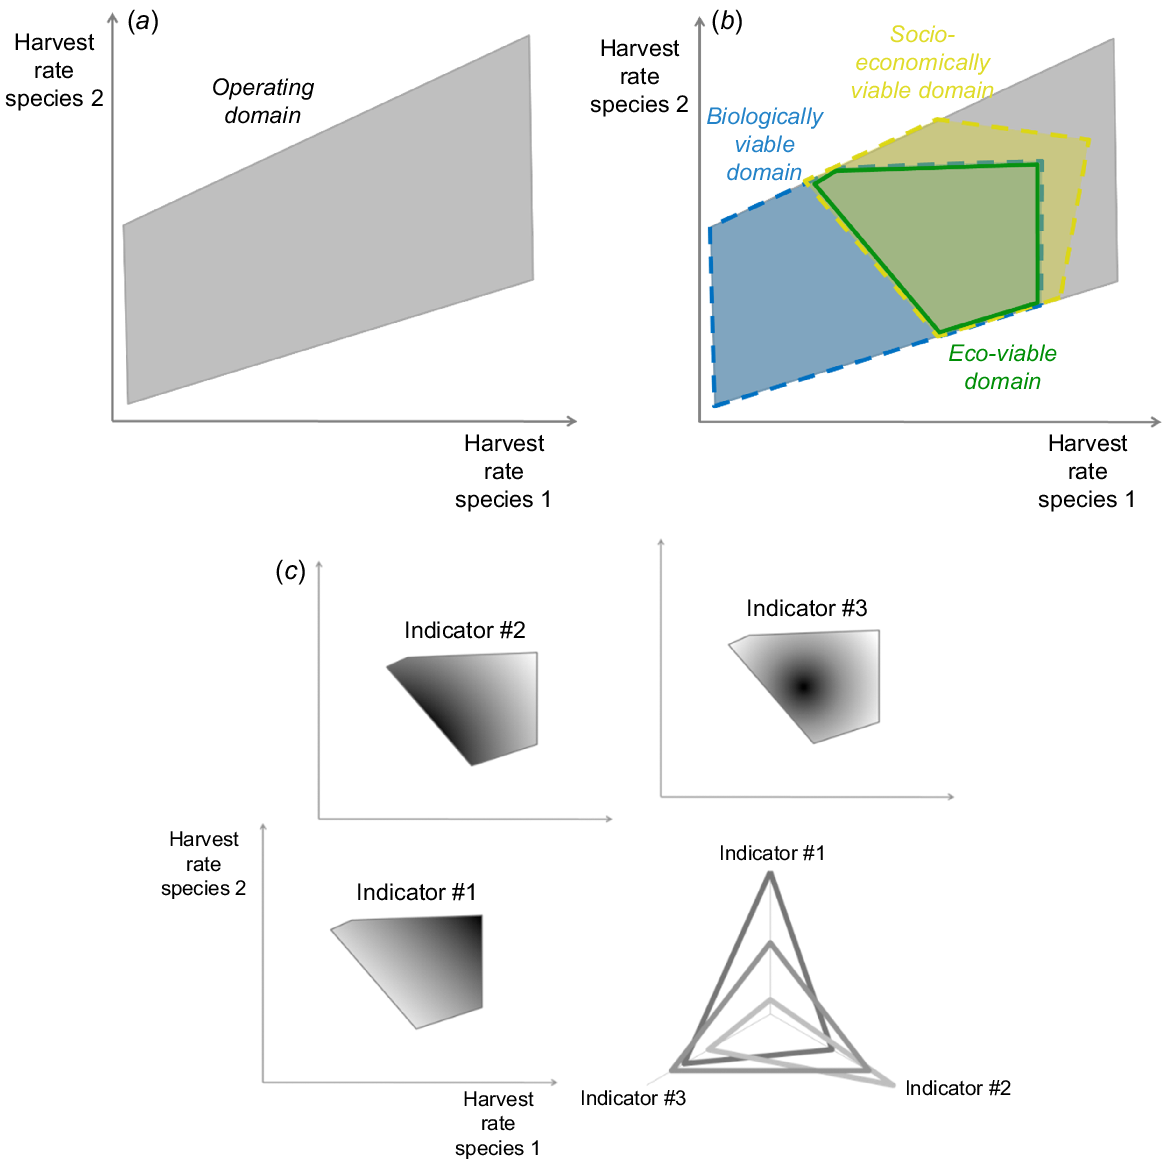
A stepwise modelling approach based on eco-viability assessment is taken to evaluate a range of fishing target levels, according to biological, economic and social objectives in the SESSF (Fig. 1). The first step determines the operating domain of achievable harvest rates, given technical interactions among jointly captured stocks (Fig. 1a). The use of harvest rates as a control on the stock is consistent with the harvest strategy framework for the fishery (Australian Fisheries Management Authority 2009). The second step determines the technically feasible harvest rates ensuring biological sustainability, which defines the biologically viable domain. The third step determines socio-economic viability at the fishery or vessel level, and the intersection between biologically and socio-economically viable domains defines the eco-viable space (Fig. 1b). Finally, eco-viable management strategies are compared and trade-offs identified, that might prevent adoption of these strategies (Fig. 1c).
Steps for conducting an eco-viability assessment. (a) A bio-economic model of the fishery specifies key interactions, and determines the operating domain that has feasible harvest rates for the species under consideration (two species in this example). (b) Feasible management strategies are assessed against a set of viability constraints. (c) Eco-viable management strategies are compared and trade-offs identified.
The bio-economic model
Simulations were run with the multi-species and multi-metier individual-based bio-economic model IAM (Merzereaud et al. 2011; Bellanger et al. 2018; Macher et al. 2018; Briton et al. 2020). IAM simulates the dynamics of a mixed fishery managed with ITQs. This implementation of the model for the SESSF is based on Briton et al. (2021). It models 16 stocks that were either key commercial species, or significant by-product species caught with them, such as tiger flathead (Platycephalus richardsoni), pink ling (east) (Genypterus blacodes), pink ling (west) (G. blacodes), blue-eye trevalla (Hyperoglyphe antarctica), blue grenadier (Macruronus novaezelandiae), gummy shark (Mustelus antarcticus), school shark (Galeorhinus galeus), jackass morwong (east) (Nemadactylus macropterus), jackass morwong (west) (N. macropterus), john dory (Zeus faber), mirror dory (Zenopsis nebulosa), ocean perch (two species are treated as a basket for management purposes and have similar life-history characteristics. Helicolenus barathri is found offshore at depths between 250 and 350 m, and H. percoides inshore at depths between 80 and 350 m), the eastern orange roughy (Hoplostethus atlanticus) stock, redfish (Centroberyx affinis), school whiting (Sillago flindersi), silver warehou (Seriolella punctata). Other economically important species were included as ‘static’ species, i.e. their contributions to landings were assumed to vary directly in proportion to levels of fishing effort and to fixed catch rates observed in the calibration period. The model was calibrated on calendar year 2015. Details on the calibration of the biological, catch (including technical interactions), and economic modules for the fishery can be found in the ‘Calibration of the model IAM for the Australian Southern and Eastern Scalefish and Shark Fishery’ section of the Supplementary material and Briton et al. (2021).
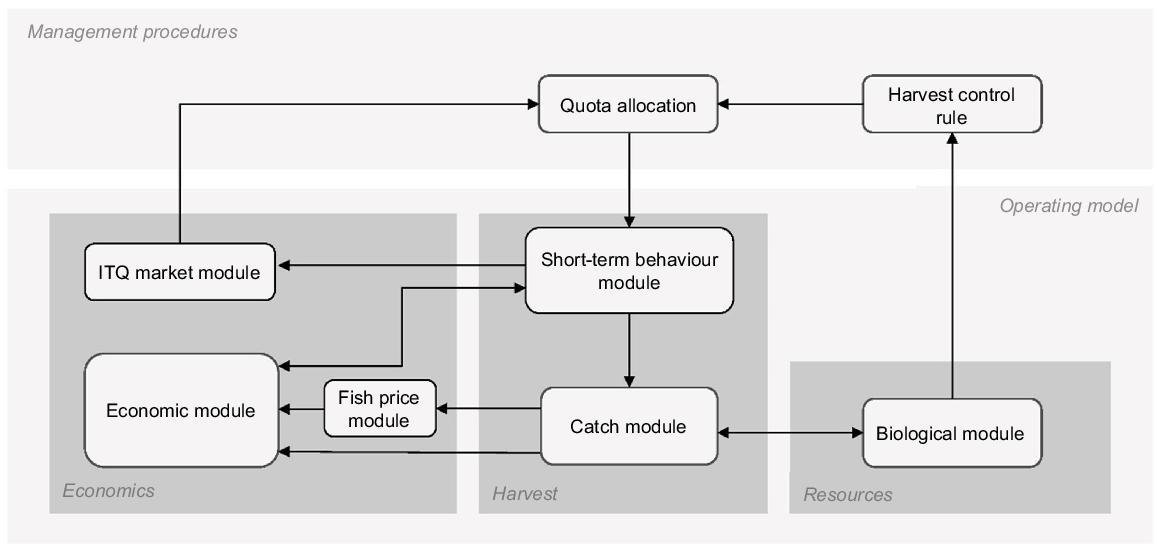
The model is composed of an operating model consisting of resource (stock), harvest and economic components. Resource (stock) dynamics are modelled using either a surplus production model, a sex- or age-structured model, or a constant (static) biomass model (Fig. 2). Key commercial species that had well-developed parameter estimates from stock assessment models were represented by a sex- and age-structured model. The main source of uncertainty in these models was stochastic recruitment. By-product species with less certain values of life-history parameter were captured either deterministically by a surplus production model or statically with constant catch rates. The management procedures component calculates a stock-specific TAC determined by a Harvest Control Rule (HCR), which assumes perfect knowledge of the underlying stock from the biological module (i.e. there is no process of sampling from the operating model and introducing observational error in the model). TACs from the HCR are allocated to individual vessels as quota constraining individual fishing efforts in the short-term behaviour module of the harvest component. Over-quota discards are not allowed, and fishers are assumed to stop fishing once they have reached their most limiting species quota. The short-term behaviour module allows for individual harvesters to dynamically determine their fishing strategy by allocating effort among a set of metiers. Following Marchal et al. (2011), effort allocation is modelled as a function of the weighted average between the expected profitability and the effort historically allocated to each metier, with the weight α given to profitability relative to historical experience. To enable changes in individual fishing strategies, the ITQ market module models the trade of quota units among operators. Briton et al. (2021) highlighted the importance of modelling the fishers’ endogenous response, and compared two extreme scenarios of fishing behaviour, namely entirely profit-driven (α = 1) and entirely experience-based (α = 0). Here we focus on the profit-driven fishing scenario (α = 1).
The price of fish is assumed to respond to landings from the catch module with cross-price flexibilities in the fish price module, as follows:
where ps,t is the price (A$) of species s at time t, Ls,t is the landings (Mg) of species s at time t and βs,s′ is the flexibility of the price of species s with regard to the landings of species s′. Price flexibilities (βs,s′) were based on estimates by Bose (2004) and only significant coefficients were kept.
Finally, the economic module calculates a variety of economic indicators at the vessel level (Bellanger et al. 2018), in Australian dollars. In particular, so as to consider a management objective that attempts to maximise MEY for the fishery, we calculated the vessel net operating surpluses.
The individual vessel net operating surplus for individual i at time t (NOSi,t) was calculated as follows:
where cdepi and Copporti are the depreciation and opportunity costs of capital of individual i. GOSi,t is the individual gross operating surplus, calculated as follows:
where cshri is the crew share of vessel i, Ls,i,t is the landings of species s by individual i at time t, gross value of landings of individual i at time t (GLVi,t) is calculated as follows:
where ps,t is the ex-vessel price of species s at time t and qps,t is its quota lease price as determined by the ITQ market module. The ratio of the yearly median lease price to the species ex-vessel price was calculated for the period 2017–2018 and used to estimate a yearly lease price for 2015. Values of those ratios are given in Supplementary material (Table S3).
CvarUEi,m is the variable costs per unit of effort of vesel i in metier m, Ei,m,t is the effort of individual i in metier m at time t, and Cfixi is the fixed costs of individual i. In the absence of data on the initial quota holdings of vessels, we assumed in the model that all the quotas required to operate had to be leased in. Indeed, the forgone lease revenues associated with the decision by an individual vessel to use its allocation if it holds one, represent an opportunity cost accounted for in the calculation of NOSi,t, in addition to the opportunity cost of physical capital investment, Copporti.
Crew wages at the vessel level, which reflect the remuneration of labour engaged in the fishery, were calculated as a share of the gross value of landings (GVLi), as follows:
and scaled to full-time equivalent (FTE) number of crew, as follows:
Indicators were also calculated at the fishery level, by summing across vessels operating in the fishery. The fishery net economic returns at time t (NERt, i.e. the surplus of vessel owners) were calculated as follows:
and the fishery net wages for crews (Nwaget) at time t (i.e. the surplus of fishing crews) as follows:
where Wageopport is the opportunity wage for fishing crews.
Eco-viability assessment
Building on Briton et al. (2020), IAM was used to identify eco-viable options among the achievable fishing-mortality targets of two of the key commercial species in the fishery, namely, tiger flathead and pink ling. The economic dynamics of a multi-species fishery such as the SESSF are driven by key commercial species, so that targets on the catches of the latter will be critical in meeting economic and social objectives. Thus, although we decided to focus on the joint management of those two key species in the eastern part of the SESSF, a metier analysis (see the ‘Metier and fleet definition in the Australian Southern and Eastern Scalefish and Shark Fishery’ section in the Supplementary material) was used to define the technical interactions (or lack of technical interactions) across 16 species in the model.
Simulations were conducted on a range of combinations of fishing-mortality targets () used to set annual TACs on these two species. The range of combinations constitutes a two-dimensional grid and a single combination on the grid is considered a particular management strategy. Within the grid, we identified the operating domain as the set of mortality target combinations such that at least 90% of both TACs is caught. Eco-viable management strategies within this operating domain were then identified, and trade-offs associated with alternative eco-viable strategies assessed.
The present analysis builds on sustainability constraints expressed as viability thresholds as proposed by Briton et al. (2020), with an additional constraint pertaining to guaranteeing maximum prices to satisfy consumers.
The first constraint was to ensure the biological viability of harvested stocks in the fishery, by maintaining biomasses above a limit Blim. Depending on whether a stock is represented in an age-structure or biomass dynamic manner, the biological viability of a stock (s) in the model was calculated as follows:
We used the limit reference point specified in the Harvest Strategy Policy of 20% of the pre-exploitation biomass as Blim, below which is considered an unacceptable risk of recruitment failure (Department of Agriculture and Water and Resources 2018). Estimations of pre-exploitation biomass from stock assessment reports were used to calculate the limit reference points reported in Table 1.
| Aim | Name | Time scale | Related entity | Value | |
|---|---|---|---|---|---|
| Stock sustainability | B lim | Year | Blue-eye trevalla | 2475 Mg | |
| B lim | Year | Blue grenadier | 10 782 Mg | ||
| B lim | Year | Flathead | 4620 Mg | ||
| B lim | Year | Gummy shark | 3474 Mg | ||
| B lim | Year | Jackass morwong (east) | 1410 Mg | ||
| B lim | Year | Jackass morwong (west) | 548 Mg | ||
| B lim | Year | John dory | 874 Mg | ||
| B lim | Year | Mirror dory | 2678 Mg | ||
| B lim | Year | Ocean perch | 238 Mg | ||
| B lim | Year | Orange roughy | 8327 Mg | ||
| B lim | Year | Pink ling (east) | 1534 Mg | ||
| B lim | Year | Pink ling (west) | 1429 Mg | ||
| B lim | Year | Redfish | 2401 Mg | ||
| B lim | Year | School shark | 7215 Mg | ||
| B lim | Year | School whiting | 1509 Mg | ||
| B lim | Year | Silver warehou | 3790 Mg | ||
| Cover operating costs | GOS min | Year | Vessel | A$0 | |
| Renumerate physical capital | NOS min | 10 years | Vessel | A$0 | |
| Maintain crews | Year | Vessel | A$60 000 | ||
| Satisfy consumers | Year | fishery | 1.20 |
All price values are in Australian dollars (A$). Masses are in tonnes (Mg).
The second constraint was that the fishing industry should be economically viable, which requires fishing companies to be able to maintain their means of production, i.e. capital and labour. In addition, the ability to maintain activity from year to year is often highlighted by the fishing industry as being important. We considered that a positive net operating surplus (NOS) over a 10-year period (as below) would secure the renewal of capital (i.e. cover its depreciation) and ensure the remuneration of physical capital at its opportunity cost.
The long-term economic (ELT) viability (VELT) of vessel i was thus calculated as follows:
In addition to the long-term economic viability of a vessel, we also considered its capacity to regularly cover its operating costs, i.e. show a positive gross operating surplus (GOS) every year, which does not account for long-term capital depreciation. This constraint specifically ensures the regularity of economic performance, a common request from the fishing industry. The short-term economic (EST) viability (VEST) of vessel i was calculated as follows:
The third constraint for the fishing industry was to maintain fishing crews. Although this is basically an economic constraint, we considered that fishing as an employment opportunity and a support of livelihoods is an important social objective, particularly for coastal communities. We considered that this implies maintaining the annual FTE wage above the opportunity wage of crews in the fishery (). The crew viability of vessel i was thus calculated as follows:
The absence of wage statistics for the Australian fishing sector makes it difficult to estimate the opportunity wage of fishing crews in the SESSF. Squires (1988) estimated the opportunity cost of labour in the Pacific Coast Trawl fleet as the mean wage earned in manufacturing, transportation, and retail trade sectors. Using this approach and on the basis of statistics provided in table 10G of Australian Bureau of Statistics (2016), the opportunity wage of an Australian fishing crew would be estimated to be A$68 600 in 2015. This is above advertised wages found on the Internet in October 2019 and corrected for wage inflation (between A$50 000 and $55 000), as well as the minimum wage for deckhands (which is not restricted to fishing deckhands) in Australian law as found in Australian Government Fair Work Ombudsman (2019) (A$43 700). A compromise value of A$60 000 was consequently chosen to represent the opportunity FTE wage of a crew member in the SESSF (Table 1).
The fourth viability constraint pertains to satisfying the consumer’s demand for fish by preventing the price of fish to exceed an upper acceptability threshold. Paying attention to the consumer’s demand is particularly relevant in our case-study because the recent review from Christenson et al. (2017) identified the price of fresh seafood and availability of local fish as substantial barriers to seafood consumption in Australia.
We included a sustainability constraint pertaining to the average level of prices on the first-sale market for fish. Calculating changes in the cost of fish for the consumer is not straightforward because it is a function of changes in the price of a set of products that have some level of substitutability. In this case, indices measuring the evolution of the price of a fixed basket of products, such as the Laspeyres or Paasche indices, are known to either positively or negatively bias estimates of changes in prices. The Fisher price index, calculated as the geometric mean of the Laspeyres and Paasche indices, corrects the positive and negative substitution biases respectively associated to these two indices. It is recognised to be a good estimate of the constant utility index, and thus able to estimate changes in the cost of a product category to the consumer (Diewert 1976; Diewert et al. 2009). It is defined as follows:
where and are the Laspeyres and Paasche indices at time t and are calculated as follows:
where ps,t and respectively are the price and landings of species s at time t, and tref is the reference year for the index, chosen here as the year of calibration, i.e. 2015.
The constraint reflecting consumer satisfaction, or consumption viability, was then calculated as follows:
An upper threshold for the Fisher price index () was estimated as the maximal value of the index observed between 2000 and 2015 in the SESSF. The time series of the index was reconstructed on the basis of of price and production data from the Australian Fisheries Statistics (Mobsby 2018) and adjusted for inflation with the consumer rrice index for ‘food and non-alcoholic beverages’ provided in tables 3 and 4 of Australian Bureau of Statistics (2019). The maximal price index over that period was 1.2, which represents a 20% increase compared with the reference year 2015 (Table 1) during a significant time of change in the fishery.
Uncertainties in the present case relate to the estimation of the stocks’ recruitment, for those stocks that are modelled using age-structured dynamics. We projected the different management strategies over a 10-year period, by using 100 replicates to account for uncertainties in stock recruitments. For each replicate rep simulation, a management strategy St is eco-viable if all viability constraints are met over the simulation period:
Eco-viability probabilities were calculated across replicate simulations as follows:
where nrep is the number of replicates.
Results
Eco-viability analysis
The number of biologically viable stocks in each scenario of the operating domain is given in Fig. 3. Among the 16 modelled stocks, only 15 can be maintained above their limit biomass reference point throughout the projection period with a probability of 90%. The stock that fails at meeting the biological constraint is redfish. Concerns relative to the sustainability of redfish are not new, because it is estimated to have been overfished since the early 1990s (Tuck et al. 2018). In 2015, the stock was estimated at 4% of its pre-exploitation biomass, and depletion levels after 10 years range from 9 to 11% (median values) throughout the set of our simulated scenarios (data not shown). Because overfished stocks are not expected to rebuild above safe biomass levels instantaneously, they are usually treated differently from other stocks in viability assessments (Martinet et al. 2007, 2010). The present work was not designed to specifically address the issue of rebuilding redfish, and therefore, the constraint pertaining to its viability was not considered for the remainder of this study. The biologically viable domain thus refers to the domain ensuring the viability of the 15 remaining stocks (with a probability of 90%). The other stock whose viability is threatened under some scenarios was the eastern stock of pink ling, one of the two stocks under TAC regulation in our simulations. As shown by Fig. 3, this stock’s biological viability occurred with a 90% probability for harvest rates below 0.11 year−1. It is worth noting that both FMSY and F20 reference points are not precautionary with regard to the sustainability of this stock when one starts accounting for uncertainties regarding recruitment. Indeed, although the mean spawning stock biomass of pink ling at maximum sustainabe yield (MSY) is estimated at 25% of its pre-exploitation biomass, which is above the 20% limit reference point, there is a more than 10% chance of the stock falling below its limit reference point when the stock is at MSY, given the range of uncertainty on recruitment included in our simulations.
Number of viable stocks (i.e. with a higher than 90% probability of remaining above their limit biomass reference point) in the operating domain. FMSY is the fishing mortality rate maximising yield at equilibrium for the stock and F20 the fishing mortality rate associated with an equilibrium biomass equal to 20% of its pre-exploitation value. The black square indicates harvest rates in the reference year (2015).
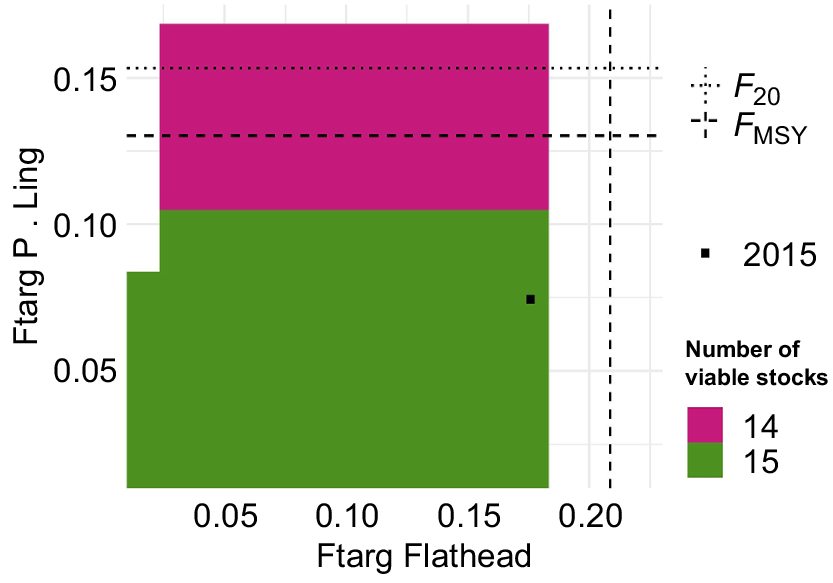
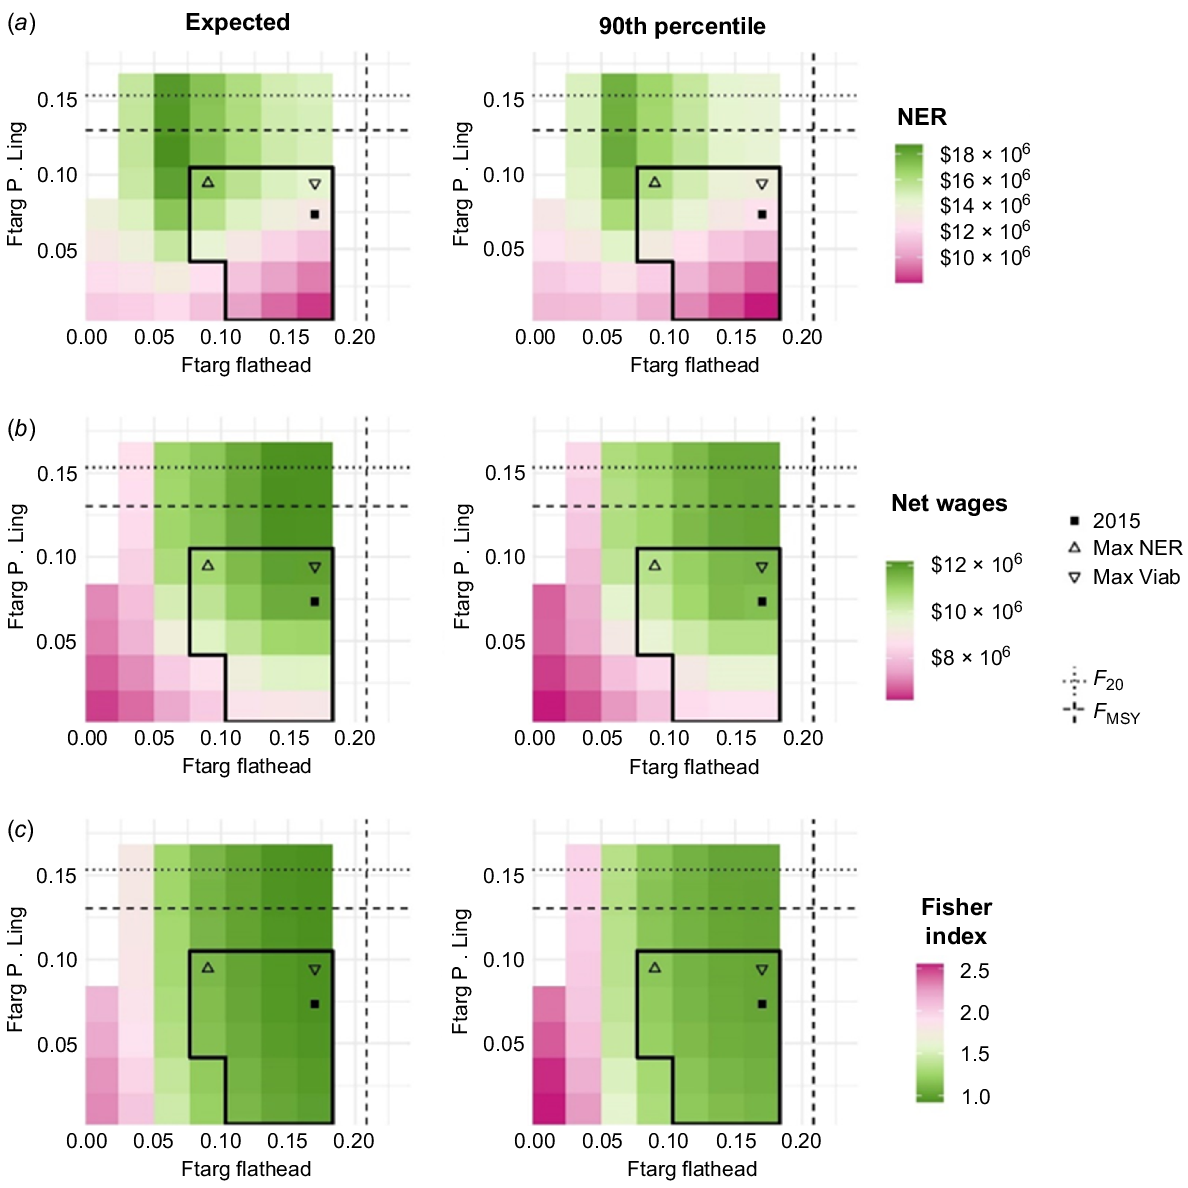
Fig. 4 shows the expected value (mean) and 90th percentile of three economic indicators used to assess the socio-economic viability of the fishery over the range of management strategies belonging to the operating domain. Strategies representing combined values of fishing mortality for pink ling and flathead that are robust to the inter-annual variability (second column of Fig. 4) are used to assess the viability of the fishery. Positive guaranteed net economic returns (NER) and net wages respectively indicate that the fishery is able to satisfactorily remunerate its physical and human capital. The maximum Fisher price index experienced throughout the simulation period (Fig. 4c, right) decreases as harvest rates increase, as a result of higher TACs and landings. Unlike socio-economic viability constraints pertaining to the harvesting sector, constraints pertaining to its biological (Fig. 3) and consumption viability thus restrict the operating domain to the eco-viable space, which is identified by the thick black line on Fig. 4. Within this eco-viable space, both the biological and consumption viability of the fishery are guaranteed with a probability of 90%.
Fishery’s socio-economic indicators within the operating domain. The first column (left) displays expected values (mean), whereas the second column (right) displays values with a 90% probability. (a) Net economic returns (NER); (b) net wages; (c) Fisher price index. The thick black bounding delineates the eco-viable space, defined as the space ensuring biological and economic viability of the fishery and price acceptability. Dashed lines show stock-specific FMSY and F20 reference points. Specific scenarios within the ecoviable space are also identified: the 2015 fishing mortality rates (black square), the rate maximising the industry’s net economic returns (Max NER), and the rate maximising the viable fleet size (Max Viab), but which also maximises net crew wages and minimises the price of fish.
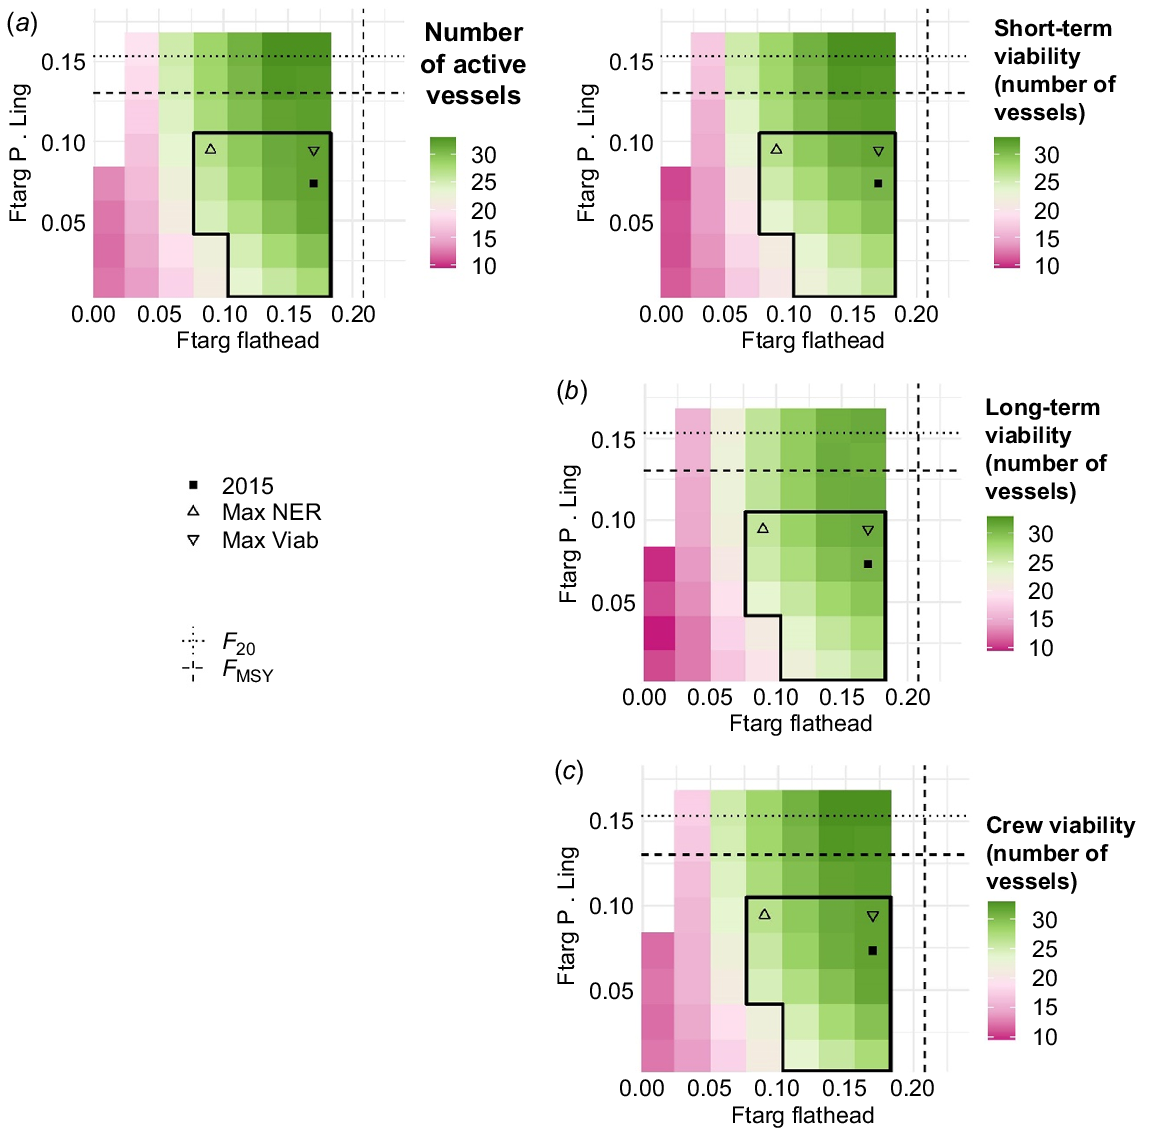
Economic viability can also be assessed at the vessel level (Fig. 5). The effect of using a dynamic pricing model was to constrict the operating domain (Supplementary material Fig. S1). Higher harvest rates, and thus TACs, in the operating domain allow more vessels to be active in the fishery (Fig. 5a). Individual vessels that decide to acquire (lease in) quota are those that expect positive NOS, given the market lease values of quotas (See Table S3 in the Supplementary material). However, because their expectations are based on the previous year’s catch rates and fish prices, economic results may differ from the expected value. This explains why some active vessels do not meet the short- or long-term profitability constraint (Fig. 5b, c in comparison to Fig. 5a). Nonetheless, the number of viable vessels with regard to each constraint is correlated with the number of active vessels, and the number of vessels simultaneously meeting the three viability constraints is maximal at the upper-right corner of the eco-viable space (Max Viab scenario).
Fleet economic viability within the operating domain. The plots display the number of viable vessels at a 90% probability: (a) short-term financial viability, (b) long-term financial viability, (c) crew viability. The thick black line delineates the eco-viable space, defined as the space ensuring biological and economic viability of the fishery as well as meeting the price acceptability constraint. Specific scenarios within the eco-viable space are also identified: the 2015 fishing mortality rates (black square), the rate maximising the industry’s net economic returns (Max NER), and the rate maximising the viable fleet size (Max Viab) but which also maximises net crew wages and minimises the price of fish.
Trade-offs within the eco-viable space
Although the fishery currently has several overfished stocks, including redfish, with the eco-viability framework we seek to prospectively identify a safe operating space for the fishery, which is composed of a set of feasible management strategies, for all the other species. This approach provides options and a better understanding of potentially conflicting objectives associated with alternative viable options that can help further guide decision-making. Several trade-offs pertaining to the distribution of benefits among vessel owners, crew members and consumers could be considered here. Whereas the surplus to vessel owners (i.e. the fishery’s expected NER) is maximised at the upper-left corner of the eco-viable space (Max NER scenario, Fig. 4a, left), those of consumers (which benefit when the Fisher price index is low) and crews (i.e. expected net crew wages) are maximised at its upper-right corner (Max Viab scenario – Fig. 4b, left and 4c, left). As already highlighted, this is also where the number of economically viable vessels is maximised (Fig. 5).
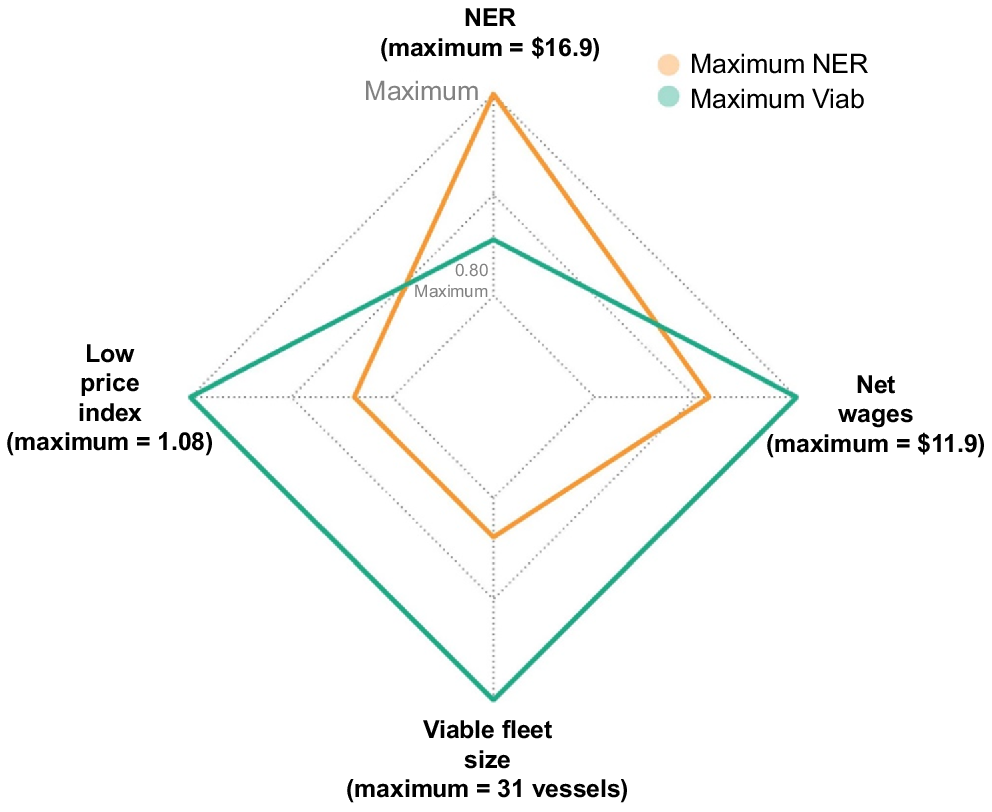
Trade-offs in Fig. 6 show that maximising NER will generate A$16.9 million and is expected to increase the price of fish by 11% compared with 2015, generate A$10.9 million of wages and sustain an economically viable fleet of 26 vessels. Maximising viability (Max Viab), which includes consumer surplus, crew surplus and fleet size, would decrease the price of fish by 7% relative to 2015, generate A$11.9 million of net wages, allow a viable fleet of 31 vessels and generate profits of A$14.4 million, that is 86% of its maximal value.
Socio-economic trade-offs within the eco-viable space. Variables have been scaled to the maximal value of each viability dimension within the eco-viable space. The low price index refers to the inverse of the expected Fisher price index shown in Fig. 4c, left and is used as a proxy for the impacts of decreases in fish prices on the surplus of consumers. NER is the expected NER as shown in Fig. 4a, left, net wages are the expected net crew wages as shown in Fig. 4b, left and the viable fleet size is the number of vessels simultaneously meeting the three viability constraints as shown in Fig. 5.
Discussion
This analysis of the eco-viability of the SESSF has shown a regional socio-ecological operating space (Dearing et al. 2014) applied to a fishery, in the following three steps: (i) the inclusion of market dynamics in the development of fisheries management advice; (ii) the definition of sustainability thresholds as viability constraints; and (iii) the evaluation of trade-offs among eco-viable management strategies.
Market dynamics in multispecies fisheries: what is the added value for management advice?
Using the same simulation framework as adopted here, Briton et al. (2021) determined achievable catch compositions for several species pairs in the SESSF and noted significant room to move in the proportions in which these species are being caught. In this work, IAM was augmented with the endogenous representation of fish market dynamics in the SESSF. Not only did this allow consideration of the consequences for fish consumers when evaluating management targets, but it also refined our estimation of the operating domain of the fishery. Specifically, we showed that typical market dynamics, with prices decreasing with an increasing supply, lessen the economic incentives to increase the landings of under-caught species, hence narrowing down the operating domain we had obtained under the assumption of constant prices. In addition to driving individual fishing strategies, market dynamics also determined overall economic outcomes of the fishery. In particular, they exacerbated the divergence of interests between producers and consumers, as price increases tend to favour producers at the expense of the latter. These aspects being of notable interest to decision-makers, we emphasise the value of adequately capturing market dynamics in the models used to provide management advice. Regular updating of the evaluation of market dynamics is warranted, to enable such analyses to account for the most recent trends in price responses to changes in fish supply.
Definition of sustainability thresholds
Whereas most eco-viability applications to fisheries have interpreted economic viability as maintaining positive fishery profits (Oubraham and Zaccour 2018), we propose to decompose economic viability into three constraints pertaining to the remuneration of both physical and human forms of capital. The remuneration of physical capital engaged in the fishery was addressed at two time scales. First, a short-term constraint on the operators’ annual gross profits assessed the ability of producers to cover their annual operating costs (fixed and variable). Second, a long-term constraint on the operators’ net profits assessed their ability to cover capital costs in addition to operating costs. The remuneration of human capital is also critical to the economic viability of a fishery. This was addressed by an annual constraint on the FTE wage of fishing crews.
The work presented here is also, to our knowledge, the first attempt to incorporate a constraint pertaining to prices paid by fish buyers in a fishery’s eco-viability assessment. Including a constraint on fish prices was motivated because management in the SESSF aims at maximising profits of the fishing industry and fishery production is primarily destined to the Australian market. Thus the level of landings in the fishery is bound to affect the prices paid by consumers. We used an upper bound on the Fisher price index for fish landed by the fishery on the basis of price data from a significant time of change in the fishery. The fishery’s price index only partially reflects consumer surplus, which can be compounded by multiple drivers of changes in the availability and price of substitute and complementary products external to the fishery (e.g. imported fish (Ruello 2011) or Australian farmed salmon). However, such external effects were out of scope of the present work, which focused on assessing the impact for consumers of management decisions made for the fishery, thus legitimating the use of a fishery-focused proxy. Further refinements to this approach could, for instance, aim at estimating price thresholds that would ensure that products of the fishery remain affordable for specific social groups.
The identification of thresholds separating safe from risky evolutions of the system is a critical, and certainly not trivial, step in the eco-viability approach. Regarding a stock’s biological viability, for instance, there is no real consensus emerging from the scientific literature on how to define reference points for recruitment overfishing. Haddon et al. (2012) traced the emergence of B20 as a limit reference point for Australian federal fisheries back to Beddington and Cook (1983), and the report from Restrepo et al. (1998). They noted that despite the lack of empirical basis for this value, actually being a proxy for the $0.5 BMSY reference point, it has been adopted for the management of Australian federal fisheries. This limit reference point is therefore more likely to represent a conventional value people have agreed on at some point in time, rather than a viability threshold stricto sensu. Some good practices identified by Sainsbury (2008), such as limiting unfished biomass to 30%, are appropriate to maintain ecosystem function and processes, and provide precaution against stock collapse, and could be considered to refine the biological thresholds used in viability analyses of the fishery.
Also linked to biological reference points, we noted that FMSY is not always a precautionary target in the sense specified by the Harvest Strategy Policy. Indeed, it can drive a stock below its limit reference point B20 in more than 1 year out of 10, if uncertainties regarding recruitment are accounted for. This is something we observed for the eastern stock of pink ling in the SESSF and it is not unique because it has also been reported for hoki in New Zealand, which contributed to BMSY not being chosen as a management target for this stock Punt et al. (2014).
From sustainability to trade-offs
Management objectives either take the form of constraints (referred to as ‘sustainability objectives’) or quantities to maximise (referred to as ‘maximisation objectives’; Rindorf et al. 2017). Importantly, Rindorf et al. (2017) found a broad agreement among stakeholder groups that maximisation should occur only within the ‘sustainable area’, hereby highlighting the priority given to sustainability against the maximisation of any specific objective in real-life management situations. The two-step approach that we used here also prioritises sustainability constraints, and could be used to operationalise the prioritisation of objectives. First, the eco-viability approach allows the identification of a safe control space for the system, respecting minimum standards with regard to the several pillars of sustainability (the ‘sustainable area’ from Rindorf et al. 2017). In this particular application, we showed that maximising fishery profits is not an eco-viable trajectory because it breaches both the biological constraint on pink ling and the threshold imposed on the price of fish.
Second, we identified the options allowing maximising particular objectives, and have presented the trade-offs associated with each of these options. Not only is the knowledge of potential trade-offs essential for informed management decision-making, but it is also useful to the wider society because it provides transparency regarding the compromises underlying decisions. In particular, we have highlighted a conflict between the surplus of vessel owners and that of consumers. Our results echoe the work conducted by Pascoe et al. (2018a) in the SESSF, who showed that accounting for consumer surplus in the estimation of MEY resulted in a net transfer of benefits from producers to consumers.
Operationalising EBFM, which includes the triple bottom line of considerations, requires a range formalised from specifying operational management objectives, designing a strategy to achieve the objectives, and testing it (Sloan et al. 2014; Cormier et al. 2017). A co-viability domain offers a succinct way of capturing the relation among objectives, and evaluating trade-offs, usually in a management strategy evaluation (MSE) framework. Stakeholder engagement is a critical part of this (Sloan et al. 2014). Although using engagement to define objectives and identify the co-viability domain does not guarantee a safe biological operating space (Pascoe et al. 2019), it increases legitimacy of a harvest strategy. Indeed, not all species met the biological constraints defined in our analysis, and species triage can itself be a difficult trade-off to navigate (Gerber 2016).
We also highlighted a divergence of interests between vessel owners and crew members. The extent to which these interests differ depends on the remuneration system of fishing crews. As noted by Guillen et al. (2017), shared remuneration systems (also called lay systems) have been commonly adopted in fisheries worldwide, to make crews capture part of the rent from fishing, hence bringing their incentives in closer alignment to those of vessels owners. Such systems, nevertheless, vary in what is shared between vessel owners and crews. In some cases, crews get a share of the revenue and costs are born by vessel owners, which is the usual case in the SESSF. There are also situations where operating costs such as fuel, bait, ice or the lease of quota are jointly born by crews and vessel owners. Intuitively, the more costs are shared, the more the surplus of crews aligns with that of vessel owners. This is indeed what we see when simulating a remuneration of crew indexed on the income from fishing minus variable costs. It is nonetheless important to point out that both scenarios assume a constant rate for crew shares, which does not capture adjustments that can be made by vessel owners to align their remuneration to the labour market.
Conclusions
Fisheries management is a complicated activity (Hobday et al. 2019). In addition to ensuring stock sustainability, Australian fisheries are required to maximise the economic returns to the Australian community; yet, recent trends in the SESSF have suggested that the fishery is currently not meeting stakeholder expectations and objectives. A recent review by Knuckey et al. (2018) showed that most species TAC were not being caught, catch rates were not responding to reduced fishing pressure and previously over-fished stocks were not being seen to recover. The reasons for this suggested by Knuckey et al. (2018) are choke species or technical interactions. The SESSF also lies in a global marine hotspot, one of a range of areas that have high biodiversity values and are warming rapidly (Hobday and Pecl 2014; Ramírez et al. 2017). The area is also a nationally important region for other uses, including renewable and non-renewable energy production (Briggs et al. 2021; Melbourne-Thomas et al. 2021). As a result, embracing a full spectrum of sustainability in the management of not only fisheries, but of multiple uses is needed in the future, as well as a method of systematic accounting of economic and social performance, in what is often a biologically focused evaluation process.
We have shown how the eco-viability approach can be used to identify TAC decisions in mixed fisheries which meet a multitude of biological, economic and social sustainability constraints. We have also highlighted how specific trade-offs may be examined across sustainable (eco-viable) management options. In particular, we showed that maximising the fishery’s profits, which figures as the management target in the SESSF, comes at a cost for crew members and fish buyers.
Data availability
Data are provided in the supplementary material and detailed simulation data are available from the senior author.
Declaration of funding
This work was supported by the University of Tasmania (UTAS) and Commonwealth Scientific and Industrial Research Organisation (CSIRO) PhD Program in Quantitative Marine Science, a CSIRO ResearchPlus Postgraduate Top-up Scholarship and the French Research Institute for Exploitation of the Sea (Ifremer), the Ecole des Docteurs of University Bretagne Loire and the Conseil Régional de Bretagne.
Acknowledgements
This paper forms part of the PhD thesis of Florence Briton (2020). The authors thank the Australian Fisheries Management Authority (AFMA) for providing access to logbook and SFR trading data as well as stock-assessment outputs, and the Australian Bureau of Agricultural and Resource Economics and Sciences (ABARES) for providing economic data. We are also grateful to Malcolm Haddon, Jemery Day and Paul Burch (CSIRO) for their help with the biological calibration of the model and Sean Pascoe (CSIRO) for his help with the economic calibration.
References
Australian Bureau of Statistics (2016) 6302.0 – Average weekly earnings, Australia, November 2015. (ABS) Available at https://www.abs.gov.au/AUSSTATS/abs@.nsf/DetailsPage/6302.0Nov%202015?OpenDocument
Australian Bureau of Statistics (2019) Consumer Price Index, Australia. Reference period September 2019. (ABS) Available at https://www.abs.gov.au/statistics/economy/price-indexes-and-inflation/consumer-price-index-australia/sep-2019#cite-window1
Beddington J, Cook J (1983) The potential yield of fish stocks. FAO Fisheries Technical Paper 242. (Food and Agriculture Organizaton of the United Nations: Rome, Italy) Available at https://archive.org/details/potentialyieldof034735mbp
Bellanger M, Macher C, Merzéréaud M, Guyader O, Le Grand C (2018) Investigating trade-offs in alternative catch share systems: an individual-based bio-economic model applied to the Bay of Biscay sole fishery. Canadian Journal of Fisheries and Aquatic Sciences 75, 1663-1679.
| Crossref | Google Scholar |
Bose S (2004) An empirical investigation of price-quantity relations of the quota species of Australia’s south east fishery. Marine Resource Economics 19, 161-172.
| Crossref | Google Scholar |
Briton F (2020) Application of the eco-viability approach for the management of mixed fisheries under output control. PhD thesis, Université de Bretagne occidentale, Brest, France. Available at https://www.theses.fr/en/2020BRES0089
Briton F, Macher C, Merzeréaud M, Le Grand C, Fifas S, Thébaud O (2020) Providing integrated total catch advice for the management of mixed fisheries with an eco-viability approach. Environmental Modeling & Assessment 25, 307-325.
| Crossref | Google Scholar |
Briton F, Thebaud O, Macher C, Gardner C, Little LR (2021) Flexibility of joint production in mixed fisheries and implications for management. ICES Journal of Marine Science 78, 1599-1613.
| Crossref | Google Scholar |
Christenson JK, O’Kane GM, Farmery AK, McManus A (2017) The barriers and drivers of seafood consumption in Australia: a narrative literature review. International Journal of Consumer Studies 41, 299-311.
| Crossref | Google Scholar |
Cissé AA, Gourguet S, Doyen L, Blanchard F, Péreau J-C (2013) A bio-economic model for the ecosystem-based management of the coastal fishery in French Guiana. Environment and Development Economics 18, 245-269.
| Crossref | Google Scholar |
Cissé AA, Doyen L, Blanchard F, Béné C, Péreau J-C (2015) Ecoviability for small-scale fisheries in the context of food security constraints. Ecological Economics 119, 39-52.
| Crossref | Google Scholar |
Cormier R, Kelble CR, Robin Anderson M, Icarus Allen J, Grehan A, Gregersen Ó (2017) Moving from ecosystem-based policy objectives to operational implementation of ecosystem-based management measures. ICES Journal of Marine Science 74, 406-413.
| Crossref | Google Scholar |
De Young C, Charles A, Hjort A (2008) Human dimensions of the ecosystem approach to fisheries: an overview of context, concepts, tools and methods. FAO Fisheries Technical Paper 489. (Food and Agriculture Organization of the United Nations: Rome, Italy) Available at https://www.fao.org/3/i0163e/i0163e00.pdf
Dearing JA, Wang R, Zhang K, Dyke JG, Haberl H, Sarwar Hossain Md, Langdon PG, Lenton TM, Raworth K, Brown S, Carstensen J, Cole MJ, Cornell SE, Dawson TP, Patrick Doncaster C, Eigenbrod F, Flörke M, Jeffers E, Mackay AW, Nykvist B, Poppy GM (2014) Safe and just operating spaces for regional social-ecological systems. Global Environmental Change 28, 227-238.
| Crossref | Google Scholar |
Department of Agriculture and Water and Resources (2018) Commonwealth Fisheries Harvest Strategy Policy: framework for applying an evidence-based approach to setting harvest levels in Commonwealth fisheries. (DAWR: Canberra, ACT, Australia) Available at https://www.agriculture.gov.au/sites/default/files/sitecollectiondocuments/fisheries/domestic/hsp.pdf
Dichmont CM, Pascoe S, Kompas T, Punt AE, Deng R (2010) On implementing maximum economic yield in commercial fisheries. Proceedings of the National Academy of Sciences 107, 16-21.
| Crossref | Google Scholar |
Diewert WE (1976) Exact and superlative index numbers. Journal of Econometrics 4(2), 115-145.
| Crossref | Google Scholar |
Doyen L, Béné C, Bertignac M, Blanchard F, Cissé AA, Dichmont C, Gourguet S, Guyader O, Hardy P-Y, Jennings S, Little LR, Macher C, Mills DJ, Noussair A, Pascoe S, Pereau J-C, Sanz N, Schwarz A-M, Smith T, Thébaud O (2017) Ecoviability for ecosystem-based fisheries management. Fish and Fisheries 18, 1056-1072.
| Crossref | Google Scholar |
Eisenack K, Scheffran J, Kropp JP (2006) Viability analysis of management frameworks for fisheries. Environmental Modeling & Assessment 11, 69-79.
| Crossref | Google Scholar |
Gerber LR (2016) Conservation triage or injurious neglect in endangered species recovery. Proceeding of the National Academy of Sciences 113, 3563-3566.
| Crossref | Google Scholar |
Gourguet S, Macher C, Doyen L, Thébaud O, Bertignac M, Guyader O (2013) Managing mixed fisheries for bio-economic viability. Fisheries Research 140, 46-62.
| Crossref | Google Scholar |
Gourguet S, Thébaud O, Jennings S, Little LR, Dichmont CM, Pascoe S, Deng RA, Doyen L (2016) The cost of co-viability in the Australian Northern Prawn Fishery. Environmental Modeling & Assessment 21, 371-389.
| Crossref | Google Scholar |
Guillen J, Boncoeur J, Carvalho N, Frangoudes K, Guyader O, Macher C, Maynou F (2017) Remuneration systems used in the fishing sector and their consequences on crew wages and labor rent creation. Maritime Studies 16, 3.
| Crossref | Google Scholar |
Hardy P-Y, Béné C, Doyen L, Schwarz A-M (2013) Food security versus environment conservation: a case study of Solomon Islands’ small-scale fisheries. Environmental Development 8, 38-56.
| Crossref | Google Scholar |
Hobday AJ, Pecl GT (2014) Identification of global marine hotspots: sentinels for change and vanguards for adaptation action. Reviews in Fish Biology and Fisheries 24, 415-425.
| Crossref | Google Scholar |
Hobday AJ, Little R, Bulman C, Gardner C, McGrath-Steer B, Ogier E, Rayns N, Sen S, Sloan S, Smith T, Thomas L (2019) Best practice guidelines for Australian fisheries management agencies. CSIRO Oceans and Atmosphere report to FRDC, report number 2015-203. (Fisheries Research and Development Corporation: Canberra, ACT, Australia) Available at https://www.frdc.com.au/project/2015-203
Hornborg S, van Putten I, Novaglio C, Fulton EA, Blanchard JL, Plagányi É, Bulman C, Sainsbury K (2019) Ecosystem-based fisheries management requires broader performance indicators for the human dimension. Marine Policy 108, 103639.
| Crossref | Google Scholar |
Hoshino E, Pascoe S, Hutton T, Kompas T, Yamazaki S (2018) Estimating maximum economic yield in multispecies fisheries: a review. Reviews in Fish Biology and Fisheries 28(2), 261-276.
| Crossref | Google Scholar |
Karp WA, Breen M, Borges L, Fitzpatrick M, Kennelly SJ, Kolding J, Nielsen KN, Vidarsson JR, Cocas L, Leadbitter D (2019) Strategies used throughout the world to manage fisheries discards – lessons for implementation of the EU landing obligation. In ‘The European landing obligation’. (Eds SS Uhlmann, C Ulrich, SJ Kennelly) pp. 3–26. (Springer International Publishing)
Knuckey I, Boag S, Day G, Hobday A, Jennings S, Little R, Mobsby D, Ogier E, Nicol S, Stephenson R (2018) Understanding factors influencing under-caught TACs, declining catch rates and failure to recover for many quota species in the SESSF. Fishwell Consulting report to FRDC, report number 2016-146. (Fisheries Research and Development Corporation: Canberra, ACT, Australia) Available at https://www.frdc.com.au/project/2016-146
Leslie HM, McLeod KL (2007) Confronting the challenges of implementing marine ecosystem-based management. Frontiers in Ecology and the Environment 5(10), 540-548.
| Crossref | Google Scholar |
Link JS, Thébaud O, Smith DC, Smith AD, Schmidt J, Rice J, Poos JJ, Pita C, Lipton D, Kraan M, Frusher S, Doyen L, Cudennec A, Criddle K, Bailly D (2017) Keeping humans in the ecosystem. ICES Journal of Marine Science 74(7), 1947-1956.
| Crossref | Google Scholar |
Macher C, Bertignac M, Guyader O, Frangoudes K, Frésard M, Le Grand C, Merzéréaud M, Thébaud O (2018) The role of technical protocols and partnership engagement in developing a decision support framework for fisheries management. Journal of Environmental Management 223, 503-516.
| Crossref | Google Scholar | PubMed |
Marasco RJ, Goodman D, Grimes CB, Lawson PW, Punt AE, Quinn TJ, II (2007) Ecosystem-based fisheries management: some practical suggestions. Canadian Journal of Fisheries and Aquatic Sciences 64(6), 928-939.
| Crossref | Google Scholar |
Marchal P, Little LR, Thébaud O (2011) Quota allocation in mixed fisheries: a bioeconomic modelling approach applied to the Channel flatfish fisheries. ICES Journal of Marine Science 68(7), 1580-1591.
| Crossref | Google Scholar |
Martinet V, Thébaud O, Doyen L (2007) Defining viable recovery paths toward sustainable fisheries. Ecological Economics 64, 411-422.
| Crossref | Google Scholar |
Martinet V, Thébaud O, Rapaport A (2010) Hare or tortoise? Trade-offs in recovering sustainable bioeconomic systems. Environmental Modelling & Assessment 15, 503-517.
| Crossref | Google Scholar |
Maynou F (2019) Co-viability of a Mediterranean demersal fishery affected by the discard ban under alternative management scenarios. Fisheries Management and Ecology 26(4), 345-353.
| Crossref | Google Scholar |
Melbourne-Thomas J, Hayes KR, Hobday AJ, Little LR, Strzelecki J, Thomson DP, van Putten I, Hook SE (2021) Decommissioning research needs for offshore oil and gas infrastructure in Australia. Frontiers in Marine Science 8, 711151.
| Crossref | Google Scholar |
Merzereaud M, Macher C, Bertignac M, Fresard M, Le Grand C, Guyader O, Daures F, Fifas S (2011) Description of the impact assessment bio-economic model for fisheries management (IAM). Working Papers Series D-29-2011. (Amure Publications) Available at http://www.umr-amure.fr/electro_doc_amure/D_39_2011.pdf
Oubraham A, Zaccour G (2018) A survey of applications of viability theory to the sustainable exploitation of renewable resources. Ecological Economics 145, 346-367.
| Crossref | Google Scholar |
Pascoe S, Hutton T, Hoshino E (2018a) Offsetting externalities in estimating MEY in multispecies fisheries. Ecological Economics 146, 304-311.
| Crossref | Google Scholar |
Pascoe S, Hutton T, Hoshino E, Sporcic M, Yamazaki S, Kompas T (2018b) Maximising net economic returns from a multispecies fishery. CSIRO Oceans and Atmosphere report to FRDC, Project Number 2015-202. (Fisheries Research & Development Corporation: Canberra, ACT, Australia) Available at https://www.frdc.com.au/sites/default/files/products/2015-202-DLD.pdf
Pascoe S, Cannard T, Dowling NA, Dichmont CM, Breen S, Roberts T, Pears RJ, Leigh GM (2019) Developing harvest strategies to achieve ecological, economic and social sustainability in multi-sector fisheries. Sustainability 11, 644.
| Crossref | Google Scholar |
Patrick WS, Benaka LR (2013) Estimating the economic impacts of bycatch in US commercial fisheries. Marine Policy 38, 470-475.
| Crossref | Google Scholar |
Plaganyi EE, Punt AE, Hillary R, Morello EB, Thébaud O, Hutton T, Pillans RD, Thorson JT, Fulton EA, Smith ADM, et al. (2014) Multispecies fisheries management and conservation: tactical applications using models of intermediate complexity. Fish and Fisheries 15(1), 1-22.
| Crossref | Google Scholar |
Punt AE, Smith ADM, Smith DC, Tuck GN, Klaer NL (2014) Selecting relative abundance proxies for BMSY and BMEY. ICES Journal of Marine Science 71(3), 469-483.
| Crossref | Google Scholar |
Péreau J-C, Doyen L, Little LR, Thébaud O (2012) The triple bottom line: meeting ecological, economic and social goals with individual transferable quotas. Journal of Environmental Economics and Management 63(3), 419-434.
| Crossref | Google Scholar |
Ramírez F, Afán I, Davis LS, Chiaradia A (2017) Climate impacts on global hot spots of marine biodiversity. Science Advances 3, e1601198.
| Crossref | Google Scholar | PubMed |
Restrepo V, Thompson G, Mace P, Gabriel W, Low L, MacCall A, Methot R, Powers J, Taylor B, Wade P, Witzig J (1998) Technical guidance on the use of precautionary approaches to implementing National Standard 1 of the Magnuson–Stevens Fishery Conservation and Management Act. NOAA Technical Memo NMFSF/SPO-31, US Department of Commerce, Washington, DC, USA.
Rindorf A, Mumford J, Baranowski P, Clausen LW, García D, Hintzen NT, Kempf A, Leach A, Levontin P, Mace P, Mackinson S, Maravelias C, Prellezo R, Quetglas A, Tserpes G, Voss R, Reid D (2017) Moving beyond the MSY concept to reflect multidimensional fisheries management objectives. Marine Policy 85, 33-41.
| Crossref | Google Scholar |
Schrope M (2010) Fisheries: what’s the catch? Nature 465(7298), 540-542.
| Crossref | Google Scholar | PubMed |
Simon HA (1956) Rational choice and the structure of the environment. Psychological Review 63, 129-138.
| Crossref | Google Scholar |
Sloan SR, Smith ADM, Gardner C, Crosthwaite K, Triantafillos L, Jeffries B, Kimber N (2014) National guidelines to develop fishery harvest strategies. SA Primary Industries and Regions report to FRDC Project 2010/061. (Fisheries Research and Development Corporation: Canberra, ACT, Australia) Available at https://www.frdc.com.au/sites/default/files/products/2010-061-PDT-1.pdf
Stephenson RL, Benson AJ, Brooks K, Charles A, Degnbol P, Dichmont CM, Kraan M, Pascoe S, Paul SD, Rindorf A, Wiber M (2017) Practical steps toward integrating economic, social and institutional elements in fisheries policy and management. ICES Journal of Marine Science 74(7), 1981-1989.
| Crossref | Google Scholar |
Symes D, Phillipson J (2009) Whatever became of social objectives in fisheries policy? Fisheries Research 95(1), 1-5.
| Crossref | Google Scholar |
Thébaud O, Ellis N, Little LR, Doyen L, Marriott RJ (2014) Viability trade-offs in the evaluation of strategies to manage recreational fishing in a marine park. Ecological Indicators 46, 59-69.
| Crossref | Google Scholar |
Tuck G, Day J, Haddon M, Castillo-Jordán C (2018) Redfish (Centroberyx affinis) stock assessment based on data up to 2016. In ‘Stock Assessment for the Southern and Eastern Scalefish and Shark Fishery 2016 and 2017’. (Ed. GN Tuck) Part 2, 2017, pp 691–729. (Australian Fisheries Management Authority and CSIRO Oceans and Atmosphere: Hobart, Tas., Australia) Available at https://research.csiro.au/efar/wp-content/uploads/sites/284/2020/07/Redfish2017-1.pdf
Ulrich C, Reeves SA, Vermard Y, Holmes SJ, Vanhee W (2011) Reconciling single-species TACs in the North Sea demersal fisheries using the Fcube mixed-fisheries advice framework. ICES Journal of Marine Science 68(7), 1535-1547.
| Crossref | Google Scholar |
Ulrich C, Vermard Y, Dolder PJ, Brunel T, Jardim E, Holmes SJ, Kempf A, Mortensen LO, Poos J-J, Rindorf A (2017) Achieving maximum sustainable yield in mixed fisheries: a management approach for the North Sea demersal fisheries. ICES Journal of Marine Science 74(2), 566-575.
| Crossref | Google Scholar |
Vinther M, Reeves SA, Patterson KR (2004) From single-species advice to mixed species management: taking the next step. ICES Journal of Marine Science 61(8), 1398-1409.
| Crossref | Google Scholar |