

Managing pollutant inputs from pastoral dairy farming to maintain water quality of a lake in a high-rainfall catchment
Robert J. Wilcock A J , Ross M. Monaghan B , Richard W. McDowell B , Piet Verburg A , Jonny Horrox C , Catherine Chagué-Goff D E , Maurice J. Duncan F , Alison Rutherford B , Gil Zemansky G , Mike R. Scarsbrook H , Aslan E. Wright-Stow A , Clive Howard-Williams F and Sue Cotton IA National Institute of Water & Atmospheric Research, PO Box 1115, Hamilton, New Zealand.
B AgResearch, Invermay Agricultural Centre, PB 50034, Mosgiel, New Zealand.
C West Coast Regional Council, PO Box 66, Greymouth, New Zealand.
D School of Biological, Earth and Environmental Sciences, University of New South Wales, Sydney, NSW 2052, Australia.
E Australian Nuclear Science and Technology Organisation, Locked Bag 2001, Kirrawee DC, NSW 2232, Australia.
F National Institute of Water & Atmospheric Research, PO Box 8602, Christchurch, New Zealand.
G Geological and Nuclear Sciences, Private Bag 2000, Taupo, New Zealand.
H DairyNZ Ltd, Private Bag 3221, Hamilton, New Zealand.
I 81 Lake Kaniere Road, Hokitika 7811, New Zealand.
J Corresponding author. Email: bob.wilcock@niwa.co.nz
Marine and Freshwater Research 64(5) 447-459 https://doi.org/10.1071/MF12296
Submitted: 16 October 2012 Accepted: 10 January 2013 Published: 3 May 2013
Journal Compilation © CSIRO Publishing 2013 Open Access CC BY-NC-ND
Abstract
A study (2004–11) of a dairy catchment stream entering an oligotrophic lake in an area of very high rainfall (~5 m year–1) yielded median concentrations of total nitrogen (TN), total phosphorus (TP), suspended sediment (SS) and Escherichia coli (E. coli) of 0.584, 0.074 and 3.7 g m–3, and 405/100 mL (most probable number method), respectively. Trend analysis indicated significant (P < 0.01) decreases for TN (–0.08 ± 0.02 g m–3 year–1), TP (–0.01 ± 0.005 g m–3 year–1) and SS (–0.45 ± 0.14 g m–3 year–1) and were partly attributable to improved exclusion of cattle from the stream. Water balance calculations indicated that approximately one-half the rainfall left as deep drainage that by-passed catchment outlet flow recorders. Estimates of catchment yields for TN were improved by taking into account groundwater hydrology and concentrations from well samples. Storm-flow monitoring inflows exceeding the 97.5th percentile contributed ~40% of total loads leaving the catchment so that specific yields for SS, TN and TP augmented by groundwater inputs and storm flows were ~960, 45 and 7 kg ha–1 year–1, respectively. These compared well with modelled results for losses from dairy farms in the catchment of 40–60 kg N ha–1 year–1 and 5–6 kg P ha–1 year–1 and indicated that attenuation losses were relatively small.
Additional keywords: catchment yield, flood frequency, groundwater, nutrients, sediment.
Introduction
Dairy farming in New Zealand has undergone rapid growth over the past 20 years as a result of favourable commodity prices and suitability of the climate and pasture to year-round grazing (Quinn et al. 2009). Agricultural products accounted for 71% of merchandised exports in 2011, with dairy products the single largest contributor (30% of total)1. There is widespread concern, however, about the effects of runoff from dairy farming on sensitive waterways, notably relatively pristine lakes, such as Lake Brunner on the west coast of the South Island, New Zealand. Annual rainfall in the Lake Brunner catchment is highly variable, ranging from 3 m year–1 at the northern end of the lake to 4.8 (maximum 6.8) m year–1 at Inchbonnie, 10 km away at the southern end of the lake. Lake Brunner is oligotrophic (total phosphorus (TP) <10 mg m–3) but Secchi depth transparency has decreased since the early 1990s from ~6.5 to 5.5 m (Verburg et al. 2013). The decrease in transparency corresponds to an observed increase in chlorophyll a, an algal pigment that is a good proxy for algal abundance in the lake. The increase in productivity is a result of increased nutrient loading to the lake as suggested by increased concentrations of total nitrogen (TN) and TP. The loading of nitrogen has increased faster than that of phosphorus, as indicated by an increase in the TN : TP ratio in the lake (Verburg et al. 2013). Lakes, such as Brunner, that are used extensively for recreation during summer may be adversely affected by inputs of faecal matter from the intensively farmed parts of the catchment (Macpherson 2005; Donnison and Ross 2009) Other components of farm runoff (e.g. sediment and dissolved colour) may impair lake aesthetics.
Dairy farming within the lake catchment is carried out either on poorly draining recent alluvial Karangarua gley soils in eastern areas (Allan 1972), or on free-draining soils, as in Inchbonnie, where the dominant soil is Harihari silt loam overlaying alluvium (Zemansky and Horrox 2007). Contouring (‘humping and hollowing’) of the land is carried out widely in the catchment to facilitate drainage and permit grazing in wet conditions. A dairying catchment monitoring study initiated in the Inchbonnie Valley in 2004 sought to understand and mitigate impacts of dairy farming on Lake Brunner. The study was part of a national, catchments-based monitoring study (Best Practice Dairying Catchments for Sustainable Growth) that examined the linkages between dairy farming and receiving water quality and derived appropriate tools for mitigating adverse effects (Wilcock et al. 2007; Monaghan et al. 2008). Two catchments in the study are located in established dairying areas of the North Island, while the Inchbonnie catchment is one of three that are in the South Island of New Zealand (Wilcock et al. 2007; Monaghan et al. 2008).
Water quality and flow data, together with regular surveys of soil and pasture quality, farm production and environmental practices provided a detailed understanding of the land uses in the catchment and their effects on receiving waters. In this paper we describe land–water interactions within the Inchbonnie catchment, the status of its main watercourse, Pigeon Creek, and the wider influence of intensive pastoral dairy farming on Lake Brunner. We also examine the feasibility of management practices for dairy farmers that might prevent further degradation of Pigeon Creek and Lake Brunner. Our principal objective was to determine the feasibility of managing runoff from intensive pastoral dairy farming on the margins of an oligotrophic lake in a high-rainfall climate, such that it does not cause a decline in lake water quality.
Materials and methods
Study area
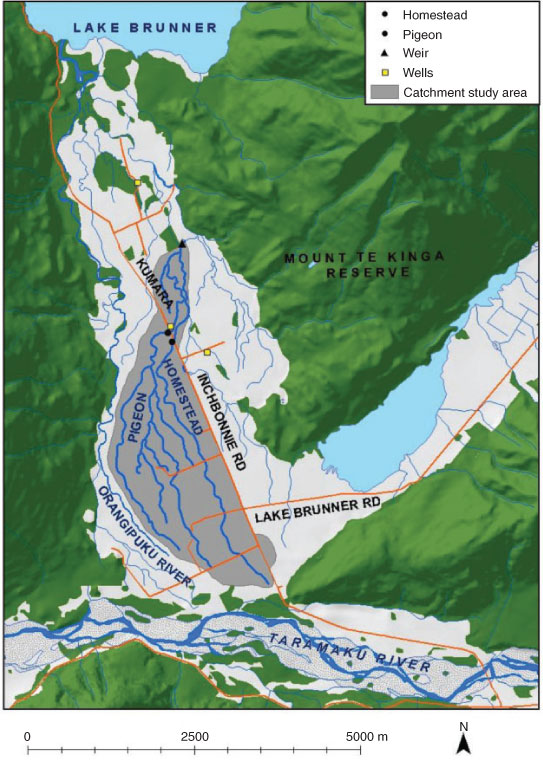
The study catchment (5.98 km2) is located in the Inchbonnie Valley flood plain (42°44′S, 171°28′E) on the west coast of the South Island, New Zealand (Fig. 1). Dairy farming comprises 32.8 km2 (8%) of the Lake Brunner catchment (Rutherford et al. 2008). The catchment is one of five wholly or predominantly dairy farming catchments in New Zealand where changes in water quality that derive from adoption of best management practices, such as riparian stock exclusion and vegetation are being examined (Wilcock et al. 2007; Monaghan et al. 2008). Study catchments (6–41 km2) were chosen to be representative of the farming methods and challenges for environmental sustainability within each region, with stream median flows ranging from ~70 to 500 L s–1 (Wilcock et al. 2007).
|
Pigeon Creek and its principal tributary Homestead Creek are spring-fed by groundwater originating from the Orangipuku and Taramakau Rivers (Zemansky and Horrox 2007) and comprise the main surface waters of the study catchment entering Lake Brunner. A water level weir and recording station on Pigeon Creek provided a continuous record of stream flow from 2004, and defines the Inchbonnie catchment outlet (Fig. 1). Soils are predominantly free-draining stony silt loams (Harihari silt loam: Mottled Fluvial Recent) on gently undulating terrain that is dissected by several intermittently flowing channels (McDowell 2008a). A monthly rainfall record has been maintained in the Inchbonnie area since 1949. Rainfall is uniform throughout the year with a long-term (1949–2006) monthly average of 404 ± 49 mm, ranging from 340 mm in February to 490 mm in October. Features of Pigeon Creek and the Inchbonnie catchment are given in Table 1.
|
Monitoring
Fortnightly water quality sampling was conducted from June 2004 to December 2005 at three sites (Pigeon and Homestead Creeks at the road bridge, and Pigeon Creek at the weir site) (Fig. 1) to determine whether monthly sampling from one site adequately described stream water quality and enabled accurate estimates of loads and specific yields. Robertson and Roerish (1999) concluded that ‘for study durations of two or more years, routine fortnightly sampling is likely to give the least biased and most precise load estimates. Furthermore, additional high-flow samples result in imprecise, overestimated annual loads if samples are consistently collected early in high-flow events’. In our study, monthly sampling was logistically preferable because of the remoteness of the site. From December 2005 onwards sampling occurred at monthly intervals at the weir site only. This paper reports water quality data for the period June 2004 to February 2011. Stream water was analysed for conductivity (±0.01 μS cm–1), in situ temperature (±0.05°C) and dissolved oxygen (DO) (±2% saturation), turbidity (±0.01 NTU), dissolved organic carbon (DOC) (±0.02 g m–3), suspended solids (SS) (±0.5 g m–3), Escherichia coli (±1 MPN (100 mL)–1), nitrate plus nitrite nitrogen (N) (NOX-N) (±0.001 g m–3), ammoniacal N (NH4-N) (±0.001 g m–3), TN (±0.01 g m–3), filterable reactive phosphorus (P) (FRP) (±0.001 g m–3) and TP (±0.001 g m–3). Total organic N (TON) (±0.002 g m–3) was calculated from TN minus DIN, where DIN = NOX-N + NH4-N. Standard protocols for sample collection, stabilisation and analysis were adopted for all water quality variables (APHA 1998; Wilcock et al. 2006). E. coli concentrations were measured by the Colilert most probable number (MPN) method (IDEXX Laboratories, United States). Urea-N was determined for a limited number of water samples (Latchat QuikChem Method 31-206-00-1-A), and black disc water clarity was calculated from turbidity data using a relationship derived from paired turbidity–visibility data for 77 New Zealand river sites in the New Zealand National Rivers Water Quality Network (Smith et al. 1997; Davies-Colley and Smith 2001). A synoptic (longitudinal) survey of Pigeon Creek and its major tributary, Homestead Creek (Fig. 1), was carried out on 30 November 2005 under low-flow conditions when only these two streams had significant flows. The intention of this survey was to identify pollution hotspots and variations in flow through exchange with groundwater. Flow and concentration data were obtained at several points between the source springs and the weir site and mass flows calculated to locate major changes in water quality. Riparian conditions (e.g. fences, cattle crossings, proximity to laneways) were also noted.
Nine storm-events were sampled at the weir site (Fig. 1) at hourly intervals during December 2005 to July 2006 in order to determine whether peak values were under-represented by regular fixed-interval sampling. Samples were analysed for SS, TN and TP for most storms, but also FRP, NH4-N and NOX-N on a few samples stabilised with HgCl2 (40 g m–3).
Groundwater samples were collected from three wells with depths of 11.96, 14.95 and 8.40 m located within the Inchbonnie Valley and close to the five farms in the catchment (Chagué-Goff et al. 2009) (Fig. 1). Water depth ranges in the wells were 3.14–6.13 m, 4.09–6.63 m and 1.20–1.68 m, respectively. Groundwater samples were collected at ~2-month intervals during April 2007 to June 2008 and analysed for FRP, NH4-N, NOX-N, total dissolved N (TDN), total dissolved P (TDP), particulate N (PN), particulate P (PP), TN and TP.
Load calculations
Average annual stream loads of TN, TP and SS at the catchment outlet were calculated from the products of flow-weighted mean concentrations and mean flow, using all of the routine (fortnightly and monthly) monitoring data for the period June 2004 to June 2011 (Hirsch et al. 1982; Ferguson 1987; Robertson and Roerish 1999). Storm-flow concentrations of SS, TN and TP were recorded and relationships with flow evaluated in order to calculate storm loads (Ferguson 1987; Robertson and Roerish 1999). Loads were calculated using percentile flows to weight the contributions from routine monitoring and from flood flows. Specific yields were calculated by dividing loads (kg year–1) by the catchment area (598 ha). Yields were not calculated for E. coli because flood-flows, known to carry more than 90% of annual E. coli loads in dairy farming catchments (Davies-Colley et al. 2008), were not specifically monitored.
Data analysis
Non-parametric statistics were used for central tendency (median) and dispersion (interquartile range, IQR), for selected water quality variables. Trend analysis was carried out using the Seasonal Kendall test on SS, TN, TP and E. coli concentrations with flow adjustment and LOWESS smoothing (Hirsch and Slack 1984) at monthly intervals from June 2004 to February 2011. Medians were compared using the Kruskal–Wallis test (Miller and Miller 1988, pp. 150–152). Water quality summary statistics from Inchbonnie were compared with data pooled from the principal monitoring stations of the four other monitored dairy catchment streams in the New Zealand national monitoring study for dairy catchments, viz. SS (n = 505), NH4-N (552), NOX-N (553), TON (471), TN (537), FRP (532), TP (499), DOC (160) and E. coli (460) (Wilcock et al. 2007).
Farm surveys
Detailed survey interviews of each of the five dairy farmers within the catchment were undertaken biennially to describe current management practices. This information was used to identify trends in farming practices and to provide input data for nutrient and farm systems modelling to identify cost-effective mitigation measures for decreasing contaminant losses from land to water. The survey process addressed both farm productivity and environmental issues. Collected data included farm area, animal stocking rates, fertiliser inputs, information about land drainage and the methods used for managing farm dairy effluent (FDE) and over-wintering animals. Additionally, biennial sampling of 20 soil transects spread across the five farms was undertaken to measure soil physical and chemical properties in the 0–75-mm depth range, including Olsen (bicarbonate-extractable) P concentrations (Olsen and Watanabe 1957). The soil and farm survey information were used to define a ‘typical’ or model dairy farm for which export emissions of N and P to water were derived using the OVERSEER® nutrient budget model (Wheeler et al. 2003). The modelled losses were estimated for the farm boundary and do not fully account for mitigation by riparian or in-stream processes, and are thus maximum values. Losses of N from farms and farm blocks to the atmosphere via ammonia volatilisation and denitrification are estimated by the OVERSEER® model and taken into account for estimates of drainage losses2.
Results
Hydrology
Flows in Pigeon Creek at the weir during June 2004 to December 2009 were 11–21 400 (mean 360) L s–1 (Table 1) and characterised by a high frequency of floods and freshes. The FRE3 statistic is the number of floods per year that are larger than three times the median flow and more than five days apart and is a descriptor of the amount of biological disturbance occurring in a given stream (Clausen and Biggs 1997). The FRE3 statistic for Pigeon Creek was 21, compared with regional average values of 6–20 (Clausen and Biggs 1997), reflecting the high rainfall and frequent storms in the Inchbonnie catchment. Water balances were calculated for each year during 2005–09. Annual averages (±s.d.) for the period were: 4420 ± 669 mm year–1 rainfall, 1927 ± 572 mm year–1 discharge at the Pigeon Creek weir site, and 630 ± 34 mm year–1 evapotranspiration (Penman 1948), giving an average annual loss to groundwater of 1863 ± 255 mm year–1. The mean (±s.e.) annual ratio of groundwater loss-to-measured runoff was 1.0 ± 0.1, so that the total volume of water leaving the site (including groundwater) each year was approximately twice that measured at the flow recorder (weir) site, comprising surface and shallow subsurface water.
Water quality
Box plots comparing water quality data at two upstream sites (Homestead and Pigeon Creek at the road bridge) and the main monitoring site at the weir indicated differences between sites (Fig. 2). Significant differences (P ≤ 0.05) were found between medians for Homestead Creek and the other two sites for NOX-N, TN, FRP and SS. There were no significant differences between the two Pigeon Creek sites (Pigeon and weir). Water quality time-series at 2-weekly and monthly intervals measured at the weir site were generally in agreement, but with some loss of fine detail when going to monthly TP measurements, because of some flood flows that were not included in the monthly sampling (Fig. 3). The storm events sampled during December 2005 and July 2006 had peak flows of 3600–18 000 L s–1 and event-mean flows of 2470–9660 L s–1. The overall mean flow (±s.e.) for all storm events was 4428 ± 400 L s–1, or 12 times the mean annual flow (360 L s–1). Pigeon Creek concentrations of TN and TP did not covary with flow in these events (Fig. 4). Linear regressions of storm-flow concentrations SS, TN and TP with flow yielded slopes of 0.003, 7 × 10⁻⁶ and –1 × 10⁻⁵ g m–3 L–1 s–1, respectively. Mean (±s.e., n = 110) concentrations of SS, TP and TN during storms were 58.7 ± 4.2, 0.487 ± 0.013 and 1.89 ± 0.06 g m–3, compared with means from routine (fortnightly and monthly) monitoring of 8.5 ± 1.6, 0.126 ± 0.015 and 0.842 ± 0.074 g m–3, respectively.
|
|
|
Pigeon Creek water at the weir site was generally well oxygenated (median DO = 95 ± 19% of saturation) and was supersaturated ~40% of the time (Table 2). The electrical conductivity (median 67 ± 10 μS cm–1) was indicative of low-ionic-strength water that is characteristic of headwater rivers in high-rainfall areas of the South Island, New Zealand, where the lithology of the drainage area is predominantly greywacke (Close and Davies-Colley 1990; Maasdam and Smith 1994). Results for the period 2004–11 (Table 2) have data ranges that reflect the differences between source inputs to Pigeon Creek, viz. low-ionic-strength groundwater deriving from springs, and runoff from intensive dairy farming. Time trends of flow-adjusted data from the weir site indicated statistically significant (P < 0.01) decreases for TN (–0.08 ± 0.02 g m–3 year–1), TP (–0.01 ± 0.005 g m–3 year–1) and SS (–0.45 ± 0.14 g m–3 year–1) concentrations from June 2004 to February 2011 (Fig. 5). Division of these trends by median values (Table 2) gives values of the Relative Seasonal Kendall Slope Estimator (RSKE), an index of the relative rate of change among water quality variables (Hirsch and Slack 1984). RSKE values (% year–1) were –13.7 (TN), –13.5 (TP) and –12.2 (SS). There was no significant trend in E. coli concentration. Of the water quality variables measured in routine monitoring, only SS (R2 = 0.58, n = 91) and turbidity (R2 = 0.59, n = 90) were significantly correlated with flow.
|
|
Longitudinal surveys of Homestead and Pigeon Creeks indicated surface-groundwater exchange (accrual and recharge) along the tributaries (Fig. 6). The two principal streams have 18 cattle fords and are near to feed pads and stock laneways that are potential sources of N, P, sediment and faecal matter. Homestead Creek TN mass flows increased at ~2 km from the springs, even though stream flow decreased in that reach, and then declined further downstream. A similar spike was observed in E. coli flux (Fig. 6) suggesting a possible input of farm dairy effluent to the stream. Mass flows of TN and TP in Pigeon Creek generally increased with distance from the source springs, but E. coli fluxes had a small increase at ~2 km downstream and then declined with distance downstream, along with stream flow.

|
Yields
Flows measured during regular monitoring events were 34–2633 L s–1 and fell between the 97th percentile (2395 L s–1) and the 98th percentile (3893 L s–1) of the continuous flow record for 2004–11. Routine monitoring data for June 2004 to June 2011 were used to calculate an average annual load for the Inchbonnie catchment for flows up to the 97.5th percentile. For this calculation we used the mean of all flows when routine sampling occurred (325 L s–1). Storm loads of SS, TN and TP in flows greater than the 97.5th percentile were averaged for storm-flow events from the products of mean concentration × mean flow for all data, based on the lack of a correlation between the variables (Ferguson 1987) (Fig. 4). Total surface water loads for TN, TP and SS (Table 3) were then summed as follows:

|
Storm loads comprised ~40% of total loads of SS, TP and TN at the weir site and were transported in 2.5% of flows.
Groundwater
Very low concentrations of PP and particulate N were found in groundwater samples (Table 4). Concentrations of all forms were reasonably consistent over the 14-month monitoring period and were dominated by dissolved forms. Oxidised N (NOX-N) comprised >90% of TN, and TDP was, on average, ~86% of TP (Table 4). Data ranges and means (±s.d.) for FRP, TP, NOX-N and TN were: 0.003–0.006 (0.004 ± 0.001), 0.003–0.008 (0.007 ± 0.001), 0.367–1.33 (0.637 ± 0.222) and 0.380–1.48 (0.702 ± 0.165) g m–3, respectively. These results suggest that nearly all P lost from the catchment was in surface runoff and that TN drainage losses were predominantly in the form of NOX-N.
|
Farm surveys
Summary details of the five dairy farms are shown in Table 1. There are ~1200 cows in the catchment, effectively all of which are wintered in the catchment on winter runoff units during June and July. Expressed on a per hectare basis, average farm milk solids (MS) production was ~610 kg MS ha–1, supported by annual fertiliser N and P inputs of ~120 and 50 kg ha–1, respectively. Biennial assessments showed that soil physical and biological quality can generally be considered good despite the very wet conditions and the intensive farming operations within the catchment. An exception was the measured soil Olsen P concentrations (Table 1), which increased over time beyond the optimum concentration of 25–30 mg L–1 required for pasture production (McDowell 2008b). These enriched concentrations are uneconomic and pose increased risk of P loss in surface runoff to waterways.
Estimated outputs of P from the five dairy farms in the catchment using the OVERSEER® model ranged between 2 and 7 kg P ha–1 year–1 (Table 5). Losses of N to water estimated from the five farms in the catchment ranged between 18 and 114 kg N ha–1 year–1 (Table 5). The mean annual loss over the 2004–10 survey period was 59 kg N ha–1 year–1. There did not appear to be any clear linkage between management practices documented for any particular survey year and the measured annual losses of N discharged at the catchment outlet.
|
Discussion
Pigeon and Homestead Creeks are low-gradient streams with water quality that is similar to other streams in agriculturally developed catchments in New Zealand (Larned et al. 2004; Wilcock et al. 2007). The very high flood frequency distinguishes the streams by giving them some resilience to pollutant accumulation. Turbidity and SS concentrations in monthly data were strongly correlated (R2 = 0.87, n = 82) and similar to other low-gradient streams in dairying catchments with much lower flood frequencies (Wilcock et al. 2007). Median DOC concentration (1.4 g m–3) was lower than in other dairy catchment streams (Table 2), indicating comparatively less water discoloration by humic substances. Faecal pollution, as indicated by E. coli data, ranged from negligible (5 MPN (100 mL)–1) to very high (41060 MPN (100 mL)–1), but the median concentration (405 MPN (100 mL)–1) was similar to that of other dairy catchment streams (Wilcock et al. 2007). FRP comprised 62% of TP and was similar to that of the other monitored dairy streams (Table 2), compared with an average of ~36% for pastoral streams in general (Larned et al. 2004). Pigeon Creek TN concentrations were generally lower than in the other monitored dairy catchment streams in New Zealand (Table 2). Furthermore, NOX-N comprised a much smaller proportion of TN, being 39% on average, compared with 75% in other dairy catchment streams. TON, 44% of TN, was initially thought to contain a larger than usual proportion of urea-N because of insufficient time between runoff events for complete hydrolysis (of urea to ammonium) to occur within urine patches. However, urea-N, on average, comprised only 10% of TON. Soil organic matter, plant tissue and dung from cows voiding on pasture and from shed washings are likely to be the other reservoirs for waterborne organic N. NH4-N was the third largest component of TN (6%), compared with 1–2% in other monitored dairy catchment streams (Wilcock et al. 2007), suggesting there was incomplete oxidation of ammonium to nitrate before mobilisation of N occurred in drainage and surface runoff, as a result of the high rainfall frequency. The median DIN/FRP mass ratio (6 ± 6) was much lower than the average for other monitored dairy streams (37), indicating potentially N limiting conditions for in-stream vegetation for lengthy periods, as a result of higher than usual P losses in runoff.
Faecal pollution was similar to that in other dairy streams in New Zealand (Table 2) and was likely influenced by the high frequency of surface runoff events, as well as direct inputs of dung from the 18 cattle fords in the stream network. An increase in permanent fencing of the stream channels from 40 to 60% between 2006 and 2008 may have reduced direct inputs of faecal matter (Collins et al. 2007), although there has been no downward trend in E. coli concentration to support this. A similar increase in permanent stock exclusion in the Toenepi (Waikato) dairying catchment likewise did not result in a rapid decrease in E. coli, and it may be that faecal reservoirs (e.g. cow pats) in stream sediment continued to act as a reservoir for faecal microbes for some time after fences had been installed (Crabill et al. 1999; Collins et al. 2007).
Surface water–groundwater interaction
The complex hydrology of the Inchbonnie catchment (multiple exchanges between surface water and groundwater, large volumes of surface runoff and drainage) presents a challenge for mitigating inputs from pastoral dairy farms to Lake Brunner. High rainfall intensity and frequency in the Inchbonnie catchment influences the amount of sediment, faecal matter (viz. E. coli), TN and TP entering surface and groundwater. Flood flows of at least three times the median flow occurred in Pigeon Creek 21 times per year, or every 17 days on average. Thus, a high frequency of runoff-generating rainfall events and differences between soil mineralisation and nitrification rates probably accounts for the relatively greater NH4-N/TN and TON/TN ratios for Pigeon Creek, than for other New Zealand dairy catchment streams (Table 2) where intense rainfall events are much less frequent (Wilcock et al. 2007). The dominance of surface runoff was also cited by Holz (2010) as an explanation for enriched concentrations of NH4-N from an intensively grazed, hump-and-hollowed subcatchment grazed by dairy cows in Tasmania, Australia. Nitrate mobility in that study was primarily via subsurface processes and pathways, as distinct from other forms of N (Holz 2010). It is therefore likely that Inchbonnie N losses to deep groundwater, not detected at the weir, were predominantly in the form of NOX-N originating from applied N that had undergone more extensive mineralisation and nitrification than that lost in surface and subsurface runoff. The mean ratio of NOX-N/TN in surface water at the Inchbonnie weir was 38% (Table 2), in contrast with 88% downstream of Pigeon Creek (unpubl. data) and ratios in other dairy catchment streams that averaged 75% (Wilcock et al. 2007).
A study of groundwater nutrient movement in the Inchbonnie Valley (Zemansky and Horrox 2007) reported that nitrate was the dominant form of N, increasing in concentration from 0.1 g m–3 at the head of the catchment to 0.8 g m–3 near Lake Brunner, where Pigeon Creek is located (Fig. 1). Concentrations of NH4-N and TON were close to detection levels (0.01 g m–3). Based on groundwater drainage of ~2 m year–1, average loads in groundwater were roughly 8–16 kg N ha–1 year–1.
Surface runoff was inferred to be the main mechanism for transfer of P from farmland to Pigeon Creek. Groundwater FRP and TP concentrations in the Inchbonnie Valley from wells were either less than, or marginally above, the 0.004 g m–3 detection limit (Zemansky and Horrox 2007), whereas flow-weighted mean annual TP concentrations of 0.185–0.385 g m–3 were recorded in surface runoff from a trial with different fertiliser applications on a humping and hollowing site within the Inchbonnie Valley (McDowell 2010). The mean annual TP concentration in measured runoff from Inchbonnie catchment would be 0.36 ± 0.14 g m–3 if it were assumed that the 6.79 ± 2.63 kg ha–1 year–1 TP yield (Table 3) derived entirely from surface runoff (1927 ± 570 mm year–1). From this we concluded that surface and shallow subsurface runoff were the predominant pathways for P losses to Pigeon Creek, with losses to deeper groundwater being negligible. On the basis of results from other studies, surface and subsurface runoff were also likely to be the dominant pathways for sediment and faecal bacteria (E. coli) losses from farms (Close et al. 2010).
The water balance calculations indicated that about twice as much water leaves the catchment than is recorded in surface flow. The true TN yield from surface water and groundwater may be estimated from the sum of the weir and groundwater yields. Groundwater concentrations measured in this study (Table 4) coupled with average annual water volume in drainage (1863 ± 255 mm year–1) gave losses to groundwater bypassing the weir of 13 ± 3 kg N ha–1 year–1 and 0.13 ± 0.03 kg P ha–1 year–1. Thus, the average combined specific yields for N and P that take into account surface and subsurface runoff, and deep groundwater losses, were 45 ± 7 kg N ha–1 year–1 and 7.1 ± 2.6 kg P ha–1 year–1 (Table 4). These loads are higher than those recorded in other New Zealand dairy catchments (Wilcock et al. 2007) but are similar to the farm-scale model outputs predicted by OVERSEER® for the five Inchbonnie farms, which averaged 42–72 kg N ha–1 year–1 and 5–6 kg P ha–1 year–1 during 2004–10 (Table 5). The differences between modelled and measured N losses are attributable to mitigation processes such as denitrification occurring along subsurface and groundwater flowpaths and riparian zones, and plant uptake within stream channels (Cooper 1990; Schaller et al. 2004), and are similar to estimated attenuations for catchments of this size made using the SPARROW model (Elliott et al. 2005).
Predicted and measured losses of TP in the Inchbonnie catchment (Table 5) were broadly similar to a mean yield of 8.2 kg P ha–1 year–1 reported for a field study of surface runoff close to this study site (McDowell 2010). The large losses of P for the Inchbonnie catchment (compared with dairy farms outside of the West Coast region) can be attributed to the combination of high source and transport risk factors for P loss from the dairy farms. Source risk factors include the regular inputs of fertiliser P to maintain an enriched soil Olsen P concentration, a soil type with poor P retention (McDowell 2008b), stock stream crossings and runoff of farm dairy effluent (FDE) from the hump-and-hollow land forms common to the dairy farms in the catchment. Leakage from FDE storage or treatment ponds was another potential source risk factor, but one that was difficult to quantify. The high level of transport risk was mostly driven by the rainfall, generating relatively large volumes of runoff from the hump-and-hollowed Harihari soil (McDowell 2008a). This land form provided a fast and direct conduit between P inputs such as dung from grazing animals or effluent and Pigeon creek (McDowell 2008a).
Dairy farming and Lake Brunner
Productivity in Lake Brunner is limited by the availability of P as demonstrated by very low concentrations of inorganic P relative to inorganic N. The DIN-to-FRP mass ratio in the epilimnion is 131 (Verburg et al. 2013). Lake Brunner is vulnerable to changes in P loading because of the large difference between the N and P concentrations relative to the stoichiometric demand of phytoplankton productivity. The major rivers draining dairy farms in this catchment are more P rich than the remaining inflows and the lake waters, and contribute 88% of the lake’s total P load (Rutherford et al. 2008). For the conservation of the trophic state of the lake and maintaining its water quality at a preferred level it will therefore be important to manage P loading to control algal productivity in the lake. The increasing TN : TP ratio may mean that although not currently of primary concern, N inputs to Lake Brunner may have to be managed in future.
Dairy farming is the principal form of intensive agriculture within the Lake Brunner catchment and contributes ~50–60% of nutrient input loads to the lake, despite comprising only 8% of the total catchment area (Rutherford et al. 2008). Farming under the wet conditions experienced at Inchbonnie is challenging. The high rainfall in the catchment means that there are many active pathways for the transport of pollutants from land to water. The relatively high density of surface drainage channels across the catchment (>30 m ha–1) that require fording or crossing by stock are one example. Bridging or culverting all of these points is an expensive exercise that can only be addressed gradually and as cash flow allows. However, measurable progress has been made in fencing cattle out of streams (Table 1). Best management practices for Inchbonnie catchment dairy farmers include: reducing losses of fertiliser P, better management of dairy farm effluent, and managing stock during winter (wintering) so that runoff losses are minimised.
Potential reductions in P losses could be achieved through changes to current fertilisation practices. The Olsen P concentration is a measure of the amount of plant-available P in soil (Olsen and Watanabe 1957). Application of P fertiliser to maintain Olsen P levels no higher than are required or recommended for optimal pasture production is a management action that could lower P loss to Lake Brunner. There is also potential to decrease P losses by altering the form of P fertiliser. Unfortunately, the general rule of applying P fertiliser when the likelihood of surface runoff, and hence P losses, is low is not possible in the Lake Brunner catchment. However, some evidence suggests that the use of a low-water-soluble P product may decrease P losses (compared with a highly water soluble P fertiliser) if surface runoff occurs soon after application (McDowell 2010).
Dairy effluent management practices vary between farms in the catchment, with most farms using storage ponds followed by irrigation. The use of low-rate effluent-application systems that maximise the interaction and opportunity for pollutants in effluent to be retained within the soil is not practised and deserves consideration. Although it is probably not possible to avoid applying FDE when soils are wet and there is a high probability of runoff, the application of FDE to land even with the high rates applied via a travelling irrigator (e.g. 127 mm h–1) is expected to increase the retention of N and P in the soil rather than direct discharge to streams via a pond. A low-rate application system may further improve the chance of N and P retention compared with a travelling irrigator, especially when soils are wet. Ensuring that rainwater runoff from farm structures is diverted away from effluent storage ponds is another measure that will help reduce the volumes of effluent that need to be handled and reapplied to land. This will likely also reduce the runoff of effluent-P applied to land.
Pasture-based wintering systems that incorporate standoff pads, feed pads or sacrifice areas to minimise soil treading and pasture damage have been identified as the most economical options for wintering cows in the Inchbonnie catchment. However, the variable degree of effluent containment from feed and standoff pads was identified as an important issue that could potentially impact on water quality (Monaghan et al. 2007).
Conclusions
Lake Brunner is an oligotrophic lake that is trending towards becoming mesotrophic and is sensitive to inputs of P, which mostly derive from intensive pastoral dairy farming in the catchment. In order to conserve the trophic state of the lake and maintain its water quality at a preferred level it will be important to monitor and manage P loading to control algal productivity in the lake. Inputs of other contaminants, namely TN, SS and faecal microbes, are also of concern for present or future use of the lake.
Monitoring of a dairy farming catchment stream draining to Lake Brunner has shown that monthly sampling from a single site for at least two years was adequate to characterise runoff characteristics, despite the highly variable flow regime. Separate monitoring of storm events improved estimates of loads from the catchment based on monthly water quality sampling and continuous flow data. Storm loads in flows exceeding the 97.5th percentile comprised 40% of total surface and shallow subsurface loads of SS, TN and TP. Groundwater losses comprised ~30% of the TN yield, but only 2% of the TP yield. The main stream, Pigeon Creek, had elevated concentrations of N, P, E. coli and sediment that were similar to those of other streams in predominantly dairying catchments. Runoff concentrations of TN from the catchment had lower proportions of nitrate and higher proportions of ammoniacal and organic N forms than in other dairy catchments.
Estimates of specific yields for TN were greatly improved by taking into account groundwater hydrology and concentrations from well samples. Best estimates for specific yields from intensive dairy farming in the Lake Brunner catchments are ~45 kg N ha–1 year–1 and 7 kg P ha–1 year–1, by comparison with modelled results for losses from the five dairy farms in the catchment of 40–60 kg N ha–1 year–1 and 5–6 kg P ha–1 year–1. This suggests that there was some attenuation of N (but not of P) at the land–water interface. Sediment yields were, on average, 960 kg ha–1 year–1.
Trend analysis of monitoring data from the Inchbonnie catchment for 2004–10 shows that water quality is improving, with downward trends observed for TN, TP and SS concentrations. Farm surveys and interviews suggest that there have been gradual improvements in fertiliser and effluent management practices, riparian protection and the design of farm lanes and stock crossings over the same period. Although the emphasis is presently on managing P losses from agriculture in order to maintain the trophic state of Lake Brunner, the increasing trend in lake N : P ratios is also of concern. Given the large amounts of N and P that are annually cycled on dairy farms and the weather conditions, managing background losses of N and P from dairy pastures in the catchment will be challenging.
Acknowledgements
The authors thank the farmers of the Inchbonnie catchment and their families for their kind hospitality and assistance with the research. We are also grateful to Westland Milk Products for supporting the project. The constructive comments of two anonymous reviewers greatly improved the paper. Funding was provided by the Pastoral 21 Research Consortium (Contract C10X0603).
1 http://www.maf.govt.nz/agriculture/statistics-forecasting/international-trade.aspx [accessed 27 September 2011].
2 http://www.overseer.org.nz/OVERSEERModel/Scope.aspx [accessed 7 September 2012].
References
Allan, G. P. S. (1972). West Coast hill-country soils – their potential for conversion of indigenous forest to exotic forest. New Zealand Journal of Forestry 17, 218–223.APHA (1998). ‘Standard Methods for the Examination of Water and Wastewater.’ 20th edn. (American Public Health Association, American Water Works Association and Water Environment Federation: Washington, DC.)
Chagué-Goff, C., Duncan, M., McDowell, R., and Cotton, S. (2009). Characterising soil nutrient accumulation and loss from dairy farm pastures on the West Coast: Project 06/064-EN069: Final year report 2007–2009. Available at http://maxa.maf.govt.nz/sff/about-projects/search/06-064/final-niwa-report.pdf [accessed 10 August 2011]
Clausen, B., and Biggs, B. J. F. (1997). Relationships between benthic biota and hydrological indices in New Zealand streams. Freshwater Biology 38, 327–342.
| Relationships between benthic biota and hydrological indices in New Zealand streams.Crossref | GoogleScholarGoogle Scholar |
Close, M. E., and Davies-Colley, R. J. (1990). Baseflow water chemistry in New Zealand rivers. 1. Characterisation. New Zealand Journal of Marine and Freshwater Research 24, 319–341.
| Baseflow water chemistry in New Zealand rivers. 1. Characterisation.Crossref | GoogleScholarGoogle Scholar | 1:CAS:528:DyaK3MXisFemt74%3D&md5=a57fc49b747065651c10823f32d6afa6CAS |
Close, M., Noonan, M., Hector, R., and Bright, J. (2010). Microbial transport from dairying under two spray irrigation systems in Canterbury, New Zealand. Journal of Environmental Quality 39, 824–833.
| Microbial transport from dairying under two spray irrigation systems in Canterbury, New Zealand.Crossref | GoogleScholarGoogle Scholar | 1:CAS:528:DC%2BC3cXls1amsr8%3D&md5=fbd2c6d7933b1a1af706583068dda0a6CAS | 20400578PubMed |
Collins, R., McLeod, M., Hedley, M., Donnison, A., Close, M., Hanly, J., Horne, D., Ross, C., Davies-Colley, R., Bagshaw, C., and Matthews, L. (2007). Best management practices to mitigate faecal contamination by livestock of New Zealand waters. New Zealand Journal of Agricultural Research 50, 267–278.
| Best management practices to mitigate faecal contamination by livestock of New Zealand waters.Crossref | GoogleScholarGoogle Scholar |
Cooper, A. B. (1990). Nitrate depletion in the riparian zone and stream channel of a small headwater catchment. Hydrobiologia 202, 13–26.
| 1:CAS:528:DyaK3MXhsV2lsL0%3D&md5=7d0b3ab0f00e68b1dbf8948452051e78CAS |
Crabill, C., Donald, R., Snelling, J., Foust, R., and Southam, G. (1999). The impact of sediment fecal coliform reservoirs on seasonal water quality in Oak Creek, Arizona. Water Research 33, 2163–2171.
| The impact of sediment fecal coliform reservoirs on seasonal water quality in Oak Creek, Arizona.Crossref | GoogleScholarGoogle Scholar | 1:CAS:528:DyaK1MXjslGjsLw%3D&md5=8aa7776eb4c305af87eb451921901767CAS |
Davies-Colley, R. J., and Smith, D. G. (2001). Turbidity, suspended sediment, and water clarity: a review. Journal of the American Water Resources Association 37, 1085–1101.
| Turbidity, suspended sediment, and water clarity: a review.Crossref | GoogleScholarGoogle Scholar |
Davies-Colley, R. J., Lydiard, E., and Nagels, J. W. (2008). Stormflow-dominated loads of faecal pollution from an intensively dairy-farmed catchment. Water Science and Technology 57, 1519–1523.
| Stormflow-dominated loads of faecal pollution from an intensively dairy-farmed catchment.Crossref | GoogleScholarGoogle Scholar |
Donnison, A., and Ross, C. (2009). Survival and retention of Eschenchia coli O157:H7 and Campylobacter in contrasting soils from the Toenepi catchment. New Zealand Journal of Agricultural Research 52, 133–144.
| Survival and retention of Eschenchia coli O157:H7 and Campylobacter in contrasting soils from the Toenepi catchment.Crossref | GoogleScholarGoogle Scholar | 1:CAS:528:DC%2BD1MXhtFOju73P&md5=4a77b10b66734f2f806ae032539b1ee4CAS |
Elliott, A. H., Alexander, R. B., Schwarz, G. E., Shankar, U., Sukias, J. P. S., and McBride, G. B. (2005). Estimation of nutrient sources and transport for New Zealand using the hybrid mechanistic–statistical model SPARROW. Journal of Hydrology. New Zealand 44, 1–27.
Ferguson, R. I. (1987). Accuracy and precision of methods for estimating river loads. Earth Surface Processes and Landforms 12, 95–104.
| Accuracy and precision of methods for estimating river loads.Crossref | GoogleScholarGoogle Scholar |
Hirsch, R. M., and Slack, J. R. (1984). A nonparametric trend test for seasonal data with serial dependence. Water Resources Research 20, 727–732.
| A nonparametric trend test for seasonal data with serial dependence.Crossref | GoogleScholarGoogle Scholar |
Hirsch, R. M., Slack, J. R., and Smith, R. A. (1982). Techniques of trend analysis for monthly water quality data. Water Resources Research 18, 107–121.
| Techniques of trend analysis for monthly water quality data.Crossref | GoogleScholarGoogle Scholar |
Holz, G. K. (2010). Sources and processes of contaminant loss from an intensively grazed catchment inferred from patterns in discharge and concentration of thirteen analytes using high intensity sampling. Journal of Hydrology 383, 194–208.
| Sources and processes of contaminant loss from an intensively grazed catchment inferred from patterns in discharge and concentration of thirteen analytes using high intensity sampling.Crossref | GoogleScholarGoogle Scholar | 1:CAS:528:DC%2BC3cXjtFSisbc%3D&md5=f416dee703e9f6225bc5bb010b2fc8bcCAS |
Larned, S. T., Scarsbrook, M. R., Snelder, T. H., Norton, N. J., and Biggs, B. J. F. (2004). Water quality in low-elevation streams and rivers of New Zealand: recent state and trends in contrasting land-cover classes. New Zealand Journal of Marine and Freshwater Research 38, 347–366.
| Water quality in low-elevation streams and rivers of New Zealand: recent state and trends in contrasting land-cover classes.Crossref | GoogleScholarGoogle Scholar | 1:CAS:528:DC%2BD2cXms1aktL8%3D&md5=669e0da5bfec50ca05a246da69c8dbc8CAS |
Maasdam, R., and Smith, D. G. (1994). New Zealand’s national river water quality network. 2. Relationships between physico-chemical data and environmental factors. New Zealand Journal of Marine and Freshwater Research 28, 37–54.
| New Zealand’s national river water quality network. 2. Relationships between physico-chemical data and environmental factors.Crossref | GoogleScholarGoogle Scholar | 1:CAS:528:DyaK2cXlsVSqtrc%3D&md5=de4611c548206442a15093ced6d10ae5CAS |
Macpherson, C. N. L. (2005). Human behaviour and the epidemiology of parasitic zoonoses. International Journal for Parasitology 35, 1319–1331.
| Human behaviour and the epidemiology of parasitic zoonoses.Crossref | GoogleScholarGoogle Scholar |
McDowell, R. W. (2008a). Phosphorus in humped and hollowed soils of the Inchbonnie catchment, West Coast, New Zealand: II Accounting for losses by different pathways. New Zealand Journal of Agricultural Research 51, 307–316.
| Phosphorus in humped and hollowed soils of the Inchbonnie catchment, West Coast, New Zealand: II Accounting for losses by different pathways.Crossref | GoogleScholarGoogle Scholar | 1:CAS:528:DC%2BD1cXhsFCrsr3F&md5=7c4ac6cfef25b8598c6d886c37f4d885CAS |
McDowell, R. W. (2008b). Phosphorus in humped and hollowed soils of the Inchbonnie catchment, West Coast, New Zealand: I Variation with age and distribution. New Zealand Journal of Agricultural Research 51, 299–306.
| Phosphorus in humped and hollowed soils of the Inchbonnie catchment, West Coast, New Zealand: I Variation with age and distribution.Crossref | GoogleScholarGoogle Scholar | 1:CAS:528:DC%2BD1cXhsFCrsr3E&md5=b2da5a2891014256739cf6ad008b78b0CAS |
McDowell, R. W. (2010). Evaluation of two management options to improve the water quality of Lake Brunner, New Zealand. New Zealand Journal of Agricultural Research 53, 59–69.
| Evaluation of two management options to improve the water quality of Lake Brunner, New Zealand.Crossref | GoogleScholarGoogle Scholar | 1:CAS:528:DC%2BC3cXktlCitLY%3D&md5=4beeaf731f16f9627680fdadc2f3986eCAS |
Miller, J. C., and Miller, J. N. (1988). ‘Statistics for Analytical Chemistry.’ 2nd edn. (Ellis Horwood Limited: Chichester, England.)
Monaghan, R. M., Rutherford, A., McDowell, R. W., and Smith, L. C. (2007). Linkages between land management practices and potential impacts on soil and water quality within the Inchbonnie catchment. AgResearch Client Report to the MAF Sustainable Farming Fund and the Inchbonnie Catchment Group. Available at http://www.maf.govt.nz/sff/about-projects/search/05-047/linkages.pdf
Monaghan, R. M., de Klein, C. A. M., and Muirhead, R. W. (2008). Prioritisation of farm scale remediation efforts for reducing losses of nutrients and faecal indicator organisms to waterways: a case study of New Zealand dairy farming. Journal of Environmental Management 87, 609–622.
| Prioritisation of farm scale remediation efforts for reducing losses of nutrients and faecal indicator organisms to waterways: a case study of New Zealand dairy farming.Crossref | GoogleScholarGoogle Scholar | 1:CAS:528:DC%2BD1cXotFCqsLg%3D&md5=9abe908e19f0e56cdbdd8bb9b3618b88CAS | 18164122PubMed |
Olsen, S. R., and Watanabe, F. S. (1957). A method to determine a phosphorus adsorption maximum of soils as measured by the Langmuir isotherm. Soil Science Society of America Journal 21, 144–149.
| A method to determine a phosphorus adsorption maximum of soils as measured by the Langmuir isotherm.Crossref | GoogleScholarGoogle Scholar | 1:CAS:528:DyaG2sXntlKltA%3D%3D&md5=5db19c5a5b7ed6f6b1bfd05949d08a3bCAS |
Penman, H. L. (1948). Natural evaporation from open water, bare soil and grass. Proceedings of the Royal Society of London. Series A 193, 120–145.
| Natural evaporation from open water, bare soil and grass.Crossref | GoogleScholarGoogle Scholar | 1:STN:280:DyaH1c%2FgvFGltg%3D%3D&md5=9c9e4d4a6f3852d97a85d06acabbf99fCAS |
Quinn, J. M., Wilcock, R. J., Monaghan, R. M., McDowell, R. W., and Journeaux, P. (2009). Grassland farming and water quality in New Zealand. Tearmann: Irish Journal of Agricultural–Environmental Research 7, 1–14.
Robertson, D. M., and Roerish, E. D. (1999). Influence of various water quality sampling strategies on load estimates for small streams. Water Resources Research 35, 3747–3759.
| Influence of various water quality sampling strategies on load estimates for small streams.Crossref | GoogleScholarGoogle Scholar | 1:CAS:528:DC%2BD3cXit1yrtQ%3D%3D&md5=b8e20be2acc71b854f1e52664a4c124fCAS |
Rutherford, K., Chagué-Goff, C., and McKerchar, A. (2008). Nutrient load estimates for Lake Brunner. NIWA Client Report 2008-060 prepared for West Coast Regional Council, National Institute of Water and Atmospheric Research Ltd, Hamilton. Available at www.envirolink.govt.nz/Envirolink-reports/1-NLCC1/157-WCRC17/
Schaller, J. L., Royer, T. V., David, M. B., and Tank, J. L. (2004). Denitrification associated with plants and sediments in an agricultural stream. Journal of the North American Benthological Society 23, 667–676.
| Denitrification associated with plants and sediments in an agricultural stream.Crossref | GoogleScholarGoogle Scholar |
Smith, D. G., Davies-Colley, R. J., Knoeff, J., and Slot, G. W. J. (1997). Optical characteristics of New Zealand rivers in relation to flow. Journal of the American Water Resources Association 33, 301–312.
| Optical characteristics of New Zealand rivers in relation to flow.Crossref | GoogleScholarGoogle Scholar | 1:CAS:528:DyaK2sXjtVyqs7o%3D&md5=ea5f899ffcbd1fd29b3b7ac44accd139CAS |
Verburg, P., Horrox, J., Chaney, E., Rutherford, J. C., Quinn, J. M., Wilcock, R. J., and Howard-Williams, C. W. (2013). Effects of nutrient loading on the trophic state of Lake Brunner. Marine and Freshwater Research 64, 436–446.
| Effects of nutrient loading on the trophic state of Lake Brunner.Crossref | GoogleScholarGoogle Scholar |
Wheeler, D. M., Ledgard, S. F., de Klein, C. A. M., Monaghan, M., Carey, P. L., McDowell, R. W., and Johns, K. L. (2003). OVERSEER™ nutrient budgets – moving towards on-farm resource accounting. Proceedings of the New Zealand Grassland Association 65, 191–194.
Wilcock, R. J., Monaghan, R. M., Quinn, J. M., Campbell, A. M., Duncan, M. J., McGowan, A. W., and Betteridge, K. (2006). Land use impacts and water quality targets in the intensive dairying catchment of the Toenepi Stream, New Zealand. New Zealand Journal of Marine and Freshwater Research 40, 123–140.
| Land use impacts and water quality targets in the intensive dairying catchment of the Toenepi Stream, New Zealand.Crossref | GoogleScholarGoogle Scholar | 1:CAS:528:DC%2BD28Xls1Squrg%3D&md5=37a53d1a8c99a33ce320cbb91f4d62baCAS |
Wilcock, R.J., Monaghan, R.M., Thorrold, B.S., Meredith, A.S., Betteridge, K., and Duncan, M.J. (2007). Land–water interactions in five contrasting dairying watersheds: issues and solutions. Land Use and Water Resources Research 7, 2.1–2.10.
Zemansky, G., and Horrox, J. (2007). Groundwater nutrient movement: Inchbonnie catchment. GNS Science Report 2007/35. Institute of Geological and Nuclear Sciences Ltd. Taupo.