

Computational analysis and expression profiling of two-component system (TCS) gene family members in mango (Mangifera indica) indicated their roles in stress response
Muhammad Sadaqat A , Kinza Fatima A , Farrukh Azeem A , Tayyaba Shaheen A , Mahmood-ur- Rahman A , Tehreem Ali A , Wafa Abdullah I. Al-Megrin B and Muhammad Tahir ul Qamar A *
A
B
Abstract
The two-component system (TCS) gene family is among the most important signal transduction families in plants and is involved in the regulation of various abiotic stresses, cell growth and division. To understand the role of TCS genes in mango (Mangifera indica), a comprehensive analysis of TCS gene family was carried out in mango leading to identification of 65 MiTCS genes. Phylogenetic analysis divided MiTCSs into three groups (histidine kinases, histidine-containing phosphotransfer proteins, and response regulators) and 11 subgroups. One tandem duplication and 23 pairs of segmental duplicates were found within the MiTCSs. Promoter analysis revealed that MiTCSs contain a large number of cis-elements associated with environmental stresses, hormone response, light signalling, and plant development. Gene ontology analysis showed their involvement in various biological processes and molecular functions, particularly signal transduction. Protein–protein interaction analysis showed that MiTCS proteins interacted with each other. The expression pattern in various tissues and under many stresses (drought, cold, and disease) showed that expression levels varied among various genes in different conditions. MiTCSs 3D structure predictions showed structural conservation among members of the same groups. This information can be further used to develop improved cultivars and will serve as a foundation for gaining more functional insights into the TCS gene family.
Keywords: abiotic stress, enrichment analysis, gene expression, histidine kinase, interaction analysis, mango, phylogenetics, two-component system.
Introduction
The two-component system (TCS) is one of the major signal transduction pathways and plays a role in a number of biological activities including oxygen sensing, cell growth, cell division, osmotic sensing, and chemotaxis. In both prokaryotes and eukaryotes, this system regulates the signalling of histidine-aspartate (His-Asp) and responds to environmental stimuli (Schaller et al. 2008; Mochida et al. 2010). Phytohormones also have a role in stress response mediation, which is mediated by cytokinin-responsive TCS (Tran et al. 2010; Nakashima and Yamaguchi-Shinozaki 2013). One of the most common mechanisms for intracellular signalling is protein phosphorylation, which involves the protein kinases using ATP as a phosphate source for the phosphorylation of their substrates. Based on receptor amino acid molecules, TCS is divided into five different classes: (1) histidine kinases (HK); (2) cysteine kinases (CK); (3) aspartyl kinases (AK); (4) serine-threonine kinases (STK); and (5) tyrosine kinases (TK) (Hunter and Cooper 1985).
In plants, two-component signalling genes are involved in several signalling pathways, particularly cytokinin signalling (Tsai et al. 2012; Ahmad et al. 2020). Signalling of a plant hormone, cytokinin involves a His-to-Asp phosphorelay. The cytokinin receptor contains HKs associated with sensory extracellular CHASE (cyclase/histidine kinase-associated sensing extracellular) domain, extra-cytoplasmic hormone binding domain, cytoplasmic HK, and receiver domain (Halawa et al. 2021). TCS perform functions through HKs. This system consists of two signal transducers: (1) HKs; and (2) response regulators (RRs). When HKs recognise the environmental stimuli, it autophosphorylates their conserved histidine (His) residue, which is then transferred to the conserved aspartic (Asp) residue present in RRs. This phosphorylation of RRs contributes to the modulation of downstream signalling, allowing the external stimulus to be transformed into an internal signal. A more complex His-to-Asp phosphorelay is formed in prokaryotes and plants. It employs a hybrid kinase, a protein containing both the HK and Receiver (Rec) domains. Both prokaryotes and eukaryotes possess a signalling element called the His-containing phosphotransfer (HP) domain. Through a multistep His-to-Asp phosphorelay, the phosphate is transferred from HK to RR (Wallmeroth et al. 2019).
Plants have three distinct groups of HKs: (1) phytochromes; (2) cytokinin receptors; and (3) ethylene receptors. These families have significant involvement in phytochrome signalling. All components of TCS, except for ethylene receptors and phytochromes, have conserved His and Asp residues required for phosphotransfer activity in the HK motif. Therefore, phytochromes, cytokinin receptors, and ethylene receptors are known as divergent HKs. AHK1, AHK5, and CKl1 are three Arabidopsis thaliana kinases that do not belong to cytokinin receptors (Liu et al. 2014). Cytokinin receptors are composed of several key components, including an input domain, a Rec domain, multiple transmembrane regions, and a transmitter domain. The transmitter domain contains a conserved histidine/H residue, which plays a crucial role in autophosphorylation at a specific site. Three cytokinin receptors, namely AHK2, AHK3, and AHK4, contain a potential cytokinin recognition site known as the cyclase/CHASE domain. Five ethylene receptors including ETR1, ETR2, ERS1, ERS2, and EIN4 contain a C2H4/ethylene binding domain. Phytochromes contain a chromophore (PHY) and two PAS domains. A conserved motif ‘XHQXKGSSXS’ is present in A. thaliana HPs that controls the transfer of phosphate group from HKs to the Rec domain of RRs. One A. thaliana HP is called a pseudo-His-containing phosphotransfer (HP) protein because it lacks the conserved His residue (Liu et al. 2014).
Based on phylogenetics and domains, response regulators (RRs) can be categorised into four distinct groups: (1) type-A; (2) type-B; (3) type-C; and (4) pseudo-response regulators (PRRs). Rec domains are found in type-A RRs, which are the major transcriptional targets for cytokinin signalling. Type-B RRs function positively in the transcription regulation during cytokinin signalling and contain both Rec and Myb-like DNA-binding domain at C-terminal. Type-C RRs share a closer evolutionary relationship with Type-A RRs and contain the Rec domain but do not possess the Myb-binding domain (Liu et al. 2014). Cytokinin signalling initiates through a multistep phosphorelay mechanism involving cytokinin receptors, phytochromes, and Type-B RRs. Type-B RRs are also responsible for regulating gene expression, including the activation of Type-A RRs through the transmission of the cytokinin signal from the cell membrane to the nucleus. Type-A response regulators (RRs), despite acting as negative regulators in the early stages of signal transduction, play a crucial role in regulating the downstream responses to cytokinins (Sharan et al. 2017). PRRs contain a Rec domain in which the E residue replaces the D residue and a CCT (CONSTANS, CO-like and TOC1) motif (Tan et al. 2019).
Many abiotic stresses have an impact on plant growth and yield. In order to tolerate these environmental stresses, plants have developed complex signalling networks at the molecular, cellular, and system levels. One of these pathways is the TCS pathway, which regulates the process of phosphorylation. This pathway serves as the major signal transduction pathway to enhance stress tolerance (Liu et al. 2014). Previously, these genes have been identified in A. thaliana (Liu et al. 2014), Sorghum bicolor (Zameer et al. 2021), Cicer arietinum (Ahmad et al. 2020), tomato (Solanum lycopersicum) (He et al. 2016a), rice (Oryza sativa) (Du et al. 2007), banana (Musa spp.) (Dhar et al. 2019), wheat (Triticum aestivum) (Zameer et al. 2021), melon (Cucumis melo) (Liu et al. 2020), and soybean (Glycine max) (Tan et al. 2019). The expression pattern of individual genes also varies. The responses to environmental stresses also vary according to the conditions and organism. In S. bicolor, most of the HKs and HPs were upregulated under drought stress while the expression level of RRs was decreased. Similarly, in salt stress, most members of HKs and HPs showed higher expression levels in contrast to RRs. In C. arietinum, CarRR12 and CarRR22 were highly expressed under osmotic and drought stress. In soybean, members from HK and RR families showed higher expression in shoots and roots under dehydration stress. Similarly, A. thaliana HKs detected water stress and triggered downstream reactions thus functioning as osmosensors. Rice OsHK3 was found to be necessary for increased expression of genes and antioxidant enzymes triggered by ABA induction. The expression patterns of various BrTCS genes, such as BrHK3, BrHK4, BrHP1, BrPHP1, BrRR3, BrRR12, BrRR31, BrRR17, BrRR7, BrHK9, BrHP7, BrRR19, BrRR33, and BrRR38, suggest their potential roles in root cytokinin synthesis, vegetative organ development, floral bud formation, seed quality, and yield improvement (Liu et al. 2014). Therefore, an increase in TCS activities by manipulating these genes can be very helpful to cope with more environmental particularly abiotic stresses.
Mangifera indica (mango) belongs to the Anacardiaceae family, which comprises 73 genera and almost 850 species. This fruit grows in tropical and subtropical regions of the world. Mangoes are renowned for being a natural source of dietary fibre, vitamins, proteins, carbohydrates, and essential minerals. They also have a unique flavour and are nutritious. Therefore, it is called as ‘King of Tropical Fruits’. Ripe mango fruit have green, yellow, and dark red, as well as orange skin colours (Quintana et al. 2021; Shi et al. 2022). The mango’s genome was completely sequenced in 2020, opening up greater resources for molecular studies on this fruit (Wang et al. 2020). In this study, the TCS gene family members were identified by searching through the whole mango genome, and the structural, as well as functional characteristics, classification of subgroups and cis-regulatory elements from promoter regions of MiTCSs were analysed. Next, we analysed the expression pattern of MiTCSs at different developmental stages and under various conditions, including drought, cold and disease. These results provide worthy clues for further analysing the biological functions of MiTCSs in various other abiotic stresses.
Materials and methods
Identification and physiochemical characteristics of two-component system genes in Mangifera indica
Full-length sequences of Arabidopsis thaliana L. TCS proteins were downloaded from the Ensemble plants database (https://plants.ensembl.org/index.html) (Bolser et al. 2017) and used as queries to run the BLASTp program (Johnson et al. 2008) to identify the members of TCS proteins in Mangifera indica L. (mango). Pfam (https://pfam.xfam.org/) (Bateman et al. 2004), Simple Modular Architecture Research Tool (SMART ver. 9; http://smart.embl-heidelberg.de/) (Letunic et al. 2015), InterPro (https://www.ebi.ac.uk/interpro/) (Hunter et al. 2009), and conserved domain database (CDD; https://www.ncbi.nlm.nih.gov/Structure/cdd/cdd.shtml) (Marchler-Bauer et al. 2015) were used to verify the relevant conserved domains (CHASE, Resposne_regulator, HATPase_c, HisKA, GAF, PHY, PAS, APS_2, Hpt, Myb_DNA-binding, and CCT) in the putative sequences, excluding the sequences that could not contain the conserved domain. The domain architecture of the remaining identified candidate TCS proteins was constructed using TBtools (Chen et al. 2018). Information about chromosome ID, start site, end site, strands, and numbers of exons was obtained from the Gene-NCBI database (https://www.ncbi.nlm.nih.gov/gene) (Brown et al. 2015). Protein physiochemical characteristics such as the number of amino acids (aa), molecular weight (MW), isoelectric point (pI), instability index (II), aliphatic index (AI), and grand average of hydrophobicity index (GRAVY) values were determined using the ProtParam tool (https://web.expasy.org/protparam/) (Gasteiger et al. 2005). Additionally, utilising the online CELLO2GO server (http://cello.life.nctu.edu.tw/cello2go/), the subcellular localisation of each MiTCS protein was predicted (Yu et al. 2014).
Sequence alignment, phylogenetic analysis, gene structure, and conserved motif analysis of the MiTCSs
To evaluate the evolutionary link of the TCS proteins, a phylogenetic tree of M. indica (MiTCSs), Oryza sativa L. (OsTCSs) (Du et al. 2007), Sorghum bicolor L. (SbTCSs) (Zameer et al. 2021), Cicer arietinum L. (CaTCSs) (Ahmad et al. 2020) and A. thaliana (AtTCSs) (Ahmad et al. 2020) sequences was constructed. ClustalW was utilised to implement multiple sequence alignment through the Gonnet protein weight matrix (Tamura et al., 2021). With 1000 bootstraps, the phylogenetic tree was built using the IQTREE Web Server (http://iqtree.cibiv.univie.ac.at/) (Trifinopoulos et al. 2016). Replicates were designed using the maximum likelihood (ML) method and iTOL: Interactive Tree Of Life (ver. 5, https://itol.embl.de/) (Letunic and Bork 2021) was used for further editing of the tree (Fatima et al. 2023).
The genome and annotation files (GFF) of M. indica was used to analyse the exon-intron pattern of MiTCSs and the structures were displayed using TBtools (Chen et al. 2018). To find common motifs among M. indica proteins, the Multiple Expectation Maximisation for Motif Elicitation (MEME; https://meme-suite.org/meme/) tool was used (Bailey et al. 2009). Except for setting the number of motifs to 20, the default parameters were used to complete this analysis. Then, TBtools was used to visualise the identified motifs (Chen et al. 2018; ul Qamar et al. 2023).
Chromosomal location, gene duplication and Synteny analysis
The location of each TCS gene on the chromosomes of M. indica was taken from the Gene-NCBI database (https://www.ncbi.nlm.nih.gov/gene) (Brown et al. 2015) and mapped on chromosomes using the Gene Location Visualisation Advance tool from TBtools software (Chen et al. 2018). Nucleotide BLAST of the NCBI database (Johnson et al. 2008) was used to check the similarity among coding sequences of MiTCS genes. The genes that have an identity ≥80% were considered duplicated genes. To determine the selective pressure on the duplicated genes, synonymous (Ks) and non-synonymous (Ka) substitution values were calculated using DnaSP ver. 6 software (Rozas et al. 2017). The formula (T = Ks/2λ × 10−6 (where λ = 1.5 × 10⁻⁸ for dicots)) was used to estimate the duplication time in million years (Zameer et al. 2022). Advanced Circos program of TBtools (Chen et al. 2018) software was utilised to show a linkage between chromosomes and duplicated gene pairs.
Gene ontology (GO) enrichment and protein–protein interaction (PPI) of MiTCSs
Amino acid sequences of TCS were subjected to an online tool CELLO2GO server (http://cello.life.nctu.edu.tw/cello2go/) for analysing gene ontology (GO) (Yu et al. 2014). The basic components that were considered for GO annotations were biological processes (BP), molecular functions (MF), and cellular components (CC). STRING database (https://string-db.org/) (Mering et al. 2003) was used to predict protein-protein interactions of MiTCS proteins. The interaction network was imported and visualised interactively using Cytoscape ver. 3.9.1 (Shannon et al. 2003). A degree-based network analysis was conducted using the CytoHubba plugin within Cytoscape to pinpoint proteins with the most extensive interactions (Chin et al. 2014).
Prediction of cis-regulatory elements and expression profiling of MiTCS genes
To predict the cis-regulatory elements in the MiTCS promoters, the 2 kb upstream sequence of start codons was predicted from the mango genome. The promoter sequences of all MiTCS genes were observed using the PlantCARE database (https://bioinformatics.psb.ugent.be/webtools/plantcare/html/) (Rombauts et al. 1999), and the diagram was illustrated using TBtools software.
The expression levels of all MiTCS genes at six diverse organs/developmental stages (leaf, little fruit, expanding fruit, green fruit, half yellow fruit, and whole yellow fruit), drought stress, cold stress, and disease stress were evaluated using transcriptome datasets available at the NCBI Sequence Read Archive (SRA) database (https://www.ncbi.nlm.nih.gov/sra) under BioProject: PRJNA797728, PRJNA1039530, PRJNA304093, and PRJNA855362, respectively. The library layout of PRJNA797728 and PRJNA1039530 was paired, whereas the library layout of PRJNA304093 and PRJNA855362 was single. From PRJNA855362, only six SRA accessions were chosen, in which SRR19975603, SRR19975604, and SRR19975603 were chosen for control, whereas SRR19975602, SRR19975613, and SRR19975614 were chosen for treatment. The GFF were downloaded from the Genome-NCBI database (https://www.ncbi.nlm.nih.gov/genome/). FastQC was utilised to check the quality of reads (Andrews 2010). Indexes of M. indica genome sequences were built using HISAT2 ver. 2.2.1 and high-quality reads were mapped to the M. indica genome (Kim et al. 2019). The expression level of annotated genes was calculated using the StringTie ver. 2.1.7 software (Kovaka et al. 2019). Finally, fragments per kilobase of transcript per million (FPKM) values of individual genes were used to generate the heatmap that was illustrated using TBtools software (Chen et al. 2020).
3D structure prediction
The 3D structure of a protein is necessary for its proper functioning. Based on expression analysis, 3D structures of 12 MiTCS proteins were predicted using Alphafold2 (https://colab.research.google.com/github/sokrypton/ColabFold/blob/main/AlphaFold2.ipynb) (Jumper et al. 2021). The predicted structures were validated using SAVES (https://saves.mbi.ucla.edu) server (Elshemey et al., 2010) and MolProbity (http://molprobity.biochem.duke.edu/) (Davis et al. 2007). BIOVIA discovery studio visualiser ver. 3 (Discovery Studio 2008) was used to visualise these structures.
Results
Identification of TCS genes in M. indica
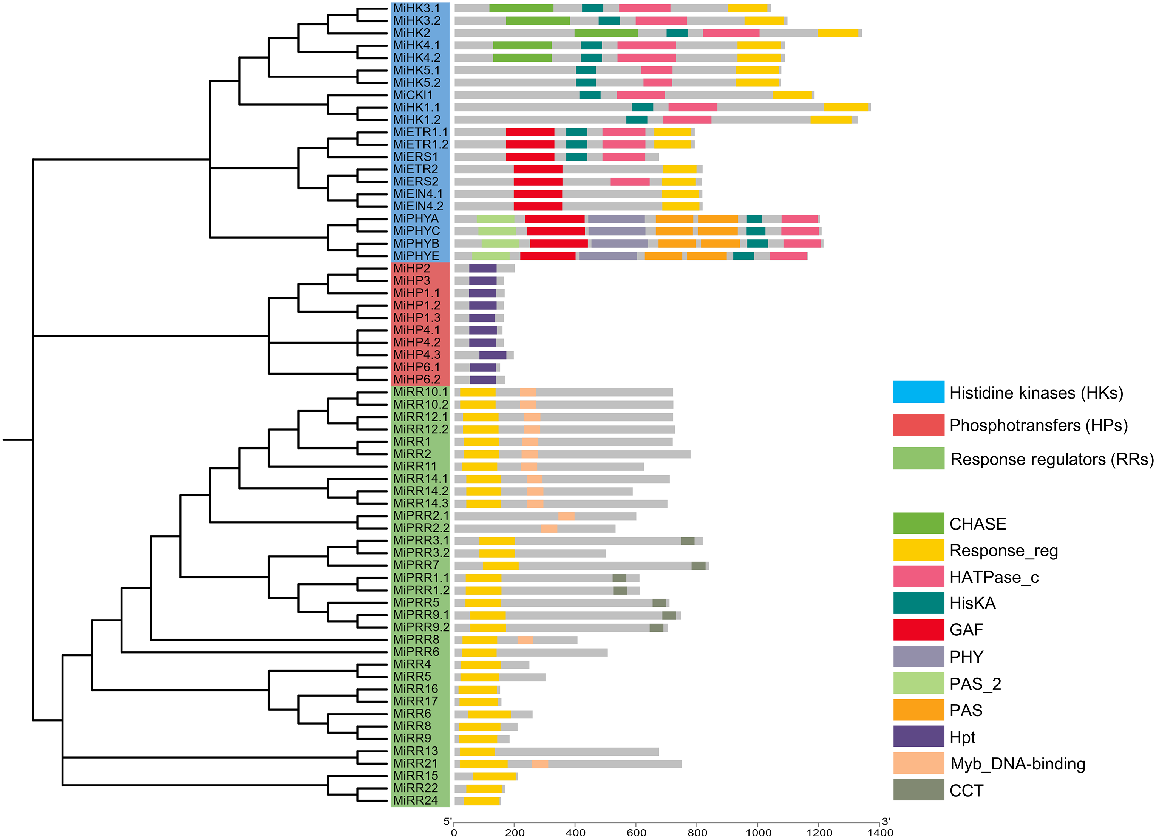
The genome of M. indica contained a total of 65 TCS genes, which were further classified into 21 HKs, 10 HPs, and 34 RRs. Details of TCS reported in other plants are in Fig. 1.

Histidine kinases (HKs) proteins in M. indica
In M. indica, we found 10 genes that encode members of the cytokinin receptor family including MiHK1.1, MiHK1.2, MiHK2, MiHK3.1, MiHK3.2, MiHK4.1, MiHK4.2, MiHK5.1, MiHK5.2, and MiCKl1. All members had the conserved residues needed for the proper functioning of HK activity. Domain analysis of these HKs revealed that all of the members had a conserved HisKa domain with a conserved His phosphorylation site. Additionally, each of the 10 members had a conserved RR (Rec) domain that contains a highly conserved Asp that serves as the photoreceptor. While other domains including CHASE and HATPase_c were also present in some of these members.
Seven ethylene receptors were found in M. indica named MiETR1.1, MiETR1.2, MiETR2, MiERS1, MiERS2, MiEIN4.1, and MiEIN4.2. All members contained the GAF and Response_reg domains while HisKa and HATPase_c was also present in some members. Four phytochromes/photoreceptors were also found in M. indica’s genome (MiPHYA, MiPHYB, MiPHYC, and MiPHYE). All these members contained many domains: one PAS_2, one GAF, one PHY, two PAS, one HisKA, and one HATPase_c (Fig. 2, see Supplementary Table S1).
Histidine (His)-containing phosphotransfer (HPs) proteins in M. indica
A total of 10 His-containing phosphotransfers were identified in the M. indica genome and all these members contained a single Hpt domain (Fig. 2, Table S1).
Response regulators (RRs) proteins in M. indica
RRs function as signal transducers in the TCS signalling pathway and are classified into four groups. Sequences that process a Rec domain with a short extension at C-terminus are grouped as Type-A RRs. These RRs contain conserved residues of aspartic acid (D) and Lysine (K) in a conserved D-D-K motif. This motif receives the final phosphate group using D- residue present at N-terminal. Sequences with Rec and an additional MYB domain are classified as Type-B RRs and they have roles as transcriptional factors. These types of RRs have a highly conserved D residue at the N terminal that starts the downstream process by receiving the phosphate group. Whereas, Type-C RRs lack MYB domain but have Rec domain. Sequences that contain pseudo-Rec domain and CCT motif are termed as PRRs and they have roles in circadian rhythms.
The mango genome was found to contain eight Type-A RRs, 12 Type-B RRs, two Type-C RRs, and 12 PRRs. All members from the Type-A RRs subgroup contained a Response_reg domain. Similarly, Type-B RRs members also contained the Response_reg domain but most of the members also contained the Myb_DNA-binding domain as well. Members of the Type-C RR subgroup, MiRR22 and MiRR24 also contained one Response_reg domain. 12 PRRs in the mango genome had a Myb_DNA-binding domain, Response_reg domain, and CCT motif. These PRRs are further classified into two subgroups: Type-B PRRs and Cloak-associated PRRs. Type-B PRRs contain the Myb_DNA-binding domain with no CCT motif. These included MiPRR2.1, MiPRR2.2, MiPRR3.2, MiPRR6, and MiPRR8. While cloak-associated PRRs contain CCT motifs with D and K residues. These included MiPRR1.1, MiPRR1.2, MiPRR3.1, MiPRR5, MiPRR7, MiPRR9.1, and MiPRR9.2 (Fig. 2, Table S1).
Physiochemical characteristics of MiTCS proteins
Comprehensive information regarding 65 MiTCSs is in Table 1. The mango genome contains 20 chromosomes, whereas, MiTCSs are located on 18 chromosomes. The numbers of exons present ranged from 1 to 13 with the lowest number present in Type-C RRs and the highest being present in HKs. The protein length (aa) ranged from 140 to 1281 aa. The proteins with larger sizes were the MiHKs. The smallest ones were MiHPs with a length between 140 and 185 aa.
| Gene name | Gene ID | Chr | Start | End | Strand | Exon | aa | Molecular weight (kDa) | Isoelectric point | Instability Index | Aliphatic index | GRAVY | Cell location | |
|---|---|---|---|---|---|---|---|---|---|---|---|---|---|---|
| Histidine kinases (HKs) | ||||||||||||||
| MiHK1.1 | LOC123212247 | 1 | 6892687 | 6898971 | + | 13 | 1281 | 142.58 | 8.71 | 46.37-unst | 92.72 | −0.225 | Plasma membrane | |
| MiHK1.2 | LOC123198852 | 16 | 701888 | 708185 | + | 13 | 1240 | 137.95 | 8.65 | 44-unst | 92.24 | −0.213 | Plasma membrane, Nuclear | |
| MiHK2 | LOC123223585 | 8 | 6409298 | 6418698 | + | 13 | 1253 | 140.83 | 7.02 | 44.86-unst | 90.25 | −0.118 | Plasma membrane | |
| MiHK3.1 | LOC123216913 | 5 | 12622367 | 12629421 | + | 10 | 973 | 109.22 | 6.2 | 38.11 | 92.22 | −0.186 | Plasma membrane | |
| MiHK3.2 | LOC123213689 | 4 | 20143779 | 20150493 | + | 10 | 1024 | 114.69 | 6.41 | 36.99 | 88.69 | −0.161 | Plasma membrane | |
| MiHK4.1 | LOC123217025 | 5 | 6162197 | 6169759 | + | 11 | 1017 | 112.66 | 6.48 | 39.07 | 87.43 | −0.141 | Cytoplasmic, Plasma membrane | |
| MiHK4.2 | LOC123214436 | 4 | 3587635 | 3596042 | – | 11 | 1016 | 112.48 | 6.21 | 39.05 | 88.58 | −0.125 | Cytoplasmic, Plasma membrane | |
| MiHK5.1 | LOC123200735 | 17 | 624715 | 630448 | – | 12 | 1005 | 112.83 | 5 | 52.42-unst | 82.02 | −0.488 | Nuclear | |
| MiHK5.2 | LOC123194377 | 13 | 14313284 | 14319564 | + | 12 | 1004 | 113.27 | 5.04 | 51.21-unst | 81.81 | −0.48 | Nuclear, Cytoplasmic | |
| MiCKl1 | LOC123216700 | 5 | 17311709 | 17316079 | + | 7 | 1107 | 121.87 | 7.3 | 42.25-unst | 94.2 | −0.174 | Plasma membrane | |
| MiETR1.1 | LOC123201475 | 18 | 8302251 | 8314020 | + | 6 | 739 | 82.40 | 6.57 | 45.47-unst | 109.17 | 0.174 | Plasma membrane | |
| MiETR1.2 | LOC123223709 | 1 | 24445027 | 24449637 | + | 6 | 739 | 82.52 | 7.11 | 42.66-unst | 109.07 | 0.145 | Plasma membrane | |
| MiETR2 | LOC123211222 | 3 | 20143709 | 20148333 | + | 2 | 763 | 84.87 | 6.53 | 45.2-unst | 101.81 | 0.076 | Plasma membrane | |
| MiERS1 | LOC123217018 | 5 | 17085690 | 17089246 | – | 5 | 629 | 70.43 | 7.05 | 40.68-unst | 107.09 | 0.082 | Plasma membrane | |
| MiERS2 | LOC123220977 | 7 | 18754383 | 18758434 | + | 2 | 761 | 84.68 | 6.24 | 42.16-unst | 102.44 | 0.109 | Plasma membrane | |
| MiEIN4.1 | LOC123221240 | 7 | 15029305 | 15033281 | – | 2 | 762 | 85.73 | 6.32 | 39.04 | 99.48 | 0.072 | Plasma membrane | |
| MiEIN4.2 | LOC123202082 | 2 | 21190883 | 21196071 | + | 2 | 763 | 85.85 | 8.76 | 40.11-unst | 102.06 | 0.059 | Plasma membrane | |
| MiPHYA | LOC123208390 | 2 | 191805 | 200671 | + | 4 | 1124 | 124.83 | 5.95 | 41.12-unst | 95.75 | −0.104 | Cytoplasmic | |
| MiPHYB | LOC123220482 | 7 | 19860600 | 19867467 | + | 4 | 1135 | 126.34 | 5.89 | 45.48-unst | 92.69 | −0.136 | Cytoplasmic | |
| MiPHYC | LOC123216883 | 5 | 13591105 | 13597648 | – | 4 | 1129 | 125.65 | 5.62 | 43.47-unst | 96.49 | −0.106 | Cytoplasmic, Nuclear | |
| MiPHYE | LOC123193337 | 12 | 14647427 | 14653241 | – | 4 | 1088 | 122.42 | 6.14 | 46.08-unst | 96.49 | −0.134 | Cytoplasmic | |
| Phosphotransfer proteins (HPs) | ||||||||||||||
| MiHP1.1 | LOC123220177 | 7 | 17385520 | 17387277 | – | 6 | 154 | 17.77 | 4.82 | 51.74-unst | 84.09 | −0.314 | Nuclear, Cytoplasmic | |
| MiHP1.2 | LOC123221649 | 7 | 14055070 | 14057055 | + | 6 | 151 | 17.58 | 4.94 | 39 | 100 | −0.373 | Nuclear, Cytoplasmic | |
| MiHP1.3 | LOC123204667 | 2 | 22640279 | 22642749 | – | 6 | 151 | 17.67 | 4.81 | 49.9-unst | 94.77 | −0.438 | Nuclear | |
| MiHP2 | LOC123215680 | 5 | 16401384 | 16404040 | + | 6 | 185 | 21.24 | 5.15 | 43.88-unst | 84.7 | −0.225 | Extracellular, Cytoplasmic | |
| MiHP3 | LOC123222828 | 8 | 3756021 | 3758633 | – | 6 | 152 | 17.37 | 4.87 | 39.49 | 89.08 | −0.368 | Nuclear | |
| MiHP4.1 | LOC123194041 | 13 | 12975572 | 12983417 | – | 6 | 147 | 16.98 | 5.07 | 45.2-unst | 75.03 | −0.652 | Nuclear | |
| MiHP4.2 | LOC123219792 | 6 | 7424007 | 7425534 | + | 6 | 151 | 17.53 | 8.38 | 48.26-unst | 65.36 | −0.841 | Nuclear, Cytoplasmic | |
| MiHP4.3 | LOC123206378 | Un | 263458 | 264954 | – | 6 | 182 | 21.16 | 8.7 | 59.62-unst | 70.27 | −0.618 | Nuclear, Mitochondrial | |
| MiHP6.1 | LOC123217958 | 6 | 5687566 | 5688561 | + | 4 | 140 | 16.22 | 6.58 | 42.74-unst | 102.36 | −0.216 | Extracellular, Nuclear | |
| MiHP6.2 | LOC123212489 | 3 | 6758068 | 6759496 | + | 5 | 156 | 18.03 | 7.05 | 52.33-unst | 97.56 | −0.233 | Extracellular, Nuclear | |
| Response regulators (RRs) | ||||||||||||||
| Type-A RRs | ||||||||||||||
| MiRR4 | LOC123215736 | 5 | 10344405 | 10345795 | + | 5 | 230 | 25.21 | 4.94 | 85.86-unst | 80.87 | −0.408 | Nuclear | |
| MiRR5 | LOC123203891 | 20 | 2348763 | 2350970 | – | 5 | 262 | 31.13 | 5.08 | 76.23-unst | 69.96 | −0.831 | Nuclear | |
| MiRR6 | LOC123229745 | 11 | 6015656 | 6018237 | + | 5 | 240 | 26.83 | 4.82 | 68.74-unst | 80.13 | −0.746 | Nuclear | |
| MiRR8 | LOC123192575 | 12 | 7466464 | 7467647 | + | 2 | 194 | 21.58 | 6.12 | 38.33 | 96.39 | −0.401 | Nuclear, Cytoplasmic | |
| MiRR9 | LOC123193623 | 12 | 7458211 | 7459244 | + | 2 | 169 | 18.95 | 6.9 | 43.04-unst | 96.27 | −0.16 | Cytoplasmic, Nuclear | |
| MiRR15 | LOC123194413 | 13 | 14362886 | 14363976 | + | 3 | 195 | 21.53 | 5.34 | 59.32-unst | 78.51 | −0.291 | Nuclear, Extracellular | |
| MiRR16 | LOC123192694 | 12 | 10078388 | 10079724 | + | 5 | 140 | 15.44 | 5.46 | 37.26 | 95.29 | −0.149 | Nuclear, Extracellular | |
| MiRR17 | LOC123227009 | 10 | 5629477 | 5630828 | – | 5 | 144 | 16.02 | 6.15 | 47.9-unst | 97.36 | −0.144 | Chloroplast, Extracellular | |
| Type-B RRs | ||||||||||||||
| MiRR1 | LOC123210537 | 3 | 17880831 | 17884953 | – | 6 | 671 | 73.53 | 6 | 49.88-unst | 76.1 | −0.516 | Nuclear | |
| MiRR2 | LOC123221187 | 7 | 19629976 | 19634107 | + | 6 | 726 | 79.87 | 6.8 | 50.87-unst | 82.41 | −0.351 | Nuclear | |
| MiRR10.1 | LOC123194683 | 13 | 14923881 | 14931655 | – | 6 | 672 | 74.31 | 5.87 | 43.81-unst | 76.41 | −0.548 | Nuclear | |
| MiRR10.2 | LOC123200993 | 17 | 325518 | 331954 | + | 6 | 673 | 74.34 | 5.82 | 45.46-unst | 73.4 | −0.579 | Nuclear | |
| MiRR11 | LOC123215827 | 5 | 12408960 | 12415078 | + | 5 | 583 | 65.73 | 5.53 | 53.27-unst | 79.19 | −0.512 | Nuclear | |
| MiRR12.1 | LOC123200785 | 17 | 12933043 | 12939034 | – | 6 | 672 | 73.63 | 5.31 | 42.72-unst | 74.4 | −0.535 | Nuclear | |
| MiRR12.2 | LOC123194265 | 13 | 293570 | 298033 | + | 6 | 678 | 74.33 | 5.57 | 43.41-unst | 74.65 | −0.547 | Nuclear | |
| MiRR13 | LOC123225660 | 9 | 2099472 | 2104044 | – | 8 | 629 | 69.40 | 8.44 | 49.86-unst | 72.56 | −0.538 | Nuclear | |
| MiRR14.1 | LOC123213137 | 4 | 3106256 | 3111685 | + | 5 | 662 | 71.51 | 5.53 | 46.78-unst | 86.89 | −0.295 | Nuclear | |
| MiRR14.2 | LOC123217525 | 5 | 3962332 | 3966953 | – | 6 | 548 | 59.59 | 5.82 | 40.75-unst | 85.57 | −0.299 | Nuclear, Cytoplasmic | |
| MiRR14.3 | LOC123217369 | 5 | 3354565 | 3359174 | – | 5 | 655 | 70.86 | 5.89 | 47.42-unst | 84.38 | −0.317 | Nuclear | |
| MiRR21 | LOC123198053 | 15 | 2493640 | 2497626 | – | 9 | 699 | 77.35 | 5.35 | 44.19-unst | 71.7 | −0.49 | Nuclear, Cytoplasmic | |
| Type-C RRs | ||||||||||||||
| MiRR22 | LOC123216247 | 5 | 14550607 | 14551531 | + | 1 | 156 | 17.48 | 8.95 | 45.85-unst | 91.15 | −0.399 | Nuclear, Cytoplasmic | |
| MiRR24 | LOC123223289 | 8 | 5473117 | 5473780 | – | 1 | 142 | 15.91 | 9.41 | 34.96 | 98.8 | −0.243 | Cytoplasmic, Mitochondrial | |
| Pseudo-RRs | ||||||||||||||
| MiPRR1.1 | LOC123211455 | 3 | 11553916 | 11558699 | – | 6 | 569 | 63.45 | 5.67 | 54.76-unst | 68.05 | −0.634 | Nuclear | |
| MiPRR1.2 | LOC123204527 | 20 | 8639517 | 8644270 | – | 6 | 571 | 63.57 | 5.77 | 53.5-unst | 66.95 | −0.624 | Nuclear | |
| MiPRR2.1 | LOC123215783 | 5 | 16212165 | 16218146 | + | 11 | 559 | 62.06 | 6.04 | 55.27-unst | 72.36 | −0.591 | Nuclear | |
| MiPRR2.2 | LOC123224167 | 8 | 3900744 | 3906868 | – | 10 | 495 | 55.50 | 6.37 | 58.44-unst | 72.81 | −0.639 | Nuclear, Cytoplasmic | |
| MiPRR3.1 | LOC123225527 | 9 | 13194891 | 13201869 | – | 10 | 765 | 83.41 | 5.97 | 37.21 | 64.09 | −0.765 | Nuclear | |
| MiPRR3.2 | LOC123206835 | Un | 196560 | 201060 | + | 6 | 465 | 51.14 | 5.22 | 43.12-unst | 72.28 | −0.66 | Nuclear | |
| MiPRR5 | LOC123192988 | 1 | 23325571 | 23330066 | + | 8 | 661 | 73.08 | 6.41 | 51.85-unst | 70.97 | −0.592 | Nuclear | |
| MiPRR6 | LOC123213605 | 4 | 725276 | 727997 | – | 6 | 471 | 53.02 | 9.4 | 45.98-unst | 80.59 | −0.565 | Nuclear | |
| MiPRR7 | LOC123219748 | 1 | 2609877 | 2616610 | – | 8 | 783 | 86.56 | 7.01 | 46.74-unst | 73.41 | −0.711 | Nuclear | |
| MiPRR8 | LOC123216569 | 5 | 19693077 | 19695860 | – | 5 | 378 | 42.64 | 5.19 | 41.08-unst | 81.24 | −0.407 | Nuclear | |
| MiPRR9.1 | LOC123223566 | 8 | 2326536 | 2331444 | + | 8 | 696 | 76.91 | 6.82 | 51.46-unst | 68.79 | −0.569 | Nuclear | |
| MiPRR9.2 | LOC123216423 | 5 | 18123725 | 18128385 | – | 9 | 657 | 73.08 | 6.24 | 53.27-unst | 70.81 | −0.575 | Nuclear | |
Un, unmapped; unst, unstable.
The molecular weight (MW) for MiTCSs was found between 142.58 and 15.91 kDa. Their isoelectric point (pI) values ranged from 4.81 to 9.41, instability index (II) from 34.96 (stable) to 85.86 (unstable), aliphatic index (AI) from 64.09 to 109.17, and grand average of hydropathicity index (GRAVY) values from −0.765 to 0.174. The proteins were mostly localised in the nuclear membrane, plasma, and cytoplasmic membranes. Most of the HKs, HPs, RRs, and PRRs were localised in the nuclear membrane. Ethylene receptors were localised in the plasma membrane. Fewer proteins were also present in the extracellular membrane, chloroplast, and mitochondria.
Phylogenetic relationships among TCS proteins
To determine comprehensively the evolutionary as well as the phylogenetic relationship among the TCS proteins from M. indica (65 members), A. thaliana (47 members) (Cheng and Kieber 2014), O. sativa (37 members) (Du et al. 2007), C. arietinum (51 members) (Ahmad et al. 2020), and S. bicolor (37 members) (Zameer et al. 2021), a phylogenetic tree was generated. This tree was divided into three main groups (HKs, HPs, and RRs) and their further subdivisions comprised 11 sub-groups (Fig. 3). In the first component of the TCS cascade, HK proteins were divided into six groups. These include CKl1, AHK1, CKl2, cytokinin receptors, ethylene receptors, and phytochrome receptors. CKl1, AHK1, and CKl2 contain five MiTCSs including MiCKl1, MiHK1.1, MiHK1.2, MiHK5.1, and MiHK5.2. All these members are orthologous to Arabidopsis TCS proteins. Cytokinin receptors include MiHK4.1, MiHK4.2, MiHK2, MiHK3.1, and MiHK3.2. All these members shared great homology with Arabidopsis members AHK2, AHK3, and AHK4. Ethylene receptor subfamily included seven members: MiETR1.1, MiETR1.2, MiETR2, MiERS1, MiERS2, MiEIN4.1, and MiEIN4.2. These also shared homologous relationships with Arabidopsis members ETR1, ERS1, and EIN4. Phytochrome receptors contained four members.
Phylogenetic relationships among MiTCSs, AtTCSs, OsTCSs, CaTCSs, and SbTCSs. Multiple sequence and tree construction were performed using ClustalW and IQTREE. Three main groups are subdivided into further subgroups indicated by specific colours.
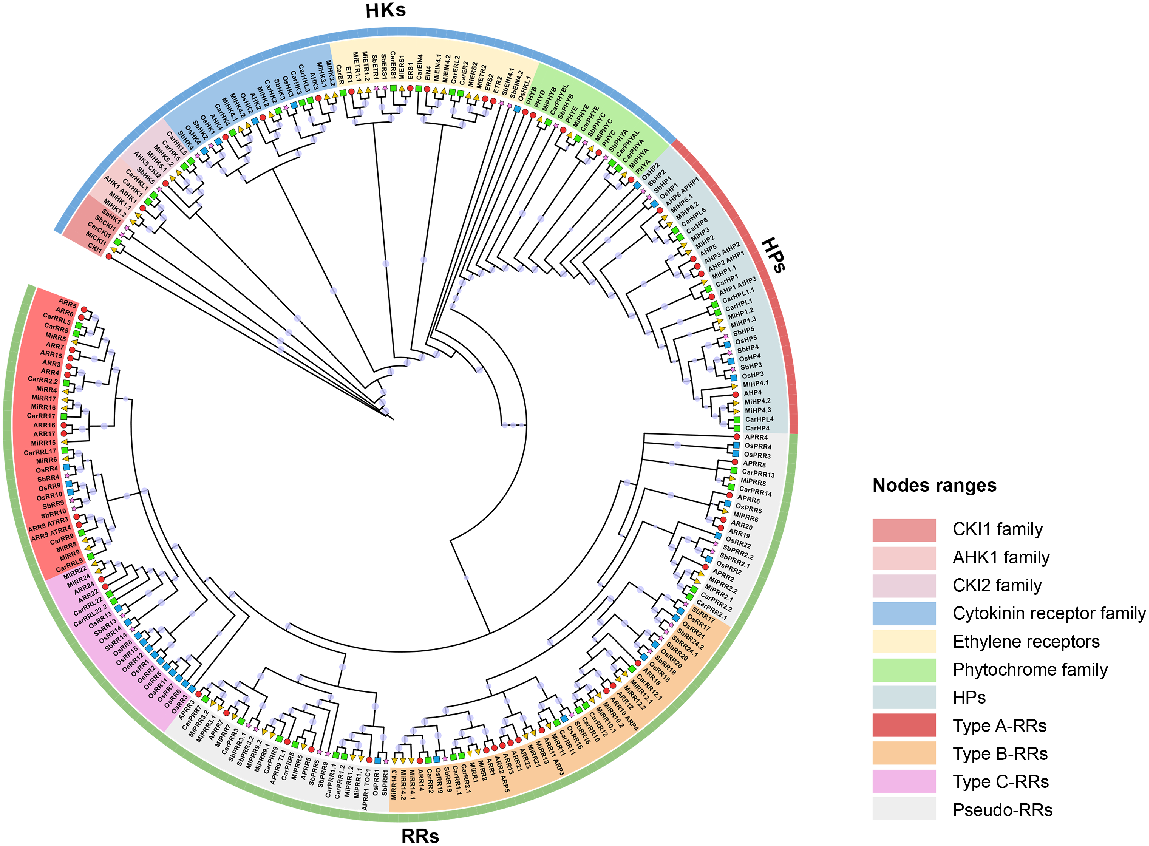
All HPs members were clustered in one clade. These members shared great homology and they may share corresponding functions. Arabidopsis contains six family members and in this study, we identified 10 family members. Greater homologous relationships were found among all the members of the five plants.
RRs formed the largest clade on the tree with four subgroups. Type-A RRs group contained eight and 10 members from mango and Arabidopsis, respectively. Type-B RRs consisted of 12 and 10 members from mango and Arabidopsis, respectively. Type-C RRs shared a clade consisting of two members from mango and Arabidopsis each. PRRs formed a clade with eight and five members from mango and Arabidopsis, respectively. All these RR members and from other plants shared significant homology among themselves.
Gene structure and conserved motifs analysis
The arrangement of exons and introns in MiTCSs was studied because gene structure can reveal more details about the evolutionary relationship within a gene family. HKs has exon ranging from 7 to 13, and introns ranging from 6 to 12. The ethylene receptors family had 2–6 exons and 1–5 introns. In the phytochromes family, all the members contain four exons and three introns. In HP family members, exons ranged from 4 to 6, and introns ranged from 3 to 5. The members of Type-A RRs have exons ranging from 2 to 6, and introns ranging from 1 to 5. In contrast, Type-B RRs contain 5–8 exons and 4–9 introns. Type-C RRs contain only one exon and zero introns. Additionally, PRRs contain 5–11 exons and 4–10 introns. These results indicated that members of the same family have a similar exon-intron organisation (Fig. 4a).
Phylogenetic tree constructed using IQTREE using MiTCSs. Blue labels, HKs; red labels, HPs; green labels, RRs. (a) Gene structures were determined using TBtools, (b) conserved motifs determined through MEME suits. CDS, coding sequence; UTR, untranslated region.
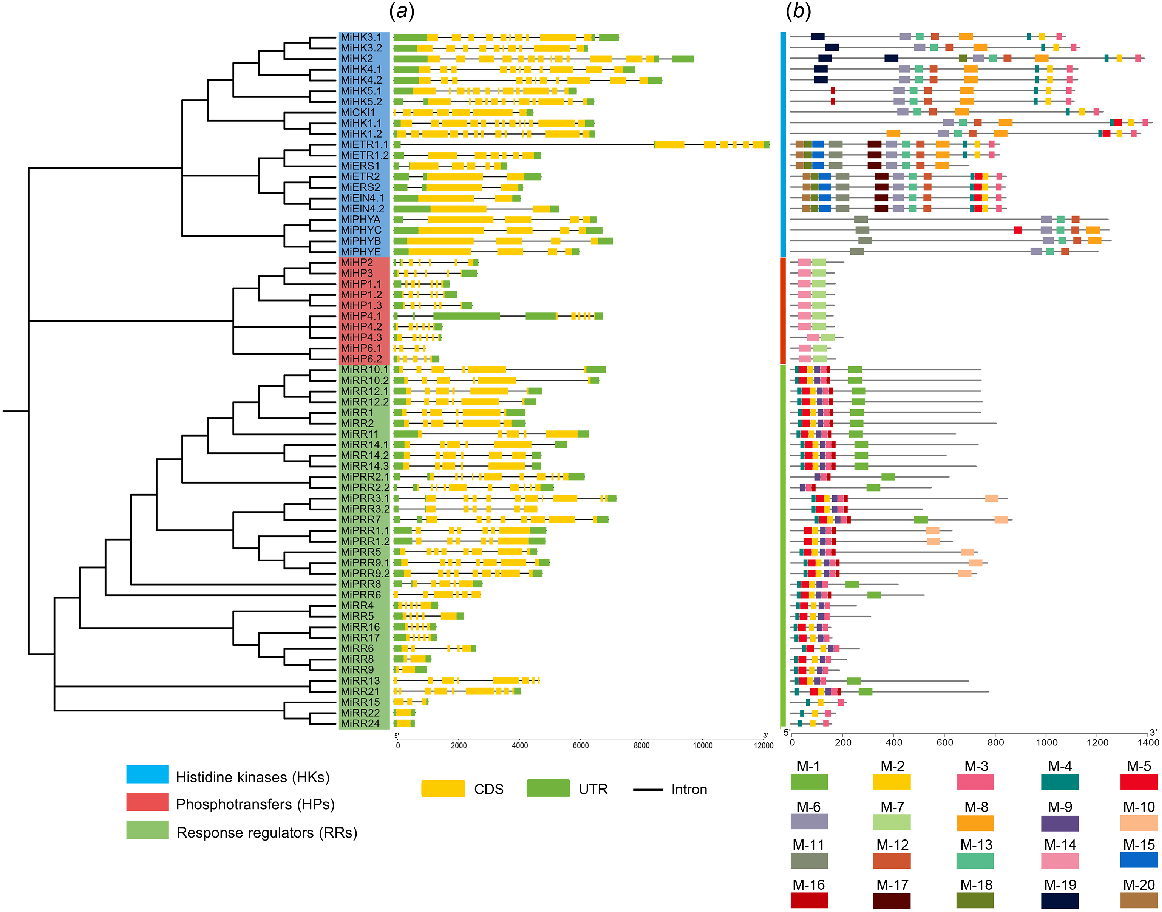
For conserved motif analysis overall 20 motifs were taken (Fig. 4b). The ethylene receptor has the highest 11 conserved motifs (1, 3, 4, 6, 11, 12, 13, 15, 17, 18, and 20) among all histidine kinases (HKs). Cytokinin receptors have seven conserved motifs (2, 3, 4, 6, 8, 12, and 13), while phytochromes family members have only four conserved motifs (6, 11, 12, and 13). Only two conserved motifs (7 and 14) are present in phosphotransferase proteins (HPs).
In every member of the type-A RRs, motifs 2, 3, 4, 5, and 9 were conserved. Type-B RRs contain two more motifs (1 and 16) and the other motifs were the same as in type-A RRs. Type-C RRs contain only three conserved motifs (2, 3, and 4). All PRRs contain four highly conserved motifs (1, 3, 9, and 16) while some members (MiPRR1.1, 1.2, 3.1, 5, 7, 9.1, and 9.2) contain one additional motif 10. The same family members have the same number of conserved motifs, which indicates that TCS is conserved.
Chromosomal mapping and gene duplication events analysis
MiTCS genes were distributed on 18 out of 20 chromosomes (Chr), and two different scaffolds. The distribution of genes is uneven as Chr5 has the maximum number of genes (14 genes), while Chr10, Chr11, Chr15, Chr16, and Chr18 have the minimum number of genes (one gene on each). No genes was present at Chr14 and Chr19. Two genes named MiHP4.3 and MiPRR3.2 were present on the scaffold named NW_025401125.1 and NW_025401143.1, respectively (Fig. 5a).
(a) Mapping of MiTCS genes on chromosomes, and (b) gene duplication events of genes representing both tandem and segmental.
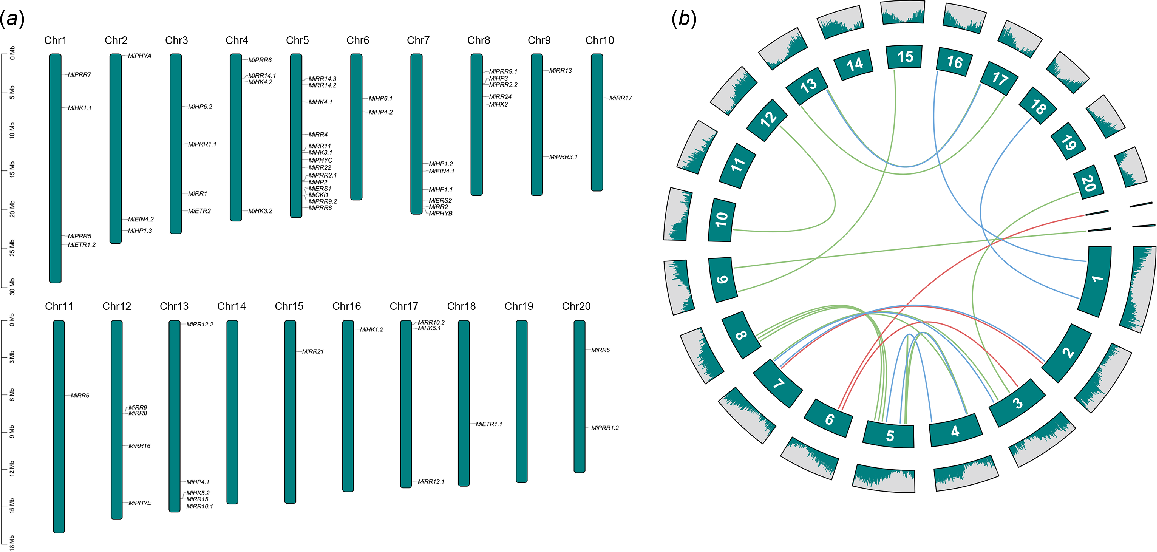
Gene duplication events were also analysed in MiTCS genes. The duplicate pairs result from segment duplication, including MiHK1.1/MiHK1.2, MiHK3.1/MiHK3.2, MiHK4.1/MiHK4.2, MiHK5.1/MiHK5.2, MiETR1.1/MiETR1.2, MiETR2/MiERS2, MiEIN4.1/MiEIN4.2, MiHP1.2/MiHP1.3, MiHP4.2/MiHP4.3, MiHP6.1/MiHP6.2, MiRR1/MiRR2, MiRR2/MiRR14.1, MiRR10.1/MiRR10.2, MiRR12.1/MiRR12.2, MiRR13/MiRR21, MiRR14.1/MiRR14.2, MiRR14.1/MiRR14.3, MiRR16/MiRR17, MiRR22/MiRR24, MiPRR1.1/MiPRR1.2, MiPRR2.1/MiPRR2.2, MiPRR3.1/MiPRR3.2, and MiPRR9.1/MiPRR9.2. However, the duplicated genes MiRR14.2/MiRR14.3, which are clustered on Chr5, were identified as tandem duplicates (Fig. 5b, Table 2). Thus, in line with previous studies, these findings showed that segmental duplications were the main factor causing the increase of the TCS gene family in M. indica.
| Gene1 | Gene2 | Ka | Ks | Ka/Ks | Time (Mya) | Duplication type | |
|---|---|---|---|---|---|---|---|
| MiHK1.1 | MiHK1.2 | 0.0691 | 0.2235 | 0.30917 | 7.45 | Segmental | |
| MiHK3.1 | MiHK3.2 | 0.0515 | 0.1494 | 0.34471 | 4.98 | Segmental | |
| MiHK4.1 | MiHK4.2 | 0.0567 | 0.1348 | 0.42062 | 4.4933333 | Segmental | |
| MiHK5.1 | MiHK5.2 | 0.0603 | 0.1963 | 0.30718 | 6.5433333 | Segmental | |
| MiETR1.1 | MiETR1.2 | 0.058 | 0.1795 | 0.32312 | 5.9833333 | Segmental | |
| MiETR2 | MiERS2 | 0.0792 | 0.1915 | 0.41358 | 6.3833333 | Segmental | |
| MiEIN4.1 | MiEIN4.2 | 0.0679 | 0.1951 | 0.34803 | 6.5033333 | Segmental | |
| MiHP1.2 | MiHP1.3 | 0.1355 | 0.1563 | 0.86692 | 5.21 | Segmental | |
| MiHP4.2 | MiHP4.3 | 0.0933 | 0.0978 | 0.95399 | 3.26 | Segmental | |
| MiHP6.1 | MiHP6.2 | 0.0777 | 0.0862 | 0.90139 | 2.8733333 | Segmental | |
| MiRR1 | MiRR2 | 0.046 | 0.1796 | 0.25612 | 5.9866667 | Segmental | |
| MiRR2 | MiRR14.1 | 0.3082 | 0.7868 | 0.39171 | 26.226667 | Segmental | |
| MiRR10.1 | MiRR10.2 | 0.0573 | 0.0592 | 0.96791 | 1.9733333 | Segmental | |
| MiRR12.1 | MiRR12.2 | 0.0516 | 0.0196 | 2.63265 | 0.6533333 | Segmental | |
| MiRR13 | MiRR21 | 0.2548 | 0.2947 | 0.86461 | 9.8233333 | Segmental | |
| MiRR14.1 | MiRR14.2 | 0.0361 | 0.1677 | 0.21527 | 5.59 | Segmental | |
| MiRR14.1 | MiRR14.3 | 0.0361 | 0.1677 | 0.21527 | 5.59 | Segmental | |
| MiRR14.2 | MiRR14.3 | 0.0057 | 0.0106 | 0.53774 | 0.3533333 | Tandem | |
| MiRR16 | MiRR17 | 0.0863 | 0.1946 | 0.44347 | 6.4866667 | Segmental | |
| MiRR22 | MiRR24 | 0.1733 | 0.4331 | 0.40014 | 14.436667 | Segmental | |
| MiPRR1.1 | MiPRR1.2 | 0.0156 | 0.1131 | 0.13793 | 3.77 | Segmental | |
| MiPRR2.1 | MiPRR2.2 | 0.2071 | 0.2998 | 0.69079 | 9.9933333 | Segmental | |
| MiPRR3.1 | MiPRR3.2 | 0.0102 | 0.0187 | 0.54545 | 0.6233333 | Segmental | |
| MiPRR9.1 | MiPRR9.2 | 0.0639 | 0.1803 | 0.35441 | 6.01 | Segmental |
Mya, million years ago.
To investigate the evolutionary constraints of repeated MiTCS genes, the Ka, Ks, and Ka/Ks ratios of all para-homologous gene pairs were calculated (Table 2). Most gene pairs had Ka/Ks values ranging from 0.14 to 0.97 that were smaller than 1.0, indicating significant purification selection pressure had been applied to these gene pairs. Only one duplicated pair MiRR12.1/MiRR12.2 had a Ka/Ks value of more than 1.0, indicating a positive selection. As a result, the divergence time of 24 duplicated pairs was between 0.35 Mya and 26.23 Mya.
Gene ontology (GO) enrichment analysis
GO enrichment analysis was performed on the 65 M. indica TCS genes (Fig. 6, Table S2) to elucidate the functional roles and biological significance of these genes. According to GO analysis, TCS genes are mostly associated with various biological processes, including signal transduction (GO:0007165), anatomical structure development (GO:0048856), stress response (GO:0006950), biosynthetic process (GO:0009058), cellular nitrogen compound metabolic process (GO:0034641), reproduction (GO:0000003), cell differentiation (GO:0030154), growth (GO:0040007), cellular protein modification process (GO:0036211), cell division (GO:0051301), and cell death (GO:0008219). These genes are primarily found in the nucleus (GO:0005634), cytoplasm (GO:0005737), intracellular organelles (GO:0043229), plastid (GO:0009536), plasma membrane (GO:0005886), and endoplasm reticulum (GO:0005783). Nevertheless, they participate in a variety of molecular functions, including signal transducer activity (GO:0005057), kinase activity (GO:0016301), DNA binding (GO:0003677), ion binding (GO:0043167), nucleic acid binding transcription factor activity (GO:0003676), protein binding (GO:0005515), and hydrolase activity (GO:0016787).

Protein-protein interaction (PPI) among MiTCS proteins
MiTCS proteins were evaluated to identify interactions among them that would help understand their functions. Interacting proteins may function in a pathway as well as impact each other roles, thereby generating overall responses. Among these proteins, the highest interacting proteins were RRs that interacted with both HKs and HPs (Fig. 7). As TCS proteins work in a cascade performing signal transductions, all these interactions are showing that they interact in a manner that transfers a signal from HKs to HPs and then RRs.
Interaction among various MiTCS proteins. Nodes are represented in different colours. Green, MiHKs; purple, MiRRs; pink, MiHPs. Edges show their interaction patterns.
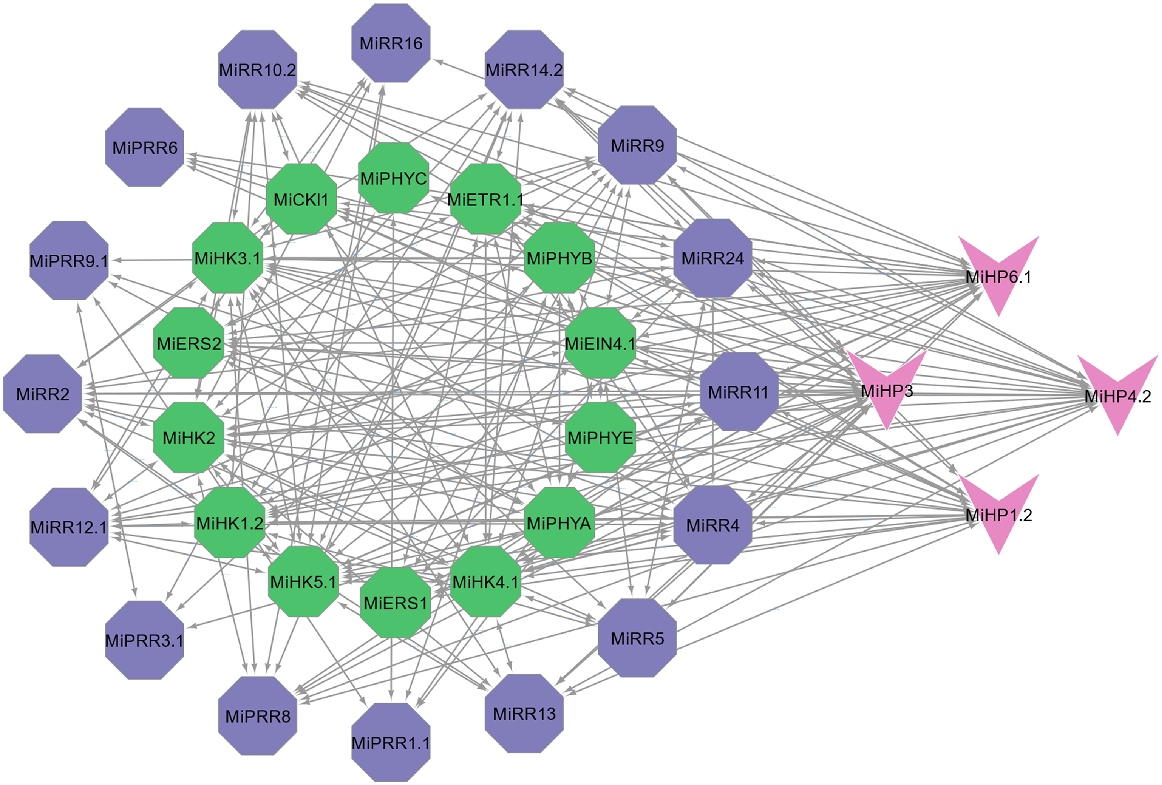
Further, genes with higher interactions were identified using CytoHubba. It listed the top 10 proteins having the highest interactions with other proteins. It showed that most of the highly interacting proteins were HKs. Members of sub-group (MiHK1.2, MiHK2, MiHK3.1, MiHK4.1, and MiHK5.1) were interacting greatly with members of another subgroup (MiHP1.2, MiHP3, MiHP4.2, and MiHP6.1). One member of the RR family, MiRR24 was also among the highest interacting proteins (Fig. S1).
Promoter and expression analysis of MiTCS genes
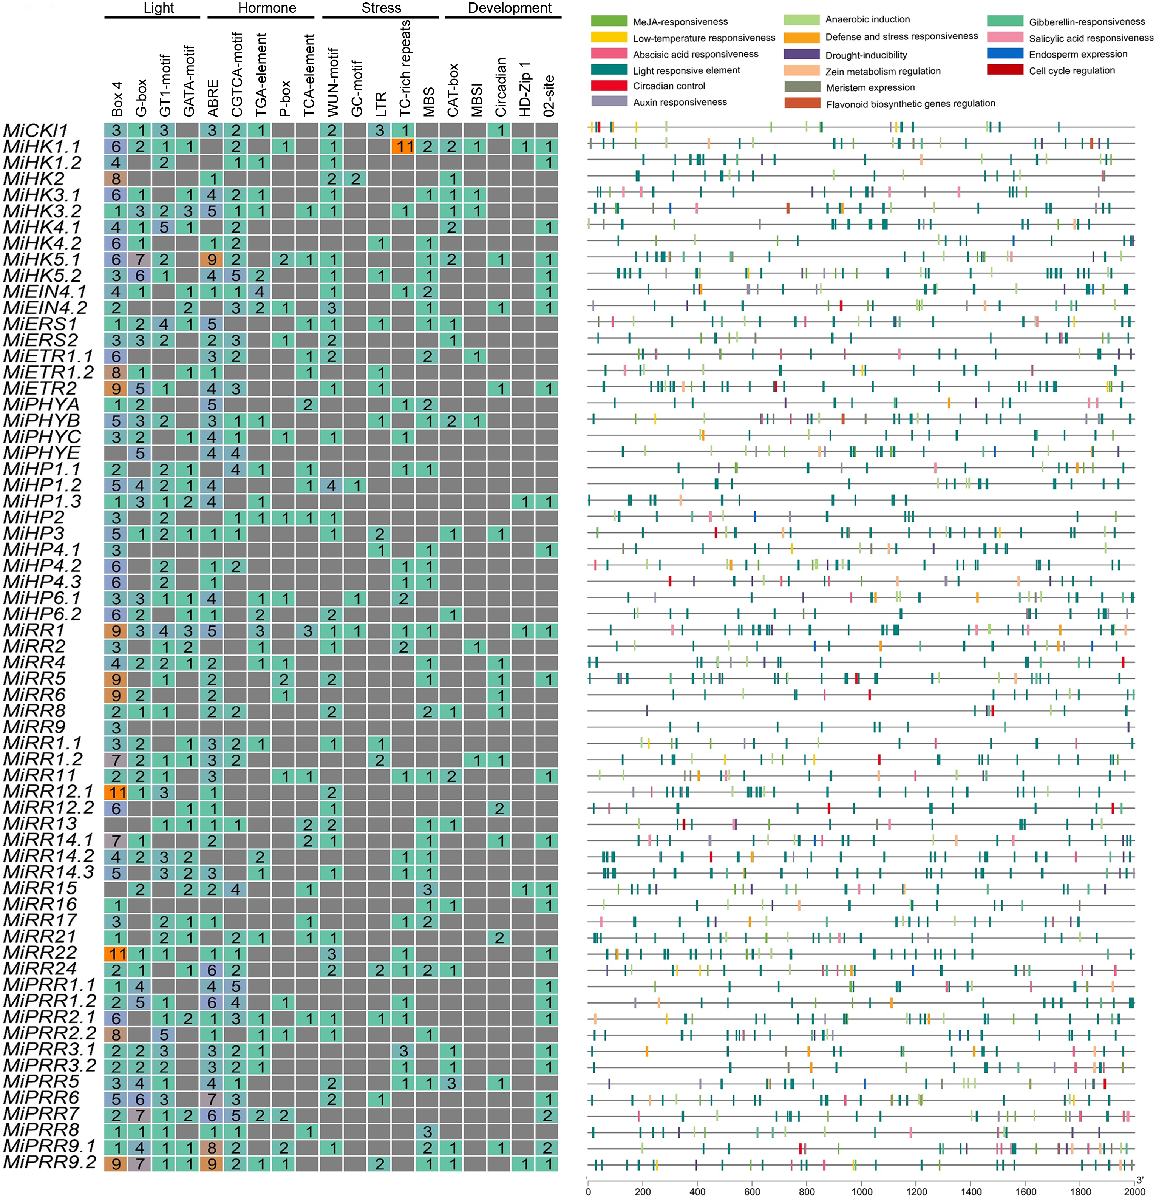
To better comprehend the role of cis-regulatory elements in the MiTCSs, a 2 kb upstream region of each of these genes was searched. Various major types of these elements including stress-responsive, light-responsive, development-responsive, and hormone-responsive were identified. Moreover, several elements having roles in development were also found (Fig. 8, Table S3). HKs and RRs contained a large number of cis-regulatory elements. The greater number of elements were associated with responses to hormones such as methyl jasmonate (MeJA) (TGACG-motif and CGTCA-motif), abscisic acid (ABRE), auxin (TGA-element and AuxRR-core), gibberellin (GARE-motif, TATC-box, and P-box), and salicylic acid (SARE and TCA-element). All the MiTCSs genes contained light-responsive elements including Box 4, G-box, GT1-motif, and GATA-motif. Various other stress-responsive elements including WUN-motif (biotic stress-related), GC-motif, LTR (involved in light responsiveness), and TC-rich repeats were also found across all genes. Development-related elements including CAT-box, MBSI, circadian, HD-Zip 1, and O2-site were also found in all these genes, which were related to functions such as circadian control, anaerobic induction, zein-metabolism regulation, meristem expression, flavonoid biosynthesis genes regulation, and endosperm expression. The presence of all these elements suggests the involvement of these genes in modulating responses to both biotic and abiotic stress.
Analysis of cis-elements was conducted on the promoter regions of MiTCS. The various colours and numbers indicate the number of promoter elements in MiTCS genes. Coloured bars represent different types of cis-elements and their positions within each MiTCS gene. To determine the types, numbers, and positions of cis-elements in the promoter regions located 2 kb upstream of MiTCS genes, the PlantCare database was utilised.
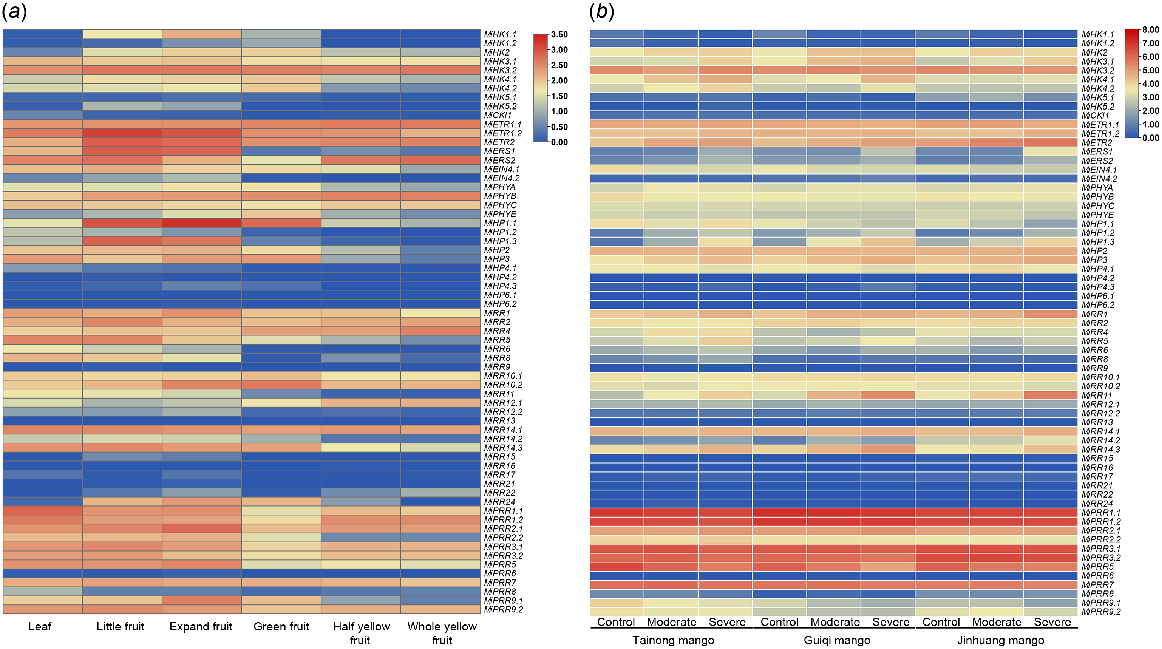
To investigate the roles of MiTCS genes, their expression patterns were observed in different tissues including the leaf and various stages of fruit development. Overall, the expression level of all these genes fluctuated in each tissue. All the genes showed slight change in expression in all tissues except MiPRR9.1, MiPRR6, MiRR15-22, and MiRR9. Besides, most of the members of the HP family were also downregulated in all the tissues. Some HKs including MiHK1, MiHK4, MiHK5, and MiCKl1 also showed a decline in expression in these tissues. Members of all the TCS families also showed a higher expression such as MiHK3.1, MiHK3.2, and ethylene receptors were highly upregulated in these tissues. Similarly, MiHP1.1 showed the highest expression in little and expand fruit. Members from the RR family including MiRR10, MiRR14, MiPRR12, MiPRR3, and MiPRR9 also had an increased gene expression in all of these tissues (Fig. 9a).
Expression analysis of MiTCS gene family undergoes (a) developmental stages and (b) drought stress. Red, higher expression; blue, lower expression.
To check the expression pattern of MiTCS genes under drought stress, the leaf of three mango varieties (Tainong, Guiqi, and Jinhuang) were subjected to moderate and severe drought stress. According to this, MiHK2, MiETR2, MiHP1.3, MiHP3, MiRR1, MiRR11, and MiRR14.3 were upregulated under moderate and severe conditions. In contrast, MiEIN4.1, MiPHYB, MiPRR5, and MiPRR9.1 were downregulated in drought stress (Fig. 9b).
For cold stress, the fruit peel of mango was subjected to 5°C and 12°C for 0, 2, 7, and 12 days. The results showed that MiPRR5 and MiPRR9.1 were highly upregulated at 5°C for 7 and 12 days. The MiHK3.2, MiETR1.2, MiETR2, MiERS1, MiERS2, MiRR24, MiPRR1.2, MiPRR2.1, MiPRR2.2, and MiPRR7 were upregulated at 12°C for 12 days. However, MiHP1.2, MiHP3, and MiRR6 were slightly downregulated for all cold conditions (Fig. 10a).
Expression analysis of MiTCS gene family undergoes (a) cold stress and (b) disease condition. Red, higher expression; blue, lower expression.
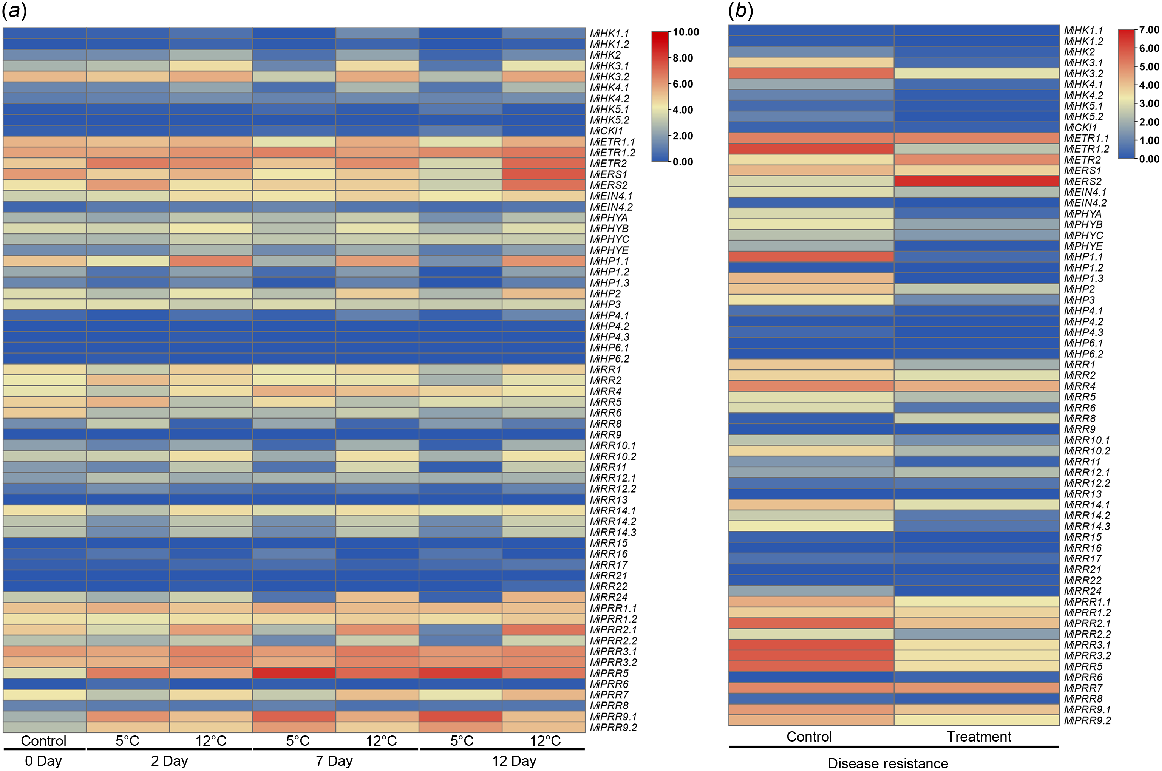
In the disease stage, the MiETR2 and MiERS2 genes were upregulated in fruit peel, and the other genes including MiHK3.1, MiHK3.2, MiETR1.2, MiHP1.1, MiHP1.3, MiHP3, MiRR1, MiRR6, MiRR10.2, MiRR14.2, MiRR14.3, MiPRR1.1, MiPRR2.1, MiPRR3.1, MiPRR3.2, MiPRR5, MiPRR9.1, and MiPRR9.2 were downregulated (Fig. 10b).
3D structure modelling of MiTCS proteins
To obtain more structural and functional insights, the 3D structures of 12 MiTCS proteins (based on higher tissue-specific expression) were modelled. Ethylene receptors including MiERS1, MiERS2, MiERS1.2, and MiETR2 were having almost similar structures. All these structures shared a similar structure of loops, helices, and turns. Similarly, HPs also shared similarities in structure. Members of HPs contained most of the loops with fewer turns. Members of the RR family MiRR10.2 contained helices, turns, and a large number of loops. MiPRR1.1 and MiPRR1.2 showed a high number of helices. MiPRR2.1 also contained helices as well as loops and turns (Fig. 11).

Discussion
TCS genes and their biological functions have already been identified in several plant species. Several genes play a role in modulating responses to abiotic stresses (Tran et al. 2010; Nakashima and Yamaguchi-Shinozaki 2013). So far, no comprehensive evaluation of M. indica TCS genes has been carried out. We performed a detailed analysis of TCS genes in M. indica to reveal their regulatory roles.
In this study, a complete genomic analysis of M. indica was carried out, which led to the identification of 21 HKs, 10 HPs, and 34 RRs. In Arabidopsis, these genes differed in their number of members to 17 HKs, six HPs, and 33 RRs (Cheng and Kieber 2014). In S. bicolor, these numbers also varied to 13 HKs, five HPs, and 19 RRs (Zameer et al. 2021). In the melon genome, 51 members of the TCS gene family were identified. Whereas, no member of the Type-C RR subfamily was acknowledged as they are thought to be primitive RRs, and changes in their promoters might have led to the emergence of Type-A RRs (Liu et al. 2020). S. lycopersicum had the same number of TCS members identified as have been in this study: 20 HKs, six HPs, and 39 RRs (He et al. 2016a). In Zizania latifolia, 69 members were identified as 25 HKs, eight HPs, and 36 RRs (He et al. 2020). Moreover, 85, 83, and 80 members were identified in Brasscia rapa (He et al. 2020), G. max (Mochida et al. 2010), and Brassica oleracea (Sadaqat et al. 2023), respectively.
Phylogenetic studies led to the division of TCS proteins into three major groups (MiHKs, MiHPs, and MiRRs). These groups were further classified into sub-families. Members from other plant species such as A. thaliana (Pils and Heyl 2009), S. bicolor (Zameer et al. 2021), C. arietinum (Ahmad et al. 2020), and Z. mays (He et al. 2016a) were also classified similarly. Members from the same families clustered on the same clade. This analysis also showed that TCS genes are highly conserved and widely expanded over time. Particularly, RRs formed the highest clade and contained many members resulting from evolution such as PRRs and Type-A RRs.
The evolution of TCS genes in various plant genomes has been extensively studied, revealing that many of these genes have originated through duplication events. For instance, in Chinese cabbage (Brassica spp.), whole-genome duplication occurred through the divergence of A. thaliana, mainly through segmental duplication (Liu et al. 2014). Similarly, TCS genes in S. bicolor also originated through segmental duplication, with tandem duplication playing a role in the expansion of this gene family. Watermelon (Citrullus lanatus) showed two segmentally and one tandomly duplicated gene pair (He et al. 2016b), while tomato exhibited both patterns of duplication (He et al. 2016a). In the mango genome, most TCS genes originated through segmental duplication, except for MiRR14.2 and MiRR14.3 which showed tandem duplication. The Ks values obtained for segmental duplication varied from 0.0106 to 0.7868 in this study, corresponding to a time of divergence from 0.35 to 26.23 million years ago. The Ks values and divergence times indicate the evolutionary ages and dynamics of duplicated gene pairs, with lower Ks values suggesting recent duplications and a range of divergence times reflecting the diverse evolutionary history within the mango TCS gene family.
Each plant species holds a substantial number of cis-acting elements within its gene promoter regions, which serve as a means of resistance against biotic and abiotic stress (Zia et al. 2024). These elements mostly contain light-responsive, low-temperature responsive, hormone (MeJa, auxin, gibberellin, and salicylic acid) responsive ones. More elements regarding various stress responses such as ARE, GARE-motif, TGACG-motif, and CGTCA-motif are also found, which regulates the gene expression. All these elements were identified in this study confirming their roles in abiotic stresses, and hormonal and developmental responses. Bananas have a high abundance of hormone and light-responsive elements within the HK family. Specifically, hormone-responsive elements like TCA elements, ethylene- and gibberellin-responsive elements (ERE and GARE motif), and ABRE are abundantly present. Similarly, the RR family contains biotic and abiotic stress-responsive elements (Dhar et al. 2019). In the case of cucumber (Cucumis sativus) and watermelon, a considerable number of stress-responsive elements have been identified, such as ABRE, MBS, ABA-responsive, and drought-responsive elements (He et al. 2016b). These findings provide additional confirmation of the involvement of genes in regulatory functions.
Recent researches have suggested that the expression level of TCS genes can be manipulated to help cope with various stresses in different plant tissues. These genes in Arabidopsis have roles in responding to environmental stimuli, light sensing, ethylene signalling, and circadian rhythms (Pils and Heyl 2009). In Medicago truncatula, they were found to be overexpressed in different organs (Tan et al. 2019). Similarly, RRs in chickpeas interacted with the nodulation genes, particularly their promoters indicating their roles as transcription factors during nodulation stages. Z. latifolia TCS genes were found to be involved in gall formation and responding to the swelling of shoots caused by fungal infections (He et al. 2020). Melon RRs were highly expressed in its roots indicating their importance in the signalling of root cytokinins (Liu et al. 2020). Further, they also had higher expression in flowers, fruit development and fluorescence. Tomato ethylene receptors were involved in the thermotolerance of pollens (He et al. 2016a).
The study of protein-protein interaction analysis revealed that these genes form interactions with one another, indicating their participation in pathways that regulate specific functions. HKs as highly interacting proteins within the MiTCS highlights their pivotal role in coordinating cellular responses. Further, GO enrichment analysis revealed various processes, functions, and cellular components in which these genes are involved, specifically signal transduction, which is consistent with findings from previous studies (He et al. 2016a).
The expression profiling of MiTCS genes in mango plants revealed intriguing patterns under various conditions. Across different tissues and developmental stages, most genes exhibited consistent but slight expression, except for a few outliers like MiPRR9.1, MiPRR6, MiRR15-22, and MiRR9, indicating potential roles in specific processes. Notably, members of the HP family and some HKs showed downregulation, contrasting with higher expressions in certain TCS families like MiHK3 and ethylene receptors. Under drought stress, several genes such as MiHK2, MiETR2, and MiRR14.3 were upregulated, suggesting their involvement in stress response pathways. Cold stress induced varied responses, with MiPRR5 and MiPRR9.1 showing high upregulation at 5°C, while other genes responded differently at 12°C. Disease stress notably upregulated MiETR2 and MiERS2, while several other genes were downregulated, indicating complex regulatory mechanisms in response to pathogens. These findings highlight the inherent dynamism of MiTCS gene expression about the adaptation to environmental challenges, thereby providing valuable insights into the mechanisms underlying mango plant resilience.
Additionally, 3D structural predictions of these proteins revealed a high degree of conservation, indicating that they have a conserved function as well. Given the abundance of duplicated genes observed, these observations suggest that gene duplication and the presence of homologues play a critical role in preserving functional similarity among them. Therefore, it can be concluded that TCS genes are regulated in response to abiotic stresses and play a crucial role in enabling plants to survive under such conditions. In future studies, it would be beneficial to utilise the natural genetic variation present within the germplasm to confirm the function of identified candidate genes under specific stress conditions. This approach holds significant value in terms of validation. These perspectives could provide valuable insights for selecting and integrating these genes into breeding and genetic engineering projects aimed at improving stress resilience in crops. Consequently, these genes, can be utilised in future research on mangoes.
Conclusion
In this study, a total of 65 TCS genes were identified in the mango genome and further classified into three major groups (HKs, HPs, and RRs) and 11 subgroups with greater structural similarities among members belonging to the same groups and subgroups. Evolutionary analysis reveals a substantial expansion of TCS genes in M. indica, primarily driven by segmental duplications, with some tandem duplication events. Promoter analysis unveils a rich repertoire of cis-regulatory elements associated with stress responses and developmental processes, highlighting the multifaceted roles of these genes. Expression profiling under diverse conditions reveals dynamic responses, suggesting their involvement in environmental adaptation and stress resilience. Protein-protein interaction analysis further underscores the interplay among TCS proteins, elucidating potential signalling pathways, and regulatory cascades. Gene ontology enrichment analysis indicates the involvement of TCS genes in signal transduction and stress responses. Structure prediction showed high similarity among members of the same groups. Our findings establish a strong base for further investigating the function of TCS in regulating various abiotic and environmental stress responses.
Conflicts of interest
The authors declare that the research was conducted in the absence of any commercial or financial relationships that could be construed as potential conflicts of interest.
Declaration of funding
Princess Nourah bint Abdulrahman University Researchers Supporting Project number (PNURSP2024R39), Princess Nourah bint Abdulrahman University, Riyadh, Saudi Arabia.
Author contributions
MS and KF drafted the manuscript, prepared illustrations and discussed the content with the FA and TA. MT conceived this research topic and revised the contents of the manuscript. TS and MR revised the manuscript. WAA and MT were involved in the final development of the manuscript and funding acquisition. All authors contributed to the article and approved the submitted version.
Acknowledgements
Princess Nourah bint Abdulrahman University Researchers Supporting Project number (PNURSP2024R39), Princess Nourah bint Abdulrahman University, Riyadh, Saudi Arabia.
References
Ahmad B, Azeem F, Ali MA, et al. (2020) Genome-wide identification and expression analysis of two component system genes in Cicer arietinum. Genomics 112(2), 1371-1383.
| Crossref | Google Scholar | PubMed |
Andrews S (2010) FastQC: a quality control tool for high throughput sequence data. Babraham Bioinformatics. Babraham Institute, Cambridge, United Kingdom. Available at http://www.bioinformatics.babraham.ac.uk/projects/fastqc
Bailey TL, Boden M, Buske FA, et al. (2009) MEME SUITE: tools for motif discovery and searching. Nucleic Acids Research 37(suppl_2), W202-W208.
| Crossref | Google Scholar |
Bateman A, Coin L, Durbin R, et al. (2004) The Pfam protein families database. Nucleic Acids Research 32(90001), D138-D141.
| Crossref | Google Scholar |
Bolser DM, Staines DM, Perry E, Kersey PJ (2017) Ensembl plants: integrating tools for visualizing, mining, and analyzing plant genomic data. Methods in Molecular Biology 1533, 1-31.
| Crossref | Google Scholar |
Brown GR, Hem V, Katz KS, et al. (2015) Gene: a gene-centered information resource at NCBI. Nucleic Acids Research 43, D36-D42.
| Crossref | Google Scholar |
Chen C, Xia R, Chen H, et al. (2018) TBtools, a Toolkit for Biologists integrating various HTS-data handling tools with a user-friendly interface. bioRxiv 289660.
| Crossref | Google Scholar |
Chen C, Chen H, Zhang Y, et al. (2020) TBtools: an integrative toolkit developed for interactive analyses of big biological data. Molecular Plant 13(8), 1194-1202.
| Crossref | Google Scholar | PubMed |
Cheng CY, Kieber JJ (2014) Cytokinin signaling in plants. In ‘Molecular biology’. (Ed. S Howell) pp. 269–289. (Springer) doi:10.1007/978-1-4614-7570-5_14
Chin C-H, Chen S-H, Wu H-H, et al. (2014) cytoHubba: identifying hub objects and sub-networks from complex interactome. BMC Systems Biology 8(4), S11.
| Crossref | Google Scholar |
Davis IW, Leaver-Fay A, Chen VB, et al. (2007) MolProbity: all-atom contacts and structure validation for proteins and nucleic acids. Nucleic Acids Research 35(suppl.2), W375-W383.
| Crossref | Google Scholar |
Dhar YV, Lakhwani D, Pandey A, et al. (2019) Genome-wide identification and interactome analysis of members of two-component system in Banana. BMC Genomics 20(1), 674.
| Crossref | Google Scholar |
Discovery Studio (2008) Discovery Studio life science modeling and simulations. pp. 1–8. Available at https://www.researchgate.net/profile/Tanweer-Alam-2/post/hi_can_somebody_plz_tell_me_how_to_import_a_database_into_Discovery_Studio_for_a_3D_database_search/attachment/59d63bb879197b8077998bbd/AS%3A412232203685889%401475295224962/download/ds-overview-20.pdf
Du L, Jiao F, Chu J, et al. (2007) The two-component signal system in rice (Oryza sativa L.): a genome-wide study of cytokinin signal perception and transduction. Genomics 89(6), 697-707.
| Crossref | Google Scholar | PubMed |
Elshemey WM, Elfiky AA, Gawad WA (2010) Correlation to protein conformation of Wide-Angle X-ray scatter parameters. The Protein Journal 29(8), 545-550.
| Crossref | Google Scholar | PubMed |
Fatima K, Sadaqat M, Azeem F, et al. (2023) Integrated omics and machine learning-assisted profiling of cysteine-rich-receptor-like kinases from three peanut spp. revealed their role in multiple stresses. Frontiers in Genetics 14, 1252020.
| Crossref | Google Scholar |
Halawa M, Cortleven A, Schmülling T, et al. (2021) Characterization of CHARK, an unusual cytokinin receptor of rice. Scientific Reports 11(1), 1722.
| Crossref | Google Scholar |
He Y, Liu X, Ye L, et al. (2016a) Genome-wide identification and expression analysis of two-component system genes in tomato. International Journal of Molecular Sciences 17(8), 1204.
| Crossref | Google Scholar |
He Y, Liu X, Zou T, et al. (2016b) Genome-side identification of two-component system genes in Cucurbitaceae crops and expression profiling analyses in cucumber. Frontiers in Plant Science 7, 899.
| Crossref | Google Scholar |
He L, Zhang F, Wu X, et al. (2020) Genome-wide characterization and expression of two-component system genes in cytokinin-regulated gall formation in Zizania latifolia. Plants 9(11), 1409.
| Crossref | Google Scholar | PubMed |
Hunter T, Cooper JA (1985) Protein-Tyrosine kinases. Annual Review of Biochemistry 54(1), 897-930.
| Google Scholar |
Hunter S, Apweiler R, Attwood TK, et al. (2009) InterPro: the integrative protein signature database. Nucleic Acids Research 37(suppl_1), D211-D215.
| Crossref | Google Scholar |
Johnson M, Zaretskaya I, Raytselis Y, et al. (2008) NCBI BLAST: a better web interface. Nucleic Acids Research 36(suppl_2), W5-W9.
| Crossref | Google Scholar |
Jumper J, Evans R, Pritzel A, et al. (2021) Highly accurate protein structure prediction with AlphaFold. Nature 596(7873), 583-589.
| Crossref | Google Scholar | PubMed |
Kim D, Paggi JM, Park C, et al. (2019) Graph-based genome alignment and genotyping with HISAT2 and HISAT-genotype. Nature Biotechnology 37(8), 907-915.
| Crossref | Google Scholar | PubMed |
Kovaka S, Zimin AV, Pertea GM, et al. (2019) Transcriptome assembly from long-read RNA-seq alignments with StringTie2. Genome Biology 20(1), 278.
| Crossref | Google Scholar |
Letunic I, Bork P (2021) Interactive Tree Of Life (iTOL) v5: an online tool for phylogenetic tree display and annotation. Nucleic Acids Research 49(W1), W293-W296.
| Crossref | Google Scholar | PubMed |
Letunic I, Doerks T, Bork P (2015) SMART: recent updates, new developments and status in 2015. Nucleic Acids Research 43(D1), D257-D260.
| Crossref | Google Scholar |
Liu Z, Zhang M, Kong L, et al. (2014) Genome-wide identification, phylogeny, duplication, and expression analyses of two-component system genes in Chinese cabbage (Brassica rapa ssp. pekinensis). DNA Research 21(4), 379-396.
| Crossref | Google Scholar | PubMed |
Liu P, Wang S, Wang X, et al. (2020) Genome-wide characterization of two-component system (TCS) genes in melon (Cucumis melo L.). Plant Physiology and Biochemistry 151, 197-213.
| Crossref | Google Scholar |
Marchler-Bauer A, Derbyshire MK, Gonzales NR, et al. (2015) CDD: NCBI’s conserved domain database. Nucleic Acids Research 43(D1), D222-D226.
| Crossref | Google Scholar |
Mering Cv, Huynen M, Jaeggi D, et al. (2003) STRING: a database of predicted functional associations between proteins. Nucleic Acids Research 31(1), 258-261.
| Crossref | Google Scholar |
Mochida K, Yoshida T, Sakurai T, et al. (2010) Genome-wide analysis of two-component systems and prediction of stress-responsive two-component system members in soybean. DNA Research 17(5), 303-324.
| Crossref | Google Scholar | PubMed |
Nakashima K, Yamaguchi-Shinozaki K (2013) ABA signaling in stress-response and seed development. Plant Cell Reports 32(7), 959-970.
| Crossref | Google Scholar | PubMed |
Pils B, Heyl A (2009) Unraveling the evolution of cytokinin signaling. Plant Physiology 151(2), 782-791.
| Crossref | Google Scholar | PubMed |
Quintana SE, Salas S, García-Zapateiro LA (2021) Bioactive compounds of mango (Mangifera indica): a review of extraction technologies and chemical constituents. Journal of the Science of Food and Agriculture 101(15), 6186-6192.
| Crossref | Google Scholar | PubMed |
Rombauts S, Dehais P, Van Montagu M, et al. (1999) PlantCARE, a plant cis-acting regulatory element database. Nucleic Acids Research 27(1), 295-296.
| Crossref | Google Scholar | PubMed |
Rozas J, Ferrer-Mata A, Sánchez-DelBarrio JC, et al. (2017) DnaSP 6: DNA sequence polymorphism analysis of large data sets. Molecular Biology and Evolution 34(12), 3299-3302.
| Crossref | Google Scholar | PubMed |
Sadaqat M, Umer B, Attia KA, et al. (2023) Genome-wide identification and expression profiling of two-component system (TCS) genes in Brassica oleracea in response to shade stress. Frontiers in Genetics 14, 1142544.
| Crossref | Google Scholar | PubMed |
Schaller GE, Kieber JJ, Shiu S-H (2008) Two-component signaling elements and histidyl-aspartyl phosphorelays. The Arabidopsis Book 6, e0112.
| Crossref | Google Scholar | PubMed |
Shannon P, Markiel A, Ozier O, et al. (2003) Cytoscape: a software environment for integrated models of biomolecular interaction networks. Genome Research 13(11), 2498-2504.
| Crossref | Google Scholar | PubMed |
Sharan A, Soni P, Nongpiur RC, et al. (2017) Mapping the ‘Two-component system’ network in rice. Scientific Reports 7(1), 9287.
| Crossref | Google Scholar |
Shi B, Wu H, Zhu W, et al. (2022) Genome-wide identification and expression analysis of WRKY genes during anthocyanin biosynthesis in the mango (Mangifera indica L.). Agriculture 12(6), 821.
| Crossref | Google Scholar |
Tamura K, Stecher G, Kumar S (2021) MEGA11: molecular evolutionary genetics analysis version 11. Molecular Biology and Evolution 38(7), 3022-3027.
| Crossref | Google Scholar | PubMed |
Tan S, Debellé F, Gamas P, et al. (2019) Diversification of cytokinin phosphotransfer signaling genes in Medicago truncatula and other legume genomes. BMC Genomics 20(1), 373.
| Crossref | Google Scholar |
Tran L-SP, Shinozaki K, Yamaguchi-Shinozaki K (2010) Role of cytokinin responsive two-component system in ABA and osmotic stress signalings. Plant Signalling & Behavior 5(2), 148-150.
| Crossref | Google Scholar | PubMed |
Trifinopoulos J, Nguyen L-T, von Haeseler A, et al. (2016) W-IQ-TREE: a fast online phylogenetic tool for maximum likelihood analysis. Nucleic Acids Research 44(W1), W232-W235.
| Crossref | Google Scholar | PubMed |
Tsai Y-C, Weir NR, Hill K, et al. (2012) Characterization of genes involved in cytokinin signaling and metabolism from rice. Plant Physiology 158(4), 1666-1684.
| Crossref | Google Scholar | PubMed |
ul Qamar MT, Sadaqat M, Zhu X-T, et al. (2023) Comparative genomics profiling revealed multi-stress responsive roles of the CC-NBS-LRR genes in three mango cultivars. Frontiers in Plant Science 14, 1285547.
| Crossref | Google Scholar |
Wallmeroth N, Jeschke D, Slane D, et al. (2019) ARR22 overexpression can suppress plant two-component regulatory systems. PLoS ONE 14, e0212056.
| Crossref | Google Scholar |
Wang P, Luo YF, Huang JF, et al. (2020) The genome evolution and domestication of tropical fruit mango. Genome Biology 21(1), 60.
| Crossref | Google Scholar |
Yu C-S, Cheng C-W, Su W-C, et al. (2014) CELLO2GO: a web server for protein subCELlular LOcalization prediction with functional gene ontology annotation. PLoS ONE 9(6), e99368.
| Crossref | Google Scholar | PubMed |
Zameer R, Sadaqat M, Fatima K, et al. (2021) Two-component system genes in sorghum bicolor: genome-wide identification and expression profiling in response to environmental stresses. Frontiers in Genetics 12, 794305.
| Crossref | Google Scholar |
Zameer R, Fatima K, Azeem F, Algwaiz HIM, Sadaqat M, Rasheed A, et al. (2022) Genome-wide characterization of superoxide dismutase (SOD) genes in Daucus carota: novel insights into structure, expression, and binding interaction with hydrogen peroxide (H2O2) under abiotic stress condition. Frontiers in Plant Science 13, 870241-870315.
| Crossref | Google Scholar |
Zia K, Sadaqat M, Ding B, et al. (2024) Comparative genomics and bioinformatics approaches revealed the role of CC-NBS-LRR genes under multiple stresses in passion fruit. Frontiers in Genetics 15, 1358134.
| Crossref | Google Scholar |