The distortion tensor of magnetotellurics: a tutorial on some properties
Frederick E. M. LilleyResearch School of Earth Sciences, Australian National University, Canberra, ACT 0200, Australia. Email: ted.lilley@anu.edu.au
Exploration Geophysics 47(2) 85-99 https://doi.org/10.1071/EG14093
Submitted: 29 September 2014 Accepted: 12 March 2015 Published: 1 May 2015
Journal Compilation © ASEG 2016
Abstract
A 2 × 2 matrix is introduced which relates the electric field at an observing site where geological distortion applies to the regional electric field, which is unaffected by the distortion. For the student of linear algebra this matrix provides a practical example with which to demonstrate the basic and important procedures of eigenvalue analysis and singular value decomposition.
The significance of the results can be visualised because the eigenvectors of such a telluric distortion matrix have a clear practical meaning, as do their eigenvalues. A Mohr diagram for the distortion matrix displays when real eigenvectors exist, and tells their magnitudes and directions.
The results of singular value decomposition (SVD) also have a clear practical meaning. These results too can be displayed on a Mohr diagram. Whereas real eigenvectors may or may not exist, SVD is always possible. The ratio of the two singular values of the matrix gives a condition number, useful to quantify distortion. Strong distortion causes the matrix to approach the condition known as ‘singularity’. A closely-related anisotropy number may also be useful, as it tells when a 2 × 2 matrix has a negative determinant by then having a value greater than unity.
Key words: distortion, eigenanalysis, magnetotelluric, Mohr, SVD, telluric.
Introduction
Three important matrices arise in magnetotelluric (MT) studies. The first matrix describes the distortion of measured electric fields. The second matrix is based on the MT observations themselves, of both magnetic and electric fields. The third matrix is the ‘phase tensor’, and is derived from the second matrix by computation.
The present paper addresses the first matrix, which commonly describes the distortion of measured electric fields quite locally, at an observing site. The more simple circumstances of this distortion matrix, in tensor form, are examined to establish some basic points. These points, once understood, may be useful in understanding the more complicated second and third matrices.
This paper expands upon a poster ‘The distortion matrix for the student of linear algebra’ that was presented in July 2012 at the 21st Electromagnetic Induction Workshop, held in Darwin, Australia. Some material is also drawn from an earlier publication (Lilley, 2012), enlarging on discussion there and refining its presentation.
A present stage of increased MT activity in Australia may bring newcomers to the subject. This paper hopes to contribute to a sound understanding of some basic theory by those who will, perhaps inevitably, have observations from complicated field situations to address.
Modern data sets may comprise simultaneous magnetic and electric field observations over arrays of sites. Such data sets offer many possibilities for the refined study and use, and also the avoidance, of the distortion characteristics described in this paper.
Notation for axes and their rotation
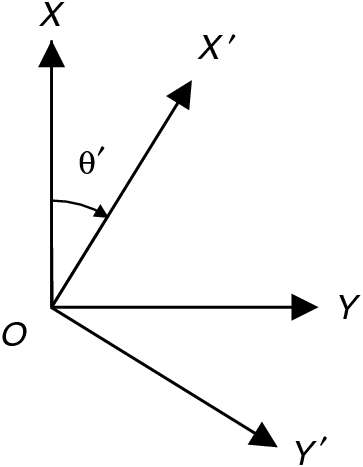
Horizontal directions north and east will be denoted by axes OX and OY, with OZ vertically downwards. When rotated clockwise by angle θʹ as shown in Figure 1, the axes will be denoted OXʹ and OYʹ.
|
A rotation matrix R(θ) will be introduced,

and the transpose of R(θ) will be denoted by RT(θ). Sometimes RT(θ) will be written as R(−θ), to which it is equal. For compactness of text, a 2 × 2 matrix such as that for R(θ) in Equation 1 will in places be written

Numerical examples will be used to illustrate points arising in this paper. For convenience, the values given will in places be rounded or truncated to four, three or two significant figures.
The distortion tensor
The traditional method of telluric prospecting (Telford et al., 1976) relates the electric field Em measured at a local site to the electric field Eb at a regional or base site by the distortion tensor D according to

When matrix D is stated relative to axes OX, OY (north and east), the values of its components relative to axes OXʹ, OYʹ (which are rotated θʹ clockwise from north and east as in Figure 1) will be those of a matrix Dʹ, given by

While generally D is frequency-dependent and complex, this paper takes the common model for the electric-field distortion of magnetotelluric observations for which D is in-phase (i.e. pure real, as for a direct current case) (Jones, 2012; Weidelt and Chave, 2012). Then for a change of electric field Eb at the regional site there will be, at the observing site, a change of electric field Em generally of a different amplitude and generally in a different direction.
In the most simple case, the geological structure at the regional or base site will be one-dimensional (1D); that is, varying with depth only. The distortion of the regionally-induced electric field will be by a two-dimensional (2D) structure at the local site, and the distortion there will have 2D characteristics. The 2D axes of the distortion will then correspond to some geological property such as local strike, which it is valuable to determine. The knowledge of strike direction is of fundamental importance for interpretation and modelling.
Eigenanalysis and singular value decomposition (SVD) are two methods of linear algebra which it is natural to assess for applications to such studies (Eggers, 1982; LaTorraca et al., 1986; Yee and Paulson, 1987). If applied to the distortion tensor, as in this paper, eigenanalysis and SVD will individually determine, with a 90° ambiguity, the geologic strike direction for the most simple 2D case. In a more complicated case, the two methods individually may help to find a direction which is the strike of a 2D model approximating the actual situation. The methods will also show if a situation is far from 2D, so that 2D modelling may not be justified. Quantitative parameters for the 1D, 2D and 3D characteristics of a matrix are defined clearly.
This paper thus describes the application of eigenanalysis and SVD to the telluric distortion matrix. Telluric distortion may also be of wider interest to students of linear algebra who value a practical example which demonstrates these two methods. Both methods have great strength and wide application for large matrices. However examples of 2 × 2 matrices given to introduce eigenanalysis and SVD are sometimes artificial. The telluric distortion matrix provides a 2 × 2 example which is physically realistic, and which can be visualised.
When referring to matrices in this paper, the term ‘observed point’ will sometimes be used when plotting the number pair (Dxx, Dxy) on a diagram. The values of Dxx and Dxy are as in Equation 4. Though computed from field observations, they are ‘observed’ in the sense that they are relative to the axes of field observation, before any exercises of axis rotation are invoked.
Eigenanalysis
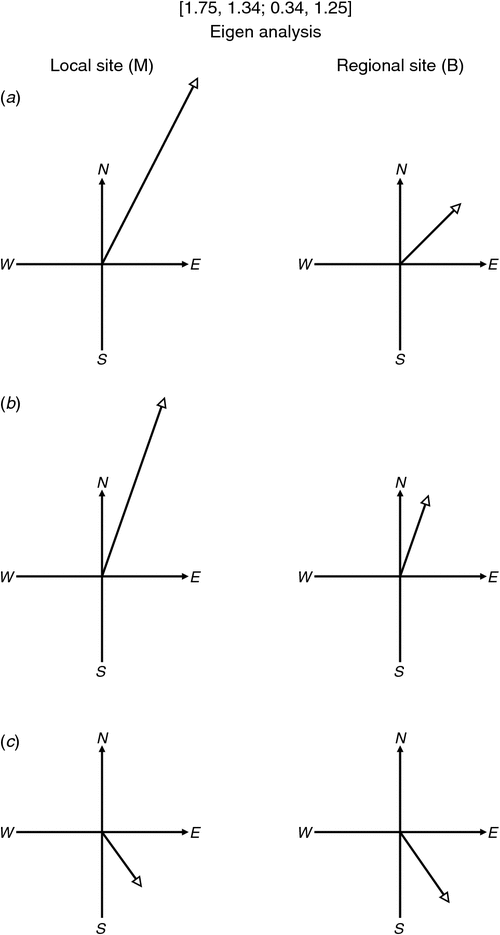
Eigenvector analysis amounts to finding a direction of regional electric field change for which the measured local electric field change is in the same direction. The eigenvalue for that direction then gives the gain of the process, i.e. the amplitude of the local measured signal for unit amplitude regional signal. With reference to Equations 3 and 4 a direction is thus sought in which an OXʹ regional signal is accompanied only by an OXʹ local signal. This requirement can be regarded as finding an angle of axes rotation for which Dʹyx is zero, and leads to the solutions given in the section Formal eigenvalue analysis below. Commonly (but not always) there will be two real eigenvectors, each with an associated eigenvalue. For the example matrix

the eigenvector directions (19.3° and 144.2°) and the effects of the eigenvalues (2.22 and 0.78) are shown in Figure 2.
|
Formal eigenvalue analysis
The eigenvalue problem (Strang, 2005) seeks solutions for the equation which expresses Em and Eb to be parallel:

where ζ is a real scalar. Equation 6 may be combined with Equation 3 and cast as

where I is the identity matrix [1, 0; 0,1]. For there to be a non-zero solution for Eb, the determinant of (D − ζI) must be zero, and for the 2 × 2 distortion matrix, this condition gives what is known as the ‘characteristic equation’ for matrix D:

The characteristic equation is solved for the eigenvalues ζi and ζ2, and then eigenvectors are found corresponding to these eigenvalues.
The characteristic equation has solutions

Three cases of Equation 9 are possible and of interest. Each will now be discussed separately.
Eigenvalues are real and different
Taking as the first case the condition

the two roots of the characteristic equation are both real, different, and positive or negative depending on the signs and magnitudes of (Dxx + Dyy) and (DxxDyy − DxyDyx). These latter quantities are recognised as the trace (trD) and determinant (detD) of D.
The product of the two eigenvalues is given by

and is positive if detD is positive, negative if detD is negative, and zero if detD is singular (in which case there will be an eigenvalue of zero).
In the case of the example matrix in Equation 5, this analysis gives the results displayed in Figure 2. The eigenvalues of 2.22 and 0.78 are given by Equation 9, and eigenvectors are found directly (for this 2 × 2 matrix) by expanding Equation 7 to give

which, for Dxx, ζ1 and Dxy values of 1.75, 2.22 and 1.34 respectively, gives an Eyb/Exb ratio of 0.35, and so an eigenvector of bearing arctan(0.35), which is 19.3° (or 199.3°). Similarly, the ζ2 value of 0.78 gives an Eyb/Exb ratio of −0.72 and so an eigenvector of bearing arctan(−0.72), which is 144.2° (or 324.2°).
Eigenvalues are real and equal
The second case occurs when

The two roots of the characteristic equation are now both real (positive or negative), and equal. In fact,

and the product of the two roots, ζ1ζ2, will always be positive. In this case there is only one direction for Em and Eb to be parallel.
Eigenvalues are complex conjugate pairs
The third case occurs when

and the two roots of the characteristic equation form a complex conjugate pair. The product of the two roots, ζ1ζ2, will again always be positive. An equivalent way of expressing Inequality 15 is

In this third case there is no direction for which Em and Eb are parallel.
Eigenvalues on Mohr diagrams
Mohr diagrams may be used to display 2 × 2 matrices. Upon expanding Equation 4 for Dʹxx, Dʹxy, Dʹyx and Dʹyy it is seen that

and

Thus (Dʹxx + Dʹyy) and (Dʹxy − Dʹyx) are independent of θʹ and are rotational invariants. Also it may be shown that

where

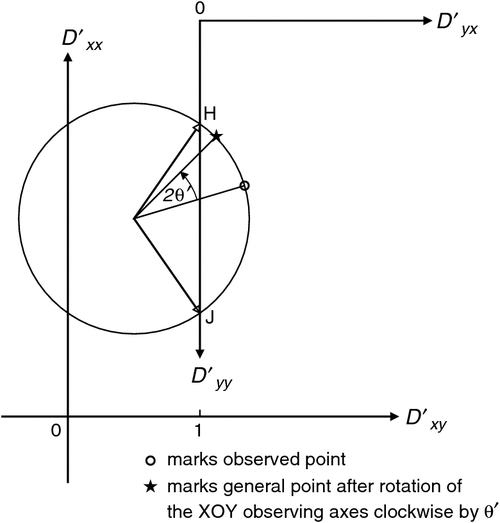
Equation 19 defines a circle when Dʹxx is plotted against Dʹxy as the axes are rotated and θʹ varies. The centre of the circle is at the point [(Dxx + Dyy)/2, (Dxy − Dyx)/2] and the circle is of radius r, another rotational invariant. On such a figure, axes for Dʹyx and Dʹyy may also be drawn, so that the variation with axis rotation of all components of Dʹ is then displayed (Lilley, 1993). Other circles are also possible, for example if Dʹyy is plotted against Dʹxy (Lilley, 1998). For reference, Appendix A shows a basic Mohr circle with the radius r marked, and extends the diagram to show also an area (another circle) which has the numerical value of the determinant of the 2 × 2 matrix, scaled by π. The determinant is a further rotational invariant of the matrix.
Figure 3 shows the Mohr diagram for the example matrix [1.75, 1.34; 0.34, 1.25]. Axes are also drawn for Dʹyx and Dʹyy. The radial arrows from the circle centre to points H and J give eigenvector directions when read as on a dial. (For reading eigenvector directions ‘as on a map’ see Appendix B.) On Figure 3, eigenvalues are found, and can be read off where the arrowheads touch vertical axes.
|
In Figure 3, the circle crosses the vertical axes. The two eigenvalues are the intercept values of Dʹxx, where Dʹyx = 0. Radial arrows are drawn to points H and J, the two Dʹyx = 0 intercepts on Figure 3, and the two eigenvector directions are given by the θʹ values for these radial arms. By the symmetry of the figure, the two eigenvalues can be seen to be also given by where the circle intersects the Dʹxx axis, and are 2.22 and 0.78 in this example.
Diagrams for a range of matrices
Figure 4 shows the Mohr diagram for the example matrix [1.75, 1.34; 0.34, 1.25] in the context of six related matrices. In Figure 4a, b axes are again drawn for Dʹyx and Dʹyy.
The three eigenvalue cases just discussed in the section Formal eigenvalue analysis are clearly distinguished when the matrices are represented by Mohr diagrams, as in Figure 4. Eigenvalues which are real are shown graphically, and the directions of their eigenvectors are shown as on a dial (not as on a map; though see Appendix B).
The example in Figure 4a demonstrates that real eigenvalues correspond to the case of the circle crossing the Dʹxx and Dʹyy vertical axes. Further it can be seen that for a Mohr circle to not enclose or capture the origin the product of the two eigenvalues must be positive; i.e. det D must be positive.
Secondly, for the case discussed in the section Eigenvalues are real and equal, Figure 4b shows a circle which is just touching both the vertical axis Dʹxy = 0 and the vertical axis Dʹyx = 0. The direction of the repeated eigenvector corresponds to the direction of a radial arm which is horizontal in the diagram, as shown. As for Figure 4a, the eigenvalues may be read off the Dʹxx axis, in this particular case as (Dxx + Dyy)/2 (see also Equation 14).
Thirdly, for the case of the section Eigenvalues are complex conjugate pairs, circles which (as in Figure 4c) do not touch or cross the vertical axes obey Inequality 15. Their eigenvalues are complex conjugate pairs, and real eigenvectors for them do not exist. There is no direction of Eb for which Em is parallel.
Finally it is important to note that the identity matrix [1, 0; 0, 1] shown in Figure 4e describes the case of no distortion. Any actual distortion can be viewed as an outgrowth from that identity matrix, and the Mohr diagram for any actual distortion can be viewed as an outgrowth from that single point plotted at Dʹxx = 1, Dʹxy = 0 (an example will be given in Appendix E).
SVD
Description
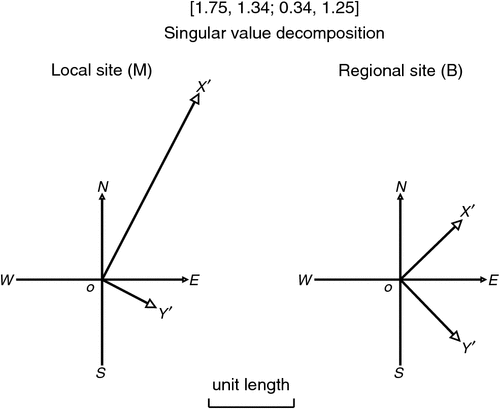
SVD of tensor D produces a rotation for the axes at regional site B, and a (generally) different rotation for the axes at local site M. These rotations are such that a change of electric field along either of the rotated axes at B then produces a change of electric field (generally amplified or attenuated) along the corresponding (differently) rotated axis at M. This situation is depicted in Figure 5.
|
A regional electric field component in the direction of the regional-site OXʹ axis will, at the local site, be in the direction of the OXʹ axis there and, for the matrix used as an example in this paper, be amplified by the singular value 2.46. In Figure 5 the value 2.46 is depicted by the length of the OXʹ axis at the local site.
Similarly a regional electric field component in the direction of the regional-site OYʹ axis will, at the local site, be in the direction of the OYʹ axis there and will be attenuated by the singular value 0.71. The value 0.71 is indicated by the length of the OYʹ axis at the local site.
SVD of a 2 × 2 matrix
Equations for the SVD of a 2 × 2 matrix may be derived directly. Equation 3 is written as

where the local and regional observation axes are rotated clockwise independently, the local axes by θm and the regional axes by θb. Thus the tensor D is factored into

which may be cast as

Equation 23, expanded into its four constituent equations, may be solved to give solutions


and

For the example tensor of Equation 5, the values of θm, θb, w1 and w2 may be evaluated by the equations above as 27.5°, 45.9°, 2.46 and 0.71 respectively. These are the values shown in Figure 5.
The quantities w1 and w2 are termed singular values (and sometimes principal values, or latent values). An examination of the possibility of a singular value being negative is addressed below.
Should one of the singular values be zero, the matrix itself is then termed ‘singular’. This situation is discussed in several places below, especially in the section A condition number to measure singularity.
Ordering w1 > w2
If, following SVD of a 2 × 2 matrix, w2 is found to be greater than w1, their order may be changed by remembering that

and that [0, –1; 1, 0] and [0, 1; –1, 0] both have the form of rotations (see Equation 1).
Solutions found for Equation 22 may therefore be equivalently written

In Figure 5, increasing θm and θb by π/2 causes the sets of axes at both sites M and B to be rotated clockwise by 90°, and the significance of the diagram is left unchanged.
Changing the sign of a negative singular value
If w2 is found to be negative, its sign may be changed by remembering

so that Equation 22 may be written

Then, post-multiplying R(–θm) by [1, 0; 0, –1] gives

In Equation 22, the two column vectors [cosθm, sinθm]T and [–sinθm, cosθm]T of R(–θm) give the directions of the axes at site M in Figure 5. In Equation 32, the first column vector is [cosθm, sinθm]T and unchanged, and so will give an unchanged axis direction. However, the second column vector [sinθm, –cosθm]T has its signs changed, and as a result will give a reversed axis direction. Thus in addition to the rotation of the axes from site B to site M, there has been an axis reflection.
Formal SVD
The results in Figure 5 just described may also be obtained by the formal SVD analysis generally intended for larger matrices. As described for example by Strang (2005), decomposition by SVD factors a matrix D into

where W is diagonal and holds the singular values of D. The columns of V are eigenvectors of DT.D. The columns of U are eigenvectors of D.DT, and may be found by multiplying D by the columns of V. The singular values on the diagonal of W are the square roots (taken positive by convention, a most important point in the present context) of the non-zero eigenvalues of D.DT.
Use of standard SVD routines
Standard computing routines (again generally intended for large matrices) are commonly used for SVD, and it may be useful to note that when the matrix of Equation 5 is put into a standard computing routine, the SVD returned is commonly in the form of Equation 33:

which may be given in the form of Equation 22 by expressing it first as

then as

and further as

The columns of the first matrix [cos27.5°, –sin27.5°; sin27.5°, cos27.5°] in Equation 36, which has been derived as U in Equation 33, define the unit vectors which are drawn for OXʹ and OYʹ at the local site in Figure 5. The rows of the third matrix, [cos45.9°, sin45.9°; –sin45.9°, cos45.9°], derived for VT in Equation 33, define the unit vectors drawn for OXʹ and OYʹ at the regional site in Figure 5. Also, as is evident, the singular values in the diagonal of matrix W are w1 and w2, the amplifying factors for Eʹx and Eʹy respectively at the local site. Standard routines will commonly order w1 > w2.
Discussion of SVD results and comparison with eigenanalysis
By rotation of the local and regional axes separately, the distortion tensor has been reduced by SVD to an ideal 2D form. In a search for the nearest 2D model of distortion in a generally 3D situation the results of SVD may give some insight, but care must be taken in their interpretation. One appealing interpretation worth testing, in the context of known background information, is whether the rotated regional axes give an indication of regional strike, while the rotated local axes give an indication of local 2D strike (to the extent that the concept of a local 2D strike is valid in a 3D situation). For the example matrix analysed above, the SVD result of a unit regional field change at bearing 45.9° giving a local field change of amplitude 2.46 at bearing 27.5°, may be compared with the eigenanalysis result that a unit regional field change at bearing 19.3° gives a local field change of amplitude 2.22 at bearing 19.3°. The discrepancies between the ‘best 2D axes’ of these results indicates the 3D nature of the matrix analysed, and the hazard of proceeding with 2D modelling in such a case.
SVD displayed on a Mohr diagram
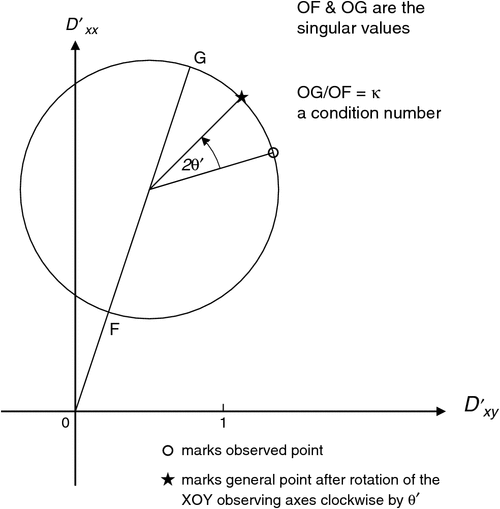
The Mohr diagram for the example matrix in Figures 3 and 4a is shown again in Figure 6, where now the results of SVD are displayed. The two singular values w1 and w2 are shown by the intervals OG and OF. In Figure 6 the angle by which OG is rotated clockwise from the vertical Dʹxx axis is (θb – θm), as can be seen from Equation 25. On the circle, to move the observed point anticlockwise by angle 2θʹ to G requires a clockwise rotation of the XOY observing axes (as in Figure 1) by angle θʹ = θm.
|
With an extra construction, shown in Appendix C, the Mohr diagram also shows the directions of the SVD axes, as read on a map.
Matrix equations displayed by Mohr diagrams, term by term
Adopting the description of a 2 × 2 matrix by a Mohr diagram, as derived in the section Eigenvalues on Mohr diagrams, allows each individual matrix in an equation such as Equation 22 to be illustrated. A complete equation may be represented term by term, as shown for Equation 22 in Figure 7a, using the numerical values of Equation 37.

|
Using these same values of θm, θb, w1 and w2, Equation 23 may then similarly be depicted, as shown in Figure 7b.
Matrices with negative determinants
In this section, the circumstances and consequences of the matrix having a negative determinant will be addressed.
Eigenanalysis
As is demonstrated in Figure 4g, a 2 × 2 matrix with a negative determinant has one positive and one negative eigenvalue. The eigenvector corresponding to the negative eigenvalue may therefore at the local site be drawn reversed, relative to its direction at the base site. A unit field change in the direction of the eigenvector at the base site will then give a field change at the local site in the direction of the (reversed) eigenvector there, of amplitude equal to the modulus of the negative eigenvalue.
SVD
The consequences of a negative determinant for the SVD of a matrix are in some ways more complicated than for the eigenanalysis of the matrix. Following the procedure shown in Figure 5, where axes at site M are simply rotated relative to axes at site B, a matrix with a negative determinant would give a negative singular value for one of the axes.
Following, however, the common convention by which singular values are never quoted negative, it then becomes necessary to reverse the axis at site M for which the singular value has been found to be negative (see the section Changing the sign of a negative singular value). By reversing the axis to which it applies, the (otherwise negative) singular value is rendered positive, as required by convention.
Negative determinants: the situation with distortion matrices, and Groom-Bailey analysis
No case histories of negative determinants for telluric distortion matrices are known to the author, and it is likely that they arise very rarely, if at all. However there are reported cases of magnetotelluric tensors with in-phase and/or quadrature parts with negative determinants, and distortion matrices with negative determinants (should they exist) would be candidates for causing such phenomena.
The Groom-Bailey analysis of the distortion tensor (Groom and Bailey, 1989, 1991), based on their particular decomposition model, is widely used in the analysis of observed magnetotelluric data (Jones, 2012). For reasons which it is instructive to now examine, this decomposition does not cater for the possibility of the distortion matrix having a negative determinant.
Using the notation of Jones (2012) (but with the D of the present paper) the Groom-Bailey decomposition is

where g is a scalar (assumed positive) called site gain. T, S and A, respectively the twist, shear and anisotropy, are expressed


and

in terms, respectively, of scalar quantities t, s and a. Often ‘twist’ and ‘shear’ are expressed as angles, in which case t and s, respectively, are the tangent values of those angles. (Note that Equation 39 is comparable to Equation 1 for the definition of axes rotation, but with arctan t = –θ.)
It is useful here to also define a positive factor f

which, when multiplied by the gain g, produces a ‘modified gain’ gm :

Equation 38 may then be expressed as

The determinant of D will be the product of the separate determinants of T, S and A, multiplied by the scalar g2, and may be expressed as

For |s| < 1 and |a| < 1, det D will never be negative. Regarding |s|, Jones (2012) states that there is a physical limit of unity on |s| in that ‘distortion can never be so severe that it will cause the local fields to have a component in the reverse direction to the regional fields’. Regarding |a|, Jones (2012) states that ‘the obvious physical limit on |a| is that it must be less than unity – an anisotropy |a| > 1 would yield negative resistivity in one of the directions’. The value of det D is thus never expected to be negative. While it is certainly not obvious how a local distorting structure could cause a reversal of the telluric electric field, a more comprehensive proof that negative determinants are physically impossible would be a valuable addition to the theory of telluric distortion.
Distortion matrices which are singular, or nearly singular but singular within error, are common and well-known. Jones (2012), for example, when discussing Groom-Bailey shear, notes that the limit on shear angle is 45°, and quotes the case of a narrow valley filled with conducting sediments as exhibiting an electric field in just one direction (a property of a singular distortion matrix). From recognising that singular distortion matrices are not uncommon, it is then a simple step to expect some distortion matrices to be calculated with negative determinants, due simply to experimental error in measurements which, more accurately, would give the zero determinant of the singular case.
A relevant point regarding the Groom-Bailey decomposition is that the anisotropy matrix A in Equation 41 has the same form as the SVD matrix in the centre of the right-hand side of Equation 22. In terms of the Groom-Bailey notation, the SVD decomposition of Equation 22 (shown in Figure 7a) is gT1.A.T2, where T1 and T2 are different rotations, through angles –θm and θb respectively. For 2D, θm = θb.
While in the Groom-Bailey decomposition the only explicit rotation is T and it is called ‘twist’, in SVD (see Equation 22) the term ‘twist’ is better kept for the difference between the two rotations, θb and θm. Twist, defined as (θb – θm), is then zero for 2D. The Groom-Bailey decomposition has the added complication that the shear operator S also contributes a rotation.
In Appendix E below, a comparison of the decompositions gT.S.A and gT1.A.T2 (the latter returned to the notation of this paper as R1.W.R2) is made by re-composing each, step by step, in terms of their Mohr diagrams.
Invariants of rotation in review
Many invariants of rotation of the distortion tensor have been introduced in earlier sections of this paper, and in this section a useful set of invariants which is evident on a Mohr diagram will be summarised.
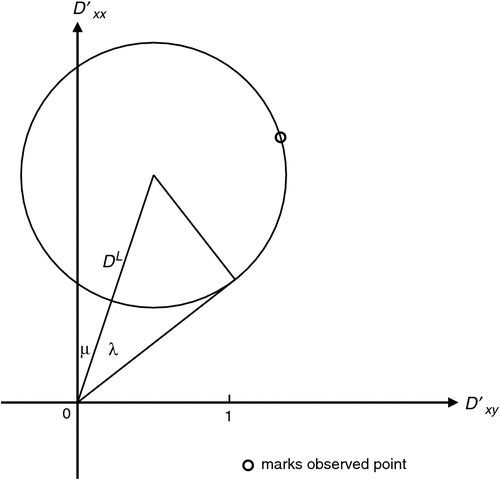
This set, which the author has found convenient, is shown in Figure 8. Thus DL gives a gain relative to the undistorted value of unity, λ as an angle gives a measure of 2D, and μ as an angle gives a measure of 3D.
In terms of the quantities in Equation 22, Figures 6 and 8, it can be seen that
|


and

A condition number to measure singularity
It is possible that a distortion tensor will exhibit very strong anisotropy and, as a consequence, the tensor will approach a condition of singularity. In a Mohr diagram the condition of singularity is shown by a circle touching the origin, as in Figure 4f. If, for example, D is a singular tensor, then there is some rotation of axes for which both Dʹxx and Dʹxy are zero (or indistinguishable from zero, when error is taken into account). For the student of linear algebra, an example of a null space occurs: it is the line of the direction of regional electric field change which causes nil local electric field change. An example of this null space is discussed in Appendix D, taking the singular matrix given in Figure 4f.
A condition number may be used to warn that singularity is being approached (Strang, 2005). When the condition number becomes high in some sense, the matrix is said to be ill-conditioned (Press et al., 1989). The condition number suggested by Strang (2005) is the norm of the matrix (sometimes called the spectral norm) multiplied by the norm of the inverse of the matrix; or equivalently, the greater principal value of the matrix divided by the lesser principal value. For the 2 × 2 matrix D in Equation 22 the condition number κ is

where the greater and lesser principal values w1 and w2 (given by Equations 26 and 27 above) are the singular values of the matrix. Following the convention that singular values are never negative, a modulus sign is put into the denominator of Equation 49 to cover cases where the lesser principal value might otherwise be determined as negative using Equations 26 and 27. In terms of the Mohr representations in Figure 6, from Equation 49 the condition number is given by

that is,

with λ defined as in Figure 8 and Equation 47. Figure 9 shows κ as a function of λ. While λ itself is a measure of condition, Figure 9 demonstrates that κ is more sensitive than λ as ill-condition is approached. Note that κ ≥ 1, for all λ.

|
An anisotropy number
The complication, caused by a negative determinant in the definition of the condition number, suggests that in place of the latter a number might be useful which is defined as the ratio of the radius of the Mohr circle (r in Equation 20) to the distance of the centre of the circle from the origin (DL in Figure 8). Denoting such an ‘anisotropy number’ by A, then (for w1 ordered greater than w2; see the section Orderingw1 > w2),

Such an anisotropy number will be less than unity for positive determinants; be unity for singular matrices; and be greater than unity for determinants which are negative. There will then be no need for concern with conventions such as that under which singular values are always quoted positive.
It can be seen from Equation 47 that for A ≤ 1, λ and A are linked by

Some further examples
In this section, three distortion matrices, already well-studied, will be analysed by eigenanalysis and SVD as further examples of the application of these techniques. The examples are from different origins but all are described by Jones (2012), to whose discussion it is strongly recommended the reader refer. For these examples, Jones (2012) gives values for the Groom-Bailey decomposition parameters of twist, shear, anisotropy and gain, which will be quoted here for comparison. However, it is the experience of the present author that while the terms ‘twist’ and ‘shear’ have their origin in practical matters which can be visualised, in fact as they occur in the Groom-Bailey analysis their visualisation is not straightforward. Thus they are not clearly evident on a Mohr diagram for a distortion tensor, which otherwise shows a wide range of invariants.
Larsen and Hawaii
The first case comes from Larsen (1975) as presented by Jones (2012) in the form of Equation 3. The distortion matrix is quoted as [0.803, 0.835; 0.635, 1.197]. Jones (2012) describes this example as being one of relatively strong distortion, with values of 1.7°, 36.6°, 0.175 and 0.996 for the Groom-Bailey parameters of twist, shear, anisotropy and gain respectively.
Eigenanalysis
Eigenanalysis as described above gives eigenvectors of magnitudes 1.75 and 0.25 at bearings 48.5° and –33.4° respectively. These eigenanalysis results are presented in map form on the left-hand side of Figure 10.
SVD
SVD as described above gives axes rotations of –34.7° and –40.4° for the regional and local sites respectively, with amplifications of 0.25 and 1.77 in the OXʹ and OYʹ directions at the local site. These SVD results are also presented in map form on the left-hand side of Figure 10. A comparison of the eigenanalyses and SVD results shows them to be very similar, indicating that the matrix is close to 2D.
Mohr diagram
The eigenanalysis and SVD results are also shown in the Mohr diagram for the matrix, as displayed in Figure 10.
From the Mohr diagram, the distortion can be seen to be strongly 2D. In terms of the invariants shown in Figure 8 to characterise dimensionality, the values in Figure 10 are DL = 1.0, λ = 49.1°, and μ = 5.7°. This small value of μ (the indicator of 3D structure) may be barely distinguishable from zero, when likely error is taken into account.
Model computation of Groom and Bailey
The next example comes from the response computed for a simple model by Groom and Bailey (1991). The distortion matrix is quoted as [1.91, 0.62; 0.62, 0.67]. Jones (2012) describes this example as being one of moderate distortion, with values of –12.2°, 30.2°, 0.37 and 1.23 for the Groom-Bailey parameters of twist, shear, anisotropy and (modified) gain respectively. The matrix is immediately seen to be symmetric, and so will have the 2D characteristics evident in Figure 4d.
Eigenanalysis
Eigenanalysis as described above gives eigenvectors of magnitudes 2.16 and 0.42 at bearings 21.8° and –67.4° respectively. These eigenanalysis results, with the eigenvector of bearing -67.4° given its reverse direction of 112.6° for easier comparison with the SVD results, are presented in map form on the left-hand side of Figure 11.

|
SVD
SVD as described above gives axes rotations of 22.5° and 22.5° for the regional and local sites respectively, with amplifications of 2.17 and 0.42 in the OXʹ and OYʹ directions at the local site. These SVD results are also presented in map form on the left-hand side of Figure 11.
This SVD result of 22.5° is consistent with the geometry of the model considered by Groom and Bailey (1991). Following Jones, adding the twist (–12.2°) and shear (30.2°) values gives 18.0° for the ‘current channelling azimuth’, which is close to, but perhaps significantly discrepant from, the 22.5° SVD result (and the model geometry).
Mohr diagram
The eigenanalysis and SVD results are also shown in the Mohr diagram for the matrix, as displayed in Figure 11.
From the Mohr diagram, the distortion can be seen to be purely 2D. In terms of the invariants shown in Figure 8 to characterise dimensionality, the values in Figure 11 are DL = 1.3, λ = 42.7°, and μ = 0.0°.
This matrix example is discussed further in Appendix E. There, its Groom-Bailey and singular value decompositions are compared, by using them to ‘re-compose’ the matrix, step by step.
Chakridi case
This example also comes from the response computed for a simple model, in this case by Chakridi et al. (1992). The matrix is quoted as [1.26, 0.44; 0.53, 0.86].
Jones (2012) describes this matrix as also being one of moderate distortion, with values of –2.1°, 25.0°, 0.17 and 1.06 for the Groom-Bailey parameters of twist, shear, anisotropy and (modified) gain respectively.
Eigenanalysis
Eigenanalysis as described above gives eigenvectors of magnitudes 1.58 and 0.54 at bearings 36.1° and –58.6° respectively. These eigenanalysis results, with the eigenvector of bearing -58.6° given its reverse direction of 121.4° for easier comparison with the SVD results, are presented in map form on the left-hand side of Figure 12.
SVD
SVD as described above gives axes rotations of 35.0° and 32.6° for the regional and local sites respectively, with amplifications of 1.57 and 0.53 in the OXʹ and OYʹ directions at the local site. These SVD results are also presented in map form on the left-hand side of Figure 12.
A comparison of the eigenanalyses and SVD results shows them to be very similar, indicating that the matrix is close to 2D.
Mohr diagram
The eigenanalysis and SVD results are also shown in the Mohr diagram for the matrix, as displayed in Figure 12.
From Figure 12, the distortion can be seen to be strongly 2D, with 3D characteristics barely distinguishable above likely error level. In terms of the invariants shown in Figure 8 to characterise dimensionality, the values in Figure 12 are DL = 1.0, λ = 30.0°, and μ = –2.4°. This small value of μ (the indicator of 3D structure) may be barely detectable as different from zero, when error is taken into account.
Conclusions
The 2 × 2 matrix which describes the local distortion of the electric field in natural electromagnetic induction in the Earth provides practical examples with which to demonstrate the processes of eigenanalysis and SVD. Distortion matrices which approach singularity arise from time to time, and because they are incorporated as multipliers in both the in-phase and quadrature parts of observed magnetotelluric impedance tensors, they may disrupt the analysis of magnetotelluric data. Monitoring any approach to singularity with a condition number may therefore be useful. An anisotropy number as introduced may also be useful, and has the advantage of showing clearly when a matrix has a negative determinant.
A Mohr diagram for a 2 × 2 matrix is shown to be versatile in displaying a wide range of the properties of the matrix, especially those which are invariant with rotation of the reference axes. Several of the quantities depicted in a Mohr diagram may be useful as measures of the extent to which the matrix is diagnostic of 1D, 2D or 3D geological structure.
Acknowledgements
The author thanks Peter Milligan, Chris Phillips and John Weaver, who have contributed many ideas and much discussion to the material presented in this paper. Chris Phillips is especially thanked for suggesting many improvements to the presentation of the manuscript. Similarly comments by the associate editor and two reviewers have been very valuable and are much appreciated.
References
Chakridi, R., Chouteau, M., and Mareschal, M., 1992, A simple technique for analyzing and partly removing galvanic distortion from the magnetotelluric impedance tensor: application to Abitibi and Kapuskasing data (Canada): Geophysical Journal International, 108, 917–929Eggers, D. E., 1982, An eigenstate formulation of the magnetotelluric impedance tensor: Geophysics, 47, 1204–1214
Groom, R. W., and Bailey, R. C., 1989, Decomposition of magnetotelluric impedance tensors in the presence of local three-dimensional galvanic distortion: Journal of Geophysical Research, 94, 1913–1925
Groom, R. W., and Bailey, R. C., 1991, Analytical investigations of the effects of near surface three dimensional galvanic scatterers on MT tensor decomposition: Geophysics, 56, 496–518
Jones, A. G., 2012, Distortion of magnetotelluric data: its identification and removal, in A. D. Chave, and A. G. Jones, eds., The magnetotelluric method: theory and practice: Cambridge University Press, 219–302.
Korner, T. W., 1990, Fourier analysis: Cambridge University Press.
Larsen, J. C., 1975, Low-frequency (0.1-6.0 cpd) electromagnetic study of deep mantle electrical-conductivity beneath Hawaiian islands: Geophysical Journal of the Royal Astronomical Society, 43, 17–46
LaTorraca, G. A., Madden, T. R., and Korringa, J., 1986, An analysis of the magnetotelluric impedance for three-dimensional conductivity structures: Geophysics, 51, 1819–1829
Lilley, F. E. M., 1993, Magnetotelluric analysis using Mohr circles: Geophysics, 58, 1498–1506
Lilley, F. E. M., 1998, Magnetotelluric tensor decomposition: Part I, Theory for a basic procedure: Geophysics, 63, 1885–1897
Lilley, F. E. M., 2012, Magnetotelluric tensor decomposition: insights from linear algebra and Mohr diagrams, in H. S. Lim, ed., New achievements in geoscience: InTech Open Science, chap. 4, 81–106.
Press, W. H., Teukolsky, S. A., Vetterling, W. T., and Flannery, B. P., 1989, Numerical recipes: the art of scientific computing: Cambridge University Press.
Strang, G., 2005, Linear algebra and its applications (4th edition): Brooks–Cole.
Telford, W. M., Geldart, L. P., Sheriff, R. E., and Keys, D. A., 1976, Applied geophysics: Cambridge University Press.
Weidelt, P., and Chave, A. D., 2012, The magnetotelluric response function, in A. D. Chave, and A. G. Jones, eds., The magnetotelluric method: theory and practice: Cambridge University Press, 122–164.
Yee, E., and Paulson, K. V., 1987, The canonical decomposition and its relationship to other forms of magnetotelluric impedance tensor analysis: Journal of Geophysics, 61, 173–189
Appendix A
Basic Mohr diagram and value of determinant
For reference, a basic Mohr diagram with circle radius r is shown in Figure A-1a. Application of Pythagoras’ theorem shows that the tangent is of length equal to the square root of the determinant (Δ) of the matrix. The determinant is also an invariant with the rotation of axes.
There is often interest in displaying the numerical value of the determinant of a 2 × 2 matrix, when that value is positive (Korner, 1990). On a Mohr diagram it is possible to display the numerical value of Δ in several ways. One way is simply to complete a square, based on the tangent which is shown in Figure A-1a to be of length Δ1/2. Another way is shown in Figure A-1b, where the circle centred on the origin has an area of πΔ.
Appendix B
Construction on a Mohr diagram to show eigenvector directions read as on a map
|
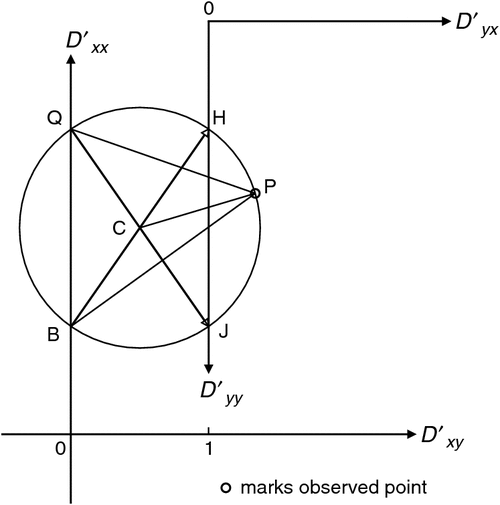
Figure 3 is reproduced as Figure B-1 with some deletions for simplification, and with constructions which give the directions of the eigenvectors, as read on a map.
As described in the section Eigenvalues on Mohr diagrams and Figure 3, directions CH and CJ in Figure B-1 give the eigenvector directions, reading Figure B-1 as a dial. Rotating the observing axes clockwise in Figure 1 by ½∠HCP moves P to H in Figure B-1, and OXʹ in Figure 1 is then aligned with the eigenvector.
Because ∠HBP = ½∠HCP, the direction on Figure B-1 of BP gives the direction (as on a map) of the eigenvector, relative to BH taken as north and the initial axes left unrotated.
For the second eigenvector, represented by direction CJ, similar reasoning leads to its direction on a map being shown by line QP, when QJ is aligned north. (It will be remembered that an eigenvector can with equal validity be drawn either ‘forward’ or ‘reversed’.)
Appendix C
Construction on a Mohr diagram to show SVD directions read as on a map
|
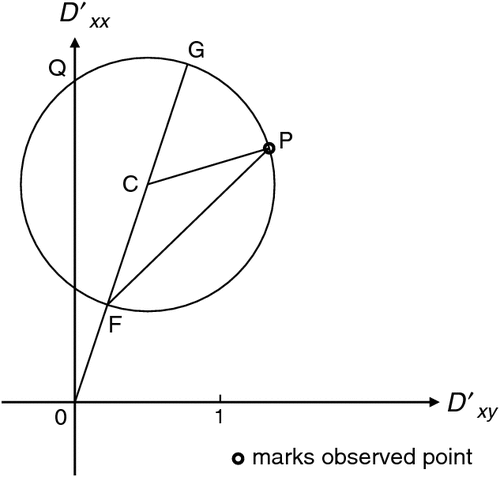
Figure 6 is reproduced as Figure C-1 with some deletions for simplification, and with constructions which give the directions of the SVD axes, as read on a map.
In Figure C-1, ∠GCP = 2θm, so ∠GFP = θm. Because ∠QOG = (θb – θm), when OQ is directed north the line FP is at bearing θb, and thus shows the bearing of the OXʹ axis at the regional site. Further, if OG instead is directed to the north, FP is then at bearing θm, and shows the direction of the OXʹ axis at the local site.
Appendix D
A practical example of a null space
|
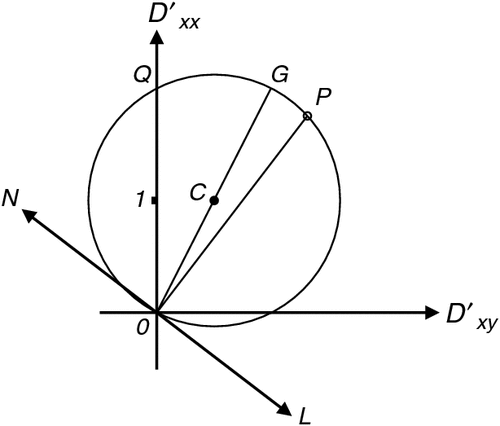
Matrix [1.75, 1.34; 0.33, 0.25] from Figure 4f is singular because its two rows, [1.75, 1.34] and [0.33, 0.25], are not independent. The former is 5.3 times the latter.
Following for example Strang (2005), the null space of the D of Equation 3 consists of all solutions Eb which satisfy

Rotation of the axes as in Figure 1 for matrix [1.75, 1.34; 0.33, 0.25], so that the observed point in Figure 4f moves to the Dʹxx, Dʹxy origin, will render both Dʹxx and Dʹxy zero. Equation D-1 then becomes

The solution of this equation is

which is satisfied for all field changes which obey

Field changes of components (Ebʹx, Ebʹy) have direction arctan(Ebʹy/Ebʹx), relative to the now rotated axes. Thus the line at bearing arctan(–Dʹyx/Dʹyy) (again relative to the now rotated axes) defines the line of the null space of D.
Taking the matrix [1.75, 1.34; 0.33, 0.25] as a numerical example, Equation D-1 becomes

which, solved directly, is found to be satisfied by an Eby/Ebx ratio of –1.3. The value of arctan(–1.30) is –53° or 127°, and so the line of null space has bearing (relative to the original geographic axes) of 127°. This result means that any electric field change at the base site B with bearing 127° will cause nil electric field change at the measurement site M.
Following Appendix C, the direction of the null line on a map is shown on the Mohr diagram. Figure D-1 is Figure 4f redrawn and augmented. With reference to Figure D-1, ∠QOG = (θb – θm) and, because ∠GCP = 2θm, ∠GOP = θm. Therefore ∠QOP = θb, and for alignment with the SVD axes of the matrix as in Figure 5, at site B the axes should be rotated clockwise through this angle. Thus for OQ aligned north as on a map, OP is then the direction of the OXʹ axis at site B. Because the axes in Figure 5 are orthogonal, it follows that (θb + π/2) is the direction of signal at site B which will produce nil signal at site M. In Figure D-1 line NL, drawn perpendicular to OP, has this (θb + π/2) direction.
As a check, θb for this matrix may be found from Equations 24 and 25 to be 37°. On Figure D-1, relative to OQ as north, line NL is at bearing 127°; i.e. at bearing (θb + π/2).
Appendix E
Two re-compositions compared
The example presented in the section Model computation of Groom and Bailey is illustrated here in greater detail. Each step in the multiplication involved in the Groom-Bailey decomposition is presented, as a re-composition, in a series of Mohr diagrams on the left-hand side of Figure E-1. For comparison, on the right-hand side of Figure E-1 the SVD of the same matrix is presented as a re-composition.

|
Thus, on the left-hand side of Figure E-1:
-
Part (a) shows the identity matrix, representing the case of no distortion.
-
Part (b) shows the matrix A.
-
Part (c) shows the result of gA acting on the identity matrix to give gA.I, where the scalar gain factor g (of value 1.55) has also been incorporated in this step.
-
Part (d) shows the matrix S.
-
Part (e) shows the result of S acting on gA.I, to give gS.A.I.
-
Part (f) shows the matrix T.
-
Part (g) shows T acting on gS.A.I to give, as gT.S.A.I, the matrix D and, indeed, the Mohr diagram shown in Figure 11.
For comparison, on the right-hand side of Figure E-1:
-
Part (h) again first shows the identity matrix, representing the case of no distortion.
-
Part (i) shows the matrix R2.
-
Part (j) shows the result of R2 acting on the identity matrix, to give R2.I.
-
Part (k) shows the matrix W.
-
Part (l) shows the result of W acting on R2.I, to give W.R2.I.
-
Part (m) shows the matrix R1.
-
Part (n) shows R1 acting on W.R2.I to give, as R1.W.R2.I the matrix D and, again, the Mohr diagram shown in Figure 11.
An important point to note is that Groom-Bailey decomposition allocates 2D characteristics by both A and S, the latter of which also contributes a 3D rotation. In contrast, the SVD treatment shows a sole 2D component (W in Figure E-1) and 3D contributions enter as rotations only.


