Exploring colorimetric detection of perfluorooctane sulfonate using micelle solubilised porphyrin
Chloe M. Taylor A , Michael C. Breadmore
  A B and Nathan L. Kilah
  A *
A *
A School of Natural Sciences – Chemistry, College of Science and Engineering, University of Tasmania, Hobart, Tas., Australia.
B Australian Centre for Research on Separation Science, School of Natural Sciences – Chemistry, College of Science and Engineering, University of Tasmania, Hobart, Tas., Australia.
Australian Journal of Chemistry - https://doi.org/10.1071/CH23061
Submitted: 27 March 2023 Accepted: 11 June 2023 Published online: 14 July 2023
Abstract
The harmful pollutant perfluorooctane sulfonate (PFOS) is difficult to detect without extensive laboratory equipment used by trained personnel. Herein, we report the use of a micelle-encapsulated porphyrin host molecule as a rapid colorimetric indicator for PFOS and its anionic salts. A range of common commercially available surfactants were tested and optimised to encapsulate the hydrophobic highly pigmented porphyrin sensor molecule. This method was used for the detection of PFOS in aqueous solutions at concentrations as low as 3 ppm. Colour space RGB information was extracted from a mobile phone photograph and parameterised, allowing for threshold PFOS detection, demonstrating the applicability of this method as an easily accessible approach to inform an untrained user.
Keywords: colorimetric, detection, micelle, PFAS, pollutant, porphyrin, sensor, supramolecular.
Introduction
Per- and polyfluoroalkyl substances (PFAS) are a class of long-lived anthropogenic pollutants that are of concern for human health. The most well-known, publicised, and studied PFAS are perfluorooctanoic acid (PFOA) and perfluorooctane sulfonate (PFOS).[1] The use of PFAS in manufacturing and industry was driven by their unique and useful chemical characteristics such as hydrophobicity and chemical resistivity; the same characteristics that have resulted in their ubiquitous dispersal in the environment,[2] and bioaccumulation in the general population.[3]
There are many classes and subcategories of PFAS but the most heavily regulated and investigated are the ‘long-chain’ perfluoroalkyl acids. Both PFOA and PFOS have a typical surfactant structure comprising a hydrophobic ‘tail’ and a hydrophilic ‘head’ (Fig. 1). PFOA and PFOS are often concentrated at air–water interfaces when particular concentration thresholds have been exceeded,[4–6] and this behaviour is known to occur at concentrations of 0.5–30 mg/L.[7] The partitioning behaviour means that anywhere from 50 to 75% of the mass of PFAS may be present at the interface of the bulk solution.[7,8] There are further implications for the surface activity of these compounds due to the difference in surface tension between counterions; the surface tension of PFOA as a sodium salt is almost double that of PFOA as a free acid.[9] This has significant impacts on the transport of these molecules in the environment, but also on our ability to detect and quantify them. With the implementation of regulatory limits for these compounds in soil and water, there has been an increased demand for rapid PFAS detection methods.[10] Current technologies are highly labour and time intensive, and require expensive laboratory equipment and significant sample preparation.[11] The standard methods for analysis include liquid chromatography–mass spectrometry (LC–MS) or gas chromatography–mass spectrometry (GC–MS). These analysis methods, and appropriate pre-treatment, are required for the measurement of PFOS in water, where the permissible concentration can be as low as 0.7 ppt.[12] Other environmental samples, such as soils, can be highly contaminated (part per million concentrations or higher) and require dilution prior to analysis.[13] Detection, remediation, and monitoring are hindered by the time and cost of these techniques, which has created a need for in situ, rapid, and potentially user-friendly alternatives. A diagnostic ‘yes/no’ analysis method would allow for determination above or below set thresholds that could aid and direct remediation procedures. Trends in the literature show a shift towards small molecule, sensor-based technology to support these needs.[14,15] Previous small molecule PFAS sensors have used methylene blue cationic dyes,[16] ethyl violet dyes,[17] and a fluorescence detection method utilising an eosin Y-polyethyleneimine system.[18] Other colorimetric sensing methods specifically targeting the rapid determination of PFOS have detection limits of 1–10 ppm using ion-pairing on paper based devices,[19] and methylene blue active substances methods coupled to grafted imidazolium groups to form nanolayers.[20,21]
Structure of α,α,α,α-5,10,15,20-tetrakis[2-(perfluorooctanoyl)aminophenyl]-21H,23H-porphyrin) (1) and common PFAS, PFOA and PFOS.
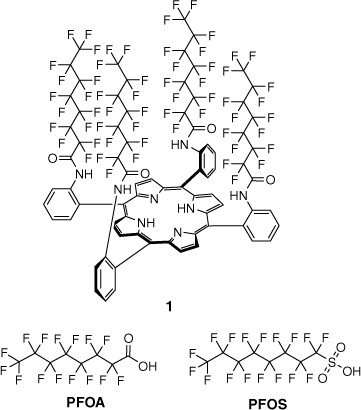
In previous work, we developed porphyrin-based host molecule 1 (Fig. 1) to function as a colorimetric indicator for PFOA and other perfluorinated carboxylic acids and their salts.[22,23] When testing the host molecule 1 with perfluorinated sulfonates such as PFOS, it was observed that, on occasion, the surface at the solution–air interface would change colour upon addition, but immediately return to the original host colour. This transitory response suggested the interaction between host 1 and PFOS was not as facile as that of PFOA and other perfluorinated carboxylic acids. Investigations into the micellar behaviour of PFOS anions have shown pre-micellar aggregates form in solution prior to the critical micelle concentration (CMC), above which they form small and strongly ionised hydrated micelles.[24] It was also noted that there was an energetic advantage for micelle formation relative to adsorption at an air–water interface. Micelles have been shown as a useful platform for sensing applications. These surfactant-supported molecular assemblies have been used for a range of applications in sensing, including the detection of explosives,[25] fluoride,[26] and even the SARS-COV-2 virus.[27] There are numerous surfactants that vary in their structure, function, and purpose, but they can be broadly classified as non-ionic, amphoteric, cationic, and anionic, which describe the polar, hydrophilic ‘head’ group.[28,29]
To design a detection method targeting PFOS and other perfluorinated sulfonates, we looked to exploit the surfactant properties of the target analyte. Other hydrophobic porphyrin molecules have shown enhanced capabilities when solubilised by micelles compared to dispersion in an aqueous solution.[30] Suspending 1 in a micellular solution was envisioned to position the hydrophobic porphyrin host for favourable interactions with PFOS in an aqueous solution. There was a particular focus on the potential application of this work for visual-based sensing techniques, which considered both visual perception and the parameterisation of RGB colour space values for threshold analysis.
Results and discussion
Design considerations
The host molecule 1 is hydrophobic due to the tetra-substituted perfluorinated picket-fence structure, in which the fluorinated groups provide a fluorophilic cavity to interact with PFAS guest molecules. The host molecule structure is somewhat reminiscent of a surfactant, with a very hydrophilic ‘tail’ that is known for aggregation and assemblies across different concentration ranges in similar molecules.[31,32] It was thought these properties could be exploited by combining the host molecule and a surfactant with well-established CMC values into an assembled micelle solution. For a successful colorimetric sensing interaction to occur, it must be energetically favourable for the PFAS to associate with the micellular solution of host 1. The effective CMC of the surfactants being screened was likely reduced by the presence of both host 1 and the analyte,[33] so initial assembly concentrations were set just above the known CMC values of the solubilising surfactants (Table 1). The assembly of micelles is also known to be influenced by a range of other factors, most commonly solvent, temperature, or the presence of electrolytes or dissolved species.
| Surfactant | Abbreviation | Charge | CMC (mM) | Reference | |
|---|---|---|---|---|---|
| Sodium dodecyl sulfate | SDS | Anionic | 8.2 | [ 34] | |
| Hexadecyltrimethylammonium bromide | CTAB | Cationic | 0.92 | [ 34] | |
| TRITON™ X-100 | TritonX-100 | Neutral | 0.23 | [ 35] | |
| TRITON™ X-114 | TritonX-114 | Neutral | 0.22 | [ 36] | |
| Tergitol™ | Tergitol | Neutral | 0.09 | [ 37] | |
| Tween® 20 | Tween 20 | Neutral | 0.06 | [ 38] | |
| Tween® 60 | Tween 60 | Neutral | 0.05 | [ 39] |
The host concentration will impact the visual perception of the mixture and determine the colour intensity; the more host suspended in the micelle solution, the more visible the colour is to the naked eye. Our previous work has identified that host molecule 1 provides optimal colorimetric responses when the number of moles of host in solution approximates the concentration of the perfluorocarboxylic acid (PFCA) analyte.[23] Once saturated, additional guest molecules cannot elicit a greater colour change. Consequently, there is an optimal range where the initial host colour is intense enough to be seen, yet the complexed ‘PFOS positive’ colour change is still perceptible as a combination of the host–guest colour and unbound host colour.
The compatibility of host molecule 1 with a range of organic solvents was previously established,[22] and guided the preparation of the micelles. Because the density of the dispersed host 1 in the final aqueous solution will determine the colour and sensor capacity, a high solubility is essential. The solvent must also be compatible with the chosen surfactants, and not impede the binding of PFOS.
Micelle assembly conditions
Tetra-substituted hydrophobic porphyrins have been successfully encapsulated using a variety of different surfactant types,[40] so we initially explored the suitability of some common cationic, anionic, and non-ionic surfactants, with varied structural properties and CMC values (Table 1).
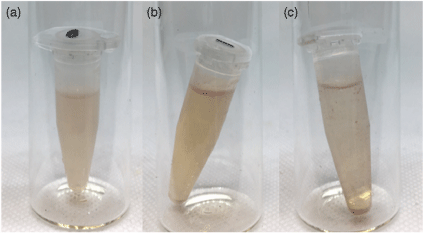
The preliminary micelle assemblies were aimed at establishing how much sensor could be solubilised in an aqueous solution. This was determined by making an aqueous solution of a surfactant above the CMC, to which increasing volumes of a concentrated solution of host 1 in organic solvent was added, and the mixture sonicated for 30 min. Depending on the solvent type and choice of surfactant, coloured host solutions could be made using 5–500 µL of host solution for every 1 mL of aqueous surfactant solution. Generally, above this concentration there was precipitation (Fig. 2c), and below this concentration the colour was not readily visible.
Comparison of host loading: (a) Homogenous aqueous solution of CTAB (1 mL, 2 × 10⁻² M) combined with a solution of host 1 in dichloromethane (110 µL, 2 × 10⁻⁴ M) after sonication. (b) The separation and slight precipitation observed with an aqueous solution of CTAB (1 mL, 2 × 10⁻² M) and host 1 in dichloromethane (500 µL, 2 × 10⁻⁴ M). (c) The significant precipitation observed with an aqueous solution of CTAB (1 mL, 2 × 10⁻² M) and host 1 in dichloromethane (500 µL, 2 × 10⁻⁴ M) after sonication for 30 min.
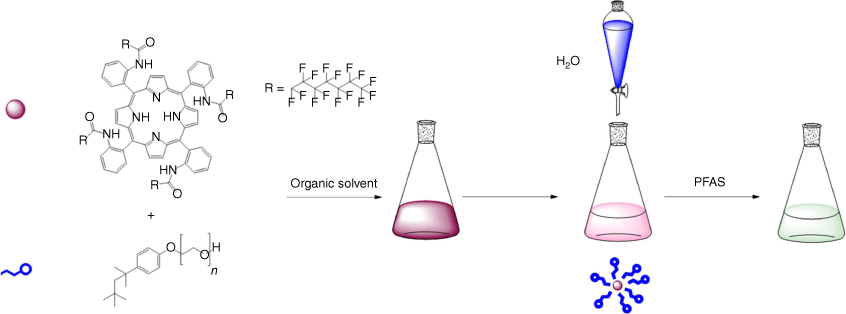
The assembly method of solubilising the host molecule was trialled using different techniques from the literature.[30,41,42] The most repeatable results were achieved by dissolving host 1 in minimal organic solvent (measured by weight), adding the required mass of surfactant, and stirring vigorously. Once the organic phase was homogenised, Milli-Q water could then be added dropwise to reach the final desired volume (Scheme 1). By allowing the final mixture to stir for 24 h, some residual organic solvent may evaporate, and any excess or unencapsulated host may precipitate.[43] All subsequent experiments were conducted at concentrations of 1 and water volumes that did not result in precipitation. The rate of water addition was important to produce a stable homogeneous solution. The water was added dropwise with stirring, as when combined all at once, or added too rapidly, the host was often dispersed as a precipitated solid.
Visual representation of micelle assembly. Minimal organic solvent is used to solubilise the host 1 before adding the surfactant. Water must then be added dropwise with stirring to produce a homogenous aqueous solution of the sensor.
This method was trialled using various combinations of solvents and surfactants. Some surfactants were able to solubilise greater quantities of host in an aqueous solution, observed as a stronger colour intensity. From the screened conditions (Table 2), solutions of 1 with the surfactants TritonX-100, SDS, or CTAB assembled with the solvents dichloromethane (DCM) or acetone were the most stable and reproducible across a wide range of concentrations (see Supplementary material).
| C(Host) (mol/L) | Surfactant | C(Surfactant) (mol/L) | Dispersal solvent | Solvent ratio (wt%) | Colour | Response to KPFOS | |||
|---|---|---|---|---|---|---|---|---|---|
| Colour change | Precipitation | Figure | |||||||
| 4.49 × 10⁻⁵ | CTAB | 1.80 × 10⁻³ | Dioxane | 0.5 |  | × | × | Supplementary Fig. S2 | |
| 1.98 × 10⁻⁷ | CTAB | 8.03 × 10⁻⁵ | THF | 9.9 |  | × | × | Supplementary Fig. S8 | |
| 2.00 × 10⁻⁷ | CTAB | 8.10 × 10⁻³ | DCM | 14.8 |  | × | × | Supplementary Fig. S6 | |
| 6.83 × 10⁻⁶ | Tergitol | 9.97 × 10⁻⁴ | Acetone | 0.4 |  | Supplementary Fig. S3 | |||
| 1.59 × 10⁻⁵ | TritonX-100 | 2.56 × 10⁻⁴ | Acetone | 20.0 |  | × | Fig. 3 | ||
| 1.8 × 10⁻⁵ | SDS | 8.00 × 10⁻³ | Acetone | 8 |  | × | × | Supplementary Fig. S7 | |
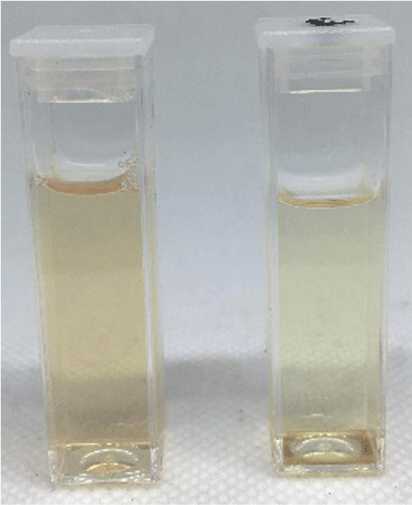
Photograph comparing micellular solutions of 1 (6.8 × 10⁻⁶ M) with TritonX-100 (2.3 × 10⁻³ M) assembled in acetone without (left) and with (right) KPFOS (1.6 × 10⁻⁶ M, ~8 ppm).
Mixtures that were assessed to be homogeneous were analysed by UV–visible spectroscopy. The UV–visible absorption spectra of porphyrins are influenced by their environment.[44,45] A porphyrin assembly with a strong self-interaction, such as a J-aggregate formation,[46,47] or the adsorption of the porphyrin to the exterior of a micelle, will result in a distinct red-shift in the Q-bands.[48] The UV–visible spectra observed were typical for porphyrin molecules in micelles, in which there was a slight broadening of the Soret and Q-bands (Supplementary Fig. S5). This indicates that the host is in a similar solvent environment within the hydrophobic core of the micelle (Supplementary Table S1).[48,49] These experiments were performed across multiple concentration ranges to establish reproducibility of the assembly methods from different combinations of surfactants and solvents, while also confirming there were no shifts in UV–visible absorption due to dimerisation or aggregation of host 1.[50]
Visual PFAS tests
The preassembled micelle mixtures were combined with aqueous solutions containing PFOS (as the potassium salt, KPFOS) and were assessed visually and by UV–visible spectroscopy. In most instances there was a slight colour change visible to the naked eye that occurred immediately upon addition of PFOS (Fig. 3). The cationic systems were initially promising, but it was observed that the stability of the solutions were inconsistent across concentration ranges, temperature, and extended time periods (Supplementary Fig. S6). Modifications were made trialling different organic solvents, and DCM and acetone provided the most significant visual colour change and shift observable in the UV–visible spectroscopic analyses when combined with an aqueous solution of the KPFOS salt.
The anionic surfactant experiments using SDS were visually promising, but the UV–visible spectroscopic analysis indicated the perceived colour change was due to the precipitation of 1 in the presence of KPFOS (Supplementary Fig. S7). This was evidenced as increasing concentrations of KPFOS resulted in a decreased colour intensity and corresponding precipitation. This is still an indirect indication of KPFOS concentrations, but it was not pursued further as decreases in colour are typically more challenging for the human eye to detect than a change in colour.[51]
The non-ionic surfactant systems also showed shifts in the UV–visible spectrum upon the addition of aqueous KPFOS. The non-ionic surfactant TritonX-100 more readily solubilised 1 in the assembly process, and the addition of KPFOS provided a colour change without precipitation. Notably, Tergitol was also successful at solubilising host 1 and providing a strongly coloured solution, but the addition of KPFOS did not provide a detectable colour change (Supplementary Fig. S3). A range of Tween surfactants were also trialled as neutral surfactant alternatives, but they were not compatible with host 1 as they resulted in immediate precipitation or phase separation.
Micelle solutions using TritonX-100 demonstrated a colour change in response to KPFOS without precipitation, unlike the charged and other neutral surfactants. To assess the longer term stability of these solutions, aliquots of the prepared solutions were sonicated with concomitant warming, and left to sit for 24 h to confirm there was no precipitation or change in the colour of the solution.[52] The effective assembly conditions used a solvent loading ratio of 0.5–20 wt% with the final TritonX-100 concentration being 2.0 × 10⁻⁴–5.8 × 10⁻⁴ mol/L, approximately the CMC value.[53,54] The host concentration could then be modified to suit the experiment parameters, constrained by the solubility of host 1 in the volume of organic solvent used.
RGB analysis from a mobile phone photograph
In previous work, we utilised RGB information from mobile phone photographs to estimate PFAS concentrations.[23] This method used simple software (ImageJ, ColorX)[55,56] to measure RGB values and compare the difference between a spiked sample and the host solution. Other colour spaces may be used in image analysis, such as HSV, HSL, CYMK, or LAB. While each colour space has its own advantages and disadvantages, we chose RGB for its ease of use, interpretation, native integration into most imaging devices, and established parameterisation methodology.[23] While other colour spaces were considered, and may ultimately be more useful for a mature sensor technique, the optimisation of the colour space was not a guiding motivation of the present study.
To apply the RGB methodology, samples were prepared in disposable cuvettes by taking a known volume of micellular host solution and combining it with a known volume of aqueous KPFOS solution. The images of the solutions were captured in a lightbox using an iPhone on a tripod to ensure repeatable and consistent lighting. The photographs were analysed using the ImageJ RGB Measure plugin.[56] Each colour was measured in triplicate and each colour channel value was averaged to ensure a representative colour was captured. The application of this method was challenged by the more disperse colour of the micelle solutions, but changes were still measurable, and could be differentiated further using simple RGB analysis.
A colour is composed of three channels, R, G, and B, which are assigned values of 0–255. In previous work we have observed the host molecule to change differently across the three channels in response to perfluorocarboxylic acids.[23] The colour change in response to the addition of PFAS was previously found to be best captured when the RGB colour channels were parameterised, rather than through examining the change in each channel individually.[23] RGB colour space was chosen as it is a flexible and intuitive colour model that is readily accessible from the raw data of mobile phone photographs. For the purpose of investigation, the RGB colour information is also transformed into the CIELAB colour space so that the users perceptions of the colour change could be quantified.[57]
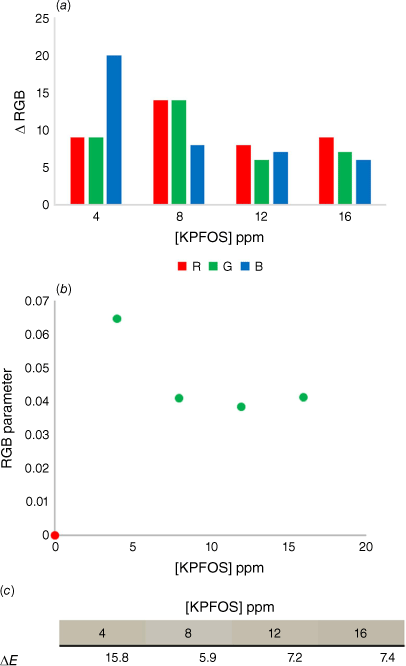
Initially the range of colorimetric responses available were probed using a broader range of host–guest ratios with high concentrations of KPFOS. The reported concentrations are from the volume of the final solution after the addition of the aqueous KPFOS sample (Supplementary Table S2). This indicated that the colour change was more readily detected at sub-stoichiometric ratios (Fig. 4).
(a) The comparison of the change in RGB values for the control samples and the KPFOS spiked samples, (b) the calculated RGB parameters for the control (red) and the PFOS spiked samples (green), and (c) the ∆E values for each KPFOS sample compared to its control host solution.
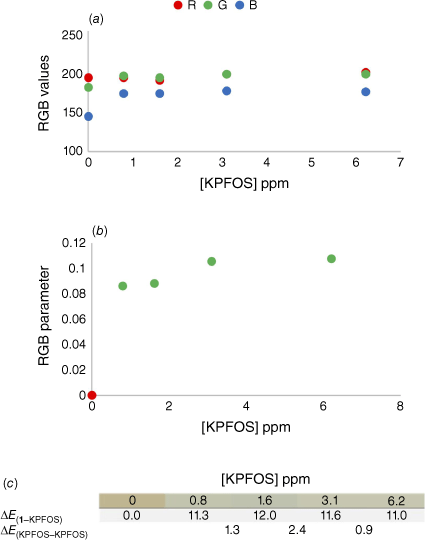
After observing the scope of colour change available above and below the saturation of the host, the sensitivity of the colorimetric response was probed by an experiment in which the host concentration remained constant and the concentration of KPFOS was modified while maintaining equivalent dilution factors (Supplementary Table S3). This allowed for the colours of different concentrations of KPFOS to be directly compared to a single starting host colour. The change in the individual colour channels for each sample show that the lower concentrations of KPFOS result in a larger change prior to the saturation of the host (Fig. 5a). As the direction and magnitude of change in each channel differs, parameterisation can be useful for comparison of changes in the sample.[57,58]
(a) The comparison of raw RGB values for the control samples and the KPFOS spiked samples, (b) the calculated RGB parameters for the control (red) and the PFOS spiked samples (green), and (c) the ∆E values for each KPFOS containing sample compared to the starting host solution (1–KPFOS), and the ∆E values for each KPFOS sample compared to the concentration proceeding it (KPFOS – KPFOS).
Although the hue, saturation, value (HSV) colour space has been previously shown to provide superior precision for colour change measurements, in our case it was observed that the colour changes were less distinguishable when compared to the magnitude and directional changes of the individual colour channels.[57] Instead, to represent this colour change as a single value, the response in each channel is portrayed as the relative proportion of the change in the total RGB value (Eqn 1).[59] The parameter is established by subtracting the initial colour from the sample colour to give a colour difference in each channel (see Supplementary material for further explanation):
The raw RGB values showed subtle changes between the starting host solution and KPFOS samples, predominantly in shifts in the blue channel (Fig. 5a). When applying the well-established colour parameter,[59,60] the host can be readily distinguished from the spiked samples (Fig. 5b). The RGB parameter provides clear discrimination between the control host solution and the samples containing KPFOS in a manner that could allow for a threshold ‘yes/no’ test to be developed. For practical applications, an established concentration of sensor would be calibrated to a chosen concentration of KPFOS, and the corresponding change in the RGB parameter could be determined; in this instance an RGB parameter value above 0.08 would indicate a sample contains KPFOS at concentrations greater than 3 ppm. This would allow for a user to know if they were above or below a set contamination level or recommended exposure limit, using something as simple as a phone and an app.
The RGB parameterised data allow for the numerical discrimination between contaminated and uncontaminated samples, but we were intrigued to understand how this would translate to visual recognition. The likelihood of an observer being able to distinguish between two colours can be assessed by the delta Empfindung, ∆E, values of the two RGB values.[61] When two colours have a ∆E value greater than two, they are typically considered different when viewed by an untrained observer.[62] The ∆E values for the control sample and KPFOS spiked samples (∆E1–KPFOS) were all significantly greater than two, as the sub-stoichiometric number of guest molecules facilitates a discernible colour change (Fig. 5c). Notably the difference between the colours of the KPFOS samples (∆EKPFOS–KPFOS) would not be perceptible to the human eye, suggesting this method is more appropriately suited for threshold, or ‘yes/no’ detection, as the colours of different concentrations of KPFOS are not discernible from one another. The colours of the KPFOS samples will be determined by the molar ratio of 1 to KPFOS, and more perceptible colour differences (∆EKPFOS–KPFOS) may be detectable when comparing smaller changes in KPFOS concentrations, as here the sensor’s colorimetric response appears to be saturated at the lower concentrations (Supplementary Table S3). This suggests that someone from the general population would be able to identify the presence of KPFOS by eye using a micelle-suspended porphyrin solution for an aqueous sample containing KPFOS concentrations of 3 ppm (0.8 ppm in the final sample volume). Although these are promising results, the optical density of the solubilised host solution does not provide sufficient RGB disparity at lower PFOS concentrations.
To optimise this platform for practical PFOS detection, established techniques, such as sample preconcentration,[63,64] or fluorescence spectroscopy,[65] could be used to enhance the limits of detection. Filtration in the preconcentration step may also be necessary to remove particulate matter from complex real world sample matrices such as soil and surface water samples.
Conclusion
We have used a colorimetric porphyrin host molecule for the proof of concept demonstration of PFOS sensing using micellular solutions. Micelle dispersions of the host porphyrin molecule allowed for aqueous solubilisation and provided opportunity for the sensor to interact with the potassium salt of the PFOS molecule. The micelle solutions are a potential platform for the detection of PFOS and its salts from water at parts per million concentrations. The choice of surfactant, solvent, and concentration were probed, showing that experimental design was key to a stable host suspension and colour intensity. The demonstrated colour changes in response to KPFOS highlight a micelle-solubilised porphyrin technique that may be applied for other systems.
Experimental
General equipment and sampling considerations
Ideal materials to be used when preparing PFAS samples include polypropylene, high density polyethylene, PVC, stainless steel, and silicone. Some analysis methods require the use of materials that may adsorb PFAS (primarily glass). Glassware use was limited when possible, and it was acknowledged that it could have a minor impact on the effective PFAS concentration during analysis. Glassware that once contained PFAS material was not reused throughout experiments. Materials that must be avoided to limit PFAS contributions to analysis include low density polyethylene and polytetrafluoroethylene (Teflon).
Materials
PFOA (CAS# 335-67-1, 98%), and KPFOS (CAS# 2795-39-3, 98%) were purchased from Sigma Aldrich Chemical Co. and used without further purification. SDS (CAS# 151-21-3), CTAB (CAS# 57-09-0), TERGITOL 15-S-9 (CAS# 68131-40-8), TRITONX-100 (CAS# 9002-93-1), TWEEN 20 (CAS# 9005-64-5), and TWEEN 60 (CAS# 9005-67-8) were obtained from commercial sources and used without further purification. UV–Visible spectra were collected on an LLG-UNISPEC2 spectrometer at room temperature. α,α,α,α-5,10,15,20-Tetrakis[2-(perfluoroacyl)aminophenyl]-21H,23H-porphyrin), host 1, was prepared according to the previously reported methods.[22]
General micelle assembly method
Micelle assembly methods were modified from literature procedures.[30] The surfactant of choice was weighed out so the concentration in the final volume was above the reported CMC value. Host 1 and surfactant were then dissolved in minimal organic solvent, which was measured by mass. This mixture was vigorously stirred until dissolved and homogenous. MilliQ water was then added dropwise to reach the final desired volume. The mixture was left for 24 h to check for complete host suspension.
TritonX-100 (0.012 g 4.79 × 10⁻¹ mmol) and α,α,α,α-5,10,15,20-tetrakis[2-(perfluorooctanoyl)aminophenyl]-21H,23H-porphyrin) (0.003 g, 1.37 × 10⁻³ mmol) were dissolved in acetone (1 mL, 0.78 g) with vigorous stirring. To the stirred solution, MilliQ water (200 mL) was added dropwise over 2 h. The mixture was stirred overnight at room temperature. The solvent ratio was 0.4 wt%, [TritonX-100] = 2.37 mmol/L, and [1] = 2.05 × 10⁻³ mmol/L.
General RGB analysis method
A Puluz® 20 cm portable light tent with moderate and dispersed white LED lighting was used to photograph samples using an iPhone camera on a fixed tripod. The automatic flash settings were disabled so there was no reflective interference on the sample vials. Samples were photographed together to ensure lighting conditions and settings were consistent. The photographs were analysed using ImageJ software according to published methodologies. Triplicate RGB values were chosen from areas of each sample at random to provide an ‘average’ RGB value.[56,57,66] The RGB parameterisation was calculated using literature methods.[23]
Data availability
The data that support this study are available in the article and accompanying online supplementary material.
Acknowledgements
The authors acknowledge the muwinina people, the traditional owners of the land on which this research was conducted. The authors acknowledge Assoc. Prof. Stuart Thickett for early discussions on surfactants and micelle assembly.
References
1 Glüge J, Scheringer M, Cousins IT, DeWitt JC, Goldenman G, Herzke D, et al. An overview of the uses of per- and polyfluoroalkyl substances (PFAS). Environ Sci Process Impacts 2020; 22(12): 2345-73.
| Crossref | Google Scholar |
2 Nakayama SF, Yoshikane M, Onoda Y, Nishihama Y, Iwai-Shimada M, Takagi M, et al. Worldwide trends in tracing poly- and perfluoroalkyl substances (PFAS) in the environment. Trends Analyt Chem 2019; 121: 115410.
| Crossref | Google Scholar |
3 Pérez F, Nadal M, Navarro-Ortega A, Fàbrega F, Domingo JL, Barceló D, et al. Accumulation of perfluoroalkyl substances in human tissues. Environ Int 2013; 59: 354-62.
| Crossref | Google Scholar |
4 Brusseau ML, Van Glubt S. The influence of surfactant and solution composition on PFAS adsorption at fluid-fluid interfaces. Water Res 2019; 161: 17-26.
| Crossref | Google Scholar |
5 Brusseau ML. Examining the robustness and concentration dependency of PFAS air-water and NAPL-water interfacial adsorption coefficients. Water Res 2021; 190: 116778.
| Crossref | Google Scholar |
6 Lyu X, Xiao F, Shen C, Chen J, Park CM, Sun Y, et al. Per- and Polyfluoroalkyl Substances (PFAS) in Subsurface Environments: Occurrence, Fate, Transport, and Research Prospect. Rev Geophys 2022; 60(3): e2021RG000765.
| Crossref | Google Scholar |
7 Brusseau ML. Assessing the potential contributions of additional retention processes to PFAS retardation in the subsurface. Sci Total Environ 2018; 613-614: 176-85.
| Crossref | Google Scholar |
8 Lyu Y, Brusseau ML, Chen W, Yan N, Fu X, Lin X. Adsorption of PFOA at the Air–Water Interface during Transport in Unsaturated Porous Media. Environ Sci Technol 2018; 52(14): 7745-53.
| Crossref | Google Scholar |
9 Shinoda K, Hato M, Hayashi T. Physicochemical Properties of Aqueous-Solutions of Fluorinated Surfactants. J Phys Chem 1972; 76(6): 909-14.
| Crossref | Google Scholar |
10 Wang Z, DeWitt JC, Higgins CP, Cousins IT. A Never-Ending Story of Per- and Polyfluoroalkyl Substances (PFASs)? Environ Sci Technol 2017; 51(5): 2508-18.
| Crossref | Google Scholar |
11 Sznajder-Katarzyńska K, Surma M, Cieślik I. A Review of Perfluoroalkyl Acids (PFAAs) in terms of Sources, Applications, Human Exposure, Dietary Intake, Toxicity, Legal Regulation, and Methods of Determination. J Chem 2019; 2019: 2717528.
| Crossref | Google Scholar |
12 NHMRC, NRMMC. Australian Drinking Water Guidelines 6, National Water Quality Management Strategy, updated 2022. Canberra, ACT: Australia National Health and Medical Research Council, National Resource Management Ministerial Council; 2011. Available at https://www.nhmrc.gov.au/about-us/publications/australian-drinking-water-guidelines
13 Brusseau ML, Anderson RH, Guo B. PFAS concentrations in soils: background levels versus contaminated sites. Sci Total Environ 2020; 740: 140017.
| Crossref | Google Scholar |
14 Rodriguez KL, Hwang JH, Esfahani AR, Sadmani AHMA, Lee WH. Recent Developments of PFAS-Detecting Sensors and Future Direction: A Review. Micromachines 2020; 11(7): 667.
| Crossref | Google Scholar |
15 Caroleo F, Magna G, Naitana ML, Di Zazzo L, Martini R, Pizzoli F, et al. Advances in Optical Sensors for Persistent Organic Pollutant Environmental Monitoring. Sensors 2022; 22(7): 2649.
| Crossref | Google Scholar |
16 Fang C, Zhang X, Dong Z, Wang L, Megharaj M, Naidu R. Smartphone app-based/portable sensor for the detection of fluoro-surfactant PFOA. Chemosphere 2018; 191: 381-8.
| Crossref | Google Scholar |
18 Liang J, Deng X, Tan K. An eosin Y-based “turn-on” fluorescent sensor for detection of perfluorooctane sulfonate. Spectrochim Acta A Mol Biomol Spectrosc 2015; 150: 772-7.
| Crossref | Google Scholar |
19 Menger RF, Beck JJ, Borch T, Henry CS. Colorimetric Paper-Based Analytical Device for Perfluorooctanesulfonate Detection. ACS EST Water 2022; 2(4): 565-72.
| Crossref | Google Scholar |
20 Coll C, Martínez-Máñez R, Marcos MD, Sancenón F, Soto J. A simple approach for the selective and sensitive colorimetric detection of anionic surfactants in water. Angew Chem Int Ed Engl 2007; 46(10): 1675-8.
| Crossref | Google Scholar |
21 Wyrwas B, Zgoła-Grześkowiak A. Continuous Flow Methylene Blue Active Substances Method for the Determination of Anionic Surfactants in River Water and Biodegradation Test Samples. J Surfactants Deterg 2014; 17(1): 191-8.
| Crossref | Google Scholar |
22 Taylor CM, Ellingsen TA, Breadmore MC, Kilah NL. Porphyrin-based colorimetric sensing of perfluorooctanoic acid as proof of concept for perfluoroalkyl substance detection. Chem Commun 2021; 57(88): 11649-52.
| Crossref | Google Scholar |
23 Taylor CM, Breadmore MC, Kilah NL. Colorimetric Determination of Perfluorocarboxylic Acids using Porphyrin Hosts and Mobile Phone Photographs. Sens Diagn 2023; 2: 676-86.
| Crossref | Google Scholar |
24 López-Fontán JL, Sarmiento F, Schulz PC. The aggregation of sodium perfluorooctanoate in water. Colloid Polym Sci 2004; 283(8): 862-71.
| Crossref | Google Scholar |
25 Paria S, Maity P, Siddiqui R, Patra R, Maity SB, Jana A. Nanostructured Luminescent Micelles: Efficient Functional Materials for Sensing Nitroaromatic and Nitramine Explosives. Photochem 2022; 2(1): 32-57.
| Crossref | Google Scholar |
26 Halder A, Singh S, Adhikari A, Singh P, Sarkar PK, Pal U, et al. Selective and Fast Responsive Sensitized Micelle for Detection of Fluoride Level in Drinking Water. ACS Sustain Chem Eng 2019; 7(19): 16355-63.
| Crossref | Google Scholar |
27 Hubbard LR, Allen CJ, Sims AC, Engbrecht KM, O’Hara MJ, Johnson JC, et al. Detection of SARS-COV-2 by functionally imprinted micelles. MRS Commun 2022; 12(6): 1160-7.
| Crossref | Google Scholar |
28 Dave N, Joshi T. A Concise Review on Surfactants and Its Significance. Int J Appl Chem 2017; 13: 663-72.
| Crossref | Google Scholar |
29 Behari M, Das D, Mohanty AM. Influence of Surfactant for Stabilization and Pipeline Transportation of Iron Ore Water Slurry: A Review. ACS Omega 2022; 7(33): 28708-22.
| Crossref | Google Scholar |
30 Su F, Alam R, Mei Q, Tian Y, Youngbull C, Johnson RH, et al. Nanostructured Oxygen Sensor - Using Micelles to Incorporate a Hydrophobic Platinum Porphyrin. PLoS One 2012; 7(3): e33390.
| Crossref | Google Scholar |
31 Giovannetti R, Alibabaei L, Petetta L. Aggregation behaviour of a tetracarboxylic porphyrin in aqueous solution. J Photochem Photobiol A Chem 2010; 211(2): 108-14.
| Crossref | Google Scholar |
32 Zannotti M, Giovannetti R, Minofar B, Řeha D, Plačková L, D’Amato CA, et al. Aggregation and metal-complexation behaviour of THPP porphyrin in ethanol/water solutions as function of pH. Spectrochim Acta A Mol Biomol Spectrosc 2018; 193: 235-48.
| Crossref | Google Scholar |
33 Lin J-C, Hu C-Y, Lo S-L. Effect of surfactants on the degradation of perfluorooctanoic acid (PFOA) by ultrasonic (US) treatment. Ultrason Sonochem 2016; 28: 130-5.
| Crossref | Google Scholar |
34 Cifuentes A, Bernal JL, Diez-Masa JC. Determination of Critical Micelle Concentration Values Using Capillary Electrophoresis Instrumentation. Anal Chem 1997; 69(20): 4271-4.
| Crossref | Google Scholar |
35 Haque ME, Das AR, Moulik SP. Behaviors of sodium deoxycholate (NaDC) and polyoxyethylene tert-octylphenyl ether (Triton X-100) at the air/water interface and in the bulk. J Phys Chem 1995; 99(38): 14032-8.
| Crossref | Google Scholar |
36 Szymczyk K, Taraba A. Aggregation behavior of Triton X-114 and Tween 80 at various temperatures and concentrations studied by density and viscosity measurements. J Therm Anal Calorim 2016; 126(1): 315-26.
| Crossref | Google Scholar |
37 González L, Deive FJ, Rodríguez A, Longo MA, Álvarez MS. Salting out Tergitol 15S-based surfactants for extremolipases separation. J Mol Liq 2022; 353: 118736.
| Crossref | Google Scholar |
38 Hait SK, Moulik SP. Determination of critical micelle concentration (CMC) of nonionic surfactants by donor-acceptor interaction with iodine and correlation of CMC with hydrophile-lipophile balance and other parameters of the surfactants. J Surfactants Deterg 2001; 4(3): 303-9.
| Crossref | Google Scholar |
39 Al-Koofee D. Effect of Temperature Changes on Critical Micelle Concentration for Tween Series Surfactant. Glob J Sci 2013; 13: 1-7.
| Google Scholar |
40 Santiago PS, Neto DdS, Gandini SCM, Tabak M. On the localization of water-soluble porphyrins in micellar systems evaluated by static and time-resolved frequency-domain fluorescence techniques. Colloids Surf B Biointerfaces 2008; 65(2): 247-56.
| Crossref | Google Scholar |
41 Tehrani-Bagha AR, Holmberg K. Solubilization of Hydrophobic Dyes in Surfactant Solutions. Materials 2013; 6(2): 580-608.
| Crossref | Google Scholar |
42 Yushmanov VE. Aggregation of Fe(III)TPPS4 on Biological Structures Is pH-Dependent, Suggesting Oxo-Bridging in the Aggregates. Inorg Chem 1999; 38(8): 1713-8.
| Crossref | Google Scholar |
43 Wang Y, Thies-Weesie DME, Bosman EDC, van Steenbergen MJ, van den Dikkenberg J, Shi Y, et al. Tuning the size of all-HPMA polymeric micelles fabricated by solvent extraction. J Control Release 2022; 343: 338-46.
| Crossref | Google Scholar |
44 Guo L, Liang Y-q. UV–visible and fluorescence spectral study on a pH controlled transfer process of an amphiphilic porphyrin in nonionic micelle. Spectrochim Acta A Mol Biomol Spectrosc 2003; 59(2): 219-27.
| Crossref | Google Scholar |
45 Vermathen M, Louie EA, Chodosh AB, Ried S, Simonis U. Interactions of Water-Insoluble Tetraphenylporphyrins with Micelles Probed by UV−Visible and NMR Spectroscopy. Langmuir 2000; 16(1): 210-21.
| Crossref | Google Scholar |
46 Li X, Zhang L, Mu J. Formation of new types of porphyrin H- and J-aggregates. Colloids Surf A Physicochem Eng Asp 2007; 311: 187-90.
| Crossref | Google Scholar |
47 Maiti NC, Mazumdar S, Periasamy N. J- and H-Aggregates of Porphyrin−Surfactant Complexes: Time-Resolved Fluorescence and Other Spectroscopic Studies. J Phys Chem B 1998; 102(9): 1528-38.
| Crossref | Google Scholar |
48 Wang R, Qu R, Jing C, Zhai Y, An Y, Shi L. Zinc porphyrin/fullerene/block copolymer micelle for enhanced electron transfer ability and stability. RSC Adv 2017; 7(17): 10100-7.
| Crossref | Google Scholar |
49 Hassanpour A, Azani M-R, Bordbar A-K. Solution properties of sodium n-dodecyl sulfate in the presence of meso-tetrakis(N-methylpyridinium-4-yl) porphyrin. J Korean Chem Soc 2011; 55(3): 335-40.
| Crossref | Google Scholar |
50 Weyandt E, Leanza L, Capelli R, Pavan GM, Vantomme G, Meijer EW. Controlling the length of porphyrin supramolecular polymers via coupled equilibria and dilution-induced supramolecular polymerization. Nat Commun 2022; 13(1): 248.
| Crossref | Google Scholar |
51 Dokic J, Pacherie É. Shades and Concepts. Analysis 2001; 61(3): 193-202.
| Crossref | Google Scholar |
52 Togashi DM, Costa SMB, Sobral AJFN. Self-Aggregation of Lipophilic Porphyrins in Reverse Micelles of Aerosol OT. J Phys Chem B 2004; 108(31): 11344-56.
| Crossref | Google Scholar |
53 Cui X, Mao S, Liu M, Yuan H, Du Y. Mechanism of Surfactant Micelle Formation. Langmuir 2008; 24(19): 10771-5.
| Crossref | Google Scholar |
54 Denkova PS, Lokeren LV, Verbruggen I, Willem R. Self-Aggregation and Supramolecular Structure Investigations of Triton X-100 and SDP2S by NOESY and Diffusion Ordered NMR Spectroscopy. J Phys Chem B 2008; 112(35): 10935-41.
| Crossref | Google Scholar |
55 Šafranko S, Živković P, Stanković A, Medvidović-Kosanović M, Széchenyi A, Jokić S. Designing ColorX, Image Processing Software for Colorimetric Determination of Concentration, To Facilitate Students’ Investigation of Analytical Chemistry Concepts Using Digital Imaging Technology. J Chem Educ 2019; 96(9): 1928-37.
| Crossref | Google Scholar |
56 Gallagher SR. Digital Image Processing and Analysis with ImageJ. Curr Protoc Essent Lab Tech 2014; 9(1): A.3C.1-29.
| Crossref | Google Scholar |
57 Phuangsaijai N, Jakmunee J, Kittiwachana S. Investigation into the predictive performance of colorimetric sensor strips using RGB, CMYK, HSV, and CIELAB coupled with various data preprocessing methods: a case study on an analysis of water quality parameters. J Anal Sci Technol 2021; 12(1): 19.
| Crossref | Google Scholar |
59 Xiaowei H, Xiaobo Z, Jiewen Z, Jiyong S, Zhihua L, Tingting S. Monitoring the biogenic amines in Chinese traditional salted pork in jelly (Yao-meat) by colorimetric sensor array based on nine natural pigments. Int J Food Sci Technol 2015; 50(1): 203-9.
| Crossref | Google Scholar |
60 Tahir HE, Xiaobo Z, Xiaowei H, Jiyong S, Mariod AA. Discrimination of honeys using colorimetric sensor arrays, sensory analysis and gas chromatography techniques. Food Chem 2016; 206: 37-43.
| Crossref | Google Scholar |
61 Witzel RF, Burnham RW, Onley JW. Threshold and suprathreshold perceptual color differences. J Opt Soc Am 1973; 63(5): 615-25.
| Crossref | Google Scholar |
62 Sharma G, Wu W, Dalal EN. The CIEDE2000 color-difference formula: Implementation notes, supplementary test data, and mathematical observations. Color Res Appl 2005; 30(1): 21-30.
| Crossref | Google Scholar |
63 Safarik I, Baldikova E, Prochazkova J, Pospiskova K. Smartphone-based image analysis for evaluation of magnetic textile solid phase extraction of colored compounds. Heliyon 2019; 5(12): e02995.
| Crossref | Google Scholar |
64 Cao Y, Lee C, Davis ETJ, Si W, Wang F, Trimpin S, et al. 1000-Fold Preconcentration of Per- and Polyfluorinated Alkyl Substances within 10 minutes via Electrochemical Aerosol Formation. Anal Chem 2019; 91: 14352-8.
| Crossref | Google Scholar |
65 Poboży E, Król E, Wójcik L, Wachowicz M, Trojanowicz M. HPLC determination of perfluorinated carboxylic acids with fluorescence detection. Mikrochim Acta 2011; 172(3–4): 409-17.
| Crossref | Google Scholar |
66 Menesatti P, Angelini C, Pallottino F, Antonucci F, Aguzzi J, Costa C. RGB Color Calibration for Quantitative Image Analysis: The “3D Thin-Plate Spline” Warping Approach. Sensors 2012; 12: 7063-79.
| Crossref | Google Scholar |


