Aptamer-Based Biosensing with a Cationic AIEgen*
Tracey Luu A D , Mengjie Liu A D , Yilong Chen B , Roozbeh Hushiarian A , Anthony Cass C , Ben Zhong Tang B and Yuning Hong A EA Department of Chemistry and Physics, La Trobe Institute for Molecular Science, La Trobe University, Melbourne, Vic. 3086, Australia.
B Department of Chemistry, Hong Kong University of Science and Technology, Clear Water Bay, Kowloon, Hong Kong, China.
C Department of Chemistry, Molecular Sciences Research Hub, Imperial College London, White City Campus, London 212 0BZ, UK.
D These authors contributed equally to this work.
E Corresponding author. Email: y.hong@latrobe.edu.au
Australian Journal of Chemistry 72(8) 620-626 https://doi.org/10.1071/CH19238
Submitted: 29 May 2019 Accepted: 1 July 2019 Published: 23 July 2019
Abstract
Fabrication of low-cost biosensing platforms with high selectivity and sensitivity is important for constructing portable devices for personal health monitoring. Herein, we report a simple biosensing strategy based on the combination of a cationic AIEgen (aggregation-induced emission fluorogen), TPE-2+, with an aptamer for specific protein detection. The target protein can displace the dye molecules on the dye–aptamer complex, resulting in changes in the fluorescence signal. Selectivity towards different targets can be achieved by simply changing the aptamer sequence. The working mechanism is also investigated.
Introduction
Biosensors with high specificity have always been desirable for accurately detecting biological targets of interest in many research areas, as well as in manufacturing, forensic, and clinical settings. Lately, aptamers have emerged as intriguing recognition moieties in the preparation of target-specific biosensors. Aptamers are single-stranded DNA or RNA oligonucleotides selected from large oligonucleotide sequence libraries using an in vitro technique known as ‘systematic evolution of ligands by exponential enrichment’ (SELEX).[1,2] As each aptamer assumes distinct secondary and tertiary conformations, they possess high binding affinity and specificity to a wide variety of ligands, including metal ions,[3–5] small molecules,[6–8] peptides,[9,10] proteins,[11–13] and even microorganisms.[14–16] Compared with monoclonal antibodies, aptamers offer similar binding profiles with many additional advantages such as inexpensive synthesis, better chemical and thermal stability, reusability, improved tissue penetration, and low immunogenicity.[17] Indeed, quite a few aptamer-based fluorescent sensors have been described.[8,16,18–21] However, these sensors generally incorporate conventional dyes that are vulnerable to fluorescence quenching when they form aggregates at overly high concentration. This phenomenon, known as ‘aggregation-caused quenching’ (ACQ), is a notorious issue that restricts the usefulness of conventional dyes in biomolecular applications.
The opposite phenomenon, coined ‘aggregation-induced emission’ (AIE), has been found in some propeller-shaped molecules.[22] From a structural perspective, these AIE-active molecules have a stator moiety attached to several aromatic rotors. When AIE-active dyes are well solubilised, the rotors can rotate freely, thus rendering the whole molecule non-emissive by dissipating the energy via non-radiative pathways. Aggregate formation greatly restricts the rotors’ motion, and the energy in excess is emitted as fluorescence. In recent years, aptamer-based fluorescent sensors that incorporate AIE-active dyes have been developed for targeting mercury ions,[23] adenosine,[24] interferon-γ,[25] nucleolin,[26] messenger RNA,[27] cancer cells,[28,29] and food toxins.[30–32] Although some of these examples covalently anchored the dye to the selected aptamer chain,[25,27,29] others made use of the ‘label-free’ strategy, non-covalently attaching the dye via electrostatic force or embedding it into nanoparticles.[23,24,26,28,30–32]
We report herein a simple strategy to detect proteins with specificity by using a cationic AIEgen with the assistance of an aptamer. We demonstrate our methodology in two aptamer–protein pairs and we also investigate the working mechanism by using hybridisation and the corresponding non-charged peptide nucleic acid (PNA).
Results and Discussion
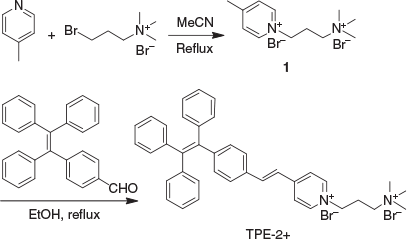
1-[3-(Trimethylammonio)propyl]-4-[4-(1,2,2-triphenylvinyl)styryl]pyridinium bromide (TPE-2+) was synthesised according to the route shown in Scheme 1. In short, 4-(1,2,2-triphenylvinyl)benzaldehyde (TPE-CHO), which was prepared according to a previously reported method,[33] underwent Knoevenagel condensation with the 4-methylpyridium salt 1 to yield TPE-2+. Compounds 1 and TPE-2+ were fully characterised by 1H and 13C NMR and high-resolution mass spectrometry (HRMS), which gave satisfactory analysis results corresponding to their chemical structures (Experimental section). Owing to its positive charges, TPE-2+ is poorly soluble in non-polar solvents such as DCM and THF, but highly soluble in polar solvents such as water, DMSO, and methanol. Similarly to other TPE-based fluorogens, TPE-2+ is emissive in the solid state with an absolute quantum yield of 17 % measured by integrating sphere, demonstrating its AIE properties. UV-vis and fluorescence measurement revealed that the maximum absorbance and emission of TPE-2+ were located at ~400 and 560 nm respectively in water (Fig. S1, Supplementary Material).
|
As TPE-2+ carries two positive charges, we postulated that it will interact with negatively charged aptamers via electrostatic interaction. Two model aptamers were chosen for our study: AL40, a 40-nucleotide aptamer with affinity to lysozyme,[34] and ATh, a 15-nucleotide aptamer with affinity to thrombin.[35] To determine the optimal dye concentration for sensing, we measured the fluorescence intensity of TPE-2+ with and without the aptamer. Owing to its amphiphilic nature, the dye at high concentration can aggregate in aqueous solution, which leads to higher fluorescence (Fig. S2, Supplementary Material). In the presence of the aptamer, dye fluorescence increased owing to the formation of a dye–aptamer complex through electrostatic interaction, which restricted the intramolecular rotation of the dye molecules (Fig. S3, Supplementary Material). By subtracting the fluorescence intensity of the dye–aptamer complex from that of the free dye at the same concentration, we obtained the spectra and fluorescence enhancement on aptamer interaction. In the presence of AL40 (1 µM), the emission of TPE-2+ progressively intensified as its concentration increased up to 15 µM, then declined at higher concentrations, implying the binding ratio of dye to AL40 is 15 : 1 (Fig. 1a, b). Using the same strategy, the binding ratio of dye to ATh was estimated to be ~10 : 1 (Fig. 1c, d). Excess amounts of dye molecule at higher concentration resulted in a higher background and thus negative values in the emission spectra of dye–ATh complex were observed when subtracting the dye-only spectra at higher dye concentration.
After confirming the optimal dye-to-aptamer molar ratio, in which we assumed all the dye molecules had bound to the aptamer, we then used the dye–aptamer complex as an entity for sensing the corresponding aptamer binding partner. In the case of the dye–AL40 complex, different concentrations of lysozyme were titrated into the solution. The fluorescence of the dye–AL40 complex decreased with increase of lysozyme concentration up to 1 µM and then increased when the lysozyme concentration further increased (Fig. 2a). The lowest intensity was observed when the protein concentration was the same as the aptamer concentration (Fig. 2b, where 1 µM indicates a 1 : 1 binding ratio). The same trend was observed in the case of ATh binding to thrombin (Fig. 2c, d). These results suggest that when the aptamer bound to the protein, the dye molecules on the aptamer were released, resulting in the lower fluorescence corresponding to the free dye in solution. However, owing to the amphiphilic nature of the dye, it could interact with large molecules such as proteins with hydrophobic regions. Therefore, when the protein concentration further increased, the freed dye molecules could interact with the free, non-aptamer bound proteins and generate fluorescence.
The above results demonstrated that the aptamer binding partner (i.e. protein) could replace the dye molecules when binding to the target aptamer. We then investigated the selectivity of this displacement process. A variety of proteins of different sizes were mixed with the dye–aptamer complex and the resultant fluorescence was then measured (Fig. 3). Although non-specific proteins such as ubiquitin caused a certain degree of fluorescence quenching, maximum decrease of fluorescence was observed in the presence of the correct binding partner, lysozyme for AL40 and thrombin for ATh. These results indicate the potential of using the dye–aptamer complex for selective detection of the aptamer-binding analytes.
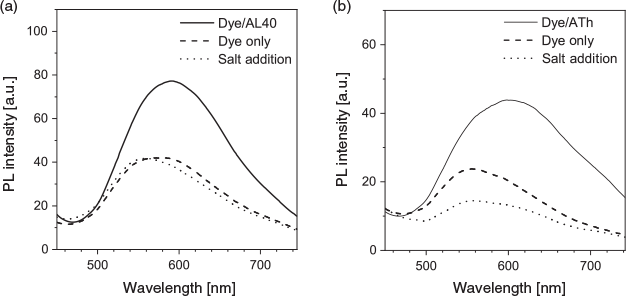
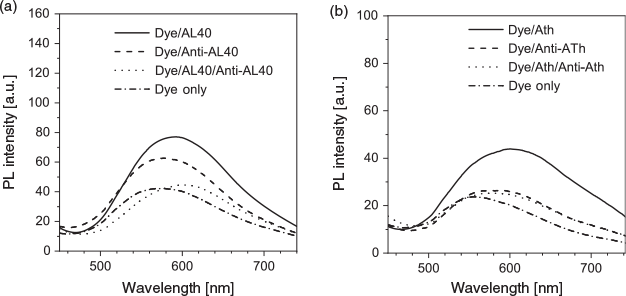
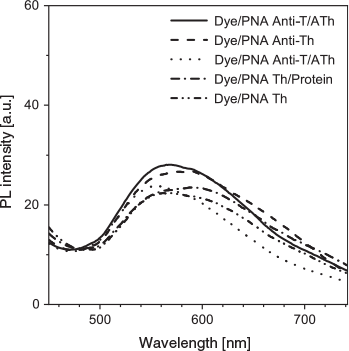
Understanding the binding mechanism of the dye–aptamer complex is important for us to further optimise the sensing strategy. First, we investigated the role of charge in the dye–aptamer binding event. In the presence of 1 M NaCl, the fluorescence of dye–aptamer complex was reduced to the same level as dye only, indicating electrostatic interaction is the main driving force for the dye–aptamer interaction (Fig. 4). Second, the role of the bases of the aptamer was investigated. To mask the bases, hybridisation of the aptamer with the respective complementary oligonucleotide, the anti-aptamer, was conducted. In the case of AL40, the dye fluoresced when complexing with either the aptamer or anti-aptamer (Fig. 5a). However, when the aptamer was hybridised with the anti-aptamer, dye fluorescence decreased to the same level as the background dye-only signal. In the case of ATh, however, both the dye–anti-ATh complex and hybridisation induced reduction in fluorescence (Fig. 5b). These results indicate that the base residues of the nucleotides were also involved in dye binding. Masking the bases by forming double-helical strands weakened dye binding, resulting in weaker fluorescence. Furthermore, the dye may exhibit higher selectivity towards certain bases, such as guanine. Therefore, it did not favour binding to the anti-ATh strand, which contains no guanine. Last, to further understand the interactions between the aptamer and the dye, PNA was used. PNA is the same as an aptamer except the negatively charged phosphate backbone is replaced with a neutral peptide backbone. TPE-2+ did not show any fluorescence enhancement when mixed with either PNA Th or PNA anti-Th, owing to the absence of negative charges on the backbone (Fig. 6). Hybridisation of ATh with PNA anti-Th also led to a reduction of dye-ATh fluorescence, similarly to the results obtained from hybridisation of ATh with anti-ATh. Incubation of PNA Th with thrombin did not induce any fluorescence change when compared with dye only in the solution. This observation indicated the primary role of electrostatic interaction as the driving force that allowed the dye molecules to approach the aptamer. The hydrophobicity of the base also played a secondary role in reinforcing the dye–aptamer interaction.
|
|
|
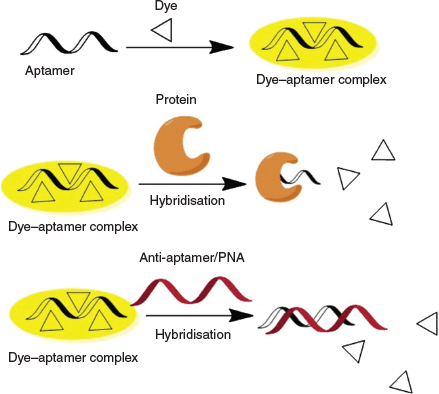
In summary, we demonstrated a proof of concept of using aptamers to improve the selectivity of protein detection based on AIEgens. Our strategy is summarised in Scheme 2. Cationic AIE fluorogen interacts with the negatively charged aptamer through electrostatic interaction and becomes fluorescent owing to the restriction of intramolecular motions of the dye on the dye–aptamer complex. Specific interaction of aptamer with its binding partner, e.g. a particular protein, leads to dye being released from the dye–aptamer complex and subsequent fluorescence quenching. Hybridisation of the aptamer with the complementary anti-aptamer or PNA also dissociates the dye molecules from the aptamer and causes fluorescence quenching. Further optimisation of the sensing process can be achieved by immobilising the dye–aptamer complex on a matrix with analytes in the mobile phase to eliminate non-specific interactions and reduce the background. Such a platform will find applications not only in protein detection but also in the detection of DNA, microRNA, metabolites, and many others.
|
Experimental
Materials
Aptamers were purchased from Integrated DNA Technologies and used without further purification. PNAs were purchased from PANAGENE and used without further purification. Thrombin, bovine serum albumin (BSA), acetylcholinesterase, β-lactoglobulin, ubiquitin, and lysozyme were purchased from Sigma–Aldrich and were used without further purification. 4-Methylpyridine, piperidine, and (3-bromopropyl)trimethylammonium bromide were purchased from Sigma–Aldrich. 4-(1,2,2-Triphenylvinyl)benzaldehyde was synthesised following a previously reported literature method.[36,37] THF was purified by simple distillation before use. Phosphate buffered saline (PBS) was prepared using Sigma–Aldrich PBS tablets to make 0.01 M phosphate buffer. Other chemicals and solvents were all purchased from Sigma–Aldrich and used as received. Distilled water was used throughout the experiments.
Aptamer Sequences
Aptamer sequences used in our work are as follows:
AL40:[11] 5′ GCA GCT AAG CAG GCG GCT CAC AAA ACC ATT CGC ATG CGG C 3′, melting temperature (Tm) 72.0 °C
ATh:[10] 5′ GGT TGG TGT GGT TGG 3′, Tm 50.3 °C
Anti-AL40: 5′ GCC GCA TGC GAA TGG TTT TGT GAG CCG CCT GCT TAG CTG C 3′, Tm 72.0 °C
Anti-ATh: 5′ CCA ACC ACA CCA ACC 3′, Tm 50.3 °C
PNA Sequences
PNA sequences used in our work are as follows:
PNA Th: 5′ GGT TGG TGT GGT TGG 3′
PNA Anti-Th: 5′ CCA ACC ACA CCA ACC 3′
Analyte Preparation
Thrombin was dissolved in PBS buffer to yield 1 mM solutions. These standards were stored at –80 °C in a freezer. Prior to use, the protein was diluted with PBS buffer to the required concentration. Other proteins used were also prepared in the same way.
Hybridisation Preparation
For hybridisation, a solution of TPE-2+–aptamer complex was heated to the aptamer’s melting temperature; then, the target protein or complementary aptamer or PNA was added in. The solution was cooled to room temperature before fluorescence measurement.
Instruments
UV-vis absorption spectra were recorded on a Cary 300 UV-vis spectrophotometer. Fluorescence emission and excitation spectra were recorded on a Cary Eclipse fluorescence spectrophotometer. 1H and 13C NMR spectra were measured on a Bruker ARX 400 NMR spectrometer using chloroform-d or methanol-d4 as solvents. High-resolution mass spectra were recorded on a Finnigan MAT TSQ 7000 mass spectrometer system operating in MALDI-TOF (matrix-assisted laser desorption–ionisation time-of-flight) mode.
Chemical Synthesis
1-(3-Trimethylammoniopropyl)-4-methylpyridinium Dibromide (1)
To a solution of 4-methylpyridine (50.0 mmol) in acetonitrile (60.0 ml) was added (3-bromopropyl)trimethylammonium bromide (10.4 g, 40.0 mmol). The mixture was stirred under reflux for 24 h. After cooling to room temperature, the mixture was precipitated in ethyl acetate (200 mL). The solid residue was filtered and washed with excess ethyl acetate, then dried in a vacuum oven. Yield 86 %. δH (400 MHz, methanol-d4) 8.98 (d, 2H, J 6.8), 7.99 (d, 2H, J 6.4), 4.74 (t, 2H, J 15.6), 3.63 (m, 2H), 3.24 (s, 9H), 2.70 (s, 3H), 2.61 (m, 2H). δC (100 MHz, methanol-d4) 157.91, 143.12, 128.13, 61.76, 61.73, 61.69, 56.30, 52.10, 52.06, 52.02, 24.21, 20.11. m/z (HRMS MALDI-TOF) 193.1702 [M – HBr – Br–]+; calc. 193.1694.
1-[3-(Trimethylammonio)propyl]-4-[4-(1,2,2-triphenylvinyl)styryl]pyridinium Bromide (TPE-2+)
To a 100-mL round bottom flask was added compound 1 (0.5 g, 1.4 mmol) and 4-(1,2,2-triphenylvinyl)benzaldehyde (1.01 g, 2.8 mmol). The system was fitted with a reflux condenser, sealed, and charged with nitrogen three times. Anhydrous ethanol (20 mL) and a catalytic amount of piperidine were injected into the vessel, and the mixture was stirred under reflux overnight. After cooling to room temperature, the solvent was evaporated under reduced pressure. The residue was purified by column chromatography using DCM/MeOH (2 : 1) to obtain a yellow solid (0.56 g, isolated yield 57 %). δH (400 MHz, methanol-d4) 8.91 (d, 2H, J 6.8), 8.18 (d, 2H, J 6.8), 7.88 (d, 1H, J 16.0), 7.50 (d, 2H, J 8.4), 7.35 (d, 1H, J 16.4), 7.12–6.99 (m, 17H), 4.68 (t, 2H, J 12.4), 3.61 (t, 2H, J 16.8), 3.22 (s, 9H), 2.60 (m, 2H). δC (100 MHz, methanol-d4) 153.99, 146.06, 143.36, 142.76, 142.67, 142.54, 141.71, 141.08, 139.58, 132.60, 131.12, 130.34, 130.26, 126.91, 126.74, 125.90, 125.79, 123.37, 121.56, 61.78, 55.94, 52.02, 24.14. m/z (HRMS MALDI-TOF) 537.3263 [M – HBr – Br–]+; calc. 535.3102.
Supplementary Material
UV-vis and emission spectra of TPE-2+, emission spectra of dye–aptamer complex without background subtraction, and NMR spectra are available on the Journal’s website.
Conflicts of Interest
The authors declare no conflicts of interest.
Acknowledgement
This work was supported by a LIMS Bruce Stone Fellowship awarded to Y.H.
References
[1] A. D. Ellington, J. W. Szostak, Nature 1990, 346, 818.| Crossref | GoogleScholarGoogle Scholar | 1697402PubMed |
[2] C. Tuerk, L. Gold, Science 1990, 249, 505.
| Crossref | GoogleScholarGoogle Scholar | 2200121PubMed |
[3] H. Qu, A. T. Csordas, J. Wang, S. S. Oh, M. S. Eisenstein, H. T. Soh, ACS Nano 2016, 10, 7558.
| Crossref | GoogleScholarGoogle Scholar | 27399153PubMed |
[4] J. Ding, W. Zhou, J. Liu, Nucleic Acids Res. 2016, 44, 10377.
| 27655630PubMed |
[5] J. Wrzesinski, S. K. Jóźwiakowski, FEBS J. 2008, 275, 1651.
| Crossref | GoogleScholarGoogle Scholar | 18312410PubMed |
[6] V.-T. Nguyen, Y. S. Kwon, J. H. Kim, M. B. Gu, Chem. Commun. 2014, 10513.
| Crossref | GoogleScholarGoogle Scholar |
[7] V.-T. Nguyen, Y. S. Kwon, M. B. Gu, Curr. Opin. Biotechnol. 2017, 45, 15.
| Crossref | GoogleScholarGoogle Scholar | 28088092PubMed |
[8] L. Sun, Q. Zhao, Analyst 2018, 143, 4600.
| Crossref | GoogleScholarGoogle Scholar | 30191220PubMed |
[9] W. Xu, A. D. Ellington, Proc. Natl. Acad. Sci. USA 1996, 93, 7475.
| Crossref | GoogleScholarGoogle Scholar | 8755498PubMed |
[10] C.-Y. Wang, B.-L. Lin, C.-H. Chen, Int. J. Cancer 2016, 138, 918.
| Crossref | GoogleScholarGoogle Scholar | 26314689PubMed |
[11] B. Deng, Y. Lin, C. Wang, F. Li, Z. Wang, H. Zhang, X.-F. Li, X. C. Le, Anal. Chim. Acta 2014, 837, 1.
| Crossref | GoogleScholarGoogle Scholar | 25000852PubMed |
[12] R. Stoltenburg, T. Schubert, B. Strehlitz, PLoS One 2015, 10, e0134403.
| Crossref | GoogleScholarGoogle Scholar | 26221730PubMed |
[13] N. Bjerregaard, P. A. Andreasen, D. M. Dupont, WIREs RNA 2016, 7, 744.
| Crossref | GoogleScholarGoogle Scholar | 27173731PubMed |
[14] I. Shiratori, J. Akitomi, D. A. Boltz, K. Horii, M. Furuichi, I. Waga, Biochem. Biophys. Res. Commun. 2014, 443, 37.
| Crossref | GoogleScholarGoogle Scholar | 24269231PubMed |
[15] K. Percze, Z. Szakács, É. Scholz, J. András, Z. Szeitner, C. H. d. Kieboom, G. Ferwerda, M. I. d. Jonge, R. E. Gyurcsányi, T. Mészáros, Sci. Rep. 2017, 7, 42794.
| Crossref | GoogleScholarGoogle Scholar | 28220811PubMed |
[16] S. Marton, F. Cleto, M. A. Krieger, J. Cardoso, PLoS One 2016, 11, e0153637.
| Crossref | GoogleScholarGoogle Scholar | 27104834PubMed |
[17] V. Thiviyanathan, D. G. Gorenstein, Proteomics Clin. Appl. 2012, 6, 563.
| Crossref | GoogleScholarGoogle Scholar | 23090891PubMed |
[18] H. Shi, Z. Tang, Y. Kim, H. Nie, Y. F. Huang, X. He, K. Deng, K. Wang, W. Tan, Chem. Asian J. 2010, 5, 2209.
| Crossref | GoogleScholarGoogle Scholar | 20806314PubMed |
[19] X. Yu, Z. Jiang, Anal. Lett. 2011, 44, 898.
| Crossref | GoogleScholarGoogle Scholar |
[20] C. Meng, Z. Dai, W. Guo, Y. Chu, G. Chen, Nanomater. Nanotechnol. 2016, 6, 33.
| Crossref | GoogleScholarGoogle Scholar |
[21] Z. Zhang, J. Yang, W. Pang, G. Yan, RSC Adv. 2017, 7, 54920.
| Crossref | GoogleScholarGoogle Scholar |
[22] J. Luo, Z. Xie, J. W. Y. Lam, L. Cheng, H. Chen, C. Qiu, H. S. Kwok, X. Zhan, Y. Liu, D. Zhu, B. Z. Tang, Chem. Commun. 2001, 1740.
| Crossref | GoogleScholarGoogle Scholar |
[23] J.-P. Xu, Z.-G. Song, Y. Fang, J. Mei, L. Jia, A. J. Qin, J. Z. Sun, J. Ji, B. Z. Tang, Analyst 2010, 135, 3002.
| Crossref | GoogleScholarGoogle Scholar | 20877906PubMed |
[24] Y. Hu, J. Liu, X. You, C. Wang, Z. Li, W. Xie, Sensors 2017, 17, 2246.
| Crossref | GoogleScholarGoogle Scholar |
[25] K. Ma, F. Zhang, N. Sayyadi, W. Chen, A. G. Anwer, A. Care, B. Xu, W. Tian, E. M. Goldys, G. Liu, ACS Sens. 2018, 3, 320.
| Crossref | GoogleScholarGoogle Scholar | 29308890PubMed |
[26] X. Wang, P. Song, L. Peng, A. Tong, Y. Xiang, ACS Appl. Mater. Interfaces 2016, 8, 609.
| Crossref | GoogleScholarGoogle Scholar | 26653325PubMed |
[27] X. Wang, J. Dai, X. Min, Z. Yu, Y. Cheng, K. Huang, J. Yang, X. Yi, X. Lou, F. Xia, Anal. Chem. 2018, 90, 8162.
| Crossref | GoogleScholarGoogle Scholar | 29893116PubMed |
[28] P. Zhang, Z. Zhao, C. Li, H. Su, Y. Wu, R. T. K. Kwok, J. W. Y. Lam, P. Gong, L. Cai, B. Z. Tang, Anal. Chem. 2018, 90, 1063.
| Crossref | GoogleScholarGoogle Scholar | 29275625PubMed |
[29] J. Chen, H. Jiang, H. Zhou, Z. Hu, N. Niu, S. A. Shahzad, C. Yu, Chem. Commun. 2017, 2398.
| Crossref | GoogleScholarGoogle Scholar |
[30] L. Ma, B. Xu, L. Liu, W. Tian, Chem. Res. Chin. Univ. 2018, 34, 363.
| Crossref | GoogleScholarGoogle Scholar |
[31] S. Zhang, L. Ma, K. Ma, B. Xu, L. Liu, W. Tian, ACS Omega 2018, 3, 12886.
| Crossref | GoogleScholarGoogle Scholar | 30411022PubMed |
[32] Y. Jia, F. Wu, P. Liu, G. Zhou, B. Yu, X. Lou, F. Xia, Talanta 2019, 198, 71.
| Crossref | GoogleScholarGoogle Scholar | 30876604PubMed |
[33] E. Wang, E. Zhao, Y. Hong, J. W. Y. Lam, B. Z. Tang, J. Mater. Chem. B Mater. Biol. Med. 2014, 2, 2013.
| Crossref | GoogleScholarGoogle Scholar |
[34] D. T. Tran, K. P. F. Janssen, J. Pollet, E. Lammertyn, J. Anné, A. Van Schepdael, J. Lammertyn, Molecules 2010, 15, 1127.
| Crossref | GoogleScholarGoogle Scholar | 20335968PubMed |
[35] Y. Bai, Y. Li, D. Zhang, H. Wang, Q. Zhao, Anal. Chem. 2017, 89, 9467.
| Crossref | GoogleScholarGoogle Scholar | 28763192PubMed |
[36] N. Zhao, M. Li, Y. Yan, J. W. Y. Lam, Y. L. Zhang, Y. S. Zhao, K. S. Wong, B. Z. Tang, J. Mater. Chem. C Mater. Opt. Electron. Devices 2013, 1, 4640.
| Crossref | GoogleScholarGoogle Scholar |
[37] C. W. T. Leung, Y. Hong, S. Chen, E. Zhao, J. W. Y. Lam, B. Z. Tang, J. Am. Chem. Soc. 2013, 135, 62.
| Crossref | GoogleScholarGoogle Scholar |
* Yuning Hong was awarded the 2018 RACI Rita Cornforth Lectureship Award.


