Do acute hospitalised patients in Australia have a different body mass index to the general Australian population: a point prevalence study?
Diane M. Dennis A D E , Vicki Carter A , Michelle Trevenen B C , Jacinta Tyler A , Luisa Perrella A , Erika Lori A and Ian Cooper A DA Physiotherapy Department, Sir Charles Gairdner Hospital, Hospital Avenue, Nedlands, WA 6009, Australia. Email: Vicki.Carter2@health.wa.gov.au; Jacintainman@gmail.com; Luisa.Perrella@health.wa.gov.au; Erika.Lori@health.wa.gov.au; Ian.Cooper@health.wa.gov.au
B University of Western Australia, Centre for Applied Statistics, 35 Stirling Highway, Crawley, WA 6009, Australia. Email: michelle.trevenen@uwa.edu.au
C Department of Research, Sir Charles Gairdner Hospital, Hospital Avenue, Nedlands, WA 6009, Australia.
D Curtin University, School of Physiotherapy and Exercise Science, Kent Street, Bentley, WA 6102, Australia.
E Corresponding author. Email: Diane.Dennis@health.wa.gov.au
Australian Health Review 42(2) 121-129 https://doi.org/10.1071/AH16171
Submitted: 1 August 2016 Accepted: 11 December 2016 Published: 23 February 2017
Journal compilation © AHHA 2018 Open Access CC BY-NC-ND
Abstract
Objective The aim of the present study was to provide a current snapshot of the body mass index (BMI) of the entire patient cohort of an Australian tertiary hospital on one day and compare these data with current published Australian and state (Western Australia) population norms.
Methods A single-centre prospective point prevalence study was performed whereby BMI was calculated following actual measurement of patient weight (nurse) and height (physiotherapist) on one day during 2015. Variables were summarised descriptively, and one-way analysis of variance was used to investigate the relationship between continuous BMI and hospital speciality. Multivariate Cox proportional hazards regression was used to analyse the time to leaving hospital, where those who died were censored at their date of death.
Results Data were collected from 416 patients (96% of the hospital population on that day). The mean (± s.e.m.) BMI across the whole hospital population was 26.6 ± 2.2 kg m–2, with 37% of patients having normal BMI, 8% being underweight, 32% being overweight, 19% being obese and 4% being severely obese. Comparison with both national and state population norms for 2014–15 reflected higher proportions of the hospital population in the underweight and extremely obese categories, and lower proportions in the overweight and obese categories. There was no significant difference in BMI across medical specialties.
Conclusions Despite health warnings about the direct relationship between illness and being overweight or obese, the results of the present study reveal fewer hospitalised patients in these BMI categories and more underweight patients than in the non-hospitalised general Australian population. Being overweight or obese may offer some protection against hospitalisation, but there is a point where the deleterious effect of obesity results in more extremely obese individuals being hospitalised than the proportion represented in the general population.
What is known about the topic? Although there is significant current published data relating to general Australian population BMI, there is little pertaining specifically to the hospitalised population. Accordingly, although we know that as an affluent Western country we are seeing growing rates of overweight and obese people and relatively few underweight or undernourished people in the general population, we do not know whether these trends are mirrored or magnified in those who are sick in hospital. We also know that although caring for obese patients carries a significant burden, there is the suggestion in some healthcare literature of an ‘obesity paradox’, whereby in certain disease states being overweight actually decreases mortality and promotes a faster recovery from illness compared with underweight people, who have poorer outcomes.
What does this paper add? This paper is the first of its kind to actually measure and calculate the BMI of a whole tertiary Australian hospital population and provide some comparison with published Australian norms. On average, the hospital cohort was overweight, with a mean (± s.e.m.) BMI of 26.6 ± 2.2 kg m–2, but less so than the general population, which had a mean BMI of 27.5 ± 0.2 kg m–2. The results also indicate that compared with state and national norms, underweight and extremely obese patients were over-represented in the hospitalised cohort, whereas overweight or obese patients were under-represented.
What are the implications for practitioners? Although only a single-centre study, the case-mix and socioeconomic catchment area of the hospital evaluated in the present study suggest that it is a typical tertiary urban West Australian facility and, as such, there may be some implications for practitioners. Primarily, administrators need to ensure that we are able to accommodate people of increasing weight in our hospital facilities and have the resources with which to do so, because, on average, hospitalised patients were overweight. In addition, resources need to be available for managing the extremely obese if numbers in this subset of the population increase. Finally, practitioners may also need to consider that although the management of underweight and undernourished patients may be less of a physical burden, there are actually more of these patients in hospital compared with the general population, and they may require a different package of resource utilisation.
Introduction
Throughout developed countries, obesity has emerged as a major chronic public health issue in recent years, having been found to be a leading cause of mortality and disability.1 Many serious illnesses, such as cardiovascular disease, high blood pressure and type 2 diabetes, are associated with obesity2 and there are serious cost implications both directly and indirectly in terms of disease burden.3,4 Most recent obesity data ranked Australian fifth highest in the world behind the US, Mexico, New Zealand and Hungary,5 with reported prevalence of overweight and obese adults aged ≥18 years at 63.4%.6 Although there has been little change over the past 3 years (62.7% was reported in this group in 2011–12),7,8 the prevalence still represents a significant increase since 1995, when the rate was 56.3%.7,8 Body mass index (BMI) is a simple index of weight and height that is commonly used to classify a person’s weight (whether under- or overweight) according to World Health Organization (WHO, http://apps.who.int/bmi/index.jsp?introPage=intro_3; verified 10 January 2017) and Australian Department of Health guidelines.9 Best practice should require actual measurement of body height and bodyweight rather than estimation.10,11
‘Bariatric’ is a term associated with the care of the obese patient, and much of the literature pertaining to obesity relates to the management of bariatric patients in the hospital setting. This includes guidelines for retrofitting hospitals,12 bariatric equipment and appropriate staffing levels, as well as risk management and manual handling.13,14 There are also considerable data relating to BMI outcomes in specific disease groups.15–21 In contrast, there are very little published data pertaining to the overall prevalence of bariatric patients in the hospital setting. Where data are available, there are often methodological flaws in how patients were identified and/or measured. For example, identifying particular diagnosis-related groups (DRGs) as the markers of obesity in hospital patients22 or using estimates of patient height (and therefore BMI) in particular cohorts rather than actual measurement.23
Objectives
The primary aim of the present observational study was to provide a current snapshot of the BMI of the entire patient cohort of an Australian tertiary hospital on one day, and to then compare these data with published national and state population norms in order to see whether underweight, overweight and obese people were under- or over-represented. Secondary aims of the study were to determine whether any medical speciality was more likely to be associated with abnormal BMI, and to explore the relationship between BMI and overall hospital length of stay (LOS).
Methods
Design and setting
The present study was a single-centre prospective point-prevalence study undertaken at a fully accredited urban Western Australian teaching hospital providing tertiary-level care to the people of Western Australia (WA). The specific catchment area draws on patients from a broad spread of socioeconomic and ethnic backgrounds, with a mean Socio-Economic Index for Area (SEIFA) at the 55th percentile compared with all post-codes in Australia.24
The facility has 489 beds, of which 89 are dedicated same-day patient beds. Each year the hospital treats approximately 74 000 in-patients and 69 000 emergency presentations. All clinical specialties are available, with the exception of complex burns, paediatrics, obstetrics and gynaecology. The hospital is the state’s referral centre for elective neurosurgery, complex radiotherapy and adult liver transplantation.25
Ethics approval
This study was approved by the Hospital Human Research Ethics Committee (Study no. 2014-102) with a waiver of patient consent granted based on negligible risk.
Participants
All adult in-patients on the hospital census for any part of the day between 0800 and 1630 hours on 5 February 2015 were considered for inclusion in the study. Patients were excluded if they were deemed an infection risk to the measurer, medically unstable or in the final stages of palliation. Patients having undergone medical interventions such as recent fluid resuscitation and those who had significant swelling, whereby it was impossible to accurately measure bodyweight, were also excluded. Patients in same-day beds were also excluded, because these patients were not usually reviewed by physiotherapists and were generally discharged as soon as possible after any procedure.
Those patients having amputation or in situ casting were included in the study, with weights adjusted before analysis. Amputees had the weight of their missing body part estimated via a body part percentage algorithm,26 and this weight was added to their measured overall bodyweight. The weight of similar plaster casting was measured and deducted from the weight of patients with in situ casting. Renal patients were measured after their dialysis had been undertaken.
Outcome measures
The primary outcome measure was patient BMI, calculated as weight divided by height squared. Patients were classified as underweight (BMI <18.5 kg m–2), normal weight (BMI 18.5–24.99 kg m–2), overweight (BMI 25–29.99 kg m–2), obese (BMI 30–39.99 kg m–2) or extremely obese (BMI ≥40 kg m–2).9
BMI was calculated following the actual measurement of individual patient weight and height. Patient weight (in kilograms) was measured by nursing staff using ward scales that are routinely serviced for accuracy and reliability. These data were recorded by nursing staff in the patient’s observation chart as part of normal clinical practise; patient height (in centimetres) was measured by the incumbent ward physiotherapist. Where possible, patient height was measured in the position where patients were found, because accuracy using a non-rigid measuring tape in this manner had been demonstrated previously.27 Other demographic information was collected in order to further define the cohort, including age, gender, admission speciality and hospital LOS.
Process
In this hospital, there is an allocation of physiotherapy services across all specialties. As per usual practise, these staff collected their own ward lists at the beginning of the study day and proceeded to measure patient height and collect patient weight data over the course of their normal working day, entering data directly onto their ward lists. Ward lists were then collected and collated by the research team, and entered into a study database. On discharge, hospital LOS was also collected by the ward physiotherapist and was entered into the database by the research team.
Statistical analysis
Data were analysed using the R environment for statistical computing (R Foundation for Statistical Computing). Continuous variables are summarised as the mean ± s.e.m., whereas categorical variables are summarised as frequencies and percentages. Clinical specialties were grouped into six categories according to the area of the body and the body system involved (e.g. neurology and neurosurgery were grouped together, as were cardiology, cardiac surgery and vascular). The ‘other’ group contained another seven specialties grouped together for the purpose of statistical analysis, each having only a small number of patients; these were haematology, hepatology, medical and radiation oncology, interventional radiology and renal and respiratory medicine. One-way analysis of variance (ANOVA) was used to investigate the relationship between continuous BMI and hospital speciality. Multivariate Cox proportional hazards regression was used to analyse the time to leaving hospital, where those who died were censored at their date of death. The initial model included effects of BMI group, age, sex and hospital speciality, as well as all two-way interactions with BMI group. Variables that were significant at the 5% level were retained for the final model. Hazard ratios (HR) and 95% confidence intervals (CI) are provided.
Results
Patient flow is shown in Fig. 1. Between 0800 and 1630 hours on 5 February 2015 there were 435 patients who were at one time on the hospital census. Of these, 416 (96%) had BMI data collected. The reasons why BMI data were not collected for 19 patients are summarised in Fig. 1. A further six patients who had BMI data collected were subsequently excluded because the accuracy of their weight measurement could not be determined. To the best of our knowledge, no patients were pregnant.

|
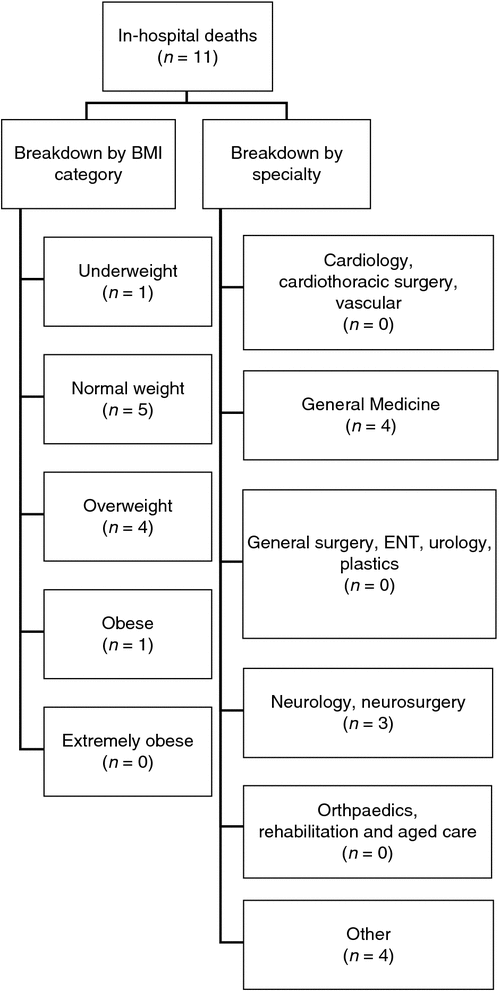
The largest proportions of patients were admitted under general medicine (22%) or ‘other’ (21%; Fig. 2). Median hospital LOS across the cohort was 10 days (range 1–246 days), and 11 patients died while in hospital. Deaths occurred most commonly in the normal (n = 5) and overweight (n = 4) BMI categories, and in the general medicine (n = 4) and ‘other’ (n = 4) specialties (Fig. 2).
|
The mean BMI across the whole hospital population was 26.6 ± 2.2 kg m–2, with 37.3% having normal BMI, 8.0% being underweight, 32.2% being overweight, 18.8% being obese and 3.7% being severely obese (Table 1). The mean age was 64 years17 and there were slightly more males (55%) than females.

|
Comparison with both state and national population norms for 2014–15 are also given in Table 1, with data reflecting higher proportions of the hospital population in the underweight and extremely obese categories and lower proportions in the overweight and obese categories. The highest proportion of overweight and obese subjects was found in adults aged 65–74 years in both the general and hospital populations; when stratified by gender, there was a higher proportion of men overweight or obese than women (Table 1).
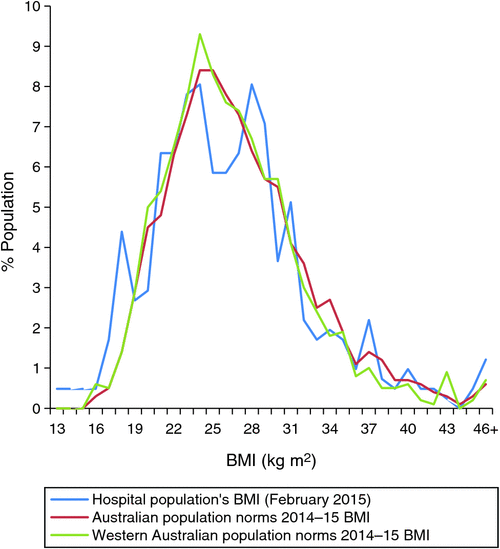
Figure 3 shows the distribution of numerical BMI within each population cohort. Overall, the plot of each cohort demonstrates a comparatively similar shape, with isolated spikes and troughs in the hospitalised data possibly reflecting sample size rather than real differences.
|
Overweight and obese categories (including extremely obese)
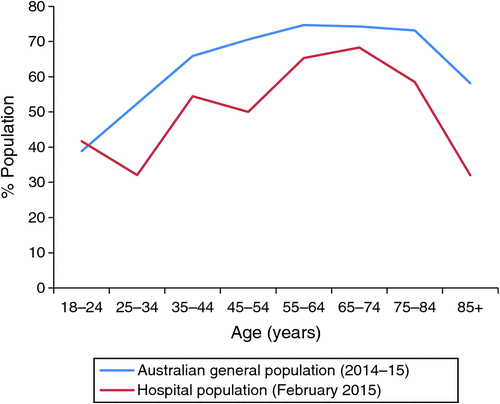
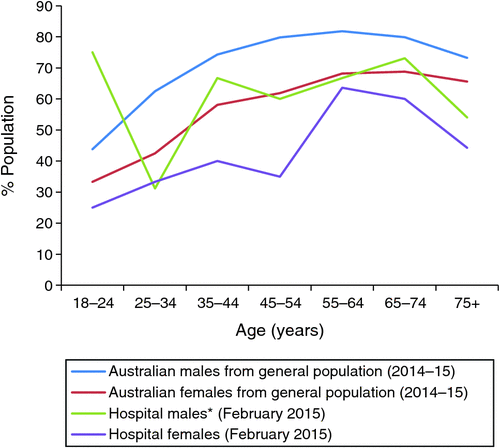
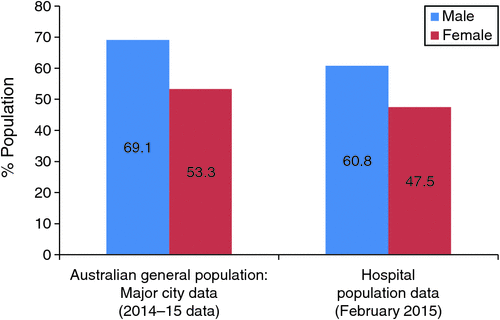
Figs 4–6 show the proportion of overweight and obese categories stratified by age for each population. Fig. 4 provides overall population data, whereby the hospital cohort has a lower incidence of overweight and obese patients across all ages compared with the general population, except for the youngest subgroup (18–24 years), where the incidence was similar. Fig. 5 stratifies the same data across gender, with the same trend was reflected: a comparatively lower proportion of overweight and obese hospital patients. The exception was in the 18–24 year group, but the small number of hospital patients within this age category may have skewed these data and the results should be interpreted with caution. A final comparison was drawn between study data and an urbanised subset of the Australian survey (Fig. 6), with lower proportions again demonstrated in the hospital cohort across both males and females.
|
|
|
Underweight category
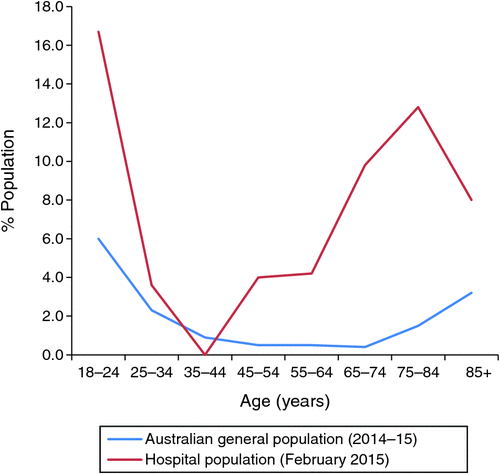
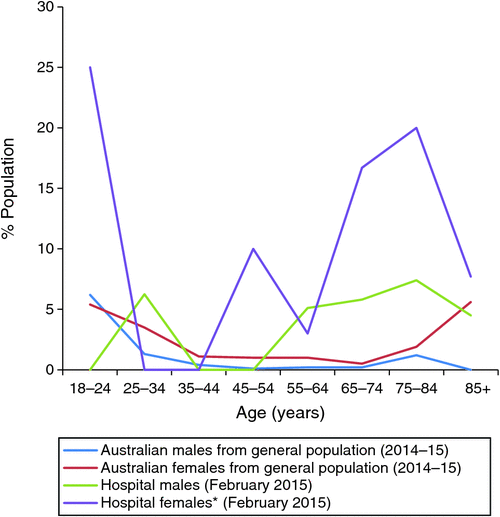
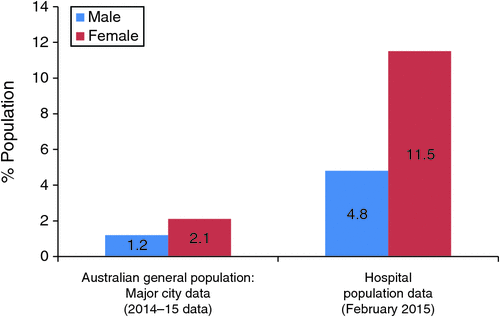
Figs 7–9 show the proportions of the underweight category stratified by age for each population. Fig. 7 provides overall population data, whereby the hospital cohort had a higher incidence of underweight patients across all ages compared with the general population, except for the 35–44 year age group, where there were no underweight patients. The same trend (higher proportion of underweight hospital patients) was also reflected when the data were stratified across gender (Fig. 8), except for 25- to 44-year-old females and 18- to 24- and 35- to 54-year-old males. A final comparison in the underweight category was drawn between hospitalised patient data and an urbanised subset of the Australian survey (Fig. 9), with higher proportions demonstrated in the hospital cohort across both males and females.
|
|
|
Differences across speciality groups
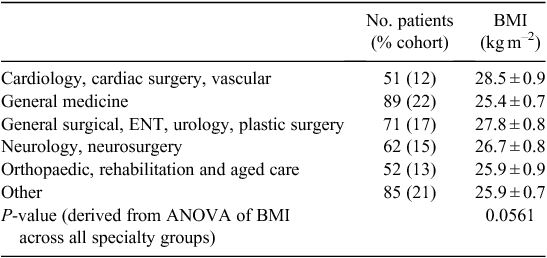
No significant differences in BMI were observed across the speciality groups (Table 2; P = 0.0561). The interaction between BMI and speciality was significantly associated with hospital LOS (P = 0.0187), indicating that the relationship between BMI and hospital LOS differed between specialties. Specifically, in the cardiology/cardiac surgery/vascular speciality, obese patients were significantly more likely to have a shorter hospital LOS than patients with normal BMI (HR 4.10; 95% CI 1.79–9.43), whereas in the ‘Other’ speciality group, underweight patients were significantly more likely to have a shorter hospital LOS than patients with normal BMI (HR 2.56; 95% CI 1.07–6.12). Neither patient age nor sex were significantly related to hospital LOS.
|
Discussion
To our knowledge, the present study is the first of its kind to capture an entire acute hospital cohort and actually measure patient weight and height in order to accurately calculate BMI. As such, we are the first to report the true prevalence of underweight, normal, overweight and obese patients in one Australian hospital population. The weightiness of a population can be expressed in two ways, numerically and categorically. That is, we can look at the mean overall BMI and classify the ‘average’ participant according to Australian Government Department of Health guidelines,9 or we can look at a whole population that has been individually categorised according to BMI and compare the percentage of the study or control group in each category.
With this in mind, there were two findings of the present study worthy of discussion. The first was that the overall numerical mean BMI of the hospital cohort (26.6 kg m–2) reflected that, on average, hospital patients were found to be overweight, although less so than both national and state population (mean BMI 27.5 and 27.1 kg m–2 respectively). The second finding was that compared with the average Australian population (either nationally or at state level), the proportion of patients in the hospital population within the overweight and obese BMI categories was lower and the proportion of patients within the underweight and extremely obese BMI categories was higher.
Longitudinal population data from 2008–09 to 2014–15 suggest that, as a society, Australians are getting bigger, with increasing average BMI.6 It is not surprising then that the average Australian hospitalised patient’s BMI is beyond that which is considered ‘normal’. However despite all the health warnings about the direct relationship between illness and being overweight or obese, the present data demonstrate fewer patients in hospital in these BMI categories than in the non-hospitalised general Australian population. Further, there were more patients in the hospital with low BMI, categorised as underweight. This may be explained by the fact that very sick, and therefore perhaps cachectic, patients receiving palliative care prior to the final stages of their disease formed part of the hospital population. However, there were no significant differences in BMI found across specialties, and although the highest number of deaths occurred in the group containing medical oncology (‘other’) according to mortality by BMI classification, the highest number of deaths also occurred in the ‘normal’ BMI group.
It has been suggested that overweight people who are very sick or have accidents may have more body reserves to survive trauma and have a relatively shorter recovery period. Known as the ‘obesity paradox’,15,17,28 it follows that there may be significant differences in LOS depending upon BMI, whereby obese patients have a large turnover and a relatively shorter LOS compared with underweight patients. Results here do not support this notion, with mostly no significant differences in LOS between BMI groups. The only two comparisons where non-normal BMI patients had shorter LOS than those patients having normal BMI came from both obese (‘cardiology’ group) and underweight (‘other’ group) patients.
It may be that although the obesity paradox offers some protection facilitating recovery from illness, there may also be a ‘tipping’ point whereby the positive protection a degree of overweightness or obesity provides becomes offset by the deleterious effect of obesity, such that the extremely obese group are more highly represented within the hospitalised group.
Another consideration is that people of normal weight may participate in higher-risk activities compared with overweight or obese people and may therefore be more likely to suffer worse health29 and, as an extension of that, be hospitalised. However, the mean age of the hospital cohort was 64 years, and this suggests that the population was not necessarily comprised of high-performing athletes who took higher risks than the average population.
Despite the relatively small cohort, the care of the obese and extremely obese patient remains a costly and resource-intensive issue for hospitals.12 Their day-to-day management, including the provision of ‘bariatric’ equipment, such as beds, transfer hoists and walking aids, is vital to ensure appropriate risk management and patient handling. The management of the underweight cohort may be equally as challenging with regard to the provision of resources for things such as pressure care and nutrition, with poorer outcomes and mortality rates reported in the literature for this group.17,29
Strengths and limitations
A strength of the present study is that every patient was actually measured (both height and weight) by professionals trained to do so. There were no estimates, and no self-reported patient data were used. The recency of data collection and the fact that comparative national and state population data were collected around the same time also adds strength to the study.
Limitations of the study are around the generalisability of these data to other hospitals in the state or country, because we report from a single centre in a single state at only one point in time, so that seasonal variations in the hospital cohort are unaccounted for. Another limitation is that small numbers in some specialties meant that they were grouped together for analysis. It may be that more patients derived from a multicentre study would demonstrate differences in BMI across specialties.
Finally, it may be argued that BMI is not in itself a perfect measure of obesity, in that short muscle-bound patients may have a high BMI yet low levels of body fat. This effect was unable to be controlled for, and inclusion of this subset into the overweight group may have meant that we overstated the prevalence of overweight and obese patients in our measured population.
Future studies
Future studies are needed across a wider sample of Australia’s hospital in-patient population for broader conclusions to be drawn, including survey of more isolated rural hospital populations for comparison with national norms.
Conclusion
With consideration to the limitations of the generalisability of the findings of the present study, and despite health warnings about the direct relationship between illness and being overweight or obese, the results demonstrate fewer hospitalised patients in these BMI categories and more underweight patients than in the non-hospitalised general Australian population. Being overweight or obese may offer some protection from hospitalisation, but there is a point where the deleterious effect of obesity results in more extremely obese individuals being hospitalised than are represented in the general population.
Continued monitoring of the differences between hospital and general population BMI trends may be useful to identify whether the gap widens or becomes less apparent as the BMI of the general population increases. It may be that the negative effect of obesity on general health purported in the literature becomes more evident over time, with more overweight and obese patients requiring hospitalisation.
Competing interest
None declared.
Acknowledgements
The authors thank the physiotherapy and nursing staff of Sir Charles Gairdner Hospital who participated in data collection for the study.
References
[1] Chang S-H, Pollack LM, Colditz GA. Life years lost associated with obesity-related diseases for U.S. non-smoking adults. PLoS One 2013; 8 e66550| Life years lost associated with obesity-related diseases for U.S. non-smoking adults.Crossref | GoogleScholarGoogle Scholar | 1:CAS:528:DC%2BC3sXhtVGqt7rL&md5=de87093e65af2b2f745112301992ebfeCAS |
[2] Sugerman HJ. The epidemic of severe obesity: the value of surgical treatment. Mayo Clin Proc 2000; 75 669–72.
| The epidemic of severe obesity: the value of surgical treatment.Crossref | GoogleScholarGoogle Scholar | 1:STN:280:DC%2BD3czovVagsA%3D%3D&md5=912f3c8bf5a6ce31d3d964773e6f63f0CAS |
[3] Zizza C, Herring A, Stevens J, Popkin B. Length of hospital stays among obese individuals. Am J Public Health 2004; 94 1587–91.
| Length of hospital stays among obese individuals.Crossref | GoogleScholarGoogle Scholar |
[4] Obesity Australia. No time to weight. 2015. Available at: http://obesityaustralia.cipcms.com.au/resources-general-public/no-time-to-weight-2 [verified 10 January 2017].
[5] Organisation for Economic Co-Operation and Development (OECD). OECD health statistics 2015: key indicators. 2015. Available at: http://www.oecd.org/health/health-systems/OECD-Health-Statistics-2015-Frequently-Requested-Data.xls?bcsi_scan_c221d61a0ea4ff4c=1 [verified 10 January 2017].
[6] Australian Bureau of Statistics. 4364.0.55.001 – Australian health survey: first results, 2014–15. 2015. Available at: http://www.abs.gov.au/AUSSTATS/abs@.nsf/DetailsPage/4364.0.55.0012014-15?OpenDocument [verified 10 January 2017].
[7] Australian Bureau of Statistics. 4364.0.55.001 – Australian health survey: first results, 2011–12. 2012. Available at: http://www.abs.gov.au/ausstats/abs@.nsf/Lookup/4364.0.55.001Chapter1002011-12 [verified 10 January 2017].
[8] Australian Bureau of Statistics. 4364.0.55.003 – Australian health survey: updated results, 2011–2012. 2013. Available at: http://www.abs.gov.au/ausstats/abs@.nsf/lookup/33C64022ABB5ECD5CA257B8200179437?opendocument [verified 10 January 2017].
[9] Australian Government Department of Health. How overweight and obesity are defined. 2009 Available at: http://www.health.gov.au/internet/main/Publishing.nsf/Content/health-pubhlth-strateg-hlthwt-obesity.htm#defined [verified 10 January 2017].
[10] Bloomfield R, Steel E, MacLennan G, Noble D. Accuracy of weight and height estimation in an intensive care unit: implications for clinical practice and research. Crit Care Med 2006; 34 2153–7.
| Accuracy of weight and height estimation in an intensive care unit: implications for clinical practice and research.Crossref | GoogleScholarGoogle Scholar |
[11] Leary TS, Milner QJ, Niblett DJ. The accuracy of the estimation of body weight and height in the intensive care unit. Eur J Anaesthesiol 2000; 17 698–703.
| The accuracy of the estimation of body weight and height in the intensive care unit.Crossref | GoogleScholarGoogle Scholar | 1:STN:280:DC%2BD3M%2FmtVGrsA%3D%3D&md5=7d2a2e9b2ff32496981c65efcf85eae1CAS |
[12] Rice S. Retrofitting hospitals for obese patients. Hospitals balance safety, costs in equipping facilities for bariatric care. Mod Healthc 2014; 44 16–7.
[13] Muir M, Archer-Heese G. Essentials of a bariatric patient handling program. Online J Issues Nurs 2009; 14 Manuscript 5
[14] Blackett A, Gallagher S, Dugan S, Gates JL, Henn T, Kennedy-Evans KL, Lutz JH. Caring for persons with bariatric health care issues: a primer for the WOC nurse. J Wound Ostomy Continence Nurs 2011; 38 133–8.
| Caring for persons with bariatric health care issues: a primer for the WOC nurse.Crossref | GoogleScholarGoogle Scholar |
[15] Curtis JP, Selter JG, Wang Y, Rathore SS, Jovin IS, Jadbabaie F, Kosiborod M, Portnay EL, Sokol SI, Bader F, Krumholz HM. The obesity paradox: body mass index and outcomes in patients with heart failure. Arch Intern Med 2005; 165 55–61.
| The obesity paradox: body mass index and outcomes in patients with heart failure.Crossref | GoogleScholarGoogle Scholar |
[16] Engel A, McDonough S, Smith JM. Does an obese body mass index affect hospital outcomes after coronary artery bypass graft surgery? Ann Thorac Surg 2009; 88 1793–800.
| Does an obese body mass index affect hospital outcomes after coronary artery bypass graft surgery?Crossref | GoogleScholarGoogle Scholar |
[17] Fleischmann E, Teal N, Dudley J, May W, Bower JD, Salahuden AK. Influence of excess weight on mortality and hospital stay in 1346 hemodialysis patients. Kidney Int 1999; 55 1560–7.
| Influence of excess weight on mortality and hospital stay in 1346 hemodialysis patients.Crossref | GoogleScholarGoogle Scholar | 1:STN:280:DyaK1M3hslSrsg%3D%3D&md5=48007be7c76345c32a55319e7ef9fc09CAS |
[18] Gong MN, Bajwa EK, Thompson BT, Christiani DC. Body mass index is associated with the development of acute respiratory distress syndrome. Thorax 2010; 65 44–50.
| Body mass index is associated with the development of acute respiratory distress syndrome.Crossref | GoogleScholarGoogle Scholar | 1:STN:280:DC%2BD1Mfjsl2qtg%3D%3D&md5=6ec755dfa2670fa2902bae13ed99917aCAS |
[19] Maradit Kremers H, Visscher S, Kremers W, Naessens J, Lewallen D. Obesity increases length of stay and direct medical costs in total hip arthroplasty. Clin Orthop Relat Res 2014; 472 1232–9.
| Obesity increases length of stay and direct medical costs in total hip arthroplasty.Crossref | GoogleScholarGoogle Scholar |
[20] Vemmos K, Ntaios G, Spengos K, Savvari P, Vemmou A, Pappa T, Manios E, Georgiopoulos G, Alevizaki M. Association between obesity and mortality after acute first-ever stroke: the obesity–stroke paradox. Stroke 2011; 42 30–6.
| Association between obesity and mortality after acute first-ever stroke: the obesity–stroke paradox.Crossref | GoogleScholarGoogle Scholar |
[21] Zittermann A, Becker T, Gummert JF, Börgermann J. Body mass index, cardiac surgery and clinical outcome. A single-center experience with 9125 patients. Nutr Metab Cardiovasc Dis 2014; 24 168–75.
| Body mass index, cardiac surgery and clinical outcome. A single-center experience with 9125 patients.Crossref | GoogleScholarGoogle Scholar | 1:STN:280:DC%2BC2c%2FksVeltw%3D%3D&md5=d86ea12f1b2ce11955e132eb67fa8840CAS |
[22] Hauck K, Hollingsworth B. The impact of severe obesity on hospital length of stay. Med Care 2010; 48 335–40.
| The impact of severe obesity on hospital length of stay.Crossref | GoogleScholarGoogle Scholar |
[23] Anzueto A, Frutos Vivar F, Esteban A, Bensalami N, Marks D, Raymondos K, Apezteguia C, Arabi Y, Hurtado J, Gonzalez M, Tomicic V, Abroug F, Elizalde J, Cakar N, Pelosi P, Ferguson ND, for the Ventila 366 Group. Influence of body mass index on outcome of the mechanically ventilated patients. Thorax 2011; 66 66–73.
| Influence of body mass index on outcome of the mechanically ventilated patients.Crossref | GoogleScholarGoogle Scholar | 1:STN:280:DC%2BC3M%2FmvF2itw%3D%3D&md5=c1af730d8aa41f141404f045af31a989CAS |
[24] Australian Bureau of Statistics. 2033.0.55.001 – Census of population and housing: socio-economic indexes for areas (SEIFA), Australia. 2014. Available at: http://www.abs.gov.au/AUSSTATS/abs@.nsf/DetailsPage/2033.0.55.0012011?OpenDocument [verified 10 January 2017].
[25] Health Department of Western Australia. Sir Charles Gairdner Hospital services directory for general practitioners. 2016. Available at: http://www.scgh.health.wa.gov.au/Clinicians/pdf/SCGH_Clinical_Services_Directory.pdf [verified 10 January 2017].
[26] Nestle Nutrition Institute. Nutritional screening as easy as MNA. 2009. Available at: http://www.mna-elderly.com/forms/mna_guide_english.pdf [verified 10 January 2017].
[27] Dennis D, Hunt E, Budgeon C. Measuring height in recumbent critical care patients. Am J Crit Care 2015; 24 41–7.
| Measuring height in recumbent critical care patients.Crossref | GoogleScholarGoogle Scholar |
[28] Garrouste-Orgeas M, Troché G, Azoulay E, Caubel A, de Lassence A, Cheval C, Montesino L, Thuong M, Vincent F, Cohen Y, Timsit J-F. Body mass index. An additional prognostic factor in ICU patients. Intensive Care Med 2004; 30 437–43.
| Body mass index. An additional prognostic factor in ICU patients.Crossref | GoogleScholarGoogle Scholar |
[29] Rafe B. Obesity and the longevity myth. Summit preview. 2015. Available at: http://www.actuaries.digital/2015/05/12/obesity-and-the-longevity-myth-summit-preview/ [verified 10 January 2017].


