

Exploring equity of care for Aboriginal and Torres Strait Islander peoples within the state-wide Musculoskeletal Physiotherapy Screening Clinic and Multi-disciplinary Service in Queensland Health
Alistair McDougall A B , Maree Raymer B , Peter Window B C , Michelle Cottrell B C , Curtley Nelson A D , Carl Francia A D E , Eliza Watson A B and Shaun O’Leary A B *A
B
C
D
E
Abstract
This study aimed to explore equity of care for Aboriginal and Torres Strait Islander peoples compared to non-Indigenous Australians within a Queensland-wide musculoskeletal service.
The service database was analysed between July 2018 and April 2022 across 18 Queensland Health facilities. Representation of Aboriginal and Torres Strait Islander peoples within the service’s patient population was first explored. Second, service and patient-related characteristics and outcomes between Aboriginal and Torres Strait Islander patients and non-Indigenous patients undergoing an episode of care in the service were compared using analysis of variance and chi-squared tests.
A greater proportion of Aboriginal and Torres Strait Islander peoples (4.34%) were represented within the service’s patient population than in the general population (3.61%) state-wide. Aboriginal and Torres Strait Islander patients presented with a generally higher severity of clinical presentation across measures at initial consult. Very similar proportions of Aboriginal and Torres Strait Islander (63.2%) and non-Indigenous (64.3%) patients reported clinically meaningful treatment benefits. While a higher proportion of Aboriginal and Torres Strait Islander patients (69.7%) were discharged from the service without requiring specialist review compared to non-Indigenous patients (65.6%), Aboriginal and Torres Strait Islander patients had higher rates of discharge due to non-attendance (20.8%) when compared to non-Indigenous (10.6%) patients (P < 0.01).
Disparity in care retention for Aboriginal and Torres Strait Islander patients compared to non-Indigenous patients was observed within the musculoskeletal service. Consultation with Aboriginal and Torres Strait Islander communities is needed to address access barriers once in the service to guide service improvement.
Keywords: Aboriginal and Torres Strait Islander peoples, advanced practice, equity, musculoskeletal, neurosurgery, orthopaedics, outcomes, outpatients.
Introduction
Musculoskeletal conditions are an incumbrance to Aboriginal and Torres Strait Islander peoples. Compared to non-Indigenous Australians, Aboriginal and Torres Strait Islander peoples have 2.7 times higher fatal and 1.4 times higher non-fatal burden of musculoskeletal conditions and are 1.5 times more likely to experience osteoarthritis.1,2 Yet Aboriginal and Torres Strait Islander peoples are only half as likely to access primary care for their osteoarthritis compared to non-Indigenous Australians,3 and only 52% of the Indigenous primary healthcare services provide frontline non-surgical musculoskeletal services such as physiotherapy.3,4 In addition, Aboriginal and Torres Strait Islander peoples requiring surgery for their musculoskeletal condition (e.g. joint arthroplasty) will wait longer for elective surgical procedures than non-Indigenous Australians. 5
Reasons underpinning reported differences in access to care for musculoskeletal conditions between Aboriginal and Torres Strait Islander peoples and non-Indigenous Australians are complex. Aboriginal and Torres Strait Islander peoples continue to experience disadvantage across many social determinants of health including geographic location, education levels and employment rates.6 Such factors have identified links to an individual’s health and speak to historic and systemic discrimination against Aboriginal and Torres Strait Islander peoples.7 In turn, negative perceptions regarding western healthcare may be a significant influence to healthcare access for Aboriginal and Torres Strait Islander peoples. Historically, a background of ongoing racism, discrimination and the continued impact of colonisation, can instil mistrust of the healthcare system for Aboriginal and Torres Strait Islander peoples.8,9 As an example, one report indicated 32% of Aboriginal and Torres Strait Islander peoples did not access health care due to cultural reasons such as language barriers, discrimination and cultural appropriateness.10
To address these issues the 2020 ‘National Agreement on Closing the Gap’ recommended health services evaluate care pathways to ensure the provision of culturally appropriate and equitable care for Aboriginal and Torres Strait Islander peoples.11 Equity implies that everyone should have equal opportunity to attain their full potential for health and access to health care.12 Based on the ‘Closing The Gap’ recommendations, this paper describes an initial study to explore equity of care for Aboriginal and Torres Strait Islander peoples in an Australian public musculoskeletal health service. The Musculoskeletal Physiotherapy Screening Clinic and Multi-disciplinary Service (MPSC&MDS) is an advanced practice physiotherapist-led model of care designed to address overburdened public orthopaedic and neurosurgical medical specialist outpatient services across Queensland, Australia.13 Waitlisted patients with musculoskeletal conditions on medical specialist outpatient services are initially assessed by an Advanced Musculoskeletal Physiotherapist. Those considered amenable to non-surgical management are subsequently referred for a trial of pragmatic multidisciplinary care (e.g. physiotherapy, psychology, dietetics, occupational therapy and/or pharmacy) as required.14 The MPSC&MDS is proven to be a safe, cost and clinically effective model that has resulted in reduced demands on medical specialist services.15–17 However, despite the service being established for more than a decade, equity of care for Aboriginal and Torres Strait Islander peoples accessing this service has not been evaluated.
This study aims to explore equity of care for Aboriginal and Torres Strait Islander peoples within the state-wide MPSC&MDS through two study objectives. The first objective explores Aboriginal and Torres Strait Islander representation within the service’s database at both a state and individual hospital and health service (HHS) level. The second objective compares patient and service-related characteristics and outcomes between Aboriginal and Torres Strait Islander patients and non-Indigenous patients during their episode of care.
Methods
Design
A retrospective exploratory analysis of the MPSC&MDS Measurement Analysis and Reporting System (MARS) database was undertaken for patients discharged from the service between 1 July 2018 and 30 April 2022. The analysis included 18 public health facilities across 11 HHSs in Queensland.
Database extraction
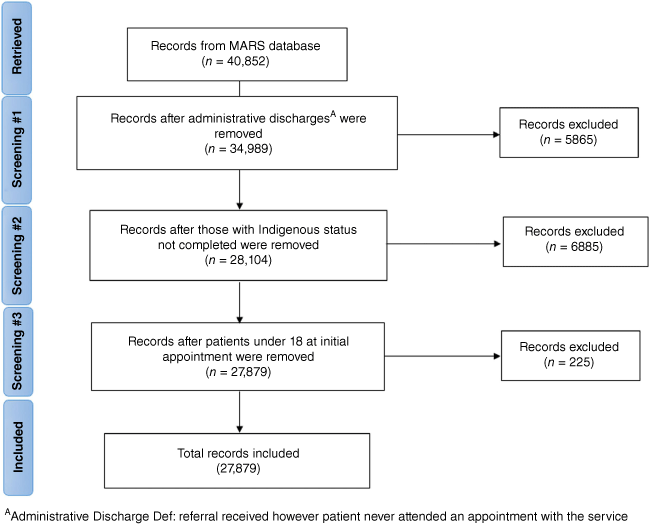
A total of 40,852 patient records were initially retrieved from the MARS database. Records were excluded if patients did not have a recorded Indigenous status, were under the age of 18 years or classified as an administrative discharge (i.e. non-attendance to initial appointment or did not respond to offer of initial appointment). The final analysis included 27,879 records (Fig. 1).
An episode of care for patients in this study incorporates all recorded events, information and measures from the time point of initial referral to the hospital specialist medical outpatient services to discharge from the service. Information extracted from the database included patient-related and service-related measures and outcomes routinely collected by the service as detailed in Table 1.
| Patient-related measures | ||
|---|---|---|
| Sociodemographic measures | ||
| Indigenous status | Indigenous (Aboriginal and/or Torres Strait Islander), non-Indigenous | |
| Age | Years | |
| Socio-Economic Indexes for Areas (SEIFA) score | Score ranks relative socioeconomic advantage and disadvantage based on residential postcode. 1000 = median, >1000 = advantage, <1000 = disadvantage. 18 | |
| Gender (male/female) | Male, female | |
| Accessibility/Remoteness Index of Australia (ARIA) | An index of the accessibility of locations to service centres and remoteness. Used to explore healthcare utilisation and remoteness. 19 Scored based on geographical area (postcode) and assigned to categories of ‘Major city’, ‘Inner regional’, ‘Outer regional’ and ‘Remote’ (including remote and very remote). 20 Where postcodes were assigned multiple ARIA scores it was decided the highest score would be used (i.e. the most remote). | |
| Employment status | Employed, unemployed, retired, other | |
| Education level | Highest level of completion divided into up to lower secondary, secondary and post-school qualifications | |
| General health measures | ||
| Body mass index (BMI) | kg/m² | |
| Co-morbidities | Score/12 (heart disease, hypertension, claudication, liver disease, diabetes, kidney disease, lung disease, stroke, disease of the nervous systems, cancer, depression, arthritis) | |
| Smoking status | Current smoker, ex-smoker, never smoked | |
| Non-prescription analgesia use | Yes/no | |
| Prescription analgesia use | Yes/no | |
| Assessment of Quality of Life (AQOL-4D) Standardised score | Measurement of health-related quality of life across 12 items over four dimensions (independent living, relationships, senses and mental health). Score/100, ‘100’ indicates highest quality. 21, 22 | |
| Psychological measures | ||
| Pain Self-Efficacy Questionnaire-2 (PSEQ-2) | Measurement of pain self-efficacy. 23 Score/12, ‘12’ indicates higher levels of self-efficacy and Minimal Clinically Important Difference (MCID) of 1.5. 24 | |
| Keel STarTMSK Screening tool | Score/12, used to stratify patients to low (0–4), medium (5–8) and high-risk (9–12) of persistent pain and disability 25 | |
| Condition-specific measures | ||
| Condition managed | Body region of condition (i.e. Thoracic and lumbar/Cervical/Lower limb/Upper limb | |
| Oswestry Disability Index (ODI) | Patient reported outcome measure for disability in thoracic, lumbar and sacro-iliac joint (SIJ) conditions. 26 Score/100, ‘100’ indicating severe levels of disability and MCID of 10 points. 27 | |
| Neck Disability Index (NDI) | Patient reported measure of disability in cervical spine. 28 Score/100, ‘100’ indicating severe levels of disability and MCID of 10 points. 29 | |
| Lower Extremity Functional Scale (LEFS) | Patient reported measure for function for hip/knee/foot/ankle conditions. Score/80, ‘80’ indicating higher levels of function and MCID of 9 points. 30 | |
| Quick Disabilities of the Arm, Shoulder and Hand (Q-DASH) | Patient reported measure for disability in shoulder/elbow/wrist/hand conditions. 31 Score/100, ‘100’ indicating higher levels of disability and MCID of 10 points. 32 | |
| 11 – Item Numeric Rating Scale for Pain (NRS Pain) | Unidimensional pain measure for adults with chronic pain. Score/10 with 0 representing no pain and 10 ‘worst pain imaginable’ and an MCID of 2 points. 33 | |
| Global Rating of Change (GROC) – Primary Clinical Outcome | The 11-point Global Rating of Change (GROC) scale ranges from −5 (very much worse) to +5 (completely recovered). Scores were dichotomised into patients being a non-responder (scores −5 to +1) or a responder (scores +2 to +5) to management consistent with previous studies in this service. 34, 35 | |
| Service-related measures | ||
|---|---|---|
| Triage category | Cat1 (Urgent, within 30 days), Cat2 (Semi-urgent, within 90 days), Cat3 (Routine, within 365 days) | |
| Waiting time | Time (days) between specialist outpatient department receipt for initial referral and initial MPSC&MDS appointment | |
| Management duration | Time (days) between initial MPSC&MDS appointment and discharge from the service | |
| Multidisciplinary referrals | Number of multidisciplinary treatment services an individual was referred to | |
| Review appointments | Number of appointments | |
| Non-attendance | Status of if the patient attended final MPSC&MDS review appointment (yes/no) | |
| Interventions required | Yes/no | |
| Investigations required | Yes/no | |
| Medical specialist case discussion | Status of if the clinical leader initiated a case discussion with a medical consultant during the patient’s admission into MPSC&MDS (yes/no) | |
| Outpatient service | The specialist medical outpatient service receiving the original patient referral (i.e. orthopaedic, neurosurgical) | |
| Discharge pathway (percentage discharged without requiring specialised review) – Primary Service Outcome | The primary service outcome was the patient’s discharge status, dichotomised as being either discharged without requiring specialist medical review or requiring specialised review | |
Condition-specific pain and disability outcomes were recorded at initial consultation and discharge. All other measures were recorded for initial consultation only except the primary clinical (GROC) and service (discharge pathway) measures which were recorded at discharge only.
Data analysis
The proportion of Aboriginal and Torres Strait Islander patients within the MPSC&MDS patient population was compared to the proportion of Aboriginal and Torres Strait Islander peoples in the general population (Study Objective 1) at both a state-wide and HHS level using descriptive statistics. General population data were acquired from the 2021 Queensland Health Estimated Residuals Population (ERP) report.36
Patient-related and service-related measures and outcomes were compared between Aboriginal and Torres Strait Islander patients and non-Indigenous patients (Study Objective 2) using either chi-squared tests for categorical data, or univariate analysis of variance (ANOVA) for continuous data. The presence of outliers was examined and normality of data was assumed due to the large sample size.37,38 Effect sizes (ES) for categorical and continuous data were interpreted using Cramér’s V (φ) (≤0.2 = weak, 0.2 > ES ≤ 0.6 = moderate and ES >0.6 = strong),39 and partial eta squared (partial η2) (≤0.01 = small, 0.02 > ES ≤ 0.06 = medium and >0.14 = large), respectively.40 All analyses were performed using SPSS v28 (IBM Corp, Armonk, NY, USA). A P-value of <0.05 was considered significant.
Results
The analysis revealed high rates of completion (>95%) of initial patient- and service-related variables, while completion rates of the primary clinical outcome measure (56.4%) and other secondary outcome measures at initial consultation (70.4–97.8%) and discharge (22.1–58%) varied considerably.
A greater proportion of MPSC&MDS patients identified as Aboriginal and/or Torres Strait Islander (4.34%, n = 1209) when compared to the general Queensland population (3.61%, n = 143,960).36 This pattern was consistent across all HHSs, except Mackay (Table 2). The HHS and facility reporting the largest number of Aboriginal and Torres Strait Islander patients utilising the MPSC&MDS was Metro South HHS (4.0%, n = 376) and The Princess Alexandra Hospital (4.34%, n = 185), respectively. The Cairns and Hinterland HHS and the Cairns Hospital were the HHS and facility recording the largest proportion of Aboriginal and Torres Strait Islander patients (11.18%, n = 139) utilising the MPSC&MDS within their geographical catchment areas.
| Hospital and health service | General HHS population | MPSC&MDS | ||||
|---|---|---|---|---|---|---|
| n of non-Indigenous (%) | n of Aboriginal and Torres Strait Islander (%) | n of non-Indigenous (%) | n of Aboriginal and Torres Strait Islander (%) | General population ÷ MPSC&MDS population (%) | ||
| Cairns and Hinterland | 181,913 (90.85) | 18,324 (9.15) | 1104 (88.82) | 139 (11.18) | 122.21 | |
| Cairns Hospital | 1104 (88.82) | 139 (11.18) | ||||
| Central Queensland | 154,094 (94.45) | 9058 (5.55) | 161 (90.45) | 17 (9.55) | 172.08 | |
| Rockhampton Hospital | 161 (90.45) | 17 (9.55) | ||||
| Darling Downs | 207,677 (95.64) | 9464 (4.36) | 913 (92.78) | 71 (7.22) | 165.49 | |
| Toowoomba Hospital | 913 (92.78) | 71 (7.22) | ||||
| Gold Coast | 501,815 (98.28) | 8802 (1.72) | 301 (97.41) | 8 (2.59) | 150.52 | |
| Gold Coast University Hospital | 301 (97.41) | 8 (2.59) | ||||
| Mackay | 125,572 (95.26) | 6243 (4.74) | 660 (95.93) | 28 (4.07) | 85.86 | |
| Mackay Base Hospital | 660 (95.93) | 28 (4.07) | ||||
| Mater Health ServiceA | – | – | 1054 (96.79) | 35 (3.21) | – | |
| Mater Adult Hospital | 1054 (96.79) | 35 (3.21) | ||||
| Metro North | 815,486 (97.91) | 17,391 (2.09) | 5691 (96.07) | 233 (3.93) | 188.19 | |
| Pine Rivers Community Health Centre | 1011 (97.59) | 25 (2.41) | ||||
| Redcliffe Hospital | 709 (95.04) | 37 (4.96) | ||||
| Royal Brisbane and Women’s Hospital | 2996 (95.14) | 153 (4.86) | ||||
| The Prince Charles Hospital | 975 (98.19) | 18 (1.81) | ||||
| Metro South | 904,105 (97.93) | 19,078 (2.07) | 9114 (96.04) | 376 (3.96) | 191.40 | |
| Logan Hospital | 2217 (95.89) | 95 (4.11) | ||||
| Princess Alexandra Hospital | 4076 (95.66) | 185 (4.34) | ||||
| Queen Elizabeth II Jubilee Hospital | 2227 (96.87) | 72 (3.13) | ||||
| Redland Hospital | 594 (96.12) | 24 (3.88) | ||||
| Sunshine Coast | 343,188 (97.98) | 7074 (2.02) | 5898 (97.28) | 165 (2.72) | 134.72 | |
| Nambour General Hospital | 3561 (97.37) | 96 (2.63) | ||||
| Sunshine Coast University Hospital | 2337 (97.13) | 69 (2.87) | ||||
| Townsville | 173,321 (92.83) | 13,395 (7.17) | 1131 (92.48) | 92 (7.52) | 104.92 | |
| Townsville University Hospital | 1131 (92.48) | 92 (7.52) | ||||
| West Moreton | 221,115 (96.23) | 8660 (3.77) | 643 (93.46) | 45 (6.54) | 173.49 | |
| Ipswich Hospital | 643 (93.46) | 45 (6.54) | ||||
| State-wide | 3,842,992 (96.39) | 143,960 (3.61) | 26,670 (95.66) | 1209 (4.34) | 120.13 | |
Of the 1209 Aboriginal and Torres Strait Islander patients, 85% (n = 1033) identified as Aboriginal, 7% (n = 83) as Torres Strait Islander and 8% (n = 93) as both Aboriginal and Torres Strait Islander. Due to the low numbers of patients identifying as Torres Strait Islander, or both Aboriginal and Torres Strait Islander, it was not feasible to perform a separate analysis of episode of care characteristics and outcomes.
Comparisons of patient-related and service-related measures and outcomes between Aboriginal and Torres Strait Islander patients and non-Indigenous patients are outlined in Tables 3 and 4, respectively. While Aboriginal and Torres Strait Islander patients presented with a generally higher severity of clinical presentation compared to non-Indigenous patients across multiple variables, effect sizes across those variables showing a statistical difference between the groups were small (continuous variables partial η2 ≤0.01) or weak (categorical variables Cramér’s V φ ≤0.2).
| Variable | Non-Indigenous patients | Aboriginal and Torres Strait Islander patients | ||||
|---|---|---|---|---|---|---|
| Mean ± s.d. (n) or percentage (n) | Mean ± s.d. (n) or percentage (n) | F or χ2 | P-value | Effect size (partial η2 or Cramer’s φ) | ||
| Sociodemographic measures | ||||||
| Age (years) | 56.44 ± 14.8 (26,670) | 49.82 ± 14.81 (1209) | 231.11 | <0.001 | 0.01 | |
| SEIFAA | 985.97 ± 60.71 (26,604) | 966.92 ± 59.65 (1204) | 113.59 | <0.001 | 0.004 | |
| Gender (percentage female) | 52.5% (14,004) | 54.8% (663) | 8.69 | 0.013 | 0.02 | |
| ARIAB | ||||||
| Major city | 53.2% (14,149) | 38.3% (461) | 213.19 | <0.001 | 0.09 | |
| Inner regional | 27.1% (7199) | 26.6% (320) | ||||
| Outer regional | 16.4% (4361) | 26.2% (316) | ||||
| Remote | 3.4% (893) | 8.9% (107) | ||||
| Employment status | ||||||
| Employed | 35.5% (9393) | 28.7% (343) | 296.14 | <0.001 | 0.1 | |
| Unemployed | 26.7% (7046) | 48.1% (575) | ||||
| Retired | 28.5% (7522) | 13.6% (163) | ||||
| Other | 9.4% (2472) | 9.6% (115) | ||||
| Level of education | ||||||
| Up to lower secondary | 44.3% (11,559) | 53.6% (635) | 39.83 | <0.001 | 0.04 | |
| Completed secondary | 18.4% (4795) | 14.9% (177) | ||||
| Post school qualification | 37.3% (9449) | 31.5% (373) | ||||
| General health measures | ||||||
| BMIC (kg/m²) | 31.13 ± 9.16 (18,829) | 33.05 ± 9.71 (794) | 33.18 | <0.001 | 0.002 | |
| Co-morbidities (number) | 1.86 ± 1.57 (26,179) | 2.11 ± 1.65 (1185) | 28.1 | <0.001 | 0.001 | |
| AQOL-4DD standardised score | 72.79 ± 15.51 (22,659) | 67.46 ± 17 (1015) | 113.69 | <0.001 | 0.01 | |
| Smoking status | ||||||
| Current smoker | 20% (5288) | 36.7% (440) | 209.86 | <0.001 | 0.09 | |
| Never smoked | 40.9% (10,828) | 27.3% (328) | ||||
| Ex-smoker | 39.1% (10,360) | 36% (432) | ||||
| Non-prescription analgesia consumption (percentage requiring) | 76.6% (19,293) | 74.6% (838) | 2.273 | 0.132 | 0.01 | |
| Prescription analgesia consumption (percentage requiring) | 44.2% (10,674) | 53% (579) | 32.28 | <0.001 | 0.04 | |
| Psychological measures | ||||||
| PSEQ-2E | 6.53 ± 3.25 (25,834) | 5.95 ± 3.21 (1160) | 35.06 | <0.001 | 0.001 | |
| Keele STarTMSK screening tool | ||||||
| Low risk (0–4) | 13.1% (3424) | 8.6% (102) | 77.65 | <0.001 | 0.05 | |
| Medium risk (5–8) | 40.7% (10,626) | 32.3% (382) | ||||
| High risk (9–12) | 46.1% (12,027) | 59% (697) | ||||
| Condition-specific measures | ||||||
| Condition managed | ||||||
| Cervical | 12.5% (3335) | 13.2% (159) | 33.68 | <0.001 | 0.04 | |
| Lower back | 29.2% (7784) | 35.2% (426) | ||||
| Upper limb | 15.7% (4190) | 17% (206) | ||||
| Lower limb | 42.6% (11,361) | 34.6% (418) | ||||
| Cervical disability – NDI (score/100) | ||||||
| Initial | 39.99 ± 19.89 (2817) | 47.65 ± 19.64 (141) | 19.96 | <0.001 | 0.01 | |
| Discharge | 29.14 ± 20.09 (540) | 30.22 ± 21.21 (18) | 0.05 | 0.82 | <0.001 | |
| Lower back disability – ODI (score/100) | ||||||
| Initial | 42.19 ± 18.67 (7000) | 46.64 ± 19.36 (381) | 20.46 | <0.001 | 0.003 | |
| Discharge | 33.09 ± 20.3 (1378) | 35.68 ± 26.45 (59) | 0.9 | 0.34 | 0.001 | |
| Upper limb disability – Q-DASH (score/100) | ||||||
| Initial | 47.11 ± 21.83 (3863) | 52.59 ± 21.66 (182) | 10.94 | <0.001 | 0.003 | |
| Discharge | 32.32 ± 22.48 (1348) | 38.07 ± 22.75 (41) | 2.61 | 0.11 | 0.002 | |
| Lower limb disability – LEFS (score/80) | ||||||
| Initial | 35.74 ± 18.58 (10,707) | 32.71 ± 19.18 (391) | 9.99 | 0.002 | 0.001 | |
| Discharge | 44.13 ± 20.01(3349) | 43.84 ± 22.54(99) | 0.02 | 0.89 | <0.001 | |
| Pain intensity – NRS (score/10) | ||||||
| Initial | 6.45 ± 2.37 (25,785) | 6.94 ± 2.29 (1164) | 48.35 | <0.001 | 0.002 | |
| Discharge | 4.31 ± 2.78 (7309) | 4.89 ± 3.04 (230) | 9.47 | 0.002 | 0.001 | |
| Primary clinical outcome – GROC (percentage responders (+2 to +5)) | 64.3% (5268) | 63.2% (168) | 0.15 | 0.7 | 0.004 | |
Continuous variables are presented as means ± s.d. and corresponding statistics (F, P-value) including effect size (partial η2). Categorical variables are presented as a percentage of group total (%) and corresponding statistics (χ2, P-value) including effect size (Cramer’s φ). The number (n) of participants in each sample is provided.
| Variable | Non-Indigenous patients | Aboriginal and Torres Strait Islander patients | ||||
|---|---|---|---|---|---|---|
| Mean ± s.d. or percentage (n) | Mean ± s.d. or percentage (n) | F or χ2 | P-value | Partial η2 or Cramer’s φ | ||
| Triage category | ||||||
| Category 1 | 0.4% (113) | 0.5% (6) | 3.01 | 0.22 | 0.01 | |
| Category 2 | 28.4% (7914) | 31.9% (386) | ||||
| Category 3 | 66.9% (18,643) | 67.6% (817) | ||||
| Waiting time (days) | 162.48 ± 115.78 (26,670) | 170.02 ± 137.41 (1209) | 4.81 | 0.03 | <0.001 | |
| Management duration (days) | 111.49 ± 119.85 (26,670) | 134.83 ± 144.2 (1209) | 43.04 | <0.001 | 0.002 | |
| Multidisciplinary referrals (n) | 0.98 ± 0.85 (26,670) | 1.1 ± 0.94 (1209) | 21.75 | <0.001 | 0.001 | |
| Review appointments (n) | 0.66 ± 0.92 (26,670) | 0.65 ± 0.98 (1209) | 0.04 | 0.85 | <0.001 | |
| Investigations initiated (percentage initiated) | 11.3% (3015) | 15.7% (190) | 22.11 | <0.001 | 0.03 | |
| Interventions initiated (percentage initiated) | 4.3% (1142) | 4.7% (57) | 0.53 | 0.47 | 0.004 | |
| Medical consultant input (percentage requiring) | 20.6% (5505) | 24.3% (294) | 9.49 | 0.002 | 0.02 | |
| Percentage discharged due to non-attendance | 10.6% (2833) | 20.8% (252) | 122.78 | <0.001 | 0.07 | |
| Primary service outcome – discharge pathway (percentage discharged without requiring specialist review) | 65.6% (17,484) | 69.7% (843) | 8.93 | 0.003 | 0.02 | |
Continuous variables are presented as means ± s.d. and corresponding statistics (F, P-value) including effect size (partial η2). Categorical variables are presented as a percentage of group total (%) and corresponding statistics (χ2, P-value) including effect size (Cramer’s φ). The number (n) of participants in each sample is provided.
Discussion
This study provides an initial exploration of equity of care for Aboriginal and Torres Strait Islander peoples within the MPSC&MDS in Queensland. In addressing the first study objective, a slightly higher proportion of Aboriginal and Torres Strait Islander patients (4.3%) were represented in the service than in the general population (3.6%). This shows Aboriginal and Torres Strait Islander peoples are accessing the service. What is unknown is if this slightly higher representation addresses a potentially higher service need given the higher musculoskeletal burden and incidence of osteoarthritis previously reported for Aboriginal and Torres Strait Islander peoples compared to non-Indigenous Australians.1,2 Considered together with the potential barriers of social disadvantage, geographical remoteness of residence (Table 3) and potential mistrust of healthcare systems, findings warrant further exploration and consultation with community to ensure they do not underestimate an access gap within the service for Aboriginal and Torres Strait Islander peoples.8–10
In addressing the second study objective, Aboriginal and Torres Strait Islander patients presented with a generally higher severity of clinical presentation (higher condition-specific, general health and psychological measurement scores) at entry to the service compared to non-Indigenous patients (Table 3), although effect sizes were small. Aboriginal and Torres Strait Islander patients were also managed in the service for an overall longer duration of time and were referred to a higher number of multi-disciplinary team members for care, with a higher proportion of cases discussed with medical specialists compared to non-Indigenous patients (Table 4). Overall, these findings suggest Aboriginal and Torres Strait Islander patients may often present with complex and/or severe conditions requiring extensive care, but also indicate they potentially receive access to the service later in their musculoskeletal disease progression compared to non-Indigenous patients. Factors affecting time of entry to the MPSC&MDS are multifactorial but broadly include time taken by the individual to seek care, subsequent time taken to be initially referred to specialist outpatient services, as well as the waiting time to access the MPSC&MDS once triaged as eligible. While findings indicated Aboriginal and Torres Strait Islander patients waited longer on average to enter the service following triage compared to non-Indigenous patients, this difference was very small (<8 days difference). Findings indicate further community engagement is required to better understand and improve factors influencing access timing to the service. Future strategies may need to assist and support Aboriginal and Torres Strait Islander peoples to prioritise and seek musculoskeletal care earlier in their disease progression as well as improve their opportunity to be referred to and access the service earlier.
With regards to outcomes, very similar proportions of Aboriginal and Torres Strait Islander and non-Indigenous patients reported clinically meaningful improvements in their condition at discharge from the service (63.2 and 64.3%, respectively). Measures of condition-specific disability were also similar between groups at discharge across all conditions except for a slightly higher pain score reported by Aboriginal and Torres Strait Islander patients. Notable though was the significantly higher proportion of Aboriginal and Torres Strait Islander (69.7%) compared to non-Indigenous (65.6%) patients discharged from the service without requiring further specialist consultation (primary service outcome). At an initial glance, this may be interpreted as a better outcome for Aboriginal and Torres Strait Islander patients, but findings are confounded by the concurrently higher rate of discharge from the service due to non-attendance observed for Aboriginal and Torres Strait Islander (20.8%) compared to non-Indigenous (10.6%) patients. Patients not attending their final review appointment with the service may be considered as not requiring further management or specialist review, which is potentially misleading.
Several factors may influence non-attendance by Aboriginal and Torres Strait Islander patients to health services as observed in this study.41,42 First, a higher proportion of Aboriginal and Torres Strait Islander (35.1%) compared to non-Indigenous (19.8%) patients resided in outer-regional or remote areas in this study potentially impacting access to care and attendance. However, the literature suggests that Aboriginal and Torres Strait Islander peoples living in non-remote areas may also have difficulty accessing healthcare services due to factors such as affordability, poor communication and insufficient numbers of Aboriginal and Torres Strait Islander healthcare professionals.8 Other social determinants of health such as lower levels of education and employment observed for Aboriginal and Torres Strait Islander patients in this study have also been linked to healthcare access issues.6,43 However, deficits in these social determinants of health for Aboriginal and Torres Strait Islander peoples have been previously reported, and may just reflect ongoing racism and social exclusion experienced by Aboriginal and Torres Strait Islander peoples.7 While it is challenging to identify specific reasons influencing non-attendance by Aboriginal and Torres Strait Islander patients, actively engaging Aboriginal and Torres Strait Islander communities in decisions surrounding their health care and provision of culturally responsive care seems paramount to improving access and trust in local health services.44
In line with best practice guidelines and the National Agreement on Closing the Gap, consultation with Aboriginal and Torres Strait Islander communities is now needed to determine strategies by which the service can best meet the needs of Aboriginal and Torres Strait Islander peoples.11,45 Within Queensland Health, an Aboriginal and Torres Strait Islander Health Equity Framework, ‘Making Tracks Together’ was published in October 2021 to facilitate the implementation of health equity strategies across all 16 HHSs in 2022.46 Such strategies have included different decision-making processes with regard to non-attendance for Aboriginal and Torres Strait Islander peoples. These strategies were co-developed between Aboriginal and Torres Strait Islander peoples, key organisations and HHSs. They acknowledge and seek to address potential inequities, including those identified in this study, such as access to health care and delivery of culturally safe healthcare services. Potentially, other strategies such as implementing outreach services in rural communities could reduce the impact remoteness has on service access.8 The service may also be better delivered within Aboriginal Community Controlled Health Services (ACCHS), other Aboriginal and Torres Strait Islander community organisations or within community and primary care rather than hospital or government organisational settings.1 The MPSC&MDS database metrics may also need review to ensure they capture variables reflecting holistic concepts of health and wellbeing from an Aboriginal and Torres Strait Islander perspective, and include cultural determinants of health (e.g. cultural identity, language and cultural activity participation).8 For example in the United States, the Albuquerque Area Southwest Tribal Epidemiology Centre has developed a data ecosystem in collaboration with Indigenous peoples to improve self-determination and improve access to musculoskeletal care.47,48
A strength of this analysis is the wide representation of patients across Queensland. The large sample size increased statistical power allowing precise estimates of effect size which permitted a more transparent interpretation of significant group comparisons.49,50 Limitations include the large differences in the sample size between Aboriginal and Torres Strait Islander and non-Indigenous patients and the lower completion rate of outcome measures at discharge which can impact statistical power.51
Conclusion
While the outcomes of care in the MPSC&MDS are similar for Aboriginal and Torres Strait Islander and non-Indigenous patients, findings of this study suggest future consultation with Aboriginal and Torres Strait Islander communities is needed to ensure the provision of equitable access to this health service. While Aboriginal and Torres Strait Islander peoples with musculoskeletal conditions appear to benefit from the MPSC&MDS, a better understanding of the factors influencing access, attendance and engagement with the service may better serve the needs of Aboriginal and Torres Strait Islander peoples.
Data availability
The dataset utilised by this study is not publicly available as it has been gathered from multiple hospital health services, each with individual custodians who require further approval for access. Please contact MR (Maree.Raymer@health.qld.gov.au) regarding any data requests.
Acknowledgements
The authors thank the Musculoskeletal Physiotherapy Screening Clinic and Multi-disciplinary Service (MPSC&MDS) administration staff and clinicians across Queensland, Australia, who collated the outcome measures and data within the service database.
References
3 Lin IB, Bunzli S, Mak DB, Green C, Goucke R, Coffin J, O’Sullivan PB. Unmet Needs of Aboriginal Australians With Musculoskeletal Pain: A Mixed-Method Systematic Review. Arthritis Care Res 2018; 70(9): 1335-47.
| Crossref | Google Scholar | PubMed |
5 Australian Institute of Health and Welfare. Elective Surgery Access. Canberra: AIWH; 2019. Available at https://www.aihw.gov.au/reports-data/myhospitals/intersection/access/eswt
7 Markwick A, Ansari Z, Sullivan M, Parsons L, McNeil J. Inequalities in the social determinants of health of Aboriginal and Torres Strait Islander People: a cross-sectional population-based study in the Australian state of Victoria. Int J Equity Health 2014; 13(1): 91.
| Crossref | Google Scholar | PubMed |
8 O’Brien P, Bunzli S, Lin I, Bessarab D, Coffin J, Dowsey MM, Choong PFM. Addressing surgical inequity for Aboriginal and Torres Strait Islander people in Australia’s universal health care system: a call to action. ANZ J Surg 2021; 91(3): 238-44.
| Crossref | Google Scholar | PubMed |
9 Nolan-Isles D, Macniven R, Hunter K, Gwynn J, Lincoln M, Moir R, Dimitropoulos Y, Taylor D, et al. Enablers and Barriers to Accessing Healthcare Services for Aboriginal People in New South Wales, Australia. Int J Environ Res Public Health 2021; 18(6): 3014.
| Crossref | Google Scholar | PubMed |
11 Department of Health and Aged Care. How we support Aboriginal and Torres Strait Islander health. Canberra; 2023. Available at https://www.health.gov.au/health-topics/aboriginal-and-torres-strait-islander-health/how-we-support-health
12 Roberts T. Equity and Equality, Ageism in Evidence-Based Medicine. J Health Serv Res Policy 1997; 2(2): 129-131.
| Crossref | Google Scholar |
13 Moretto N, Comans TA, Chang AT, O’Leary SP, Osborne S, Carter HE, Smith D, Cavanagh T, et al. Implementation of simulation modelling to improve service planning in specialist orthopaedic and neurosurgical outpatient services. Implement Sci 2019; 14(1): 78.
| Crossref | Google Scholar | PubMed |
14 Cottrell MA, O’Leary SP, Swete-Kelly P, Elwell B, Hess S, Litchfield MA, McLoughlin I, Tweedy R, et al. Agreement between telehealth and in-person assessment of patients with chronic musculoskeletal conditions presenting to an advanced-practice physiotherapy screening clinic. Musculoskelet Sci Pract 2018; 38: 99-105.
| Crossref | Google Scholar | PubMed |
15 Raymer M, Mitchell L, Window P, Cottrell M, Comans T, O’Leary S. Disparities in Service and Clinical Outcomes in State-Wide Advanced Practice Physiotherapist-Led Services. Healthcare 2021; 9(3): 278.
| Crossref | Google Scholar | PubMed |
16 Standfield L, Comans T, Raymer M, O’Leary S, Moretto N, Scuffham P. The Efficiency of Increasing the Capacity of Physiotherapy Screening Clinics or Traditional Medical Services to Address Unmet Demand in Orthopaedic Outpatients: A Practical Application of Discrete Event Simulation with Dynamic Queuing. Appl Health Econ Health Policy 2016; 14(4): 479-91.
| Crossref | Google Scholar | PubMed |
17 Comans T, Raymer M, O’Leary S, Smith D, Scuffham P. Cost-effectiveness of a physiotherapist-led service for orthopaedic outpatients. J Health Serv Res Policy 2014; 19(4): 216-23.
| Crossref | Google Scholar | PubMed |
18 Australian Bureau of Statistics. Socio-economic Indexes for Areas (SEIFA) 2016. Canberra: ABS; 2016. Available at https://www.abs.gov.au/ausstats/abs@.nsf/mf/2033.0.55.001
19 Eckert KA, Taylor AW, Wilkinson D. Does health service utilisation vary by remoteness? South Australian population data and the Accessibility and Remoteness Index of Australia. Aust N Z J Public Health 2004; 28(5): 426-32.
| Crossref | Google Scholar | PubMed |
20 Queensland Government Statistician’s Office. Accessibility/Remoteness Index of Australia. 2019. Available at https://www.qgso.qld.gov.au/about-statistics/statistical-standards-classifications/accessibility-remoteness-index-australia
21 Hawthorne G, Richardson J, Osborne R. The Assessment of Quality of Life (AQoL) instrument: a psychometric measure of Health-Related Quality of Life. Qual Life Res 1999; 8(3): 209-24.
| Crossref | Google Scholar | PubMed |
22 Iezzi AR, Richardson J, Lakua S, Sinha K, Khan M, McKie J, Maxwell A. Assessment of Quality of Life - Instruments. 2014. Available at http://www.aqol.com.au/index.php/aqolinstruments
23 Nicholas MK, McGuire BE, Asghari A. A 2-Item Short Form of the Pain Self-Efficacy Questionnaire: Development and Psychometric Evaluation of PSEQ-2. J Pain 2015; 16(2): 153-63.
| Crossref | Google Scholar | PubMed |
24 Dubé MO, Langevin P, Roy JS. Measurement properties of the Pain Self-Efficacy Questionnaire in populations with musculoskeletal disorders: a systematic review. Pain Rep 2021; 6(4): e972.
| Crossref | Google Scholar | PubMed |
25 Hill JC, Garvin S, Chen Y, Cooper V, Wathall S, Saunders B, Lewis M, Protheroe J, et al. Stratified primary care versus non-stratified care for musculoskeletal pain: findings from the STarT MSK feasibility and pilot cluster randomized controlled trial. BMC Fam Pract 2020; 21(1): 30.
| Crossref | Google Scholar | PubMed |
26 Lauridsen HH, Hartvigsen J, Manniche C, Korsholm L, Grunnet-Nilsson N. Responsiveness and minimal clinically important difference for pain and disability instruments in low back pain patients. BMC Musculoskelet Disord 2006; 7(1): 82.
| Crossref | Google Scholar | PubMed |
27 Hägg O, Fritzell P, Nordwall A. The clinical importance of changes in outcome scores after treatment for chronic low back pain. Eur Spine J 2003; 12(1): 12-20.
| Crossref | Google Scholar | PubMed |
28 Vernon H, Mior S. The Neck Disability Index: a study of reliability and validity. J Manipulative Physiol Ther 1991; 14(7): 409-15.
| Google Scholar | PubMed |
29 Riddle DL, Stratford PW. Use of Generic Versus Region-Specific Functional Status Measures on Patients With Cervical Spine Disorders. Phys Ther 1998; 78(9): 951-63.
| Crossref | Google Scholar | PubMed |
30 Binkley JM, Stratford PW, Lott SA, Riddle DL. The Lower Extremity Functional Scale (LEFS): scale development, measurement properties, and clinical application. North American Orthopaedic Rehabilitation Research Network. Phys Ther 1999; 79(4): 371-83.
| Google Scholar | PubMed |
31 Beaton DE, Wright JG, Katz JN, The Upper Extremity Collaborative Group.. Development of the QuickDASH: Comparison of Three Item-Reduction Approaches. J Bone Joint Surg Am 2005; 87(5): 1038-46.
| Crossref | Google Scholar | PubMed |
32 Fan ZJ, Smith CK, Silverstein BA. Assessing Validity of the Quick DASH and SF-12 as Surveillance Tools among Workers with Neck or Upper Extremity Musculoskeletal Disorders. J Hand Ther 2008; 21(4): 354-65.
| Crossref | Google Scholar | PubMed |
33 Hawker GA, Mian S, Kendzerska T, French M. Measures of adult pain: Visual Analog Scale for Pain (VAS Pain), Numeric Rating Scale for Pain (NRS Pain), McGill Pain Questionnaire (MPQ), Short-Form McGill Pain Questionnaire (SF-MPQ), Chronic Pain Grade Scale (CPGS), Short Form-36 Bodily Pain Scale (SF-36 BPS), and Measure of Intermittent and Constant Osteoarthritis Pain (ICOAP). Arthritis Care Res 2011; 63(S11): S240-52.
| Crossref | Google Scholar | PubMed |
34 Kamper SJ, Maher CG, Mackay G. Global rating of change scales: a review of strengths and weaknesses and considerations for design. J Man Manip Ther 2009; 17(3): 163-70.
| Crossref | Google Scholar | PubMed |
35 Raymer M, Window P, Cottrell M, Comans T, O’Leary S. Revised service metrics partially explain variation in outcomes across facilities in a state-wide advanced practice public musculoskeletal service. Musculoskeletal Care 2023; 21(2): 562-70.
| Crossref | Google Scholar | PubMed |
36 Queensland Government Statistician’s Office. Estimated Resident Population by Indigenous Status. Canberra; 2021. Available at https://www.qgso.qld.gov.au/statistics/theme/population/population-estimates/regions#current-release-estimated-resident-population-abs-consultancy
37 Kwak SG, Kim JH. Central limit theorem: the cornerstone of modern statistics. Korean J Anesthesiol 2017; 70(2): 144-56.
| Crossref | Google Scholar | PubMed |
38 Mascha EJ, Vetter TR. Significance, Errors, Power, and Sample Size: The Blocking and Tackling of Statistics. Anesth Analg 2018; 126(2): 691-8.
| Crossref | Google Scholar | PubMed |
39 International Business Machines Corporation. Cramér’s V. Armonk; 2021. Available at https://www.ibm.com/docs/en/cognos-analytics/11.1.0?topic=terms-cramrs-v
41 Flegg KM, Phillips CB, Collins AL, Sharp PG, Kanagasundaram M, Lovett RW, Kljakovic M. Health service attendance patterns in an urban Aboriginal health service. Med J Aust 2010; 193(3): 146-8.
| Crossref | Google Scholar | PubMed |
42 Bailie RS, Si D, Robinson GW, Togni SJ, d’Abbs PH. A multifaceted health-service intervention in remote Aboriginal communities: 3-year follow-up of the impact on diabetes care. Med J Aust 2004; 181(4): 195-200.
| Crossref | Google Scholar | PubMed |
43 Davy C, Harfield S, McArthur A, Munn Z, Brown A. Access to primary health care services for Indigenous peoples: A framework synthesis. Int J Equity Health 2016; 15(1): 163.
| Crossref | Google Scholar | PubMed |
44 Durey A, McEvoy S, Swift-Otero V, Taylor K, Katzenellenbogen J, Bessarab D. Improving healthcare for Aboriginal Australians through effective engagement between community and health services. BMC Health Serv Res 2016; 16(1): 224.
| Crossref | Google Scholar | PubMed |
45 Gwynne K, Jeffries Jr T, Lincoln M. Improving the efficacy of healthcare services for Aboriginal Australians. Aust Health Rev 2019; 43(3): 314-22.
| Crossref | Google Scholar | PubMed |
46 State of Queensland (Queensland Health) and Queensland Aboriginal and Islander Health Council (QAIHC). Making Tracks Together Queensland’s Aboriginal and Torres Strait Islander Health Equity Framework. Brisbane; 2021. Available at https://www.health.qld.gov.au/public-health/groups/atsihealth/making-tracks-together-queenslands-atsi-health-equity-framework
47 Lovett R, Prehn J, Williamson B, Maher B, Lee V, Bodkin-Andrews G, Walter M. Knowledge and power: the tale of Aboriginal and Torres Strait Islander data. Aust Aborig Stud 2020; 2: 3-7.
| Google Scholar |
48 O’Brien P, Bunzli S, Lin I, Gunatillake T, Bessarab D, Coffin J, Garvey G, Dowsey M, et al. Tackling the Burden of Osteoarthritis as a Health Care Opportunity in Indigenous Communities—A Call to Action. J Clin Med 2020; 9(8): 2393.
| Crossref | Google Scholar | PubMed |
49 Biau DJ, Kernéis S, Porcher R. Statistics in brief: the importance of sample size in the planning and interpretation of medical research. Clin Orthop Relat Res 2008; 466(9): 2282-8.
| Crossref | Google Scholar | PubMed |
50 Faber J, Fonseca LM. How sample size influences research outcomes. Dental Press J Orthod 2014; 19(4): 27-9.
| Crossref | Google Scholar | PubMed |
51 Alamolhoda M, Ayatollahi SMT, Bagheri Z. A comparative study of the impacts of unbalanced sample sizes on the four synthesized methods of meta-analytic structural equation modeling. BMC Res Notes 2017; 10(1): 446.
| Crossref | Google Scholar | PubMed |