Temporal trends in medical device implant procedures in Australia 2008–22: evidence from the Australian Institute of Health and Welfare National Hospital Morbidity database
Mohammad Afshar Ali A * , Thu-Lan Kelly
  B and Marianne Gillam
  A
A
A
B
Abstract
Examine the temporal trends in medical device implant procedures in the Australian population.
We used data from the Australian Institute of Health and Welfare from the financial years 2007–08 to 2021–22 and chose the most frequently performed medical device implant procedures. We estimated the annual change in volume of procedures and age-standardised rates by calculating the compound annual growth rate (CAGR), and used regression with the Newey–West robust variance estimator to examine whether there was a linear trend in the age-standardised rates for each procedure.
For procedures including cardiac pacemakers, heart valves, hip and knee arthroplasties, and intraocular lenses, the crude CAGR was over 3%. For the age-standardised rates, the CAGR was largest for cardiac pacemaker, followed by heart valve replacement and hip arthroplasty procedures. For some procedures, the growth was more than in the Australian population, including cardiac pacemakers (β = 1.00; 95% CI: 0.14–1.86), heart valve replacements (β = 0.41; 95% CI: 0.28–0.54), hip arthroplasty (β = 3.50; 95% CI: 1.61–5.38), and knee arthroplasty (β = 4.31; 95% CI: 0.54–8.09) procedures. The trend of standardised rates of procedures, including incisional hernia with mesh, breast implants, coronary stents, and cardiac defibrillators, grew at the same rate as the population, whereas the rate for gastric banding procedures decreased (β = −3.14; 95% CI: −4.92 to −1.34).
The findings from the current study, showing a large increase in medical device implant procedures, will assist in future healthcare planning and efforts in post-market surveillance of safety of medical devices.
Keywords: Australia, healthcare, medical device implants, medical procedure, trend analysis.
Introduction
Medical device implantation is a commonly performed medical procedure across the world. It was reported that more than 10% of the Australian population had an implantable medical device.1 As technology advances, an increasing number of people are becoming eligible for device implants. Consequently, the incidence of medical device implantations is expected to increase over time. To exemplify, a recent study projected that the incidence rate of total hip arthroplasty in Australia would increase by 66% by 2046 compared to 2013.2,3 Additionally, the introduction of a new technology and its gradual uptake has yielded a positive effect on the quality of life and survival of patients.4,5 For example, transcatheter aortic valve implantation (TAVI) is a lifesaving procedure that improves the quality of life for patients by reducing the surgical risk associated with open heart valve surgery.5,6
An extensive body of literature has analysed trends of medical device implant procedures at national and cross-country levels.7–11 However, those analyses focused on either a particular medical procedure or total procedures conducted on particular anatomical sites.8,11,12 In contrast to previous studies, this study investigates the implantation of all major medical devices in Australia. While medical devices provide benefits, there is increasing evidence that recipients of device implants can experience adverse effects.13,14 Therefore, an examination of changes in major device implant procedures across the general population will identify implants with high use or large changes over time which may inform critical safety monitoring efforts.
The current study focused on major categories of medical device implant procedures performed frequently over the period of financial year (FY) 2007–08 to FY2021–22. A novel contribution of the current study is that it allows a comparison of trends between different types of device implantation procedures. Findings from this study would be useful in developing effective procedures to manage cost and ensure access to healthcare, and in devising strategies to inform the development of an effective post-market surveillance system. Given this backdrop, the overall purpose of this study was to identify trends in the use of medical device implantation procedures in the general Australian adult population over the past 13 years.
Methods
We report the methods and results as prescribed in the Strengthening of Reporting in Observational Studies in Epidemiology (STROBE) statement.15
Study design and data sources
This study analysed annual data from the Australian Institute of Health and Welfare’s (AIHW) National Hospital Morbidity Database covering the past 15 FYs spanning the period from FY2007–08 to FY2021–22.16 AIHW data cubes are publicly available datasets which include information on volume of medical procedures performed in public and private Australian hospitals. These databases also contain demographic information collated from separation records of all admitted patients from all hospitals within Australia. Classification of these chapters and their subsequent sub-chapters and blocks, (procedure codes) are conducted in accordance with various editions of the Australian Classification of Health Interventions (ACHI). We chose 10 major implant procedures (consisting of 47 specific procedure codes) from anatomical sites including eyes, heart, abdomen, joints, and breast that were the most frequently performed (the 47 specific ACHI procedure codes are provided in Supplementary Table S1). The Australian Demographic Statistics compiled by the Australian Bureau of Statistics17 covering the study period were used to age- and sex-standardise procedures to the 2001 Australian standard population. To ease comparability and yield consistent results from those two datasets, we have used age 20 years and above for computing rates of each procedure per 100,000 standard population. As this study is based on publicly available, pre-aggregated, non-identifiable data collated from the AIHW National Hospital Morbidity Database, formal ethics approval was not sought.
Statistical analyses
We aggregated the annual total number of selected procedures for each year by age and gender. Then, we computed the age- and gender-specific rates of each procedure per 100,000 adult people aged 20 years and above. We estimated the age- and gender-standardised rates per 100,000 standard population by multiplying the age- and gender-specific rates with the corresponding weights of that group in Australian standard population.
We estimated the compound annual growth rate (CAGR) of procedure counts and that of the standardised rates of the procedures. In addition, we used linear regression models to examine whether there was a linear trend in the standardised rates of procedures. To account for heteroscedasticity and autocorrelation in time series data, we estimated the variance–covariance matrix of the regression coefficients using the ‘vcovHAC’ function of R package ‘sandwich’.18 We stratified the regression analysis by sex to derive sex-specific estimates of the implantable procedures. Additionally, to capture whether the sex differences in the procedures were statistically significant, we added an interaction term between year and sex in the regression model. We set statistical significance at alpha level 5% and used R v.4.3.1 (R Foundation for Statistical Computing, Vienna, Austria) for all statistical analyses.
Ethics
This study is based on publicly available, pre-aggregated, non-identifiable data collated from the AIHW National Hospital Morbidity Database. It was conducted as part of an NHMRC funded project, which has been granted ethics approval from the University of South Australia Human Research Ethics Committee (reference number ID 203638).
Results
We found significant changes in the number of medical device implant procedures among the Australian population over the study period (Table 1). The overall number of the selected implant procedures performed during the 15-year period increased from 325,000 to 490,000. Except for gastric banding procedures and incisional with mesh, there was an increase in the crude volumes of procedures. For implant procedures including cardiac pacemaker, heart valve, hip and knee arthroplasty, and intraocular lenses (IOL) the average annual growth surpassed 3% (Table 1, column 4). For age-standardised rates, the increase was largest for cardiac pacemaker, followed by heart valve replacements, and hip prostheses, each with more than 1% average growth per annum (Table 1, column 5). Procedures with gastric banding to control obesity showed a large negative change of −28% between FY2013−14 (when data first became available) and FY2021−22. The smallest increase in age-standardised rate was in breast implant procedures with CAGR of 0.03% (Table 1).
| Implant procedure | Procedure volume (age-standardised rates per 100,000 standard population) | CAGR (%) | Regression estimates | ||||||||
|---|---|---|---|---|---|---|---|---|---|---|---|
| Crude | Standardised | Coefficient (95% CI) | |||||||||
| FY08 | FY22 | Total | Total | Male | Female | Total | Male | Female | Interaction P-value | ||
| Intraocular lenses | 181,551 (1111) | 287,041 (1174) | 3.10 | 0.37 | 0.51 | 0.25 | 6.09 (−3.44 to 15.62) | 7.30 (−1.60 to 16.20) | 9.31* (1.50–17.11) | 0.700 | |
| Gastric bandingA | 7497 (28) | 257 (1) | −27.76 | −28.39 | −27.57 | −28.64 | −3.14* (−4.92 to −1.34) | −1.30* (−2.14 to −0.46) | −4.97* (−7.73 to −2.21) | <0.001 | |
| Incisional hernia with mesh | 5649 (34) | 5533 (25) | −0.14 | −2.01 | −1.57 | −2.39 | −0.22 (−0.92 to 0.47) | −0.10 (−0.73 to 0.54) | −0.35 (−1.11 to 0.41) | 0.446 | |
| Breast implant | 8012 (104) | 9408 (105) | 1.08 | 0.03 | NA | 0.03 | 2.09 (<0.01–5.11) | NA | 2.09 (<0.01–5.11) | NA | |
| Heart valve | 5466 (33) | 9409 (39) | 3.69 | 1.08 | 1.26 | 0.80 | 0.41* (0.28–0.54) | 0.76* (0.58–0.94) | 0.10 (−0.07 to 0.27) | <0.001 | |
| Coronary stent | 41,755 (198) | 53,052 (182) | 1.61 | −0.55 | −0.45 | −0.78 | 0.30 (−1.31 to 1.90) | 0.84 (−1.79 to 3.47) | −0.11 (−0.81 to 0.59) | 0.290 | |
| Cardiac pacemaker | 10,634 (62) | 18,960 (75) | 3.93 | 1.27 | 1.31 | 1.02 | 1.00* (0.14–1.86) | 1.26* (0.18–2.34) | 0.68* (<0.01–1.41) | 0.130 | |
| Cardiac defibrillator | 3063 (18) | 3779 (19) | 1.41 | −0.75 | −0.97 | −0.04 | −0.09 (−0.31 to 0.13) | −0.22 (−0.57 to 1.44) | −0.01 (−0.10 to 0.08) | 0.165 | |
| Hip arthroplasty | 28,805 (169) | 47,539 (198) | 3.40 | 1.05 | 1.27 | 0.93 | 3.50* (1.61–5.38) | 3.40* (1.81–4.99) | 3.99* (1.65–6.33) | 0.587 | |
| Knee arthroplasty | 33,237 (197) | 55,395 (229) | 3.46 | 1.03 | 1.41 | 0.71 | 4.31* (0.54–8.09) | 5.65* (2.21–9.09) | 4.29* (<0.01–8.63) | 0.414 | |
The regression estimates represent average yearly increase in standardised rates of procedures (per 100,000 population). The ‘vcovHAC’ function of R package ‘sandwich’ was used to estimate the Huber-White sandwich robust variance-covariance matrix; P-value of coefficient of interaction effect between year and gender.
CAGR, compound annual growth rate.
*Statistically significant at 5% level.
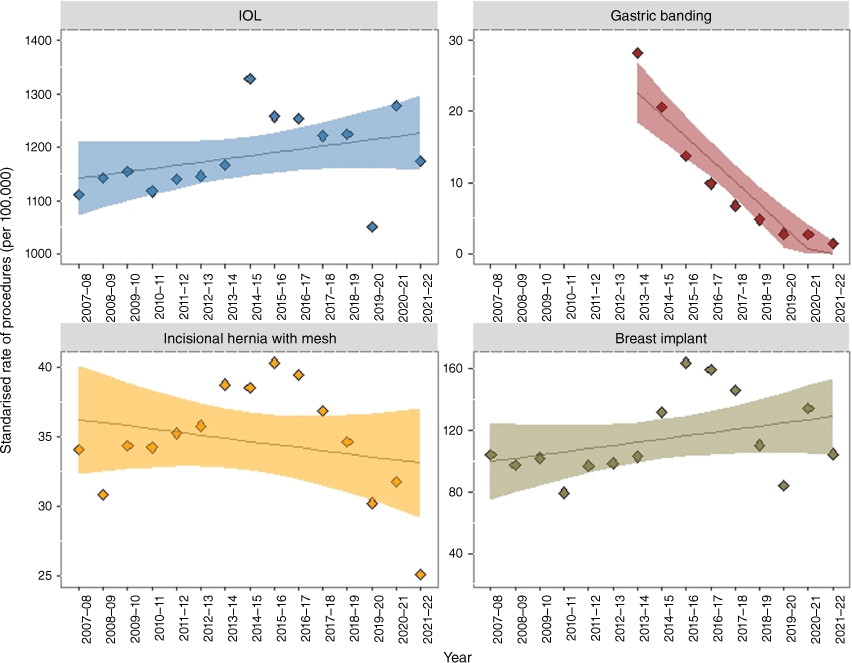
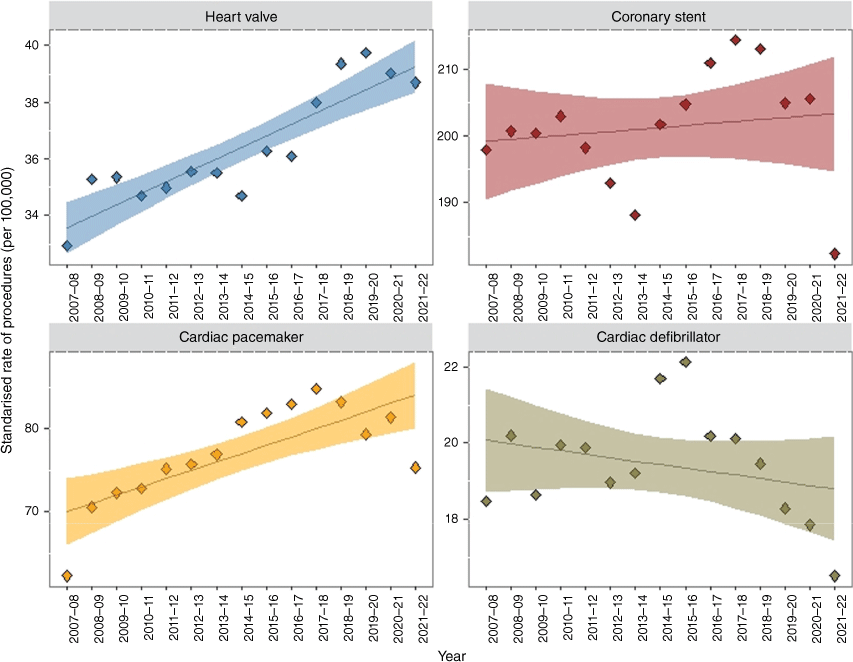
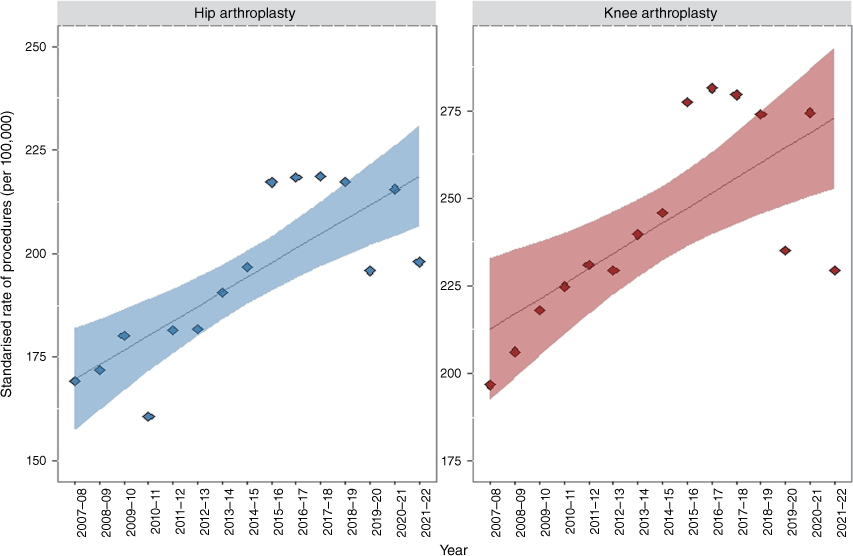
Figs 1–3 and Table 1 (column 9) reports the coefficient estimates of the fitted linear regression with 95% CI for each implant procedure. The regression coefficients represent the annual change in procedure rates per 100,000 adult standard population. The 95% CIs for the regression coefficients which do not contain 0 indicate that the standardised growth rates were significantly different from the population growth. Gastric banding was the only procedure to show significant negative growth rates (β = −3.14; 95% CI: −4.92 to −1.34), equivalent to a reduction at a rate of around three procedures per 100,000 standard population per year over the 15-year period. The growth of standardised rates of implant procedures was faster than the population growth for knee (β = 4.31; 95% CI: 0.54–8.09), hip (β = 3.50; 95% CI: 1.61–5.38), cardiac pacemaker (β = 1.00; 95% CI: 0.14–1.86), and heart valve (β = 0.41; 95% CI: 0.28–0.54). The procedures that grew at the same rate as the population were IOL procedures, incisional hernia with mesh, breast implants, coronary stent, and cardiac defibrillator, all of which had 95% CIs containing 0. We found similar trend after stratifying the regression analysis by gender (columns 10–11 of Table 1 except for IOL procedures, where women had higher than population growth rates (β = 9.31; 95% CI: 1.50–17.11), and heart valve procedures, where rates in men grew faster than population growth (β = 0.76; 95% CI: 0.58–0.94) but not in women (β = 0.10; 95% CI: −0.07 to 0.27). For gastric banding, female patients experienced a faster decrease in the standardised rates of procedures (β = −4.97; 95% CI: −7.73 to −2.21) than male patients (β = −1.30; 95% CI: −2.14 to −0.46), and the interaction effect of time and sex is statistically significant (P-value <0.001).
Changes in standardised rates of medical device implant procedures for intraocular lenses, gastric banding, incisional hernia, and breast implants from financial year FY2007–08 to FY2021–22.
Changes in standardised rates of cardiac implant procedures from financial year FY2007–08 to FY2021–22.
Changes in standardised rates of hip and knee arthroplasty procedures from financial year FY2007–08 to FY2021–22.
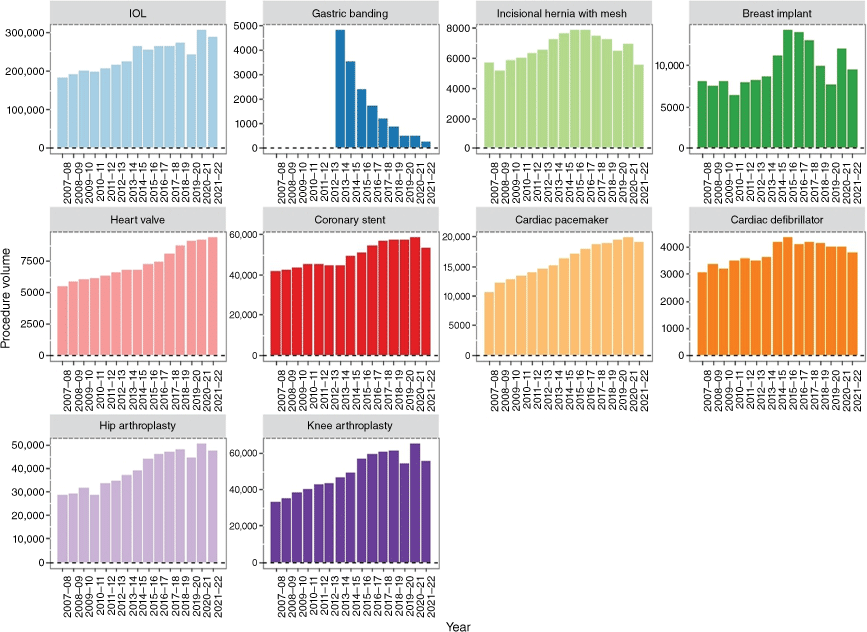
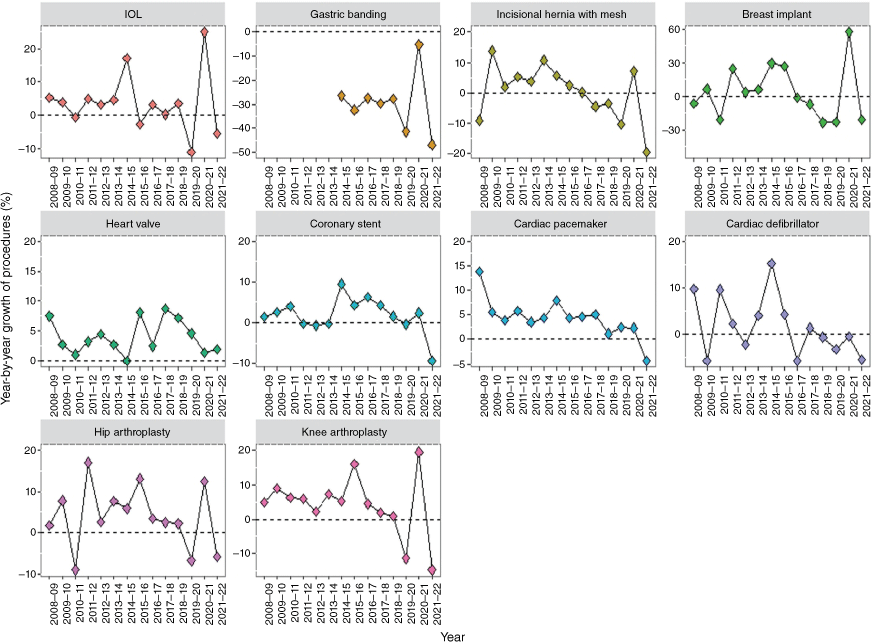
Trends in volumes of the medical device implant procedures are represented in Fig. 4. IOLs had the highest volumes of procedures while gastric banding had the lowest count. Fig. 5 shows that growth was not consistent over the study period. A peak was observed in approximately 2015 for most devices, apart from gastric banding procedures, which demonstrated a negative growth throughout the period. Heart valve procedures had a large peak in year-on-year growth in FY2015–16. After 2015 until FY2020–21, there was negative growth in breast implant procedures and a stable or slightly declining growth in cardiac defibrillators and incisional hernia mesh procedures. In FY2019–20 during the COVID-19 pandemic, there was negative growth for most procedures except heart valve replacements, followed by positive growth in FY2020–21, except for cardiac defibrillator implantations and gastric banding. In FY2021–22, there was again a negative growth rate for most procedures except heart valves.
Discussion and conclusion
The current study provides a comparative analysis of trends in major medical device implant procedures in Australia. It is evident from our study that the growth in the volume of some procedures has outpaced the growth in others. For example, from FY2007–08 to FY2021–22, we noticed a large growth in crude cardiac pacemaker procedures with annual growth of almost 4% followed by heart valve replacement and hip arthroplasty (each of them surpassed a CAGR of 3%). Except for gastric banding, many medical procedures grew faster than the population. This includes knee and hip replacements, pacemakers, and heart valve replacement procedures. Other procedures, including incisional hernia with mesh, breast implants, coronary stents, and cardiac defibrillators, grew at the same rate as the population. We observed less growth in the age-standardised rates for each implant procedure than in the crude procedure volumes which can be explained by changes in the age distribution with an increasing proportion of people aged 65 years and over in the Australian population.
The largest number of procedures was in cataract surgery with insertion of IOLs, increasing from around 180,000 annual procedures in FY2007–08 to approximately 300,000 annual procedures in FY2021–22. In cataract surgery, most people would have two procedures, as the vast majority of ophthalmologists in Australia prefer delayed sequential bilateral cataract surgery,19 which may explain the large volume of IOL insertions. As the prevalence of cataracts increases with age, the growth may reflect the growth in the older population which is consistent with lower standardised CAGR than crude CAGR (0.37 and 3.10, respectively). Additionally, there has been major advance in surgical techniques and technology, also impacting the growth in the number of procedures.20 Our findings are consistent with large international retrospective21 and Australian prospective studies.22 Gender-wise stratification of age-standardised rates indicate that women undergoing IOL procedures grew significantly faster than the population, which was not the case for men. The reason for this is not clear, but it could be due to the influence of hormones.22
While insertion of IOLs was the largest in terms volume of procedures, cardiac pacemaker implants had the largest growth in crude and age-standardised rates of procedures, which are consistent with recent national-level registry data-based studies. This increase is likely due to the rise in the proportion of the elderly population and technological advances.23,24 The second largest growth in cardiovascular implant procedures was noticed for heart valve replacements. One recent study reported a 22% rise in age-adjusted aortic valve replacements over the period of 2004–19.25 Evidence suggests that this increase may be attributed to the introduction of new technology, such as TAVI.25 However, there were sex differences in growth rates, with rates for men increasing significantly faster than the population growth compared to women.
Among joint replacement procedures, hip arthroplasty had the largest annual growth in age-standardised rates followed by knee arthroplasty. These are consistent with several other comparable studies2,8,26,27 and can be attributed to the increase in the elderly population, more implants in the younger population cohort, and growing annual obesity prevalence.7
Over the study period, there was a general upward trend in the number of procedures performed. However, there was some year-to-year variation, which may have been due to a number of factors, including changes to Medicare Benefits Schedule rebates, publicity surrounding safety concerns from breast implants, and changes in treatment procedures for obesity. The year-to-year variation was most evident for gastric band procedures, which demonstrated a decrease with a CAGR of around 28% over the period of the study. In addition, sex-wise stratification of results indicate that for women the rate was declining significantly faster compared to men. This declining trend in laparoscopic gastric banding can be explained by changes in treatment procedures for obesity, for example, introduction of laparoscopic sleeve gastrectomy and laparoscopic gastric bypass,28 which is evident in the AIHW data. The number of laparoscopic sleeve gastrectomy procedures has increased significantly (109%) from 10,347 procedures in FY2013–14 to 21,850 procedures in FY2021–22.16
Our study is unique in that it provides a general trend analysis of all major medical device implant procedures in Australia at a population level. This allows us to compare growth in different medical device procedures to each other and to the Australian population. We found that the growth of medical device implant procedures outpaced that of the adult population over the study period, suggesting that the aging of the Australian population does not provide the whole explanation for the surge in volume of implant procedures.
During the COVID-19 pandemic, non-urgent elective surgery was restricted nationwide in Australia from March 2020 and partially eased 1 month later. Following a second outbreak in June 2020 in some states, restrictions continued until FY2020–21.29 In FY2019–20, elective surgery declined by 8.3 and 5.7% in public and private hospitals, respectively, compared with the previous year.30 These restrictions are evident in the temporary decline in most procedures during FY2019–20, particularly in knee arthroplasty and IOL insertion. This was followed by a rebound to pre-COVID-19 trends in FY2020–21. However, there was no change in the trends for heart valve replacements during the COVID-19 pandemic.
While medical devices are beneficial, they are also associated with harm. In Australia, the Therapeutic Goods Administration (TGA) monitors the safety of medical devices through spontaneous adverse event reports received from manufacturers, consumers, and health professionals which are made public in the Australian Database of Adverse Event Notifications (DAEN).31 There is underreporting of adverse events in DAEN as evident in the small number of events reported associated with urogynaecological mesh in 2017 compared to what was reported to the Australian Senate Inquiry on the issue.32 In 2017, there were 5379 medical device incidents overall reported to the TGA.32 The low number of reported adverse events compared to the increasing large volume of medical device procedures highlights the importance of strengthening the post-market surveillance of medical devices. Observational registries can also play an important role in identifying device-related complications.33
Our study is not free from limitations. First, due to unavailability of data on mesh versus non-mesh procedures we were not able to incorporate inguinal hernia repair with mesh in the analysis, which is a commonly performed procedure in Australia.34 Second, our study is based on a dataset which has several inconsistencies in reporting of the procedure categories and codes (see Supplementary material for details). Third, we only used linear regression to look for trends, which may not be the best fitting model for some device procedures. More detailed device-specific analysis, including an analysis of changes in trends over the study period, could be a subject for further research. To this end, the results of the current study could be used as a starting point for a further investigation which can relate device-specific population-level findings with patient-level age- and gender-wise profiling of implant procedures based on observational or registry data. Findings from this study are useful for future healthcare planning and allocation of resources for the healthcare delivery of necessary healthcare to patients in Australia. Monitoring the growth of device procedures relative to population may prevent a substantial economic burden from increased volume of some procedures (e.g. cardiac defibrillators or knee arthroplasty).
Data availability
The present study used publicly available data from the AIHW National Hospital Data Collection. The AIHW procedure data cubes can be accessed from https://www.aihw.gov.au/reports/hospitals/procedures-data-cubes/contents/data-cubes. The list of extracted data is available upon reasonable request.
Declaration of funding
This work was supported by an Australian Government National Health and Medical Research Council (NHMRC) Ideas Grant (APP2002589). We did not receive any financial support or other benefits from commercial sources. The funders played no role in the data analysis or interpretation or in the preparation of this manuscript. The authors had full access to all of the data in the study.
References
2 Inacio MCS, Graves SE, Pratt NL, Roughead EE, Nemes S. Increase in Total Joint Arthroplasty Projected from 2014 to 2046 in Australia: A Conservative Local Model With International Implications. Clin Orthop Relat Res 2017; 475(8): 2130-7.
| Crossref | Google Scholar | PubMed |
3 Ackerman IN, Bohensky MA, Zomer E, Tacey M, Gorelik A, Brand CA, et al. The projected burden of primary total knee and hip replacement for osteoarthritis in Australia to the year 2030. BMC Musculoskelet Disord 2019; 20(1): 90.
| Crossref | Google Scholar | PubMed |
4 Wamble DE, Ciarametaro M, Dubois R. The Effect of Medical Technology Innovations on Patient Outcomes, 1990–2015: Results of a Physician Survey. J Manag Care Spec Pharm 2019; 25(1): 66-71.
| Crossref | Google Scholar | PubMed |
5 Lee A-H, Ng ACC, Yong ASC, Hyun K, Brieger D, Kritharides L, et al. Outcomes of 1,098 Patients Following Transcatheter Aortic Valve Implantation: A Statewide Population-Linkage Cohort Study. Heart Lung Circ 2021; 30(8): 1213-20.
| Crossref | Google Scholar | PubMed |
6 Gada H, Kapadia SR, Tuzcu EM, Svensson LG, Marwick TH. Markov Model for Selection of Aortic Valve Replacement Versus Transcatheter Aortic Valve Implantation (Without Replacement) in High-Risk Patients. Am J Card 2012; 109(9): 1326-33.
| Crossref | Google Scholar | PubMed |
7 Pabinger C, Lothaller H, Portner N, Geissler A. Projections of hip arthroplasty in OECD countries up to 2050. Hip Int 2018; 28(5): 498-506.
| Crossref | Google Scholar | PubMed |
8 Lewis PL, Graves SE, Robertsson O, Sundberg M, Paxton EW, Prentice HA, et al. Increases in the rates of primary and revision knee replacement are reducing: a 15-year registry study across 3 continents. Acta Orthop 2020; 91(4): 414-9.
| Crossref | Google Scholar | PubMed |
9 Jiramongkolchai P, Lander DP, Kallogjeri D, Olsen MA, Keller M, Schneider JS, et al. Trend of surgery for orbital cellulitis: An analysis of state inpatient databases. Laryngoscope 2020; 130(3): 567-74.
| Crossref | Google Scholar | PubMed |
10 Köckerling F, Hoffmann H, Mayer F, Zarras K, Reinpold W, Fortelny R, et al. What are the trends in incisional hernia repair? Real-world data over 10 years from the Herniamed registry. Hernia 2021; 25(2): 255-65.
| Crossref | Google Scholar | PubMed |
11 Pawlak M, Tulloh B, de Beaux A. Current trends in hernia surgery in NHS England. Ann R Coll Surg Engl 2020; 102(1): 25-7.
| Crossref | Google Scholar | PubMed |
12 Landes U, Bental T, Levi A, Assali A, Vaknin-Assa H, Lev EI, et al. Temporal trends in percutaneous coronary interventions thru the drug eluting stent era: Insights from 18,641 procedures performed over 12-year period. Catheter Cardiovasc Interv 2018; 92(4): E262-E70.
| Crossref | Google Scholar | PubMed |
13 Gillam MH, Pratt NL, Inacio MCS, Roughead EE, Shakib S, Nicholls SJ, et al. Heart failure after conventional metal-on-metal hip replacements. Acta Orthop 2017; 88(1): 2-9.
| Crossref | Google Scholar | PubMed |
14 Lenzer J. Medical device industry: international investigation exposes lax regulation. BMJ 2018; 363: k4997.
| Crossref | Google Scholar | PubMed |
15 von Elm E, Altman DG, Egger M, Pocock SJ, Gøtzsche PC, Vandenbroucke JP, STROBE I. The Strengthening the Reporting of Observational Studies in Epidemiology (STROBE) statement: guidelines for reporting observational studies. Lancet 2007; 370(9596): 1453-7.
| Crossref | Google Scholar | PubMed |
18 Zeileis A, Lumley T, Berger S, Graham N, Zeileis MA. Package ‘sandwich’: 3-0.03. 2021. Available at https://cran.r-project.org/web/packages/sandwich/sandwich.pdf
20 Liu YC, Wilkins M, Kim T, Malyugin B, Mehta JS. Cataracts. Lancet 2017; 390(10094): 600-12.
| Crossref | Google Scholar | PubMed |
21 Bothun ED, Cavalcante LCB, Hodge DO, Patel SV. Population-based Incidence of Intraocular Lens Exchange in Olmsted County, Minnesota. Am J Ophthalmol 2018; 187: 80-6.
| Crossref | Google Scholar | PubMed |
22 Kanthan GL, Wang JJ, Rochtchina E, Tan AG, Lee A, Chia E-M, et al. Ten-Year incidence of age-telated cataract and cataract surgery in an older Australian population: The Blue Mountains Eye Study. Ophthalmology 2008; 115(5): 808-14 e1.
| Crossref | Google Scholar | PubMed |
23 Zecchin M, Torre M, Carrani E, Sampaolo L, Ciminello E, Ortis B, et al. Seventeen-year trend (2001–2017) in pacemaker and implantable cardioverter-defibrillator utilization based on hospital discharge database data: An analysis by age groups. Eur J Intern Med 2021; 84: 38-45.
| Crossref | Google Scholar | PubMed |
24 Bradshaw PJ, Stobie P, Knuiman MW, Briffa TG, Hobbs MST. Trends in the incidence and prevalence of cardiac pacemaker insertions in an ageing population. Open Heart 2014; 1(1): e000177.
| Crossref | Google Scholar | PubMed |
25 Bamford P, Said C, Al-Omary MS, Bhagwandeen R, Boyle A. Aortic Valve Replacement Rates in Australia from 2004 to 2019. Intern Med J 2021; 53: 525-530.
| Crossref | Google Scholar |
26 Inacio MCS, Paxton EW, Graves SE, Namba RS, Nemes S. Projected increase in total knee arthroplasty in the United States - an alternative projection model. Osteoarthr Cartil 2017; 25(11): 1797-803.
| Crossref | Google Scholar | PubMed |
28 Chung AY, Strassle PD, Schlottmann F, Patti MG, Duke MC, Farrell TM. Trends in Utilization and Relative Complication Rates of Bariatric Procedures. J Gastrointest Surg 2019; 23(7): 1362-72.
| Crossref | Google Scholar | PubMed |
32 Craig A, O’Meley P, Carter P. The need for greater reporting of medical device incidents. Innovations 2019; 3: 56-63.
| Google Scholar |
33 de Steiger RN, Hallstrom BR, Lübbeke A, Paxton EW, van Steenbergen LN, Wilkinson M. Identification of implant outliers in joint replacement registries. EFORT Open Rev 2023; 8(1): 11-7.
| Crossref | Google Scholar | PubMed |
34 Williams ML, Hutchinson AG, Oh DD, Young CJ. Trends in Australian inguinal hernia repair rates: a 15-year population study. ANZ J Surg 2020; 90(11): 2242-7.
| Crossref | Google Scholar | PubMed |


