

Life in the big smoke: terrestrial vertebrate assemblages and their drivers along an urbanisation gradient in Sydney, Australia
Martín Boer-Cueva A * , Rhys Cairncross A , Mathew S. Crowther A , Patrick B. Finnerty A , Angela F. Raña A , Peter B. Banks A and Thomas M. Newsome A
A
Abstract
Urban areas are rapidly expanding, increasing anthropogenic pressure on global biodiversity. There are many threats associated with urbanisation, such as habitat loss and the spread of invasive species. Thus, to effectively manage urban greenspaces for native species, we need to understand species assemblages, and the factors that influence their diversity.
We assessed how assemblages of terrestrial vertebrate species differ across urbanisation levels in northern Sydney, Australia, and whether habitat characteristics influenced them. We also investigated the role of invasive species in these areas by comparing daily activity patterns between invasive and native species.
Nine forest (dry sclerophyll) patches, surrounded by three urbanisation levels (high-urban, mid-urban and low-urban), each with five motion-sensor cameras, were used to survey terrestrial fauna in northern Sydney from May to July 2023. Five vegetation variables and eight spatial variables were also recorded at each patch.
There were differences in terrestrial vertebrate assemblages across the three urbanisation levels, with more invasive species, including red foxes (Vulpes vulpes) and black rats (Rattus rattus), in high-urban areas. We also found native species assemblages (particularly superb lyrebirds, Menura novaehollandiae; long-nosed bandicoots, Perameles nasuta; and bush rats, Rattus fuscipes) to differ with tall and low shrub cover, whereas invasive species did not differ. Furthermore, mean activity peaks did not differ between red foxes and a critical weight range (CWR) mammal was recorded in high-urban sites. Last, we observed a significant negative relationship between invasive species richness and native species diversity.
Urbanisation has a strong effect on the assemblages, activity and interactions of native and invasive terrestrial vertebrate species in Sydney. Whereas remnant patches may support native species, the prevalence of invasive fauna in areas that are more highly urbanised may compound other factors affecting biodiversity.
This study has provided a baseline understanding of urban terrestrial vertebrate assemblages in northern Sydney, and has shown that mid-urban areas may be good candidates for reintroduction sites. Our findings can be used to guide management actions to support the conservation or re-establishment of native species in the region or other urban areas.
Keywords: biotic homogenisation, diel activity, feral cat, invasive species, invasive species management, red fox, species assemblages, urbanisation.
Introduction
Urbanisation has profound and enduring effects on land, often resulting in significant and permanent alterations to green spaces (Seto et al. 2012). As urban areas continue to expand, the loss and fragmentation of viable habitats intensify, contributing substantially to the alarming decline in Earth’s biodiversity (McKinney 2002). Concerningly, these negative effects are predicted to worsen, because by 2050, nearly 70% of the world’s human population is likely to live in urban areas, with this percentage being 20% greater than today (United Nations 2018). This trajectory underscores the urgency of addressing the escalating environmental impacts associated with urban growth. As urban sprawl extends well beyond city centres, the repercussions of urbanisation on biodiversity reverberate through neighbouring ecosystems (Rees 1997). The expansion of urban footprints on ecosystems often leads to a matrix of grey, man-made infrastructure, such as buildings and roads, with scattered green spaces including remnant bushland, parks and backyards in between (Rees 1997; Garden et al. 2006). Overall, such landscape modifications can greatly affect plant and animal population dynamics, and as a consequence, the functioning of ecosystems (Chapin et al. 1997; Concepción et al. 2015).
Urban areas have also been recognised as spaces that can support invasive species, attributed not only to deliberate human introductions but also to the adaptability of these species to human-altered landscapes (Shochat et al. 2010; Santana Marques et al. 2020). Invasive species tend to be habitat and diet generalists, allowing them to benefit from environments that are relatively heterogenous, whereas ecological specialists are species that benefit from homogenous environments (Devictor et al. 2008). As a result, there tends to be a greater abundance and richness of invasive species in urban areas than non-urban areas (Kowarik 2011; Gaertner et al. 2016).
As the presence of invasive species can lead to major decreases in the richness of native species (Mollot et al. 2017), they are now recognised globally as a major driver of biodiversity loss (McKinney 2006; Mollot et al. 2017; Legge et al. 2023). This is especially the case in Australia, where invasive species have caused, and continue to contribute to, the decline or extinction of many native species (Newbold et al. 2015; Legge et al. 2023). In particular, the red fox (Vulpes vulpes) and feral cat (Felis catus) have been implicated in the demise of critical weight range (CWR) mammals in Australia (Burbidge and McKenzie 1989; Woinarski et al. 2015) as well as having significant negative effects on other species (Stobo-Wilson et al. 2021; Legge et al. 2023). CWR mammals are species within the weight range of 35 g−5.5 kg that have been observed to be most vulnerable to extinction in Australia (Burbidge and McKenzie 1989). Both cats and red foxes thrive in urban areas, taking advantage of both human-provided foods and wild prey (Bateman and Fleming 2012; Fleming and Crawford 2020). Red foxes, in particular, have been shown to behave more boldly, grow larger and live in higher densities than do their peri-urban or natural counterparts (Bateman and Fleming 2012; Gil-Fernández et al. 2020). Although red foxes are actively controlled in other parts of Australia, in urban areas poison-baiting and other control measures are largely avoided because of the risk baiting poses to humans and pets, potentially aiding their persistence in urban environments (Marks et al. 1996).
Urbanisation may also affect ecosystem dynamics in ways that may be harder to notice than is biodiversity loss. Alongside direct habitat destruction, urbanisation is associated with a multitude of other threats such as reducing connectivity to retained areas of native vegetation as well as other processes contributing to the degradation of these habitats, for instance, changes in habitat condition (McKinney 2002). Yet, little is known about how these threatening processes associated with urbanisation interact with the presence of invasive species to affect urban biodiversity together. Doherty et al. (2015) discussed the synergistic and additive interactions of invasive species and other threats on native species, such as over-grazing and altered fire regimes in Australia. For example, increases in the frequency of high-intensity burns can cause direct mortality and reduce resources for native species while facilitating increased predation by invasive species (Smith et al. 2012; McGregor et al. 2014). Similar research focusing on environmental variables unique to urban spaces needs more exploration. Indeed, the loss of habitat and connectivity, such as caused by urban sprawl, may amplify the effects of invasive species in isolation (Hagen et al. 2012; Doherty et al. 2015).
Another type of ecosystem dynamic that may be influenced by urbanisation, but is more difficult to quantify, is temporal patterns and diel activity of fauna, i.e. the pattern of activity of organisms over 24 h of time. Although diel activity of fauna has been found to shift between urban and non-urban populations (Łopucki and Kiersztyn 2020; Beliniak et al. 2021; Gallo et al. 2022), these shifts can be highly case-dependent (Gallo et al. 2022). In some ecosystems, urbanisation may lead animals to be more active when anthropogenic activity is lowest, such as at midnight (Gaynor et al. 2018). Additionally, predators in urban areas may rely less on hunting prey because of the availability of anthropogenic food sources, which could decrease their reliance on, and overlap with, the temporal patterns of prey species (i.e. less reliance on prey temporal patterns and behaviour, because fewer prey are hunted due to more anthropogenic food sources, which are easier to access) (Bateman and Fleming 2012; Petroelje et al. 2019). For example, red foxes in parts of India consume less wild prey in urban areas than in rural or natural areas because of human subsidies (Reshamwala et al. 2018). Sogliani et al. (2021) suggested that when predators shift activity away from human activity peaks, some prey species may then shift their activity patterns to coincide with human activity peaks, to avoid predation. Hence, if urbanisation changes the temporal activity patterns of species, it may also alter the co-existence and dynamics of species living within these urban areas.
Despite being densely populated, some urban areas are still relatively understudied and local biodiversity research is critical to developing and applying targeted management solutions to specific urban green spaces (Niemelä 2014). In Sydney, Australia’s oldest and largest city, there is emerging research on urban biodiversity, but a large portion of this focuses on insect, avian, bat and herpetofaunal assemblages (Gibb and Hochuli 2002; White and Burgin 2004; Major and Parsons 2010; Threlfall et al. 2012; Gonsalves and Law 2018; Smith and Smith 2019). Understanding urbanisation effects on terrestrial vertebrate species is a vital next step, because these species provide key ecosystem services in the environments that they inhabit, from pollination and seed dispersal to population control and carrion removal (Willson 1993; Carthew and Goldingay 1997; Colman et al. 2014; Cunningham et al. 2018). To adequately manage and protect terrestrial vertebrates in the Sydney basin, we must first understand the species assemblages occupying different urban areas. Additionally, understanding how urbanisation in conjunction with associated effects, such as invasive fauna activity, affects these species is important information for urban biodiversity more broadly.
In this study, we investigated terrestrial vertebrate assemblages (with a particular focus on mammals) of Greater Sydney, including ground-dwelling native fauna and invasive predators, along an urbanisation gradient. Our study focused on four research predictions: (1) on the basis of previous studies (Saito and Koike 2013; Pal et al. 2019), we expected greater activity of invasive species in high-urban areas and more native species activity in low-urban areas; (2) habitat characteristics will significantly influence community assemblages, because habitat is likely to change across urbanisation levels (Garden et al. 2007); (3) higher invasive species richness will be associated with lower native species diversity across the urban gradient (Mollot et al. 2017); and (4) that there will be significant differences between the temporal activity peaks of CWR mammals and red foxes in high-urban sites (Bateman and Fleming 2012; Lowry et al. 2013; Petroelje et al. 2019). Urbanisation gradients have been utilised extensively in ecology to study differences in ecological processes or assemblages (McDonnell and Pickett 1990; Saito and Koike 2013; Choate et al. 2018; Malkinson et al. 2018; Pal et al. 2019). Although analysing ecological gradients does carry some limitations, especially on larger spatial scales, such as representing gradients other than the one of study, controlling for variables such as habitat and other potential confounders can show nuanced and complex relationships (e.g. Banko et al. 2002). Thus, gradients provide a simple, yet effective, method to analyse differences in biodiversity in response to habitat changes associated with human disturbance (McKinney 2002). Despite their widespread use for understanding general assemblage differences, urbanisation gradients have been applied sparingly to the ecology and behaviour of invasive species (Saito and Koike 2013; Melliger et al. 2018; Mao et al. 2019; Pal et al. 2019; Pithon et al. 2021). Understanding how different levels of urbanisation interact with changes in habitat availability and human activity, alongside the flow-on effects to native species, is critical to efficiently manage and protect biodiversity (Tait et al. 2005; Gaynor et al. 2018).
Materials and methods
Study area
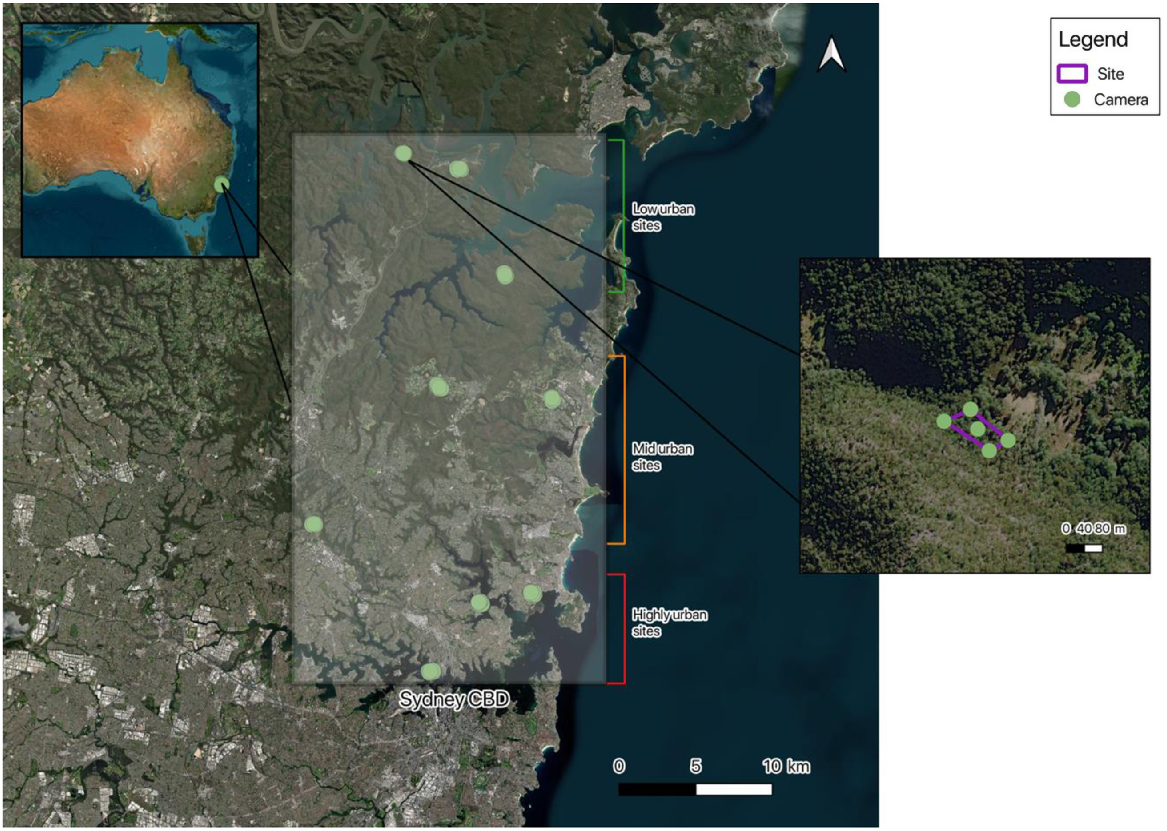
Our study was conducted in northern Sydney, Australia, within seven local government zones spanning an area of ~904 km2 (Fig. 1). The study area is a highly developed and modified space, with over 760,000 residents, yet it also contains large, remnant bushland and green spaces. The area varies in urbanisation intensity; the southern parts are highly modified and urbanised, with fewer large, intact green spaces, whereas the northern parts (further away from the Sydney Central Business District, CBD) have lower housing densities and larger, protected, green spaces. The majority of remnant bushland areas are covered by the Sydney Coastal Dry Sclerophyll Forests vegetation type (Keith 2004). Elevation in the study area ranges from sea level to ~150 m above sea level and the climate is classified as temperate, with warm summers and mild winters (Bureau of Meteorology, see http://www.bom.gov.au/).
Site selection
To guide site selection, we used the NSW State Vegetation Type Map at 5 m spatial resolution (NSW Government 2022). To minimise potential differences in fauna composition or activity owing to vegetation type, only sites with dry sclerophyll forest vegetation were selected. Dry sclerophyll forest is prevalent across the Sydney bioregion and is dominated by an overstorey of Angophora costata, Corymbia gummifera, alongside a variety of other Eucalyptus species.
Nine sites, representing three levels of urbanisation, were identified using the above-mentioned vegetation map. Each site consisted of a single homogeneous patch of dry sclerophyll forest as delineated on the vegetation map. The nine sites were selected in a three-step process, as follows:
First, the vegetation map was resampled to a spatial resolution of 10 m by using the nearest-neighbour interpolation method, and then reclassified into the following two binary maps: (i) forest or non-forest vegetation and (ii) dry sclerophyll forest and other vegetation types. Next, connected patches of forest and dry sclerophyll forest were identified and labelled using the ‘patches’ function in the R package ‘terra’ (ver. 1.8-15, see https://cran.r-project.org/package=terra). The following landscape ecological patch metrics were then calculated to characterise patch geometry and the nature of the landscape matrix: (a) the area of all forest and dry sclerophyll forest patches, and for each dry sclerophyll forest patch, (b) the percentage of native vegetation in a 200 m buffer zone surrounding each patch, (c) the area of the greater forest patch in which the dry sclerophyll forest patch is embedded or connected to, (d) the edge contrast, or how different the land cover type is between the dry sclerophyll forest patch and the adjacent land assessed as a weighted average along the patch perimeter (0 = land cover type in patch and matrix is identical, 1 = land cover type in patch and matrix are similar, e.g. forest and park land, 2 = land cover type in patch and matrix are dissimilar, e.g. forest and residential green space, 3 = land cover type in patch and matrix are almost entirely dissimilar, e.g. forest and urban land cover), (e) the shortest Euclidean distance from the perimeter of the selected dry sclerophyll forest patch to the nearest other patch of native vegetation (note that this distance is zero for both low- and mid-urban patches, because both types of patches were defined to have at least part of their perimeter covered by native vegetation), (f) the Euclidean distance from the geometric centroid of the dry sclerophyll patch to the nearest paved road, (g) the shortest Euclidean distance from the patch boundary to the Sydney CBD (Tables 1, 2). These patch metrics were found to provide useful characterisations of heterogeneous landscapes in terms of vertebrate fauna habitat (Garden et al. 2007, 2010; Saito and Koike 2013; Bryant et al. 2017; Tee et al. 2018; Zungu et al. 2020).
The patch metrics were used to classify the dry sclerophyll forest patches in the 4–8 ha size range into three levels of urbanisation (high-urban, mid-urban and low-urban), with criteria outlined in Table 1. The most urbanised patches are located in a matrix of low forest cover, with non-native vegetation dominating in the buffer zone, strong edge contrast, and relative short distance between the patch centroid and paved roads or Sydney CBD. The least urbanised patches of dry sclerophyll forest are embedded in larger connected patches of forest vegetation, have buffer zones dominated by native vegetation, low edge contrast and relatively large distances between the patch centroid and paved roads or Sydney CBD.
After a field reconnaissance, a selection of three replicate sites in each urbanisation class was made in consultation with local councils, and taking into account tenancy issues and vehicle access. Sample areas were established in each of the selected sites as described in the next section (Fig. 1).
| Patch metric | Urbanisation level | |||
|---|---|---|---|---|
| Highly urban | Mid-urban | Low-urban | ||
| Area of greater forest patch forming matrix for the selected DSF patch (ha) | ≤10 | 90–500 | ≥500 | |
| Percentage of native vegetation in a 200 m buffer zone (%) | <20 | 40–60 | >80 | |
| Edge contrast (0 = indistinctive contrast, 1 = low contrast, 2 = moderate contrast, 3 = severe contrast) | 3 | 2 | 0 | |
| Euclidean distance from the patch boundary to the nearest other patch of native vegetation (m) | ≥500 | 0 | 0 | |
| Euclidean distance from the geometric patch centroid to the nearest paved road (m) | ≤100 | 100–200 | ≥300 | |
| Euclidean distance from the patch boundary to the Sydney CBD (km) | ≤10 | 10–20 | ≥20 | |
| Variable | Description of variable | How and where it was recorded | Value | Application | Supporting reference | |
|---|---|---|---|---|---|---|
| Ground cover complexity | Number of different types of ground cover (leaf litter, rock, vegetation and woody debris) | Every 5 m along a 20 m transect using 1 × 1 m quadrat | Value (score of 4) | Mean for each patch | Garden et al. (2007) and Bryant et al. (2017) | |
| Fallen logs | Number of fallen logs (>15 cm diameter) | Total count within 1 m of each 20 m transect | Value (count) | Total for each patch | Garden et al. (2006), Villaseñor et al. (2015) and Tee et al. (2018) | |
| Low tree cover | Amount of cover by low trees (5–10 m) | LiDAR data (2020) (10 points/m2 density) – 50 m radius surrounding each camera | Percentage | Mean for each patch | Garden et al. (2007), Garden et al. (2010) and Bryant et al. (2017) | |
| Tall shrub cover | Amount of cover by tall shrubs (2–5 m) | LiDAR data (2020) (10 points/m2 density) – 50 m radius surrounding each camera | Percentage | Mean for each patch | Garden et al. (2007), Holland and Bennett (2009), Garden et al. (2010) and Bryant et al. (2017) | |
| Low shrub cover | Amount of cover by low shrubs (0.5–2 m) | LiDAR data (2020) (10 points/m2 density) – 50 m radius surrounding each camera | Percentage | Mean for each patch | Garden et al. (2007), Holland and Bennett (2009), Garden et al. (2010) and Bryant et al. (2017) | |
| Euclidean distance from the geometric patch centroid to the nearest paved road | Distance away from the paved road | Measured from central camera to closest paved road using QGIS (ver. 3.10, see http://test.qgis.org/html/en/site/forusers/download.html) | Value (m) | Value for each patch | Tee et al. (2018), Bryant et al. (2017) and Lhoest et al. (2020) | |
| Percentage of native vegetation surrounding patch | Percentage of native vegetation in a 200 m buffer surrounding each patch | Measured using QGIS | Value (percentage) | Value for each patch | Saito and Koike (2013), Bryant et al. (2017) and Zungu et al. (2020) | |
| Last recorded fire | The year of most recent fire recorded at each patch | Data from NSW National Parks and Wildlife Swevice (NPWS) fire history | Value (years) | Value for each patch | Garden et al. (2007) | |
| Total area of forest cover in patch matrix | The total size of the greater forest that the sampled patch is within | Measured using QGIS | Value (ha) | Value for each patch | Garden et al. (2007) and Garden et al. (2010) | |
| Euclidean distance from the patch boundary to the nearest other patch of native vegetation | Distance (metres) to the closest patch of native vegetation, greater than 0.5 ha in size | Measured using QGIS, following the shortest possible distance over land | Value (m) | Value for each patch | Garden et al. (2007), Garden et al. (2010) and Bryant et al. (2017) | |
| Edge contrast | Contrast between patch and land adjacent | Measured using QGIS | Value (0 = indistinctive contrast, 1 = low contrast, 2 = moderate contrast, 3 = severe contrast) | Value for each patch | Zungu et al. (2020) | |
| Euclidean distance from the patch boundary to the Sydney CBD | Distance from the centre of each patch to the Sydney CBD | Measured using QGIS | Value (km) | Value for each patch | Zungu et al. (2020) |
Field observations
To survey ground-dwelling fauna in the selected dry sclerophyll forest patches, wildlife cameras were deployed for two 1-month periods from May to July 2023. Motion-triggered camera traps have been shown to efficiently detect a broad range of species (Wearn and Glover-Kapfer 2019). Five camera traps were deployed in each of the nine selected dry sclerophyll forest patches. The cameras were set-up at the four corners (Browning Dark Ops Pro) and centre (Reconyx HyperFire 2) of a rectangular sample area covering the core of the patch, with a minimum distance of 50 m between cameras. The size (mean ± s.e.) of the sample area covered by the five cameras was 1.6 0.17 ha (range: 0.28–2.72 ha). Each camera was baited with universal mammal bait lure (oats, peanut butter and honey) and placed in a tea strainer (5 cm diameter) secured to the ground by using a tent peg, so that the lure could be smelt but not taken, ~1 m in front of the camera. This bait at each camera was replaced once during sampling, 2 weeks after the first deployment.
The second month of sampling involved using a meat base lure to attract more predator species. Only one camera (Reconyx HyperFire 2) was used per site for this sampling period (i.e. the camera at the centre of the sample area). Chicken necks were placed in a plastic compartment that did not allow the lure to be taken, only smelt (Supplementary Fig. S10). Each lure was attached to a tree or log, ~30 cm off the ground. The lure was not refreshed for this sampling period. For both months of sampling, cameras were placed at knee height (~50 cm off the ground), attached to trees ~1–2 m away from the bait and programmed with a ‘rapid-fire’ mode (10 photos), capturing continuous photographs when triggered, with no waiting period. The Reconyx (central) cameras were set to ‘medium/high’ trigger sensitivity. All cameras were angled and centred towards the bait. We considered the bait refreshment and change in bait type as a new sampling interval, because lure age can influence the detection of animals at camera traps (Dart et al. 2023). Accordingly, each site had three sampling intervals.
Habitat characteristics
Habitat quality for ground-dwelling fauna was assessed using a total of five variables that characterise the vegetation structure and groundcover for the sample area covered by the five cameras in each site (Table 2). These variables were chosen following previous studies assessing how terrestrial vertebrate communities were influenced by habitat characteristics (Barnett et al. 1978; Garden et al. 2006; Holland and Bennett 2009; Garden et al. 2010; Villaseñor et al. 2015; Tee et al. 2018; Zungu et al. 2020). At each sample area, two 20 m transects were established (from the central camera), each in the direction of the outer sides of the sample area. The orientation of both transects was chosen on the basis of accessibility of the area. At every 5 m along the transect, a 1 × 1 m quadrat (in total four quadrats per transect) was placed to record ground cover complexity (assessed visually). Also, along each transect, the number of fallen logs within 1 m of each side was recorded and averaged to obtain an estimate of the density of fallen logs in each site. Ground cover complexity recorded in the 10 quadrats was averaged to obtain an estimate for the sample area.
Analysis
All camera-trap images were processed and analysed using digiKam (ver. 380, DigiKam Team, see https://www.digikam.org/). Animals were identified to species; we then lumped all small bird species together into a ‘small bird’ group to facilitate a more robust analysis. Analysis of image metadata was undertaken in R (ver. 4.0.4, R Foundation for Statistical Computing, Vienna, Austria, see https://www.r-project.org/) using the ‘camtrapR’ package (ver. 2.3.0, see https://github.com/jniedballa/camtrapR). We used a histogram of time intervals between successive images of all animal detections to determine the most appropriate temporal definition of independent events. One-minute intervals were chosen to classify our event periods. Therefore, all animal detections within 1 min of each other were considered part of the same event.
Data from all cameras in each site were grouped together for each sampling interval. To determine whether the assemblages (composition of communities and activity) of species differed among urbanisation levels (Prediction 1), the data were first transformed using the fourth root of the species activity data. A Bray–Curtis dissimilarity matrix was then created using the ‘vegan’ package (ver. 2.6-10, J. Oksanen et al., see https://cran.r-project.org/package=vegan/). This method does not use joint-absences to link sites, which may have occurred since the data were highly inflated by many 0 values. The matrix was ordinated using non-metric multidimensional scaling (nMDS). This allowed for a visual comparison of the species assemblages at high-urban, mid-urban and low-urban sites in multivariate space. The nMDS stress value was checked to ensure the ordination was a good representation of the data. nMDS values greater than 0.2 are considered a poor fit (Dexter et al. 2018), accordingly we ensured that the stress value was less than 0.2.
A permutational multivariate ANOVA (PERMANOVA), with 999 permutations, was then undertaken to compare the assemblages of species across urban levels, using the ‘adonis’ function within the ‘vegan’ package (ver. 2.6-10). We then used the ‘mvabund’ package (ver. 4.2.1, see https://cran.r-project.org/package=mvabund) in R, a distance-based approach that is considered to outperform other post hoc analysis methods of community data (Wang et al. 2012; Carlos-Júnior et al. 2020), to specifically identify which species were driving changes in community structure. The ‘manyglm’ function within the ‘mvabund’ package was also used to determine whether there was a relationship between spatial and habitat variables and species assemblages (Prediction 2). The ‘manyglm’ function fits component GLMs that only consider one variable at a time, first modelling the influence of each variable on overall species assemblage, and then, by pairwise tests, on individual species (Wang et al. 2012). We applied a negative binomial distribution within the ‘manyglm’ function as data were over-dispersed. Where differences were found, we undertook pairwise ANOVA with Bonferroni-adjusted P-values to assess which species were driving these differences.
Linear regression was used to assess the relationship between native species diversity and invasive species richness across the three urbanisation levels (Prediction 3). The Shannon–Wiener diversity index was used to calculate the diversity of native species at each site, for each sampling interval. This index was selected because it gives more weight to less common species, which are still important components of the community of species studied. Meanwhile, the richness of invasive species at each site, for each sampling period, was recorded. Species richness was used to measure invasive species, rather than Shannon–Wiener, because there was a smaller number of invasive than native species. We checked the residuals of the regression model to determine fit.
Last, the time stamp for the beginning of each fox or long-nosed bandicoot (Perameles nasuta) event in high-urban sites was noted and used to compare mean activity peaks (Prediction 4). Because red foxes were detected in relatively low numbers at low- and mid-urban sites, only high-urban sites were used for temporal analysis. Furthermore, as all critical weight range mammals except for P. nasuta were detected at low numbers across high-urban sites, P. nasuta was the only CWR mammal included in temporal analysis (Mcdonald et al. 2009). CWR mammals were chosen as a focal group because they are historically the most susceptible to population declines and extinction and are hunted by invasive predators (Smith and Quin 1996; Cardillo and Bromham 2001). All time stamps were fit to a 24-h circular distribution by using the ‘circular’ package (ver. 0.5-1, C. Agostinelli and U. Lund, see https://cran.r-project.org/package=circular). The mean activity peaks for foxes and long-nosed bandicoots were compared using the Watson’s two-sample test of homogeneity, to assess whether there was a significant difference in temporal activity between the two species. The 95% confidence intervals were calculated for both mean activity peaks by bootstrapping over 1000 replicates.
Results
The 45 camera traps installed at nine sites recorded 197,659 images over a period of 60 days, which were classified into 5343 events, capturing 22 species. Of these 22 species, 15 species met our focus of being terrestrial vertebrates. The species recorded most frequently were bush rats (1701 events), black rats (1578 events) and swamp wallabies (Wallabia bicolor) (852 events) (Table 3). The swamp wallaby and long-nosed bandicoot were present most commonly (at eight of the nine sites). Invasive predators (red foxes, domestic cats and domestic dogs, Canis familiaris) were detected at seven of the nine sites (none was detected in one of the mid-urban sites and one was detected low-urban site) (Table 3). In total, 14 of the recorded 15 species are listed as Least Concern by the IUCN; however, the eastern pygmy possum (Cercartetus nanus) is listed as Vulnerable in New South Wales (NSW).
| Species recorded | Presence and number of events of species at urbanisation level patches | ||||
|---|---|---|---|---|---|
| Low-urban | Mid-urban | High-urban | Total | ||
| Small bird species | 58 | 4 | 77 | 139 (7/9) | |
| Black rat (Rattus rattus)A | – | 125 | 1453 | 1578 (5/9) | |
| Brown antechinus (Antechinus stuartii) | 45 | 55 | – | 100 (5/9) | |
| Brush turkey (Alectura lathami) | 6 | 57 | 308 | 371 (7/9) | |
| Bush rat (Rattus fuscipes) | 1594 | 107 | – | 1701 (5/9) | |
| Common brushtail possum (Trichosurus vulpecula) | 1 | 108 | 55 | 164 (5/9) | |
| Domestic or feral cat (Felis catus)A | – | – | 1 | 1 (1/9) | |
| Domestic dog (Canis lupus familiaris)A | – | – | 3 | 3 (2/9) | |
| Eastern pygmy possum (Cercartetus nanus) | 6 | – | – | 6 (2/9) | |
| European rabbit (Oryctolagus cuniculus)A | – | 5 | – | 5 (1/9) | |
| Long-nosed bandicoot (Perameles nasuta) | 42 | 48 | 217 | 307 (8/9) | |
| Red fox (Vulpes vulpes)A | 6 | 12 | 30 | 48 (7/9) | |
| Ringtail possum (Pseudocheirus peregrinus) | – | – | 38 | 38 (3/9) | |
| Short-beaked echidna (Tachyglossus aculeatus) | 2 | – | 3 | 5 (3/9) | |
| Superb lyrebird (Menura novaehollandiae) | 9 | 12 | – | 21 (3/9) | |
| Swamp wallaby (Wallabia bicolor) | 423 | 414 | 15 | 852 (8/9) | |
Prediction 1: species assemblages differ across urbanisation levels
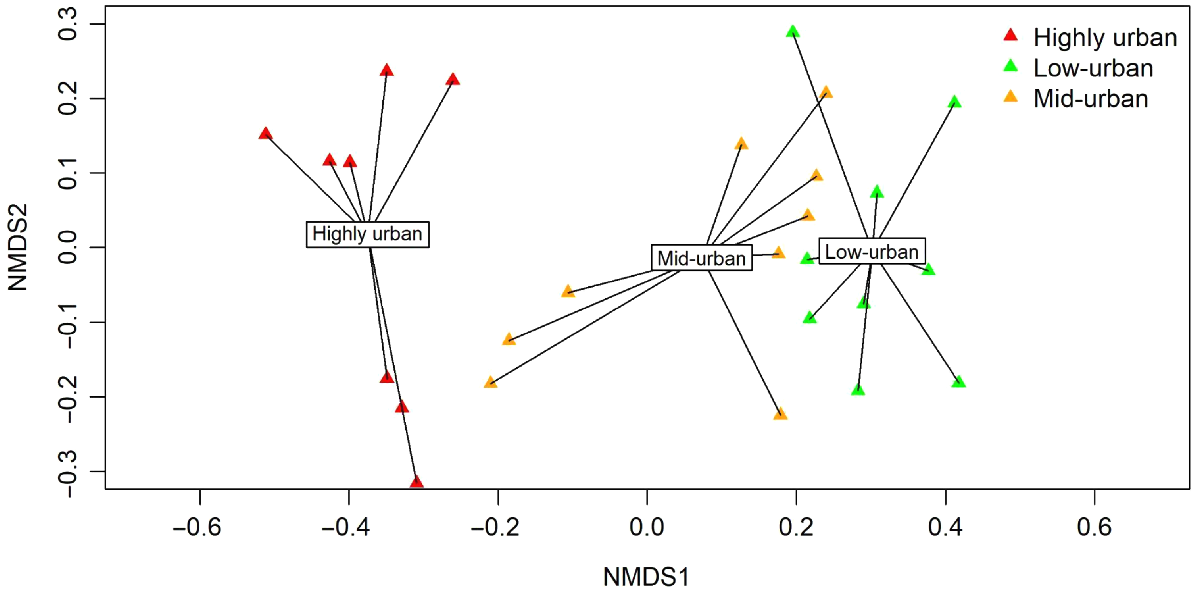
There was a clear difference in species assemblages across the three urbanisation levels (Fig. 2) (P < 0.001). Pairwise tests showed that there were differences in assemblages between high-urban and mid-urban, high-urban and low-urban and low-urban and mid-urban sites (Table S2). Species that drove these assemblage differences were the brown antechinus (Antechinus stuartii) (most frequently recorded in low-urban sites, P = 0.013, Dev = 14.373, Table 3), black rat (most frequently recorded in high-urban sites, P < 0.001, Dev = 25.163, Table 3), bush rat (most frequently recorded in low-urban sites, P < 0.001, Dev = 37.307, Table 3), Australian-brush turkey (Alectura lathami) (most frequently recorded in high-urban sites, P = 0.036, Dev = 12.731, Table 3), ringtail possum (most frequently recorded in high-urban sites, P = 0.002, Dev = 18.391, Table 3) and the swamp wallaby (most frequently recorded in low-urban sites, P < 0.001, Dev = 29.314, Table 3) (Table S4).
nMDS plot of species assemblages across the three urbanisation levels. Sites were grouped according to their respective level of urbanisation. Spider plots indicate the position of each site within multivariate space across the three urban levels. Joins for each site are labelled and represent group centroids. Stress = 0.118.
Prediction 2: habitat characteristics influence on species assemblages
Analysis of the effects of habitat characteristics on species assemblages across all urbanisation levels indicated that low tree cover, ground cover complexity and number of logs were of significant influence on the presence and activity of certain species (Table S3). Low tree cover had a significant negative relationship with the frequency of brown antechinus (P = 0.007, Dev = 18.045), Australian brush-turkey (P = 0.036, Dev = 12.863) and bush rat detection (P = 0.045, Dev = 11.109) (Table S3). Black rat detection showed a significant hump-shaped relationship with low tree cover (P = 0.007, Dev = 21.325) that peaked at 30% cover. Ground cover complexity had a significant negative relationship for long-nosed bandicoot detections (P = 0.009, Dev = 17.193), yet a significant positive relationship for bush rats (P = 0.001, Dev = 25.076). Meanwhile, analysis of the vegetational and spatial factors recorded at each site within each urbanisation level showed that none of the recorded factors was of significant influence on any species in low-urban or high-urban sites (Tables S5, S7). However, in mid-urban sites, low shrub cover had a significant negative relationship with bush rats (P = 0.044, Dev = 14.638) (Table S6) and tall shrub cover had a significant negative relationship with superb lyrebirds (P = 0.027, Dev = 14.932). Meanwhile, tall shrub cover had a significant positive relationship with long-nosed bandicoots (P = 0.042, Dev = 10.750) (Table S6).
Prediction 3: native species diversity and invasive species richness
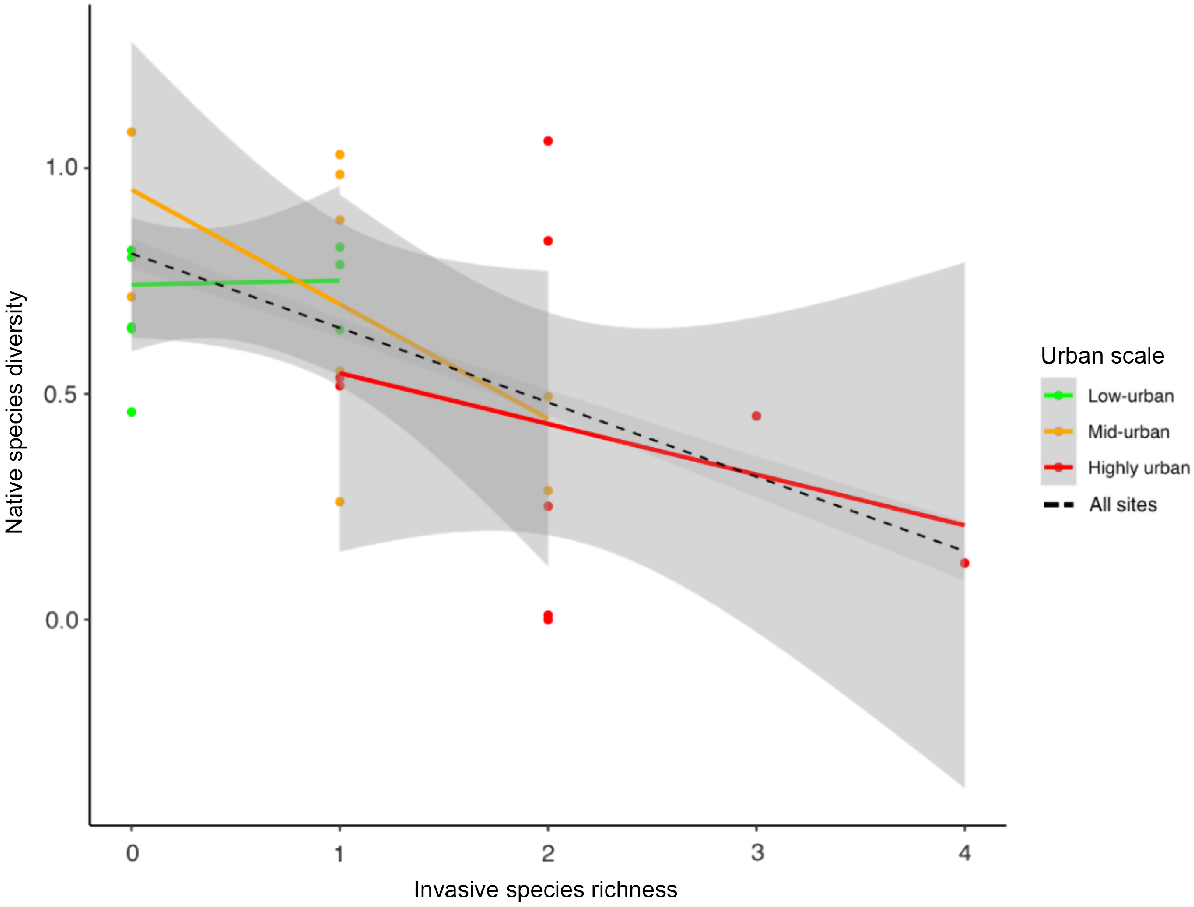
There was a significant negative relationship between invasive species richness and native species diversity (Shannon–Wiener index) across all three urbanisation levels (P = 0.005) (Fig. 3, Table S1). This trend was strongest in mid-urban and high-urban sites, whereas in low-urban sites, there was no noticeable trend (Fig. 3).
Linear regression relationship between native species diversity and invasive species richness across all urbanisation levels. Grey-shaded area represents the standard error for the lines of best fit. Each line depicts the trend within each urbanisation level, with the regression line across all levels shown in black. Across all: P = 0.005, R2 = 0.251.
Prediction 4: temporal activity of CWR mammals and red foxes
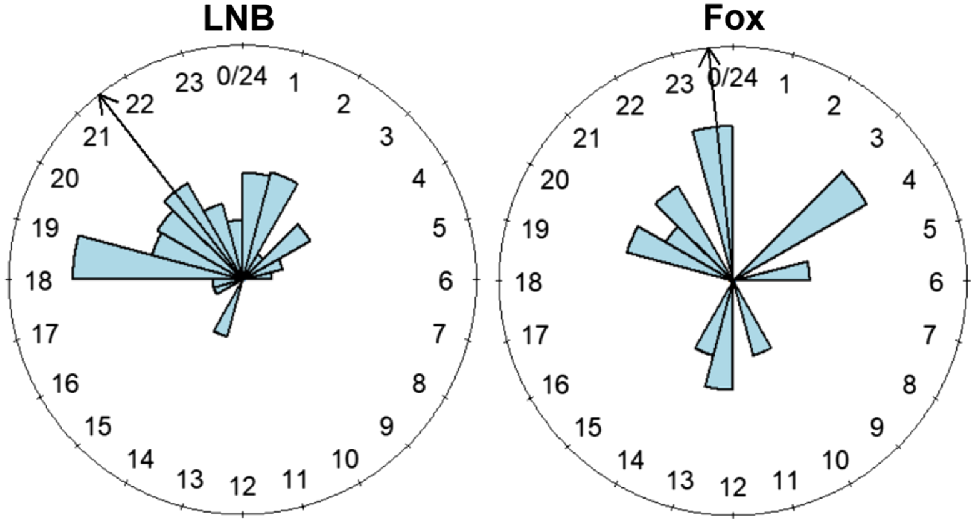
In high-urban sites, the mean temporal activity peak (24 h clock and 95% confidence intervals) for long-nosed bandicoots was 2 h 7 min earlier (21:28 hours, 20:50 hours to 22:13 hours) than that for red foxes (23:35 hours, 15:31 hours to 04:42 hours) and not significantly different (U2 = 0.1405, P > 0.05) (Fig. 4).
Discussion
There were clear differences in terrestrial vertebrate species assemblages across the urbanisation levels we assessed, and evidence of more invasive species in high-urban sites and more native species in low-urban sites, supporting Prediction 1. These differences were driven by differences in black rats, common ringtail possums and Australian brush-turkeys which were most active in high-urban sites, whereas brown antechinuses, bush rats and swamp wallabies were much more active in mid- and low-urban sites (Table 3). From the spatial and vegetational characteristics measured at each site, Prediction 2 was partially supported; low tree cover and groundcover complexity were drivers of the presence and relative abundance of some species across all urbanisation levels (Table S3). Within each urbanisation level, habitat characteristics were significant only at mid-urban sites where tall shrub cover and low shrub cover respectively, was of significant influence to long-nosed bandicoots, superb lyrebirds and bush rats (Table S5). In contrast, no vegetational characteristics were of significant influence on species assemblages within low-urban or high-urban sites. A significant negative relationship was observed between invasive species richness and native species diversity across all urbanisation levels, and especially in mid-urban and high-urban sites, supporting Prediction 3. Finally, mean activity peaks for red foxes were not significantly different from those of long-nosed bandicoots in high-urban sites (Fig. 4), rejecting Prediction 4. Together, these findings provide insights into the interacting processes that shape species communities in urban areas. The discernible pattern suggests a prevalence of invasive species in high-urbanised areas (both in species numbers and abundance), whereas native species are more prevalent in low-urban areas.
Species assemblages and diversity across urbanisation gradients
The assemblage differences found within our study suggests a shift towards biotic homogenisation as the level of urbanisation increases (Smart et al. 2006), in which assemblages became more similar by increased presence of invasive species rather than native ones. This pattern of homogenisation by increases in invasive species is consistent with many other studies (van Rensburg et al. 2009; Łopucki et al. 2013; Saito and Koike 2013; Sol et al. 2020). Moreover, in high-urban sites, we found there to be a greater diversity of invasive species than in low-urban sites. Yet, some native species are able to take advantage of urban areas and, as a result, live in higher densities than what would occur in natural settings, classifying them as urbanophile or anthropophile species (McKinney 2006). In our study, these species were the Australian brush-turkey, long-nosed bandicoot and common ringtail possum. This aligns with previous research that showed that these native species can thrive in urban areas, or at least forage in disturbed spaces (Chambers and Dickman 2002; Hughes and Banks 2011; Russell et al. 2011; Hall et al. 2020; Taylor et al. 2023). The persistence of urbanophile species in urban habitats may partly be attributed to their generalist habitat and diet requirements, allowing them to exploit a wider range of resources than do specialists (McKinney 2006; Baker and Harris 2007).
Our results also support the prediction that areas with greater invasive species richness have lower native species diversity. Specifically, we recorded 10 species that fit within our focal group of terrestrial vertebrates, at each of the three urbanisation levels sampled; however, in high-urban sites, 4 of the 10 species were invasive, whereas in low-urban sites, only 1 of the 10 was invasive. A higher number of invasive species in high-urban areas could negatively affect native species abundance, and possibly lead to the local extinction of some native biota in high-urban areas (Bradley et al. 2019). Indeed, a global meta-analysis by Mollot et al. (2017) showed that, on average, native species richness declined by 27% when an invasive predator species was introduced into an area. In our study, not only was the richness of invasive species higher in high-urban areas, but they showed greater activity levels as well. Surprisingly though, there were fewer cat detections in the high-urban sites than expected. However, it is important to note that invasive predators such as cats and red foxes can be highly cryptic and hard to detect and, therefore, there is a possibility that our detections of invasive species may not fully represent the extent of their activity (Stokeld et al. 2015; Legge et al. 2017).
Causes for differences in species assemblages across the urbanisation gradient may be affected by a combination of other interacting effects (Shochat et al. 2010; Theodorou 2022). For example, we found that black rats were more common in urban areas than were bush rats, which is consistent with the commensal nature of black rats (Aplin et al. 2003). However, a recent study on black rats in Southeast Australia found that black rats prefer to inhabit low-urban bushland areas over high-urban areas (Adams et al. 2023). It is therefore possible that the high prevalence of black rats in urban areas could also reflect their symmetrical competitive relationship with native bush rats, in which the winner is determined by prior occupancy (Stokes et al. 2009; Banks et al. 2011). Disturbances associated with urbanisation (habitat degradation, weed invasion) may also decrease the abundance of bush rats and allow black rats to invade, whereas bush rats in low-urban bushland areas may be less affected by anthropogenic disturbances and may be able to maintain competitive advantage over black rats (Stokes et al. 2009; Banks et al. 2011).
Despite mostly clear distinctions in the assemblage structures across urban levels, we recorded some overlap in the assemblages between mid-urban and low-urban, as well as mid-urban and high-urban areas. Mid-urban green areas can serve as strongholds for biodiversity in cities and help species disperse back into high-urban green spaces (Radeloff et al. 2005; Snep et al. 2006). In some cases, mid-urban areas can support greater amounts of biodiversity than do natural areas (Callaghan et al. 2019). Or in others, mid-urban areas can provide crucial habitat for threatened species; for example, Maclagan et al. (2018) found that novel peri-urban greenspaces in the urban areas of Melbourne, Australia, were able to support larger populations of the endangered southern brown bandicoot (Isoodon obselus) than were remnant bushland patches. This may be due to mid-urban areas having a heterogeneous mix of habitats that can support a range of species (Callaghan et al. 2019). Alternatively, it could be due to factors involved in the intermediate disturbance hypothesis, where species diversity is greatest in areas of intermediate levels of environmental disturbance (Moi et al. 2020). By finding ways to effectively manage and maximise mid-urban green spaces so that they better serve as areas to support and protect biodiversity within the urban matrix, it might be possible to curb or slow the loss of species. For example, habitat improvement or the removal of invasive species across our study area may improve conservation of the eastern pygmy possum, which is listed as vulnerable and was only recorded sparingly by our monitoring, to increase its range and survival in mid-urban areas of Sydney.
Habitat characteristics and species assemblages
We found that habitat characteristics influenced species in different ways, with few consistent relationships, which is likely to be driven by the habitat requirements of each species. For example, across all urbanisation levels, bush rats had a significantly positive relationship with ground cover complexity, and a significantly negative relationship with low tree cover, and a negative relationship with low shrub cover at mid-urban sites (Fig. S4, S5). These findings suggest that areas of dense ground cover are preferred by bush rats, which is consistent with previous studies and indicates that dense ground cover offers protection from predators and provides nesting opportunities (Barnett et al. 1978; Claridge and Barry 2000; Maitz and Dickman 2001; Garden et al. 2007; Holland and Bennett 2007). Conversely, long-nosed bandicoots had a negative relationship with ground-cover complexity across all urbanisation gradients, and with tall shrub cover in mid-urban areas. These findings are consistent with their preference for a mosaic of habitats, generally foraging in open areas with little understorey and seeking shelter in dense undergrowth (Chambers and Dickman 2002; Hughes and Banks 2011). Unexpectedly, groundcover complexity and low shrub cover did not have a significant impact on many of the small, ground-dwelling mammals we detected, such as the brown antechinus, as other previous studies have found (Catling et al. 2000; McElhinny et al. 2006; Holland and Bennett 2007). Differences in our results from these previous studies may be due to our sampling method. Specifically, most past studies analysed habitat preference by live trapping with a high number of traps across a gradient of chosen habitat variables, whereas we used camera traps, which were more spread apart and had fewer replicates (Catling et al. 2000; McElhinny et al. 2006; Holland and Bennett 2007). This meant that our sampling identified species at few, singular fixed spots. Interestingly, almost none of the recorded spatial or vegetation variables had a significant effect on any invasive species activity or presence (apart from a slight relationship between black rats and low tree cover). We speculate that this highlights the ability of invasive species to adapt to their surroundings and their tendency to be habitat generalists (McKinney and Lockwood 1999; Marvier et al. 2004; Pardini et al. 2009; Stigall 2012).
Temporal partitioning
We found that long-nosed bandicoots in high-urban sites did not have a significantly different mean activity peak than did co-occurring red foxes. This is relatively unexpected because of the evolutionary pressure between predators and prey that tend to result in temporal partitioning so that prey can avoid predators (Monterroso et al. 2013; Tambling et al. 2015; Viviano et al. 2021). However, a possible explanation for the temporal overlap noted between foxes and long-nosed bandicoots in our study could be due to a lack of co-evolution between the two species, in which bandicoots may not use anti-predator behaviours against foxes, which are novel predators in Australian landscapes (Russell and Banks 2005). Additionally, despite some previous studies that have focused on the temporal activity of long-nosed bandicoots, there is little information on their diel patterns in urban areas and their temporal overlap with invasive predators such as foxes (Hall 1980; Dallas 2020). We initially had the intention of assessing how the temporal activity of the two groups (foxes and CWR mammals) changed across urbanisation levels, but owing to a scarcity of data, we were able to focus only on high-urban sites. Future studies should focus on diel activity of native and non-native species in a range of urbanisation levels to better understand its impact (or whether it does have an impact) on temporal behaviour of species. Understanding temporal patterns of species living in urban areas can allow for better management surrounding urban green spaces and biodiversity. Moreover, diel activity patterns are an important aspect of ecology that is relatively understudied in the southern hemisphere compared with the northern hemisphere (Magura et al. 2021).
Conclusions and future directions
Our study has demonstrated that terrestrial vertebrate assemblages differ across an urbanisation gradient. We have also provided evidence for a negative relationship between invasive species richness and native species diversity, and our results demonstrated that the temporal dynamics between red foxes and most at-risk mammals, CWR mammals, did not in fact differ across different urban gradients. Although our study serves as a brief snapshot with study sites relatively close to each other, and with sampling for 2 months only, which meant that seasonal differences could not necessarily be assessed, this study has provided a methodological baseline that could be used in further research into the impacts of urbanisation on biodiversity in Australian cities. In our study site specifically, the survey could be expanded across a random selection of sites within other reserves to further elucidate the trends uncovered. However, we argue that our results still provide clear trends that could potentially be applied to conservation or urban planning practices.
For example, our findings suggest that mid-urban areas could be used as potential reintroduction sites, because we found that red foxes are less active at these sites than in high-urban areas, and that mid-urban areas can support an array of native species. Strategic predator control would need to be implemented prior to and in conjunction with such reintroductions, and further research and management would need to be conducted to assess and address co-occurring threats to the reintroduction candidates. More broadly, understanding the impacts of urbanisation on biodiversity is critical to implementing effective management that can support a wide range of species and, in turn, connect human societies to conservation. By implementing informed management in cities, there is hope to capitalise and use already existing greenspaces in urban areas for the protection of biodiversity and its co-existence with human society.
Data availability
The data that support this study cannot be publicly shared due to ethical or privacy reasons and may be shared upon reasonable request to the corresponding author if appropriate.
Conflicts of interest
Thomas Newsome is an Associate Editor of Wildlife Research. To mitigate this potential conflict of interest they had no editor-level access to this manuscript during peer review. The authors have no further conflicts of interest to declare.
Declaration of funding
Funding for this work was provided by the Australian Research Council Linkage Grant LP210301265.
Acknowledgements
We acknowledge and thank the Traditional Owners of the land on which this study was conducted on, namely, the Gamaragal, Birrabirragal, Gayamaygal, Darramurragal and Garigal people. We acknowledge and thank the help throughout this study from NSW National Parks and Wildlife Service, Taronga Conservation Society, North Sydney council, Mosman Municipal council, Willoughby City council, Lane Cove Municipal council, Ku-Ring-Gai council, Northern Beaches council and Hornsby council. We also thank Celine Partridge, Nicholas Kennedy, Roberto Gallardo Galan, Sam Johnson, Matthias Boer and Mareshell Wauchope for their help with fieldwork.
References
Adams MWD, Grant LS, Kovacs TGL, Liang SQT, Norris N, Wesley HE, Alessi MM, Banks PB (2023) Commensal black rats Rattus rattus select wild vegetation over urbanised habitats. Oikos 2023, e09671.
| Crossref | Google Scholar |
Aplin KP, Chesser T, Have JT (2003) Evolutionary biology of the genus Rattus: profile of an archetypal rodent pest. ACIAR Monograph Series 96, 487-498.
| Google Scholar |
Baker PJ, Harris S (2007) Urban mammals: what does the future hold? An analysis of the factors affecting patterns of use of residential gardens in Great Britain. Mammal Review 37, 297-315.
| Crossref | Google Scholar |
Banko PC, Oboyski PT, Slotterback JW, Dougill SJ, Goltz DM, Johnson L, Laut ME, Murray TC (2002) Availability of food resources, distribution of invasive species, and conservation of a Hawaiian bird along a gradient of elevation. Journal of Biogeography 29, 789-808.
| Crossref | Google Scholar |
Banks P, Cleary G, Dickman C (2011) Sydney’s bubonic plague outbreak 1900–1910: a disaster for foreshore wildlife? Australian Zoologist 35, 1033-1039.
| Crossref | Google Scholar |
Barnett JL, How RA, Humphreys WF (1978) The use of habitat components by small mammals in eastern Australia. Australian Journal of Ecology 3, 277-285.
| Crossref | Google Scholar |
Bateman PW, Fleming PA (2012) Big city life: carnivores in urban environments. Journal of Zoology 287, 1-23.
| Crossref | Google Scholar |
Beliniak A, Krauze-Gryz D, Jasińska K, Jankowska K, Gryz J (2021) Contrast in daily activity patterns of red squirrels inhabiting urban park and urban forest. Hystrix 32, 159-164.
| Crossref | Google Scholar |
Bradley BA, Laginhas BB, Whitlock R, Allen JM, Bates AE, Bernatchez G, Diez JM, Early R, Lenoir J, Vilà M, Sorte CJB (2019) Disentangling the abundance – impact relationship for invasive species. Proceedings of the National Academy of Sciences 116, 9919-9924.
| Crossref | Google Scholar |
Bryant GL, Kobryn HT, Hardy GESJ, Fleming PA (2017) Habitat islands in a sea of urbanisation. Urban Forestry & Urban Greening 28, 131-137.
| Crossref | Google Scholar |
Burbidge AA, McKenzie NL (1989) Patterns in the modern decline of western Australia’s vertebrate fauna: causes and conservation implications. Biological Conservation 50, 143-198.
| Crossref | Google Scholar |
Callaghan CT, Bino G, Major RE, Martin JM, Lyons MB, Kingsford RT (2019) Heterogeneous urban green areas are bird diversity hotspots: insights using continental-scale citizen science data. Landscape Ecology 34, 1231-1246.
| Crossref | Google Scholar |
Cardillo M, Bromham L (2001) Body size and risk of extinction in Australian mammals. Conservation Biology 15, 1435-1440.
| Crossref | Google Scholar |
Carlos-Júnior LA, Creed JC, Marrs R, Lewis RJ, Moulton TP, Feijó-Lima R, Spencer M (2020) Generalized Linear Models outperform commonly used canonical analysis in estimating spatial structure of presence/absence data. PeerJ 8, e9777.
| Crossref | Google Scholar |
Carthew SM, Goldingay RL (1997) Non-flying mammals as pollinators. Trends in Ecology & Evolution 12, 104-108.
| Crossref | Google Scholar | PubMed |
Catling PC, Burt RJ, Forrester RI (2000) Models of the distribution and abundance of ground-dwelling mammals in the eucalypt forests of north-eastern New South Wales in relation to habitat variables. Wildlife Research 27, 639-654.
| Crossref | Google Scholar |
Chambers LK, Dickman CR (2002) Habitat selection of the long-nosed bandicoot, Perameles nasuta (Mammalia, Peramelidae), in a patchy urban environment. Austral Ecology 27, 334-342.
| Crossref | Google Scholar |
Chapin FS, III, Walker BH, Hobbs RJ, Hooper DU, Lawton JH, Sala OE, Tilman D (1997) Biotic control over the functioning of ecosystems. Science 277, 500-504.
| Crossref | Google Scholar |
Choate BA, Hickman PL, Moretti EA (2018) Wild bee species abundance and richness across an urban–rural gradient. Journal of Insect Conservation 22, 391-403.
| Crossref | Google Scholar |
Claridge AW, Barry SC (2000) Factors influencing the distribution of medium-sized ground-dwelling mammals in southeastern mainland Australia. Austral Ecology 25, 676-688.
| Crossref | Google Scholar |
Colman NJ, Gordon CE, Crowther MS, Letnic M (2014) Lethal control of an apex predator has unintended cascading effects on forest mammal assemblages. Proceedings of the Royal Society of London – B. Biological Sciences 281, 20133094.
| Crossref | Google Scholar |
Concepción ED, Moretti M, Altermatt F, Nobis MP, Obrist MK (2015) Impacts of urbanisation on biodiversity: the role of species mobility, degree of specialisation and spatial scale. Oikos 124, 1571-1582.
| Crossref | Google Scholar |
Cunningham CX, Johnson CN, Barmuta LA, Hollings T, Woehler EJ, Jones ME (2018) Top carnivore decline has cascading effects on scavengers and carrion persistence. Proceedings of the Royal Society of London – B. Biological Sciences 285, 20181582.
| Crossref | Google Scholar |
Dallas RKK (2020) Activity pattern analysis and overlap between the invasive red fox, Vulpes vulpes L. and its prey within a fragmented landscape in south eastern Australia. MRes thesis, School of Earth, Atmospheric and Life Sciences, University of Wollongong, Wollongong, NSW, Australia. Available at https://ro.uow.edu.au/theses1/910
Dart MM, Perkins LB, Jenks JA, Hatfield G, Lonsinger RC (2023) The effect of scent lures on detection is not equitable among sympatric species. Wildlife Research 50(3), 190-200.
| Crossref | Google Scholar |
Devictor V, Julliard R, Jiguet F (2008) Distribution of specialist and generalist species along spatial gradients of habitat disturbance and fragmentation. Oikos 117, 507-514.
| Crossref | Google Scholar |
Dexter E, Rollwagen-Bollens G, Bollens SM (2018) The trouble with stress: a flexible method for the evaluation of nonmetric multidimensional scaling. Limnology and Oceanography: Methods 16, 434-443.
| Crossref | Google Scholar |
Doherty TS, Dickman CR, Nimmo DG, Ritchie EG (2015) Multiple threats, or multiplying the threats? Interactions between invasive predators and other ecological disturbances. Biological Conservation 190, 60-68.
| Crossref | Google Scholar |
Gaertner M, Larson BMH, Irlich UM, Holmes PM, Stafford L, van Wilgen BW, Richardson DM (2016) Managing invasive species in cities: a framework from Cape Town, South Africa. Landscape and Urban Planning 151, 1-9.
| Crossref | Google Scholar |
Gallo T, Fidino M, Gerber B, Ahlers AA, Angstmann JL, Amaya M, Concilio AL, Drake D, Gay D, Lehrer EW, Murray MH, Ryan TJ, St Clair CC, Salsbury CM, Sander HA, Stankowich T, Williamson J, Belaire JA, Simon K, Magle SB (2022) Mammals adjust diel activity across gradients of urbanization. eLife 11, e74756.
| Crossref | Google Scholar |
Garden J, McAlpine C, Peterson A, Jones D, Possingham H (2006) Review of the ecology of Australian urban fauna: a focus on spatially explicit processes. Austral Ecology 31, 126-148.
| Crossref | Google Scholar |
Garden JG, Mcalpine CA, Possingham HP, Jones DN (2007) Habitat structure is more important than vegetation composition for local-level management of native terrestrial reptile and small mammal species living in urban remnants: a case study from Brisbane, Australia. Austral Ecology 32, 669-685.
| Crossref | Google Scholar | PubMed |
Garden JG, McAlpine CA, Possingham HP (2010) Multi-scaled habitat considerations for conserving urban biodiversity: native reptiles and small mammals in Brisbane, Australia. Landscape Ecology 25, 1013-1028.
| Crossref | Google Scholar |
Gaynor KM, Hojnowski CE, Carter NH, Brashares JS (2018) The influence of human disturbance on wildlife nocturnality. Science 360, 1232-1235.
| Crossref | Google Scholar | PubMed |
Gibb H, Hochuli DF (2002) Habitat fragmentation in an urban environment: large and small fragments support different arthropod assemblages. Biological Conservation 106, 91-100.
| Crossref | Google Scholar |
Gil-Fernández M, Harcourt R, Newsome T, Towerton A, Carthey A (2020) Adaptations of the red fox (Vulpes vulpes) to urban environments in Sydney, Australia. Journal of Urban Ecology 6, juaa009.
| Crossref | Google Scholar |
Gonsalves L, Law B (2018) Seasonal activity patterns of bats in North Sydney, New South Wales: implications for urban bat monitoring programs. Australian Mammalogy 40, 220-229.
| Crossref | Google Scholar |
Hagen M, Kissling WD, Rasmussen C, De Aguiar MAM, Brown LE, Carstensen DW, Alves-Dos-Santos I, Dupont YL, Edwards FK, Genini J, Guimarães PR, Jenkins GB, Jordano P, Kaiser-Bunbury CN, Ledger ME, Maia KP, Marquitti FMD, Mclaughlin Ó, Morellato LPC, O’Gorman EJ, Trøjelsgaard K, Tylianakis JM, Vidal MM, Woodward G, Olesen JM (2012) –2 Biodiversity, species interactions and ecological networks in a fragmented world. In ‘Advances in ecological research’. Global Change in Multispecies Systems Part 1. (Eds U Jacob, G Woodward) pp. 89–210. (Academic Press) 10.1016/B978-0-12-396992-7.00002-2
Hall S (1980) Diel activity of three small mammals coexisting in forest in southern Victoria. Australian Mammalogy 3, 67-79.
| Crossref | Google Scholar |
Hall MJ, Burns AL, Martin JM, Hochuli DF (2020) Flight initiation distance changes across landscapes and habitats in a successful urban coloniser. Urban Ecosystems 23, 785-791.
| Crossref | Google Scholar |
Holland GJ, Bennett AF (2007) Occurrence of small mammals in a fragmented landscape: the role of vegetation heterogeneity. Wildlife Research 34, 387-397.
| Crossref | Google Scholar |
Holland GJ, Bennett AF (2009) Differing responses to landscape change: implications for small mammal assemblages in forest fragments. Biodiversity and Conservation 18, 2997-3016.
| Crossref | Google Scholar |
Hughes NK, Banks PB (2011) Heading for greener pastures? Defining the foraging preferences of urban long-nosed bandicoots. Australian Journal of Zoology 58, 341-349.
| Crossref | Google Scholar |
Keith D (2004) ‘Ocean shores to desert dunes: The native vegetation of New South Wales and the ACT.’ (NSW Department of Environment and Conservation) Available at https://shop.regional.nsw.gov.au/products/ocean-shores-to-desert-dunes-2004
Kowarik I (2011) Novel urban ecosystems, biodiversity, and conservation. Environmental Pollution 159, 1974-1983.
| Crossref | Google Scholar | PubMed |
Legge S, Murphy BP, McGregor H, Woinarski JCZ, Augusteyn J, Ballard G, Baseler M, Buckmaster T, Dickman CR, Doherty T, Edwards G, Eyre T, Fancourt BA, Ferguson D, Forsyth DM, Geary WL, Gentle M, Gillespie G, Greenwood L, Hohnen R, Hume S, Johnson CN, Maxwell M, McDonald PJ, Morris K, Moseby K, Newsome T, Nimmo D, Paltridge R, Ramsey D, Read J, Rendall A, Rich M, Ritchie E, Rowland J, Short J, Stokeld D, Sutherland DR, Wayne AF, Woodford L, Zewe F (2017) Enumerating a continental-scale threat: how many feral cats are in Australia? Biological Conservation 206, 293-303.
| Crossref | Google Scholar |
Legge S, Rumpff L, Garnett ST, Woinarski JCZ (2023) Loss of terrestrial biodiversity in Australia: magnitude, causation, and response. Science 381, 622-631.
| Crossref | Google Scholar | PubMed |
Lhoest S, Fonteyn D, Daïnou K, Delbeke L, Doucet J-L, Dufrêne M, Josso J-F, Ligot G, Oszwald J, Rivault E, Verheggen F, Vermeulen C, Biwolé A, Fayolle A (2020) Conservation value of tropical forests: distance to human settlements matters more than management in Central Africa. Biological Conservation 241, 108351.
| Crossref | Google Scholar |
Lowry H, Lill A, Wong BBM (2013) Behavioural responses of wildlife to urban environments. Biological Reviews 88, 537-549.
| Crossref | Google Scholar | PubMed |
Maclagan SJ, Coates T, Ritchie EG (2018) Don’t judge habitat on its novelty: assessing the value of novel habitats for an endangered mammal in a peri-urban landscape. Biological Conservation 223, 11-18.
| Crossref | Google Scholar |
Magura T, Kiss E, Lövei GL (2021) No consistent diversity patterns in terrestrial mammal assemblages along rural-urban forest gradients. Basic and Applied Ecology 52, 38-45.
| Crossref | Google Scholar |
Maitz WE, Dickman CR (2001) Competition and habitat use in native Australian Rattus: is competition intense, or important? Oecologia 128, 526-538.
| Crossref | Google Scholar | PubMed |
Major RE, Parsons H (2010) What do museum specimens tell us about the impact of urbanisation? A comparison of the recent and historical bird communities of Sydney. Emu – Austral Ornithology 110, 92-103.
| Crossref | Google Scholar |
Malkinson D, Kopel D, Wittenberg L (2018) From rural-urban gradients to patch – matrix frameworks: plant diversity patterns in urban landscapes. Landscape and Urban Planning 169, 260-268.
| Crossref | Google Scholar |
Mao Q, Liao C, Wu Z, Guan W, Yang W, Tang Y, Wu G (2019) Effects of land cover pattern along urban-rural gradient on bird diversity in wetlands. Diversity 11, 86.
| Crossref | Google Scholar |
Marks CA, Nijk M, Gigliotti F, Busana F, Short RV (1996) Preliminary field assessment of a Cabergoline baiting campaign for reproductive control of the Red Fox (Vulpes Vulpes). Wildlife Research 23, 161-168.
| Crossref | Google Scholar |
Marvier M, Kareiva P, Neubert MG (2004) Habitat destruction, fragmentation, and disturbance promote invasion by habitat generalists in a multispecies metapopulation. Risk Analysis 24, 869-878.
| Crossref | Google Scholar | PubMed |
Mcdonald RI, Forman RTT, Kareiva P, Neugarten R, Salzer D, Fisher J (2009) Urban effects, distance, and protected areas in an urbanizing world. Landscape and Urban Planning 93, 63-75.
| Crossref | Google Scholar |
McDonnell MJ, Pickett STA (1990) Ecosystem structure and function along urban–rural gradients: an unexploited opportunity for ecology. Ecology 71, 1232-1237.
| Crossref | Google Scholar |
McElhinny C, Gibbons P, Brack C, Bauhus J (2006) Fauna-habitat relationships: a basis for identifying key stand structural attributes in temperate Australian eucalypt forests and woodlands. Pacific Conservation Biology 12, 89-110.
| Crossref | Google Scholar |
McGregor HW, Legge S, Jones ME, Johnson CN (2014) Landscape management of fire and grazing regimes alters the fine-scale habitat utilisation by feral cats. PLoS ONE 9, e109097.
| Crossref | Google Scholar |
McKinney ML (2002) Urbanization, biodiversity, and conservation: the impacts of urbanization on native species are poorly studied, but educating a highly urbanized human population about these impacts can greatly improve species conservation in all ecosystems. BioScience 52, 883-890.
| Crossref | Google Scholar |
McKinney ML (2006) Urbanization as a major cause of biotic homogenization. Biological Conservation 127, 247-260.
| Crossref | Google Scholar |
McKinney ML, Lockwood JL (1999) Biotic homogenization: a few winners replacing many losers in the next mass extinction. Trends in Ecology & Evolution 14, 450-453.
| Crossref | Google Scholar | PubMed |
Melliger RL, Braschler B, Rusterholz H-P, Baur B (2018) Diverse effects of degree of urbanisation and forest size on species richness and functional diversity of plants, and ground surface-active ants and spiders. PLoS ONE 13, e0199245.
| Crossref | Google Scholar |
Moi DA, García-Ríos R, Hong Z, Daquila BV, Mormul RP (2020) Intermediate disturbance hypothesis in ecology: a literature review. Annales Zoologici Fennici 57, 67-78.
| Crossref | Google Scholar |
Mollot G, Pantel JH, Romanuk TN (2017) Chapter Two – The effects of invasive species on the decline in species richness: a global meta-analysis. In ‘Advances in ecological research. Volume 56: Networks of Invasion: a Synthesis of Concepts’. (Eds DA Bohan, AJ Dumbrell, F Massol) pp. 61–83. (Academic Press) 10.1016/bs.aecr.2016.10.002
Monterroso P, Alves PC, Ferreras P (2013) Catch me if you can: diel activity patterns of mammalian prey and predators. Ethology 119, 1044-1056.
| Crossref | Google Scholar |
Newbold T, Hudson LN, Hill SLL, Contu S, Lysenko I, Senior RA, Börger L, Bennett DJ, Choimes A, Collen B, Day J, De Palma A, Díaz S, Echeverria-Londoño S, Edgar MJ, Feldman A, Garon M, Harrison MLK, Alhusseini T, Ingram DJ, Itescu Y, Kattge J, Kemp V, Kirkpatrick L, Kleyer M, Correia DLP, Martin CD, Meiri S, Novosolov M, Pan Y, Phillips HRP, Purves DW, Robinson A, Simpson J, Tuck SL, Weiher E, White HJ, Ewers RM, Mace GM, Scharlemann JPW, Purvis A (2015) Global effects of land use on local terrestrial biodiversity. Nature 520, 45-50.
| Crossref | Google Scholar | PubMed |
Niemelä J (2014) Ecology of urban green spaces: the way forward in answering major research questions. Landscape and Urban Planning 125, 298-303.
| Crossref | Google Scholar |
NSW Government (2022) NSW state vegetation type map. (NSW Environment and Heritage) Available at http://www.environment.nsw.gov.au/topics/animals-and-plants/biodiversity/nsw-bionet/state-vegetation-type-map [accessed 21 September 2023]
Pal M, Pop P, Mahapatra A, Bhagat R, Hore U (2019) Diversity and structure of bird assemblages along urban-rural gradient in Kolkata, India. Urban Forestry & Urban Greening 38, 84-96.
| Crossref | Google Scholar |
Pardini R, Faria D, Accacio GM, Laps RR, Mariano-Neto E, Paciencia MLB, Dixo M, Baumgarten J (2009) The challenge of maintaining Atlantic forest biodiversity: a multi-taxa conservation assessment of specialist and generalist species in an agro-forestry mosaic in southern Bahia. Biological Conservation 142, 1178-1190.
| Crossref | Google Scholar |
Petroelje TR, Belant JL, Beyer DE, Jr., Svoboda NJ (2019) Subsidies from anthropogenic resources alter diet, activity, and ranging behavior of an apex predator (Canis lupus). Scientific Reports 9, 13438.
| Crossref | Google Scholar |
Pithon JA, Duflot R, Beaujouan V, Jagaille M, Pain G, Daniel H (2021) Grasslands provide diverse opportunities for bird species along an urban–rural gradient. Urban Ecosystems 24, 1281-1294.
| Crossref | Google Scholar |
Radeloff VC, Hammer RB, Stewart SI, Fried JS, Holcomb SS, McKeefry JF (2005) The wildland–urban interface in the United States. Ecological Applications 15, 799-805.
| Crossref | Google Scholar |
Rees WE (1997) Urban ecosystems: the human dimension. Urban Ecosystems 1, 63-75.
| Crossref | Google Scholar |
Reshamwala HS, Shrotriya S, Bora B, Lyngdoh S, Dirzo R, Habib B (2018) Anthropogenic food subsidies change the pattern of red fox diet and occurrence across Trans-Himalayas, India. Journal of Arid Environments 150, 15-20.
| Crossref | Google Scholar |
Russell B, Banks P (2005) Responses of four Critical Weight Range (CWR) marsupials to the odours of native and introduced predators. Australian Zoologist 33, 217-222.
| Crossref | Google Scholar |
Russell T, Bowman B, Herbert C, Kohen J (2011) Suburban attitudes towards the common brushtail possum Trichosurus vulpecula and the common ringtail possum Pseudocheirus peregrinus in the northern suburbs of Sydney. Australian Zoologist 35, 888-894.
| Crossref | Google Scholar |
Saito M, Koike F (2013) Distribution of wild mammal assemblages along an urban–rural–forest landscape gradient in warm-temperate East Asia. PLoS ONE 8, e65464.
| Crossref | Google Scholar |
Santana Marques P, Resende Manna L, Clara Frauendorf T, Zandonà E, Mazzoni R, El-Sabaawi R (2020) Urbanization can increase the invasive potential of alien species. Journal of Animal Ecology 89, 2345-2355.
| Crossref | Google Scholar | PubMed |
Seto KC, Güneralp B, Hutyra LR (2012) Global forecasts of urban expansion to 2030 and direct impacts on biodiversity and carbon pools. Proceedings of the National Academy of Sciences 109, 16083-16088.
| Crossref | Google Scholar |
Shochat E, Lerman SB, Anderies JM, Warren PS, Faeth SH, Nilon CH (2010) Invasion, competition, and biodiversity loss in urban ecosystems. BioScience 60, 199-208.
| Crossref | Google Scholar |
Smart SM, Thompson K, Marrs RH, Le Duc MG, Maskell LC, Firbank LG (2006) Biotic homogenization and changes in species diversity across human-modified ecosystems. Proceedings of the Royal Society of London – B. Biological Sciences 273, 2659-2665.
| Crossref | Google Scholar |
Smith AP, Quin DG (1996) Patterns and causes of extinction and decline in Australian conilurine rodents. Biological Conservation 77, 243-267.
| Crossref | Google Scholar |
Smith P, Smith J (2019) Radical changes in the avifauna of a Sydney suburb, 1971–2014. Australian Journal of Zoology 67, 185-198.
| Crossref | Google Scholar |
Smith A, Meulders B, Bull CM, Driscoll D (2012) Wildfire-induced mortality of Australian reptiles. Herpetology Notes 5, 233-235.
| Google Scholar |
Snep RPH, Opdam PFM, Baveco JM, WallisDeVries MF, Timmermans W, Kwak RGM, Kuypers V (2006) How peri-urban areas can strengthen animal populations within cities: a modeling approach. Biological Conservation 127, 345-355.
| Crossref | Google Scholar |
Sogliani D, Cerri J, Turetta R, Crema M, Corsini M, Mori E (2021) Feral rabbit populations in a peri-urban area: insights about invasion dynamics and potential management strategies. European Journal of Wildlife Research 67, 60.
| Crossref | Google Scholar |
Sol D, Trisos C, Múrria C, Jeliazkov A, González-Lagos C, Pigot AL, Ricotta C, Swan CM, Tobias JA, Pavoine S (2020) The worldwide impact of urbanisation on avian functional diversity. Ecology Letters 23, 962-972.
| Crossref | Google Scholar | PubMed |
Stigall AL (2012) Invasive species and evolution. Evolution: Education and Outreach 5, 526-533.
| Crossref | Google Scholar |
Stobo-Wilson AM, Murphy BP, Crawford HM, Dawson SJ, Dickman CR, Doherty TS, Fleming PA, Gentle MN, Legge SM, Newsome TM, Palmer R, Rees MW, Ritchie EG, Speed J, Stuart J-M, Thompson E, Turpin J, Woinarski JCZ (2021) Sharing meals: predation on Australian mammals by the introduced European red fox compounds and complements predation by feral cats. Biological Conservation 261, 109284.
| Crossref | Google Scholar |
Stokeld D, Frank ASK, Hill B, Choy JL, Mahney T, Stevens A, Young S, Djelk Rangers, Warddeken Rangers, Gillespie GR (2015) Multiple cameras required to reliably detect feral cats in northern Australian tropical savanna: an evaluation of sampling design when using camera traps. Wildlife Research 42, 642-649.
| Crossref | Google Scholar |
Stokes VL, Banks PB, Pech RP, Spratt DM (2009) Competition in an invaded rodent community reveals black rats as a threat to native bush rats in littoral rainforest of south-eastern Australia. Journal of Applied Ecology 46, 1239-1247.
| Crossref | Google Scholar |
Tait CJ, Daniels CB, Hill RS (2005) Changes in species assemblages within the Adelaide metropolitan area, Australia, 1836–2002. Ecological Applications 15, 346-359.
| Crossref | Google Scholar |
Tambling CJ, Minnie L, Meyer J, Freeman EW, Santymire RM, Adendorff J, Kerley GIH (2015) Temporal shifts in activity of prey following large predator reintroductions. Behavioral Ecology and Sociobiology 69, 1153-1161.
| Crossref | Google Scholar |
Taylor CL, Hochuli DF, Banks PB (2023) Activity and movement of small mammal tick hosts at the urban fringes of Sydney, Australia. Wildlife Research 50, 927-938.
| Crossref | Google Scholar |
Tee SL, Samantha LD, Kamarudin N, Akbar Z, Lechner AM, Ashton-Butt A, Azhar B (2018) Urban forest fragmentation impoverishes native mammalian biodiversity in the tropics. Ecology and Evolution 8, 12506-12521.
| Crossref | Google Scholar | PubMed |
Theodorou P (2022) The effects of urbanisation on ecological interactions. Current Opinion in Insect Science 52, 100922.
| Crossref | Google Scholar |
Threlfall CG, Law B, Banks PB (2012) Influence of landscape structure and human modifications on insect biomass and bat foraging activity in an urban landscape. PLoS ONE 7, e38800.
| Crossref | Google Scholar |
United Nations (2018) 68% of the world population projected to live in urban areas by 2050, says UN. In News, 16 May 2018. (United Nations Department of Economic and Social Affairs) Available at https://www.un.org/development/desa/en/news/population/2018-revision-of-world-urbanization-prospects.html
van Rensburg BJ, Peacock DS, Robertson MP (2009) Biotic homogenization and alien bird species along an urban gradient in South Africa. Landscape and Urban Planning 92, 233-241.
| Crossref | Google Scholar |
Villaseñor NR, Blanchard W, Driscoll DA, Gibbons P, Lindenmayer DB (2015) Strong influence of local habitat structure on mammals reveals mismatch with edge effects models. Landscape Ecology 30, 229-245.
| Crossref | Google Scholar |
Viviano A, Mori E, Fattorini N, Mazza G, Lazzeri L, Panichi A, Strianese L, Mohamed WF (2021) Spatiotemporal overlap between the European brown hare and its potential predators and competitors. Animals 11, 562.
| Crossref | Google Scholar |
Wang Y, Naumann U, Wright ST, Warton DI (2012) mvabund – an R package for model-based analysis of multivariate abundance data. Methods in Ecology and Evolution 3, 471-474.
| Crossref | Google Scholar |
Wearn OR, Glover-Kapfer P (2019) Snap happy: camera traps are an effective sampling tool when compared with alternative methods. Royal Society Open Science 6, 181748.
| Crossref | Google Scholar |
White AW, Burgin S (2004) Current status and future prospects of reptiles and frogs in Sydney’s urban-impacted bushland reserves. In ‘Urban wildlife: more than meets the eye’. (Eds D Lunney, S Burgin) pp. 109–123. (Royal Zoological Society of New South Wales) 10.7882/FS.2004.087
Willson MF (1993) Mammals as seed-dispersal mutualists in North America. Oikos 67, 159-176.
| Crossref | Google Scholar |
Woinarski JCZ, Burbidge AA, Harrison PL (2015) Ongoing unraveling of a continental fauna: decline and extinction of Australian mammals since European settlement. Proceedings of the National Academy of Sciences of the United States of America 112, 4531-4540.
| Crossref | Google Scholar | PubMed |
Zungu MM, Maseko MST, Kalle R, Ramesh T, Downs CT (2020) Effects of landscape context on mammal richness in the urban forest mosaic of EThekwini Municipality, Durban, South Africa. Global Ecology and Conservation 21, e00878.
| Crossref | Google Scholar |
Łopucki R, Kiersztyn A (2020) The city changes the daily activity of urban adapters: camera-traps study of Apodemus agrarius behaviour and new approaches to data analysis. Ecological Indicators 110, 105957.
| Crossref | Google Scholar |
Łopucki R, Mróz I, Berliński Ł, Burzych M (2013) Effects of urbanization on small-mammal communities and the population structure of synurbic species: an example of a medium-sized city. Canadian Journal of Zoology 91, 554-561.
| Crossref | Google Scholar |