

Embracing biodiversity: multispecies population genomics of leafless Bossiaea species shows novel taxa, population dynamics and conservation strategies
Eilish S. McMaster A B * , Jia-Yee S. Yap A , Keith L. McDougall C , Elizabeth A. James D , Neville Walsh D , Nic Jario E , Jessica Peterie F and Maurizio Rossetto A
A
B
C
D
E
F
Abstract
Leafless Bossiaea species are a unique group of plants endemic to Australia that present intriguing challenges in taxonomy and conservation because of their morphological simplicity and often small, disjunct populations. We employed whole genome reduced representation sequencing (DArTseq) to enhance our understanding of the population dynamics, diversity and taxonomy of leafless Bossiaea species. Our dataset comprised 52,539 single-nucleotide polymorphisms across 283 samples from 7 leafless Bossiaea species, including 6 listed threatened species. We examined population structure, phylogenetic relationships, kinship and gene flow within and among populations. On the basis of our population-genomic analyses, we propose recognition of the novel taxon Bossiaea vombata subsp. orientalis and a change in status from species (B. milesiae) to subspecies for B. fragrans subsp. milesiae. Additionally, we show extensive clonal reproduction across species and limited gene flow at distances of >1 km, shedding light on the challenges faced by these species. We advocate a coordinated approach to conservation, focusing on restoring self-sustaining populations and leveraging genetic rescue strategies. By addressing the population dynamics of multiple species simultaneously in taxonomically challenging lineages, we can make informed choices to safeguard biodiversity and evolutionary potential.
Keywords: Bossiaea, conservation, conservation genetics, DArTseq, Fabaceae, Faboideae, genomics, population genetics, taxonomy.
Introduction
Bossiaea Vent. is a genus exclusively found in Australia and currently comprises 78 taxa (Thompson 2012). Plants vary in size from prostrate shrubs (e.g. B. buxifolia A.Cunn. and B. prostrata R.Br.) to tall shrubs or small trees reaching up to 8 m in height (B. arenicola J.H.Ross). With the exceptions of B. walkeri F.Muell. and B. eremaea J.H.Ross, which occur in semi-arid to arid environments, most Bossiaea species are found within ~400 km of the Australian coastline. They inhabit various high-rainfall ecosystems, including coastal heaths, montane woodlands and forests, and alpine heathlands. Bossiaea species in the eastern and western parts of Australia appear to have diversified separately; hence, the relationships between these assemblages are unclear (Thompson 2012).
Within the tribe Bossiaeeae, the absence of leaf development and the presence of compressed, sometimes winged branchlets in certain Bossiaea species are unique (Thompson 2012). In the past 2 decades, the number of these leafless Bossiaea species has increased significantly as a result of the identification of additional taxa within B. bracteosa F.Muell. ex Benth. In 2008, Ross described B. vombata J.H.Ross in Victoria (Vic.), whereas McDougall (2009) introduced four new species (B. bombayensis K.L.McDougall, B. fragrans K.L.McDougall, B. grayi K.L.McDougall and B. milesiae K.L.McDougall) from the Australian Capital Territory (ACT) and New South Wales (NSW). Consequently, B. bracteosa sensu stricto is now recognised as a species endemic to the Victorian eastern highlands. Additionally, two more leafless Bossiaea species, Bossiaea arenitensis R.L.Barrett and Bossiaea zarae R.L.Barrett, were described in the Kimberley region during this period (Barrett and Barrett 2015).
Thompson (2012) classified eastern Bossiaea into six groups (Groups A–F) on the basis of leaf and floral characteristics. Group F unites eastern leafless species and includes 12 species classified into the following four subgroups: Ensata, Fragrans, Bracteosa and Walkeri subgroups (Table 1). Group F is distinctive for its flattened stems (cladodes), the absence of leaves and the presence of minute stipules. The species focussed on in this study make up the Fragrans subgroup (B. fragrans and B. milesiae) and the Bracteosa subgroup (B. bombayensis, B. grayi, B. vombata and B. bracteosa). B. riparia, from the Ensata subgroup, was also included as an outgroup species. The groupings within eastern Bossiaea are based on morphology, and the phylogenetic relationships of species, subgroups and groups have not been examined with molecular methods.
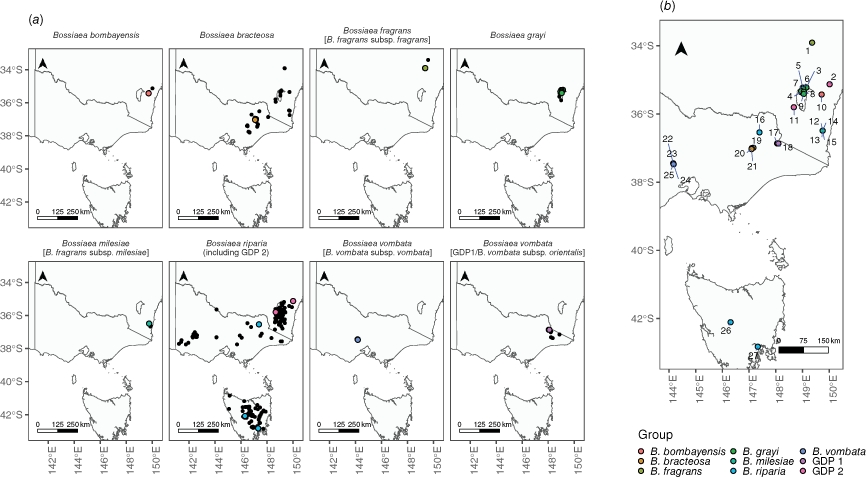
One noteworthy characteristic of Group F, following these recent revisions, is the limited geographic range of several species (Fig. 1a). For example, B. bombayensis is found along a 12 km stretch of the Shoalhaven River in NSW (NSW Scientific Committee 2009), B. fragrans is exclusive to woodlands within and near the Abercrombie Karst Conservation Area in NSW, B. grayi is restricted to the slopes of the Murrumbidgee River and its tributaries in the ACT (although recent collections from eastern Vic. have been assigned to that species; Threatened Species Scientific Comittee 2017), B. milesiae is limited to a small section of the Brogo River in NSW, bisected by a dam, and B. vombata is known solely from Wombat State Forest in central Vic. (Ross 2008), although a few historical collections from eastern Vic. have been provisionally assigned to that species. Owing to their rarity and the threats they face, four of these five species are classified as threatened under state threatened species legislation and Bossiaea bracteosa sensu stricto is also considered vulnerable under Victorian legislation (Table 2; Vic. Flora and Fauna Guarantee Act 1988; Commonwealth Environmental Protection and Biodiversity Conservation Act 1999; ACT Nature Conservation Act 2014; NSW Biodiversity Conservation Act 2016).
(a) Distribution map of Bossiaea species included in this study on the basis of Australian Virtual Herbarium, NSW BioNet Atlas and PlantBank records sourced from the Atlas of Living Australia. Each plot is a species or subspecies distribution. The species name appearing in the header corresponds to the pre-existing classification, whereas newly assigned species names as proposed in this study are denoted within brackets where applicable. Coloured points show collection sites for the samples used in this study, and black points are ALA records. (b) Map of combined sample sites for all species in this study. Each site is represented as a point colour-coded for species and labelled with a unique numeric identifier shown here and in Table 2. The species represented at each site are (1) B. fragrans [B. fragrans subsp. fragrans], (2, 11) GDP 2 (B. riparia), (3–9) B. grayi, (10) B. bombayensis, (12–15) B. milesiae [B. fragrans subsp. milesiae], (16, 26, 27) B. riparia, (17–18) GDP 1 [B. vombata subsp. orientalis], (19–21) B. bracteosa, and (22–25) B. vombata [B. vombata subsp. vombata].
| Species | Conservation | Site | Site location | Total (n) | Total without clones (n) | |
|---|---|---|---|---|---|---|
| B. bombayensis | VU (NSW) | 10 | Bombay Reserve | 31 | 31 | |
| B. bracteosa | VU (Vic.) | 19 | Cobungra Ditch, Mount Hotham | 12 | 7 | |
| 21 | Dargo Road, towards Mount Hotham | 11 | 11 | |||
| 20 | Renee’s Lookout, south-west of Mount Hotham | 12 | 3 | |||
| Total | 35 | 21 | ||||
| B. fragrans [B. fragrans subsp. fragrans] | CR (NSW), CR (Federal) | 1 | Abercrombie Karst | 93 | 72 | |
| B. grayi | EN (ACT) | 3 | Cas Sands | 3 | 1 | |
| 7 | Cotter | 1 | 1 | |||
| 9 | Discovery Trail 1 | 5 | 5 | |||
| 6 | Molonglo 1 | 9 | 2 | |||
| 5 | Molonglo 2 | 4 | 1 | |||
| 4 | Murrays CNR 1 | 11 | 1 | |||
| 8 | Murrays CNR 2 | 10 | 1 | |||
| Total | 43 | 12 | ||||
| B. milesiae [B. fragrans subsp. milesiae] | 12 | Brogo River 1 | 7 | 7 | ||
| 13 | Brogo River 2 | 1 | 1 | |||
| 14 | Brogo River 3 | 8 | 7 | |||
| 15 | Brogo River 4 | 2 | 2 | |||
| Total | 18 | 17 | ||||
| B. riparia | EN (Vic.) | 26 | Derwent Bridge, Tas. | 7 | 5 | |
| 16 | Mitta Mitta | 8 | 7 | |||
| 27 | Risdon, Hobart, Tas. | 4 | 4 | |||
| Total | 19 | 16 | ||||
| B. vombata [B. vombata subsp. vombata] | CR (Vic.) | 25 | Blackville Road WSF 1 | 3 | 1 | |
| 24 | Cairns Road WSF 2 | 3 | 2 | |||
| 23 | Farm Road WSF 3 | 3 | 1 | |||
| 22 | Unnamed track WSF 4 | 7 | 3 | |||
| Total | 16 | 7 | ||||
| GDP 1 [B. vombata subsp. orientalis] | 18 | Cowombat Flat Track | 6 | 3 | ||
| 17 | Limestone Creek Track | 7 | 5 | |||
| Total | 13 | 8 | ||||
| GDP 2 [B. riparia] | 11 | Kosciuszko National Park | 8 | 8 | ||
| 2 | NeverDie Oallen Ford | 7 | 7 | |||
| Total | 15 | 15 |
This table presents the number of samples after removal of low-quality samples at each site (Total) and the corresponding count after removing clones, on the basis of PLINK IBD kinship (pairwise k > 1 ÷ 2(3÷2)) (Total without clones), for different Bossiaea species. Each site is identified by a numeric label, and the respective species are indicated. Conservation status (VU, Vulnerable; EN, Endangered; CR, Critically Endangered) is noted for species with official state or federal listings.
Conservation efforts for threatened plant species often entails the collection and preservation of germplasm, including seeds and living collections, which can be used to augment existing populations or establish new ones (Schoen and Brown 2001; Commander 2021; Harrison et al. 2021). Highly localised species may suffer from inbreeding depression, leading to limited reproduction, compromised population health and a low probability of survival in the long term (Angeloni et al. 2011; Caballero et al. 2017). This appears to be the case for some of the threatened leafless Bossiaea species; for instance, B. vombata does not appear to produce seeds (Thompson 2012; Amor et al. 2020). Clonality is also suspected to be widespread in several of the species in this study (Ross 2008; McDougall 2009; Thompson 2012; Amor et al. 2020), which has significant implications for inbreeding and drift in small populations. Understanding the genetic diversity patterns in such species could enhance the effectiveness of conservation efforts, such as identifying genetically distinct subpopulations to maximise the genetic diversity of offspring.
This study employs genomic analyses to inform conservation strategies for rare and threatened leafless Bossiaea species, as well as to address taxonomic challenges within the group. Since the delineation of new Bossiaea species by Ross (2008) and McDougall (2009), some populations of two of these species have been identified from collections at considerable distances from known populations. Given the propensity for taxa within the broader concept of B. bracteosa to be highly localised, it is reasonable to speculate that these geographically separated populations may also warrant taxonomic recognition. Genomic analysis could also elucidate relationships among named taxa and potentially identify connections that could influence existing conservation programs. McDougall (2009), for example, noted the morphological similarity between B. fragrans and B. milesiae.
In this study, we conducted whole-genome single-nucleotide polymorphism (SNP) analysis to explore the population genomics of Bossiaea Group F. We focused on the following five closely related threatened leafless Bossiaea species: B. grayi, B. milesiae, B. bombayensis, B. fragrans and B. vombata from the Bracteosa and Fragrans subgroups (Table 1). We systematically collected cladode samples from virtually all known populations to comprehensively assess their genetic diversity and population dynamics (Fig. 1). Additionally, we included B. bracteosa, a commonly occurring species in subgroup Bracteosa, sampled from multiple sites, to provide a broader genomic context within the genus. We also incorporated B. riparia A.Cunn. ex Benth., a morphologically distinct species within the Ensata subgroup of Group F, as an outgroup for comparison. Our approach combined whole-genome SNP analysis and thorough sampling to examine population dynamics, taxonomy and species health. The findings hold implications for guiding conservation efforts for these species and support the implementation of a multispecies conservation approach.
Methods
Field sampling
We sampled the Bracteosa and Fragrans subgroups extensively, totalling 288 cladode tissue samples across 27 Bossiaea populations in south-eastern NSW, Vic. and Tasmania (Tas.) to investigate genetic variation and population dynamics. Sampling included all known populations of B. grayi, B. bombayensis, B. vombata, B. fragrans and B. milesiae, and several populations of the more widespread B. bracteosa, to capture representative diversity (Table 2, Fig. 1). In our sampling approach, we inadvertently collected two additional genetic groups, designated as genetically distinct population (GDP) 1 and GDP 2. Specimens of GDP 1 were obtained from two closely situated sites near the Cobberas Mountains, Vic. (Sites 17 and 18, ~4 km apart; see Fig. 1), and were initially identified as B. grayi and B. bracteosa respectively. Specimens of GDP 2 were collected as B. riparia from Oallen Ford (Site 2) and within Kosciuszko National Park (Site 11) in NSW. Another leafless Bossiaea from the Ensata subgroup, B. riparia, which is morphologically distinct (Thompson 2012) but within the distributional range of the Bracteosa and Fragrans subgroups, is included as an outgroup.
The collection strategy involved gathering 5–10 cm of tissue from each individual plant, ensuring spatial separation of sampled plants and recording the geographic coordinates (latitude and longitude) of each plant. To ensure the capture of genetic diversity across differently sized populations for the threatened species, sampling numbers were dependent on the number of individuals known and distribution patterns. After collection, the samples were stored at −80°C for a minimum of 12 h, then freeze-dried before storing in silica gel to ensure preservation until DNA extraction.
DNA extraction and DArTseq analysis
Genotyping was conducted using medium-density DArTseq, a reduced representation sequencing method implemented by Diversity Arrays Technology Australia Pty Ltd (Canberra, ACT, Australia). The DArTseq method involves a genome restriction digest followed by sequencing of the digested products by using an Illumina instrument, with SNPs called using proprietary analytical pipelines by DArT Pty Ltd (Jaccoud et al. 2001; Kilian et al. 2012).
Relationships among species and populations
Analyses of genetic relationships among the 288 Bossiaea samples were undertaken following methods from Rossetto et al. (2018), with some modifications. Our initial dataset had 81,158 loci. To enhance data quality, we eliminated loci with a DArT reproducibility score of 0.96 or lower, as well as monomorphic loci. Additionally, we selected a single SNP per locus. Subsequently, loci with more than 30% missing data across all genetic groups were excluded. We also removed samples with more than 30% missing loci to further refine the dataset. After implementing these quality-control measures, the resultant dataset utilised for subsequent analyses comprised 52,539 loci and 283 samples.
These SNP analyses included the estimation of pairwise kinship between individuals, principal-component analysis (PCA; Jombart 2008), estimation of fixation index (FST; Zheng et al. 2012), calculation of basic diversity statistics (Keenan et al. 2013), a SplitsTree phylogenetic network analysis (based on the Euclidean distance among genotype scores; Huson 1998) and SVDQuartets phylogenetic estimation (Chifman and Kubatko 2014). These analyses were performed in R for macOS (ver. 4.3.1, R Foundation for Statistical Computing, Vienna, Austria, see http://cran.r-project.org/bin/macosx/). We used in-house developed R code for the RRtools package, which is available on Github (see https://github.com/jasongbragg/RRtools) to filter and analyse the genotype data.
We estimated pairwise kinship between individuals using the PLINK identity by descent (IBD) method (Purcell et al. 2007; Chang et al. 2015) implemented in the snpgdsIBDMoM function of SNPRelate (ver. 1.36.0, see http://rdrr.io/bioc/SNPRelate/; Zheng et al. 2012). PLINK IBD estimation compares genotypes at specific SNP positions (shared loci with minor allele frequency (MAF) of ≥0.05) to determine the likelihood of shared alleles and estimate genetic relatedness between individuals in a dataset. Kinship was calculated within genetic groups (McMaster et al. 2024). We considered individuals to be genetically identical where the estimate of kinship exceeded a threshold value of 1 ÷ 2(3÷2) (Manichaikul et al. 2010). Where pairs of individuals exceeded this threshold, we removed the sample with lower data quality from the data set for subsequent SVDQuartets and diversity analysis.
Fixation index (FST) was calculated between subpopulations of Bossiaea by using the (Buckleton et al. 2016) method implemented in the snpgdsFst function of SNPRelate (MAF ≥ 0.05). Subpopulations with three or fewer individuals after clone removal were excluded. The fixation index (FST) measures the degree of genetic differentiation between populations, with higher FST values indicating a greater divergence in allele frequencies owing to limited genetic drift or selection.
Diversity metrics were computed for individual genetic groups within each site and overall. This involved excluding clones, subsetting to the target genetic group, selecting loci with less than 30% missing data and a MAF of ≥5%. Subsequently, the basicStats function of diveRsity (ver. 1.9.90, see http://rdrr.io/cran/diveRsity/) was used to obtain allelic richness (Ar), observed heterozygosity (HO), expected heterozygosity (HE) and inbreeding coefficient (FIS; Keenan et al. 2013).
We used the adegenet package (ver. 1.7-22, see http://rdrr.io/cran/adegenet/; Jombart 2008) to conduct PCA. The goal was to uncover and illustrate the underlying patterns of genetic diversity and population structure within our dataset. To achieve this, we visualised the first six principal components (PC1–PC6) in our analysis. We included more PCs than usual because of the involvement of seven different distinct genetic groups, allowing us to visualise how the observed distinctions contribute to the overall variance in the data.
The phylogenetic network was produced using the R package RSplitsTree (ver. 0.1.0, see http://rdrr.io/github/IVS-UZH/RSplitsTree/) and visualised in R using ggplot2 (ver. 3.4.2, see https://ggplot2.tidyverse.org; Wickham 2016) and tanggle (ver. 1.0.0, see http://rdrr.io/github/KlausVigo/tanggle/). Phylogenetic network analysis was used because it can capture and represent complex evolutionary relationships, such as reticulate evolution, hybridisation and horizontal gene transfer, which may not fit into a strictly tree-like structure (Huson 1998).
We estimated phylogenetic relationships of subpopulations using SVDQuartets in PAUP* (ver. 4.0a, see http://paup.phylosolutions.com/; Cummings 2004) and visualised the tree in R using ggtree (ver. 3.2.1, see https://rdrr.io/bioc/ggtree/; Yu et al. 2017). The SVDquartets method estimates a tree by exhaustively sampling combinations of four taxa from the data matrix, inferring a tree for each quartet and then using a quartet assembly algorithm to combine all sampled quartets into a species tree. SVDquartets is preferred for producing phylogenies from SNP data over other methods because of its ability to handle incomplete lineage sorting, its quartet-based approach for efficient analysis of large datasets, its direct inference of the species tree without relying on gene-tree estimation and its robustness to model violations commonly encountered in SNP data (Leaché and Oaks 2017). Input alignments were produced from the dart2svdquartets function in RRtools (ver. 0.1, see http://github.com/jasongbragg/RRtools/; Rossetto et al. 2018). Populations initially assigned during sampling were renamed into their putative subpopulation groups on the basis of genetic data (putative species and site). SVDQuartets was run under the multi-species coalescent model, standard bootstrap method with 1000 replicates, 100,000 random quartets and population taxonomic partitioning (Potter et al. 2021; Whitelaw et al. 2023). The final consensus tree was rooted using B. riparia (including GDP 2).
Distribution maps
We utilised the R package galah (ver. 2.0.2, see http://rdrr.io/github/AtlasOfLivingAustralia/galah/) to retrieve all records from the Atlas of Living Australia for Bossiaea fragrans, Bossiaea grayi, Bossiaea bombayensis, Bossiaea milesiae, Bossiaea riparia, Bossiaea bracteosa and Bossiaea vombata. Subsequently, we filtered these records to include only those records sourced from the Australian Virtual Herbarium, NSW BioNet Atlas and PlantBank Records.
Following this, we reclassified certain records on the basis of our analysis; records of B. vombata with longitude less than 146 were reclassified as B. vombata subsp. orientalis, whereas those with longitude greater than 146 were reclassified as B. vombata subsp. vombata. Additionally, records of Bossiaea grayi with latitude less than −36 were also reclassified as B. vombata subsp. orientalis (see Taxonomy).
Results and discussion
Genomic analyses on a dataset involving 52,539 SNPs across 283 samples of seven leafless Bossiaea species support the distinction and revision of selected morphologically described taxa (Fig. 2). Population-level sampling on locally restricted species across their representative distribution offered insights into reproduction, gene flow and hybridisation. Studying multiple species allows better understanding of factors affecting rarity (e.g. can it be explained by the breeding system?) and provides more cohesive conservation-planning strategies where species display similar patterns.
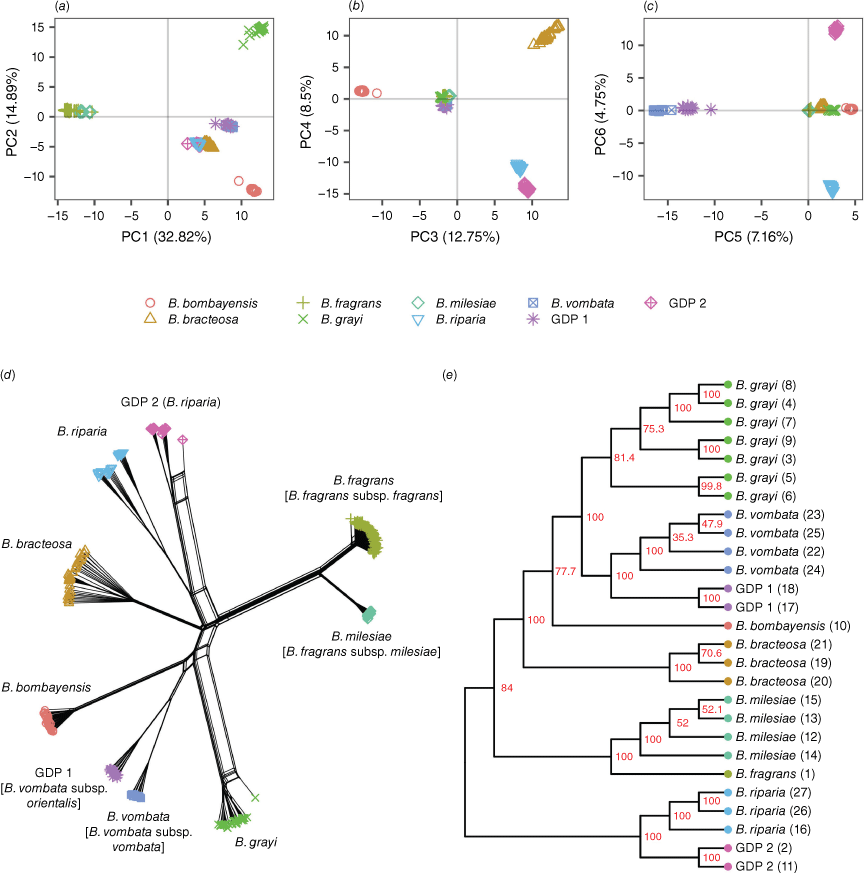
These analyses used 52,539 loci and included all 283 samples, including clones. (a–c) Principal-component analysis (PCA) of Bossiaea SNP genotypes. Points indicate individuals and are categorised into genetic lineages by shape and colour. Lineages can be spatially distinguished to different degrees along principal components (PC) 1–6. (d) SplitsTree phylogenetic network of all Bossiaea individuals, with nodes categorised into genetic lineages by shape and colour. Previous species name is adjacent to each group, and newly assigned species names as proposed in this study are denoted within brackets where applicable. The netting apparent for one GDP 2 individual and one B. grayi individual indicates possible hybrid origin. Otherwise, lineages are clearly differentiated. (e) SVDQuartets cladogram of subpopulations of Bossiaea (species site groups). Tip labels indicate species and site number. Red labels at the nodes indicate bootstrap value for 1,000 replicates. The tree was rooted using B. riparia (including GDP 2) as an outgroup. It should be noted that although the SVDQuartets analysis can provide an indication of the topology of a tree (e.g. which taxa are sister groups or are nested), it does not provide information about the magnitude or timing of divergence events or the evolutionary distances between taxa.
Identification of genetic groups
The genetic groupings in the data predominantly matched the expected classifications on the basis of their identification during collection. However, we also identified two additional genetic groups (referred to as GDP 1 and GDP 2) that did not neatly correspond to pre-existing taxonomic categories. The first lineage, GDP 1, was sampled from two sites near the Cobberas Mountains, Vic., that were proximate (Sites 17 and 18, ~4 km apart; Fig. 1) and were genetically similar. A previous collection from one site had been determined as B. grayi, and the other as B. bracteosa. GDP 1 is genetically similar to B. vombata, which, by current definition, occurs only in the Wombat State Forest in southern-central Vic., a considerable distance (~640 km) from the Cobberas (Ross 2008). The shared ancestry is indicated by the lineages clustering in the phylogenetic network and PCA (Fig. 2a–c) and clade forming in the SVDquartets phylogeny (Fig. 2e). Genetic separation correlated with the geographic distance is evident, and when coupled with observed morphological differences (longer calyx lobes, standard, claw and keel in B. vombata than in GDP 1 plants), this suggests that both lineages might be in the early stages of speciation. On the basis of the morphological resemblance of GDP 1 to B. vombata, we propose naming GDP 1 as Bossiaea vombata subsp. orientalis (described below in Taxonomy), thereby recognising the Wombat State Forest population as B. vombata subsp. vombata.
Genetically distinct Population 2 comprises individuals of B. riparia found near Oallen Ford (Site 2) and in Kosciuszko National Park (Site 11) in NSW, which are geographically distant from other included populations of B. riparia in Vic. (Site 16) and Tas. (Sites 26 and 27). The phylogenetic network and SVDquartet phylogeny shows that GDP 2 forms a cluster sister separate from the cluster of B. riparia from Vic. and Tas. (Fig. 2d, e). However, GDP 2 collections could not be separated morphologically from other collections of B. riparia (see Taxonomy below). This species is noted to have variable morphology (Thompson 2012), and our genetic findings support the concept that this widely distributed species contains genetic as well as morphological variability. Overall, the genomic data support the concept of B. riparia as a single species, despite the geographic separation and variation in habit and floral characteristics in its populations. However, the limited sampling of the Ensata subgroup (only one of five species included) restricts our ability to definitively identify the taxonomic status of GDP 2. Future studies should incorporate the other species from this subgroup to better delineate species boundaries and refine taxonomy within this group.
The genomic data also identified a genetic relationship inconsistent with previous taxonomic concepts, namely the previously described species B. milesiae from Brogo River and B. fragrans from Abercrombie Karst Conservation Area (~290 km apart; Fig. 1). Although these two species are morphologically different, with B. fragrans more commonly having multiple flowers per node, wider reproductive branches of cladodes and shorter stipes on the pods than does B. milesiae (McDougall 2009), the level of genetic separation between B. fragrans and B. milesiae is comparable to that between B. vombata and GDP 1, suggesting that they are better recognised as subspecies rather than species. This is exemplified by PCA outputs showing all individuals clustering together and separating only in further principal components (PC5 v. PC6; Fig. 1c) and the phylogenetic network showing a divergence between B. milesiae and B. fragrans similar to that of the two subspecies of B. vombata (Fig. 2d). To ensure consistent and reliable taxonomic assignment among the leafless Bossiaea species, we therefore propose changing the rank of B. milesiae to a subspecies of B. fragrans and supply the required combination below in the Taxonomy section.
Our genetic results indicated that B. bracteosa, which is described as endemic to the Australian Alps of north-eastern Vic., mainly from Dargo to Mount Hotham area, is genetically distinct from other taxa in the Bracteosa subgroup. The results here support the current species concept of B. bracteosa, which was based on a re-circumscription of B. bracteosa sensu lato (also recognising B. fragrans, B. milesiae, B. bombayensis and B. grayi) by McDougall (2009).
Bossiaea riparia was included in this study as an outgroup to examine the relationships among B. bracteosa and its related species. However, our genetic results did not identify this species as highly distinct from other studied species. The outgroup was chosen on the basis of Thompson’s (2012) morphology-based classification of Bossiaea that placed B. riparia in the Ensata subgroup, whereas B. bracteosa, B. vombata, B. bombayensis and B. grayi belong to the Bracteosa subgroup, and B. fragrans and B. milesiae to the Fragrans subgroup. Here, our analyses showed that B. riparia is potentially a sister lineage to B. bracteosa or any of the study species, indicating that morphology-based categorisations will not always reflect genetic relationships in this group of species. Future studies should consider using multiple potential outgroup candidates to reduce the risk of encountering similar challenges.
The findings highlighted how genetic variation aids in resolving relationships, especially in cases of allopatric speciation within geographically isolated lineages, which may not be clearly discernible or consistent solely on the basis of morphology. Our study showed a shallower level of genetic differentiation between B. milesiae and B. fragrans, leading us to conclude that B. milesiae should be classified as a subspecies under B. fragrans (described below as B. fragrans subsp. milesiae). Furthermore, we identified two genetically distinct populations (GDPs) within samples initially labelled as B. bracteosa and B. grayi from sites in Cobberas, Vic. (Sites 17 and 18, designated GDP 1, described below as Bossiaea vombata subsp. orientalis, Fig. 2b), and B. riparia from near Oallen Ford and in Kosciuszko National Park (Sites 2 and 11, GDP 2; Fig. 2c). These findings underscore the importance of genetic data in refining our understanding of species relationships and taxonomy.
Our re-assessment of the B. vombata and B. fragrans subspecies aligns with cladistic subspecies concepts. The subspecies we identify exhibit slight, yet clearly distinguishable, taxonomically relevant biological traits (Mayr 1970), varying allele frequencies (Dobzhansky 1952) and genetic distinctions, associated with geographic isolation (Clausen 1941). The evolution of species occurs gradually, making the distinguishing between species and infraspecific classifications challenging (Reydon and Kunz 2021). However, in these instances, we believe the proposed classifications are the most precise, biologically significant and practical for managing these groups on the basis of our current knowledge. Future studies utilising marker genes such as the Angiosperms353 probe set have the potential to offer significantly enhanced resolution in understanding the evolutionary history and relationships among these species (Johnson et al. 2019; McDonnell et al. 2021), complementing the population-genomic approach of this study.
Diversity and reproduction
We conducted kinship analysis to investigate the modes of reproduction in various species and populations of Bossiaea species (Fig. 3). We found that high levels of pairwise kinship, denoting clonality, were prevalent. Clonality can be attributed to asexual reproduction through rhizomatous growth or apomixis, or it can result from inbreeding or selfing within a population if sexual reproduction is compromised. Bossiaea Group F is known for its extensive rhizomatous growth (Thompson 2012), leading us to assume that most clonal individuals arise from this reproductive method. However, apomixis and inbreeding might also contribute in some cases.
Boxplots of pairwise IBD kinship values on the x-axis among individuals grouped by species and site number (y axis) as indicated by the boxes. Each blue dot indicates a single pairwise relationship between two individuals at a site. The clonality threshold k > 1 ÷ 2(3÷2) is indicated by the red range to the right of the plot. The other colour-coded thresholds represent theoretical values for relationships third-degree (blue), second-degree (pink) and first-degree relationships (orange, denoting parent–offspring and full siblings). These thresholds are accompanied by ranges that encompass potential values (Manichaikul et al. 2010; Purcell et al. 2007). This analysis used 52,539 loci and included all 283 samples, including clones.
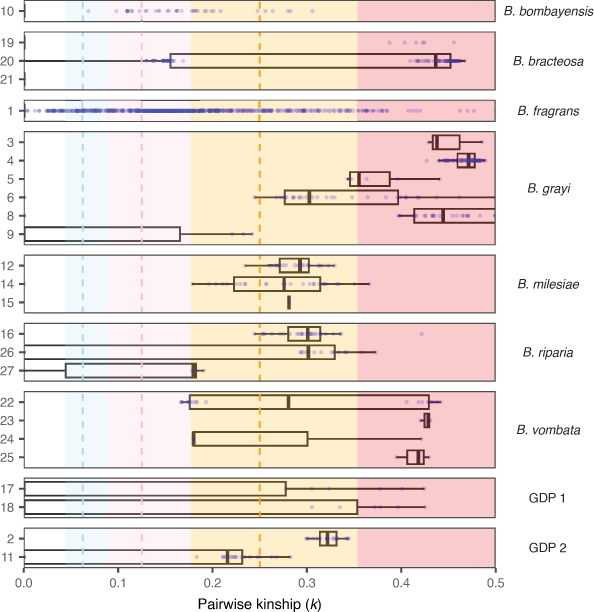
Several species in this study, including B. vombata (Thompson 2012; Amor et al. 2020), B. grayi (McDougall 2009), B. bracteosa (Ross 2008; McDougall 2009; Thompson 2012), B. fragrans, B. milesiae and B. bombayensis (Thompson 2012), have previously been observed to exhibit rhizomatous growth patterns. Among these species, we observed widespread clonality in B. grayi (27.9% of samples were genetically unique), B. vombata (43.75% unique genets) and B. bracteosa (60% unique genets; Table 2). Remarkably, B. grayi demonstrated extensive asexual reproduction, with one genet spanning 9 km between the Murrays Corner sites (Sites 4 and 8). By contrast, the sampled B. bracteosa had more localised sucker production with the furthest distance between ramets of the same genetic individual being 30 m. Clonality was less prevalent but still noticeable in B. fragrans (77.42% unique genets) and B. milesiae (94.44% unique genets), and it was not detected in B. bombayensis (Table 2). We also identified intermediate levels of kinship among individuals in all species, varying from first- to third-degree relatives, indicating that sexual reproduction is occurring.
The diversity statistics for each species and subpopulation, with clones removed, showed that in most Bossiaea populations, there was a high level of observed heterozygosity and low inbreeding coefficient (Table 3). In exceptional cases, where the overall inbreeding coefficient was high for the species (GDP 2 and B. riparia), it mainly resulted from the Wahlund effect. This effect occurs when there’s an overestimation of expected heterozygosity owing to within-group structure, resulting in divergent allele frequencies rather than widespread inbreeding (Garnier-Géré and Chikhi 2013).
| Species | Site | Ar | HO | HE | FIS | Loci | n | |
|---|---|---|---|---|---|---|---|---|
| B. bombayensis | 10 | 1.552 | 0.312 | 0.351 | 0.168 | 721 | 31 | |
| B. bracteosa | 21 | 1.61 | 0.257 | 0.319 | 0.19 | 11 | ||
| 20 | 1.443 | 0.27 | 0.219 | −0.238 | 3 | |||
| 19 | 1.577 | 0.246 | 0.304 | 0.169 | 7 | |||
| Total | 1.49 | 0.256 | 0.333 | 0.252 | 5248 | 21 | ||
| B. fragrans [B. fragrans subsp. fragrans] | 1 | 1.566 | 0.334 | 0.35 | 0.12 | 388 | 72 | |
| B. grayi | 9 | 1.289 | 0.193 | 0.186 | −0.01 | 5 | ||
| 6 | 1.229 | 0.198 | 0.144 | −0.458 | 2 | |||
| Total | 1.408 | 0.197 | 0.292 | 0.308 | 900 | 12 | ||
| B. milesiae [B. fragrans subsp. milesiae] | 15 | 1.379 | 0.354 | 0.208 | −0.688 | 2 | ||
| 14 | 1.475 | 0.385 | 0.253 | −0.34 | 7 | |||
| 12 | 1.501 | 0.411 | 0.256 | −0.41 | 7 | |||
| Total | 1.505 | 0.393 | 0.276 | −0.196 | 343 | 17 | ||
| B. riparia | 27 | 1.416 | 0.186 | 0.198 | 0.036 | 4 | ||
| 26 | 1.345 | 0.119 | 0.164 | 0.244 | 5 | |||
| 16 | 1.23 | 0.088 | 0.109 | 0.182 | 7 | |||
| Total | 1.429 | 0.123 | 0.38 | 0.626 | 3900 | 16 | ||
| B. vombata [B. vombata subsp. vombata] | 24 | 1.334 | 0.29 | 0.198 | −0.479 | 2 | ||
| 22 | 1.413 | 0.318 | 0.222 | −0.386 | 3 | |||
| Total | 1.501 | 0.315 | 0.295 | −0.051 | 1865 | 7 | ||
| GDP 1 [B. vombata subsp. orientalis] | 18 | 1.449 | 0.279 | 0.227 | −0.221 | 3 | ||
| 17 | 1.563 | 0.322 | 0.274 | −0.143 | 5 | |||
| Total | 1.485 | 0.307 | 0.301 | −0.007 | 2466 | 8 | ||
| GDP 2 [B. riparia] | 2 | 1.277 | 0.116 | 0.11 | −0.005 | 7 | ||
| 11 | 1.485 | 0.172 | 0.191 | 0.139 | 8 | |||
| Total | 1.455 | 0.147 | 0.365 | 0.544 | 1597 | 15 |
Genotype data were filtered for loci with >30% missingness and minimum minor allele frequency of 5%. Subsequently, allelic richness (Ar), observed heterozygosity (HO), expected heterozygosity (HE) and inbreeding coefficient (FIS) were calculated for each site and for the species overall (total).
The maintenance of high heterozygosity across most subpopulation indicates a generalised outbreeding preference, with potential for strong self-incompatibility mechanisms (DeMauro 1993; Pickup and Young 2008). This may be why seed production is absent or rare (Fujii et al. 2016) in the case of B. vombata subsp. vombata (Ross 2008) and B. fragrans (McDougall 2009), where kinship analysis indicated that many individuals are clones or close relatives. In the case of B. vombata subsp. vombata, we identified 7 distinct genetic individuals among the 16 sampled individuals (Table 2), and all these genetic individuals were closely related. This aligns with the findings of Amor et al. (2020), who observed only five genetic individuals in the Wombat State Forest population and no evidence of viable seed (Fig. S1). Even though the pollen viability of this population ranges from 15 to 90% (E. James, unpubl. data), the species has limited seed production and recruitment (Thompson 2012). Given that heterozygosity remains high across B. vombata subsp. vombata (HO = 0.315, FIS = −0.051), it seems plausible that the observed infertility is due to incompatibly mechanisms (DeMauro 1993; Pickup and Young 2008). Similarly, although B. fragrans diversity remains high (HO = 0.334, FIS = 0.12), the species has many closely related individuals (Fig. 3), and there have been limited observations of fully developed seed (McDougall 2009). Excess heterozygosity caused by self-incompatibility also increases the mutation load, posing an additional risk to preferentially outbreeding species that become isolated or have population-size reduction (Navascués et al. 2010; Duthie and Reid 2016; Caballero et al. 2017), such as these Bossiaea species. Consequently, we do not consider heterozygosity alone to be a good indicator of risk in these species, but rather the combination of diversity information with kinship information and population history is more informative; i.e. if a population is small and has many relatives, even if heterozygosity is high, the population is at risk of inbreeding depression such as reduced fertility. Self-incompatibility and outbreeding preference may also be related to the widespread asexual reproduction observed, wherein sterile populations rely on vegetative or apomictic reproduction to avoid self-incompatibility in sexual reproduction (Navascués et al. 2010).
Gene-flow limitations
Our data identified limited gene flow between populations separated by a minimum of 3 km, which is likely to exacerbate inbreeding and potentially hinders recovery of small populations. Connectivity, as indicated by low FST values (<0.1; Fig. 4), primarily occurs over very short distances (<1 km; Supplementary Fig. S2). Restricted gene flow between population and subsequent drift is likely to contribute to the distinct morphological and genetic divergence observed in the subspecific lineages GDP 1 (B. vombata subsp. orientalis) and B. milesiae (B. fragrans subsp. milesiae).
Heatmaps of pairwise geographic distance rounded to the nearest kilometre (lower-left triangle) and pairwise fixation index (FST; upper-right triangle) values for Bossiaea sites. Annotations on the side and bottom of the heatmaps indicate genetic group (colour) and numbers indicate site (numbers). This analysis used 52,539 loci and included 267 samples (excluding sites where n ≤ 3) as input, and further filtered so that loci with MAF of ≥5% and missingness of <30% were used for the pairwise comparisons.
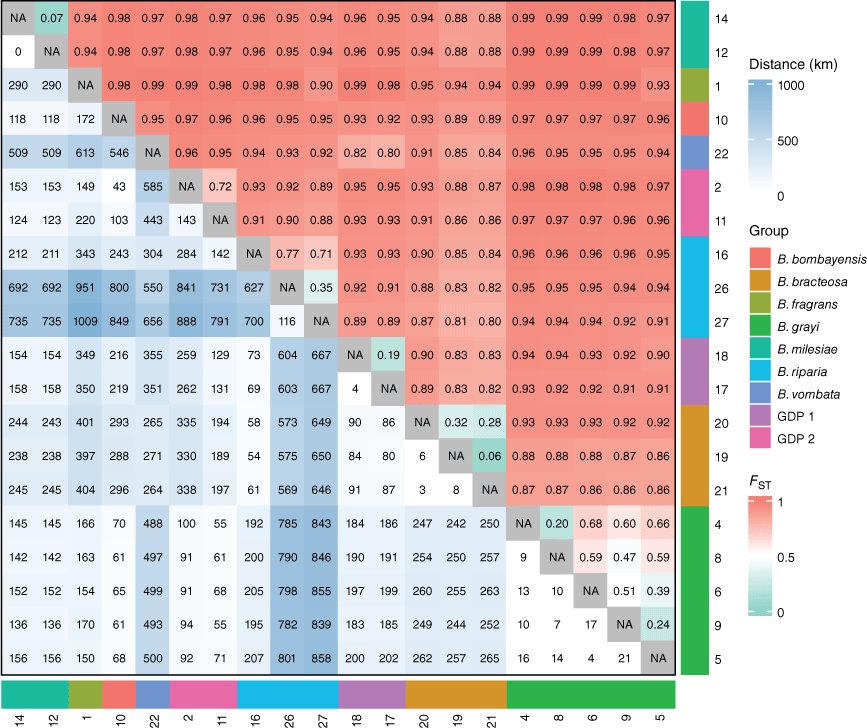
Despite limited gene flow between species, we identified two outlier individuals within the leafless Bossiaea species (NSW1151220 within GDP 2 and NSW1151575 within B. grayi) showing genomic signatures suggestive of incomplete lineage sorting or hybridisation. Hybridisation has been suspected in Bossiaea species (Thompson 2012), although not among those included in this study. This potential for hybridisation among closely related species could be leveraged as a genetic rescue mechanism (Whiteley et al. 2015) to reintroduce diversity into genetically depleted populations, thereby enhancing fertility and overall adaptive potential for small isolated populations (Frankham 2015).
Conservation implications
The genomic outcomes of our study have enhanced our understanding of population dynamics and taxonomic relationships of leafless Bossiaea taxa to provide informative insights to guide species conservation. A population-genomic approach is ideal for addressing multispecies conservation and taxonomic problems because it provides a comprehensive understanding of genetic diversity and relationships among species, enabling more effective conservation strategies and taxonomic classification based on genetic data (Rossetto et al. 2021).
Through our population-genomics analysis, we have identified restricted gene flow between geographically separated populations, resulting in well-defined and genetically isolated groups. Concurrently, we have detected probable outcrossing preference across all studied Bossiaea species, consistent with indications of strong self-incompatibility mechanisms and a capacity for reproductive modes such as vegetative sprouting or apomixis. Although these mechanisms may aid survival in demanding environments, they also raise concerns about the reproductive potential of species that are characterised by small effective population sizes, and the potential accumulation of detrimental mutations over time.
We have also identified genetically similar lineages within B. vombata and B. fragrans, namely B. vombata subsp. orientalis and B. fragrans subsp. milesiae, which merit formal taxonomic recognition and warrant conservation attention because of ongoing threats. Our emphasis rests on channelling resources and actions towards the restoration and support of self-sustaining populations, given that these lineages currently contend with challenges resulting from inbreeding or clonality.
Rather than pursuing separate conservation strategies for each lineage, we advocate a coordinated approach to yield more informed conservation solutions. To mitigate the challenges associated with inbreeding depression and mutation load, and ensure the conservation of these threatened species, one potential solution involves introducing genetic diversity through controlled crossbreeding with closely related individuals. For example, in the case of B. vombata subsp. vombata, which has limited seed production and high relatedness within its population, exploring crossbreeding with the geographically separated subspecies B. vombata subsp. orientalis could be a valuable avenue to investigate whether reintroducing diversity improves fertility in either or both subspecies. Similarly, the feasibility of crossbreeding between B. fragrans subsp. fragrans and B. fragrans subsp. milesiae should be explored to determine whether this approach can enhance seed production and viability for B. fragrans subsp. fragrans, which also faces limitations in seed production.
This proactive intervention carries a low level of risk, particularly given that these species are already experiencing declining populations with limited recruitment, potentially owing to self-incompatibility mechanisms. Moreover, considering the evolutionary history of these species, especially in species with small, disjunct populations, it becomes evident that landscape evolution and historical factors may have contributed to their current genetic state. In some cases, the disjunct populations may not represent genuine evolutionary divergence, but, rather, recent loss of populations owing to factors such as habitat clearing since European settlement. Therefore, interventions such as genetic rescue could offer significant conservation benefits by restoring genetic diversity and mitigating the impacts of recent population declines. Prior instances of genetic rescue have demonstrated significant improvements in the viability of inbred plant species (Reinartz and Les 1994; Fischer et al. 2003; Tallmon et al. 2004), making it a strategy worth considering in the conservation efforts for these species.
From a conservation perspective, these discoveries underscore the significance of understanding the genetic dynamics of isolated lineages to devise effective management strategies. Measures such as targeted conservation initiatives, safeguarding habitats and enhancing genetic diversity by assisted gene flow or population relocations could prove pivotal in securing the prolonged endurance and adaptability of these distinct and genetically diverse Bossiaea populations. By using a multispecies approach to address the genetic ramifications of isolation and inbreeding, it is possible to make informed choices that will safeguard the biodiversity and evolutionary potential of this remarkable genus, despite environmental challenges and human-induced impacts.
Taxonomy
A new subspecies and a new combination are presented below, with a revised key to Group F species of Thomson (2012), and notes on other species included in the genomic analysis.
Bossiaea vombata subsp. orientalis K.L.McDougall & N.G.Walsh, subsp. nov.
Type: Victoria. ~130 m W of Cowombat Flat Track, 3.3 km direct NNE from crossing of Limestone Road with Buchan River (Native Dog Flat), 13 Dec 2021, N.G. Walsh 9246, K.L. McDougall & E.A. James (Holo: MEL 2500750!; iso: NSW).
[Bossiaea grayi auct. non K.L.McDougall: I.R.Thompson, A revision of eastern Australian Bossiaea. Muelleria 30, 106–174 (2012)]
Ascending to erect clonal shrub up to 0.5 m high, rarely up to 1.5 m, young growth with scattered, fine appressed hairs up to ~0.5 mm long, older cladodes shortly pubescent in axils, otherwise glabrous, cladodes flattened, with ultimate branches (3–)3.5–9 mm wide, somewhat incised at the nodes, dull green to greenish-grey. Leaves absent, nodes bearing dark ovate-triangular scales 1.0–1.75 mm long, dark brown to blackish, glabrous, persistent. Flowers usually solitary at the nodes, occasionally twinned, the pedicels 1.0–2.0 mm long, glabrous; bracts imbricate, increasing in size from the outermost basal bract to the innermost, broadly ovate to oblate, the largest persistent bract 2.5–3 mm long, coriaceous, brown, glabrous except for the shortly fimbriate margin, persistent; bracteoles resembling bracts, but slightly larger, thinner-textured and paler, ~3.5 mm long and 2.5 mm wide, glabrous except for shortly fimbriate margin, caducous. Calyx, 3.5–5 mm long, green-flushed with purple towards apex, the tubular part glabrous externally and internally, lobes triangular, ±equal, 1–1.5 mm long and wide (or dorsal pair up to 2 mm wide), puberulous on inner surfaces and margins shortly fimbriate. Standard 8.0–9.0 mm long including a claw 1.5–2.0 mm long, 7.0–8.0 mm wide, abaxially yellow with a reddish to purplish basal flare, externally purplish at midline fading to yellow at margins; wings 7.0–8.0 mm long including a claw ~2 mm long, yellow-tinged with red at base; keel 6.0–7.5 mm long, including a claw ~2 mm long, uniformly crimson. Stamen-filaments 2.5–3 mm long with a sheath ~4 mm long, red or yellow. Ovary at anthesis ~4 mm long, glabrous; style ~4 mm long, glabrous. Fruits and seeds unknown.
There are three recent records of this subspecies in Victoria near the NSW–Vic. border in the vicinity of the Cobberas Mountains, between Benambra and Wulgulmerang. The habitat in which the species grows, namley, snow gum (Eucalyptus pauciflora) woodland with a mix of other eucalypts (E. dives, E. mannifera, E. rubida or E. stellulata), between 1000 and 1300 m above sea level, is extensive and so the species may be more widely distributed. Given the paucity of collections, it is likely not to be anywhere abundant. Collections from the Bendoc area (MEL 0600097, MEL 1509814, MEL 1529688) and the lower Snowy River (MEL 2087099, MEL 1529684) in eastern Vic. in the 1940s and 1950s appear to be referable to B. vombata sensu lato but are mostly infertile. The fragment of inflorescence from MEL 1529684 (W Tree behind Snowy River, Nov. 1957, L.Hodge s.n.) has dimensions consistent with subsp. orientalis. The collections are much closer geographically to populations of subsp. orientalis (25–75 km) than to subsp. vombata (~400 km) and would intuitively be the former taxon. Relocation of these populations and the collection of flowering material should be attempted to confirm their identity.
Uncertain. Further searches are required in suitable habitat to determine the range and population size of this subspecies before a conservation assessment can be made. However, the known populations are small and highly clonal and so their protection will be important until the conservation status of the species can be resolved.
As well as the close morphological and genetic relationship between subsp. vombata and subsp. orientalis, they are further associated in both being clonal, with individual clones forming patches of 10-m diameter or more. Population genetic analyses have demonstrated some variation among clones of at least subsp. vombata (Amor et al. 2020), suggestive of sexual reproduction at some time, but no comparative analyses of the two populations of subsp. orientalis have yet been undertaken. The two subspecies are distinguishable by the cladode colour (green in subsp. vombata, grey–green in subsp. orientalis) and the overall smaller flowers of subsp. orientalis (see Key couplet 7 below). Known populations of subsp. orientalis are close to roads, which undoubtedly aided their discovery, and more stands are likely to exist in this remote and little-explored part of Victoria.
The current genetic study has provided evidence that collections previously determined as B. grayi from Victoria are from plants belonging to B. vombata subsp. orientalis, making B. grayi an endemic of the ACT and likely to be eligible for listing as threatened under Commonwealth legislation.
Limestone Creek Track, ~1.2 km N from Limestone Road, 32.5 km ENE of Benambra, 13 Dec. 2021, N.G. Walsh 9242, K.L. McDougall & E.A. James (MEL 2500746A); 320 m W of Limestone Road, S side of Little River, 8.75 km from Snowy River Road at Black Mountain, 8 Nov. 2018 J.R. McDonald 2163 & J.R. Turner (MEL 2466359A), 130 m W of Cowombat Track, 5.1 km W of Mount Cobberas No. 1., 8 Jan. 2012 J.R. Turner 1193 A (MEL 2437668A), Alpine National Park. Beside Limestone Track, ~1.2 km from the Benambra–Wulgulmerang road, 3 Feb. 2010 J.A. Jeanes 2336, N.G. Walsh, R. Hare & G. Lay (MEL 2337969A).
Bossiaea fragrans subsp. milesiae (K.L.McDougall) K.L.McDougall & N.G.Walsh, comb. nov., stat. nov.
Bossiaea milesiae K.L.McDougall Telopea 12(3): 358–359 (2009). Type: New South Wales: South Coast. Brogo River, ~25 km NNW of Bega (~1 km downstream from Brogo Dam), K.L.McDougall 1193, J.Miles & P.Jeuch, 12 Sep. 2006 (holo: NSW 785654; iso: CANB 766111, MEL 2318264).
All of the species included in the current study, except B. riparia, were noted by Thompson (2012) as being rhizomatous. However, rhizomes have not been confirmed for some species and seem unlikely for B. bombayensis and B. fragrans subsp. milesiae; the known populations of both of these taxa were largely consumed by the 2019–20 bushfires and all regeneration observed has been from seed.
The genomic analysis (Fig. 2d) identified two populations of B. riparia as being distinct (GDP 2) from the other three populations assessed. GDP 2 plants occur in NSW, whereas other B. riparia plants tested are from Tas. and Vic. Many of the characters of GDP 2 plants from Site 11 in Kosciuszko National Park are at the lower end in size for the species overall. However, we were unable to find consistent morphological differences to support recognition of additional taxa within the current concept of B. riparia. Bossiaea riparia is highly variable in habit and floral characteristics. Despite that variability, the genomic analysis placed geographically distant populations from Tas. and Vic. together, and so it seems that the current concept of B. riparia is reasonable. The genetic divergence identified is also geographic (with GDP 2 populations being the northern-most sampled) and perhaps simply represents the genetic extremes in this species. Bossiaea riparia is listed as endangered in Victoria under the Flora and Fauna Guarantee Act 1988, but not in other jurisdictions where it occurs. Despite its widespread distribution, most populations are very small in number and extent, and some populations represented by older collections have not been seen recently; a broader threatened species listing may be appropriate.
| 1 | Bracteoles generally falling before anthesis...2 Bracteoles generally persistent...9 |
| 2 | Flowers >15 mm long, with keel clearly longer than standard; pods 50–60 mm long (semi-arid regions)...B. walkeri Flowers <15 mm long, with keel shorter than or approximately equal to standard; pods 20–40 mm long (temperate regions)...3 |
| 3 | Upper calyx lobes somewhat quadrate, calyx lobes not chartaceous; longest inflorescence scale up to ~1 mm long...4 Upper calyx lobes triangular (resembling lower lobes); calyx lobes distally brown and chartaceous; longest inflorescence scale >1 mm long...5 |
| 4 | Cladodes greyish at flowering owing to epicuticular wax; standard 9–10 mm long (excluding claw), pedicels 1–2.5 mm long, with bracteole abscission scars concealed by scales...B. fragrans subsp. fragrans Cladodes green at flowering; standard 7–9 mm long (excluding claw); pedicels 2–4 mm long; bracteole abscission scars generally visible (approximately at level of scale apices or slightly more distal)...B. fragrans subsp. milesiae |
| 5 | Largest scales of cladodes >1 mm wide from midrib to margin, with conspicuous branching venation; cladodes with recess at nodes up to 5 mm deep...B. bracteosa Scales of cladodes <1 mm wide from midrib to margin, with venation obscure; cladodes with recess at nodes absent or <1 mm deep...6 |
| 6 | Broadest cladodes generally >5 mm wide; flowers occasionally paired in bud; standard <9.5 mm wide (Vic. only)...7 Broadest cladodes generally <5 mm wide; flowers solitary; standard >9.5 mm wide (NSW only)...8 |
| 7 | Cladodes greyish-green; calyx lobes >1.5 mm long; standard usually >9 mm long with a claw >2.5 mm long; keel >8.5 mm long...B. vombata subsp. vombata Cladodes green to greyish-green; calyx lobes up to 1.5 mm long; standard up to 9 mm long with a claw up to 2 mm long; keel <8 mm long...B. vombata subsp. orientalis |
| 8 | Cladodes green (and appearing dark green in the wild); reproductive branches of cladodes usually <4 mm wide; calyx lobes <1.5 mm long; pods <6 mm wide...B. bombayensis Cladodes greyish-green; reproductive branches of cladodes usually >4 mm wide; calyx lobes ≥1.5 mm long; pods >6 mm wide...B.grayi |
| 9 | Petals without red markings except for a small flare on standard (northern Qld)...B. armitii Petals more extensively marked than above (southern Qld, NSW, Vic.)...10 |
| 10 | Bracteoles inserted on distal third of pedicel; cladodes with longest scales 2–2.5 mm long, with a tuft of hairs in axils (Eyre Peninsula, SA)...B. peninsularis Bracteoles inserted proximal to mid-pedicel or occasionally on middle-third; cladodes with longest scales 1–1.5(–2) mm long, glabrous or nearly so in axils (far eastern Australia)...11 |
| 11 | Keel dark red, glabrous; pods <25 mm long, ≤7 mm wide, with upper margin ~0.7 mm wide; seeds 1.5–2 mm long; new growth with scattered hairs on faces; inflorescence scales commonly 4 or more...B. riparia Keel pale (or sometimes with a pink tinge), with some apical hairs; pods >25 mm long, 7–12 mm wide, with upper margin 1–2 mm wide; seeds 3–4 mm long; new growth glabrous or with hairs ±estricted to margins; inflorescence scales 2...12 |
| 12 | Upper calyx lobes <2.5 mm wide; wings largely yellow (sometimes tinged red); bracteoles mostly <1.5 mm long; upper margin of pod 1–1.2 mm wide, with ridge angular...B. ensata Upper calyx-lobes >2.5 mm wide; wings purplish-brown; bracteoles mostly >1.5 mm long; upper margin of pod 1.5–2 mm wide, ±rounded...B. scolopendria |
Data availability
The data that support this study are available in the University of Sydney eScholarship Repository at https://doi.org/10.25910/0ca8-4b67 or https://ses.library.usyd.edu.au/handle/2123/32470.
Declaration of funding
This study received support from the NSW Department of Planning and Environment (then the Office of Environment and Heritage) through the Saving our Species conservation program.
Acknowledgements
We extend our appreciation to the traditional custodians of the land where our collections were conducted. Our research involved plant specimens obtained from Gundungurra, Ngarigu, Dhurga, Djirrigany, Dhudhuroa, Woiwurrung and Palawa Country. We acknowledge and honour the lasting connection that Indigenous peoples maintain with their ancestral territories and recognise their custodianship of these landscapes throughout history. Special thanks are extended to Rob Armstrong for invaluable assistance with the collections. Furthermore, we are grateful to Tim Rudman, Lorraine Perrins and James Wood from the Royal Tasmanian Botanical Gardens for their collaboration on the Derwent Bridge collection. Both collections were conducted under the auspices of the RTBG collection permit for reserved land, and we are thankful for their support in facilitating these efforts.
Author contributions
The author contributions for this scientific paper are as follows: K. L. McDougall and J.-Y. S. Yap were responsible for conceptualisation, whereas cladode sampling was conducted by K. L. McDougall, N. G. Walsh, E. A. James, N. Jario and J. Peterie. Genomic analysis and visualisation tasks were performed by E. S. McMaster, and taxonomy along with notes on species were provided by K. L. McDougall. and N. G. Walsh. The original draft of the manuscript was prepared by E. S. McMaster, J.-Y. S. Yap and K. L. McDougall. Additionally, M. Rossetto and E. A. James contributed to the review and editing process. Funding acquisition was spearheaded by J. Peterie who obtained partial funding through the Saving our Species program.
References
Amor MD, Johnson JC, James EA (2020) Identification of clonemates and genetic lineages using next-generation sequencing (ddRADseq) guides conservation of a rare species, Bossiaea vombata (Fabaceae). Perspectives in Plant Ecology, Evolution and Systematics 45, 125544.
| Crossref | Google Scholar |
Angeloni F, Ouborg NJ, Leimu R (2011) Meta-analysis on the association of population size and life history with inbreeding depression in plants. Biological Conservation 144, 35-43.
| Crossref | Google Scholar |
Barrett MD, Barrett RL (2015) Twenty-seven new species of vascular plants from Western Australia. Nuytsia—The Journal of the Western Australian Herbarium 26, 21-87.
| Crossref | Google Scholar |
Buckleton J, Curran J, Goudet J, Taylor D, Thiery A, Weir BS (2016) Population-specific F values for forensic STR markers: a worldwide survey. Forensic Science International: Genetics 23, 91-100.
| Crossref | Google Scholar |
Caballero A, Bravo I, Wang J (2017) Inbreeding load and purging: implications for the short-term survival and the conservation management of small populations. Heredity 118, 177-185.
| Crossref | Google Scholar | PubMed |
Chang CC, Chow CC, Tellier LCAM, Vattikuti S, Purcell SM, Lee JJ (2015) Second-generation PLINK: rising to the challenge of larger and richer datasets. GigaScience 4(1),.
| Crossref | Google Scholar |
Chifman J, Kubatko L (2014) Quartet inference from SNP data under the coalescent model. Bioinformatics 30, 3317-3324.
| Crossref | Google Scholar | PubMed |
Clausen RT (1941) On the use of the terms ‘subspecies’ and ‘variety’. Rhodora 43, 157-167.
| Google Scholar |
Commander L (2021) Florabank Guidelines: best practice guidelines for native seed collection and use. (Australian Government) Available at https://www.florabank.org.au/guidelines/
DeMauro MM (1993) Relationship of breeding system to rarity in the lakeside daisy (Hymenoxys acaulis var. glabra). Conservation Biology 7(3), 542-550.
| Crossref | Google Scholar |
Dobzhansky T (1952) Genetics and the origin of species. Copeia 1952, 287.
| Crossref | Google Scholar |
Duthie AB, Reid JM (2016) Evolution of inbreeding avoidance and inbreeding preference through mate choice among interacting relatives. The American Naturalist 188, 651-667.
| Crossref | Google Scholar | PubMed |
Fischer M, Hock M, Paschke M (2003) Low genetic variation reduces cross-compatibility and offspring fitness in populations of a narrow endemic plant with a self-incompatibility system. Conservation Genetics 4(3), 336.
| Crossref | Google Scholar |
Frankham R (2015) Genetic rescue of small inbred populations: meta-analysis reveals large and consistent benefits of gene flow. Molecular Ecology 24, 2610-2618.
| Crossref | Google Scholar | PubMed |
Fujii S, Kubo K, Takayama S (2016) Non-self- and self-recognition models in plant self-incompatibility. Nature Plants 2, 16130.
| Crossref | Google Scholar | PubMed |
Garnier-Géré P, Chikhi L (2013) Population subdivision, Hardy–Weinberg Equilibrium and the Wahlund Effect. In ‘Encyclopedia of Life Sciences’. (Wiley) 10.1002/9780470015902.a0005446.pub3
Harrison PA, Breed MF, Broadhurst L, Byrne M, Commander L, Coates D, Krauss S, van der Merwe M, Miller M, Rossetto M (2021) Florabank guidelines module 5: seed sourcing. In ‘Florabank guidelines: best practice guidelines for native seed collection and use’. (Ed. LE Commander) (Australian Government) Available at https://www.florabank.org.au/guidelines/?link=Module5
Huson DH (1998) SplitsTree: analyzing and visualizing evolutionary data. Bioinformatics 14, 68-73.
| Crossref | Google Scholar | PubMed |
Jaccoud D, Peng K, Feinstein D, Kilian A (2001) Diversity Arrays: a solid state technology for sequence information independent genotyping. Nucleic Acids Research 29, e25.
| Crossref | Google Scholar | PubMed |
Johnson MG, Pokorny L, Dodsworth S, Botigué LR, Cowan RS, Devault A, Eiserhardt WL, Epitawalage N, Forest F, Kim JT, Leebens-Mack JH, Leitch IJ, Maurin O, Soltis DE, Soltis PS, Wong GK, Baker WJ, Wickett NJ (2019) A universal probe set for targeted sequencing of 353 nuclear genes from any flowering plant designed using k-medoids clustering. Systematic Biology 68, 594-606.
| Crossref | Google Scholar | PubMed |
Jombart T (2008) adegenet: a R package for the multivariate analysis of genetic markers. Bioinformatics 24, 1403-1405.
| Crossref | Google Scholar | PubMed |
Keenan K, McGinnity P, Cross TF, Crozier WW, Prodöhl PA (2013) diveRsity: an R package for the estimation and exploration of population genetics parameters and their associated errors. Methods in Ecology and Evolution 4, 782-788.
| Crossref | Google Scholar |
Kilian A, Wenzl P, Huttner E, Carling J, Xia L, Blois H, Caig V, Heller-Uszynska K, Jaccoud D, Hopper C, Aschenbrenner-Kilian M, Evers M, Peng K, Cayla C, Hok P, Uszynski G (2012) Diversity arrays technology: a generic genome profiling technology on open platforms. In ‘Data Production and Analysis in Population Genomics: Methods and Protocols’. (Eds F Pompanon, A Bonin) Methods in Molecular Biology 888,. 67–89. (Humana Press: Totowa, NJ, USA) 10.1007/978-1-61779-870-2_5
Leaché AD, Oaks JR (2017) The utility of single nucleotide polymorphism (SNP) data in phylogenetics. Annual Review of Ecology, Evolution, and Systematics 48(1), 69-84.
| Crossref | Google Scholar |
McDonnell AJ, Baker WJ, Dodsworth S, Forest F, Graham SW, Johnson MG, Pokorny L, Tate J, Wicke S, Wickett NJ (2021) Exploring Angiosperms353: Developing and applying a universal toolkit for flowering plant phylogenomics. Applications in Plant Sciences 9, e11443.
| Crossref | Google Scholar | PubMed |
McDougall KL (2009) Four new species related to Bossiaea bracteosa F.Muell. ex Benth. in south-eastern Australia. Telopea 12(3), 347-360.
| Crossref | Google Scholar |
McMaster E, Lu-Irving P, van der Merwe M, Ho S, Rossetto M (2024) Evaluating kinship estimation methods for reduced-representation SNP data in non-model species. In TechRxiv, 20 April 2024. [Preprint] https://www.techrxiv.org/doi/full/10.22541/au.171360147.73891624/v1
Manichaikul A, Mychaleckyj JC, Rich SS, Daly K, Sale M, Chen W-M (2010) Robust relationship inference in genome-wide association studies. Bioinformatics 26(22), 2867-2873.
| Crossref | Google Scholar |
Navascués M, Stoeckel S, Mariette S (2010) Genetic diversity and fitness in small populations of partially asexual, self-incompatible plants. Heredity 104, 482-492.
| Crossref | Google Scholar | PubMed |
NSW Scientific Committee (2009) Bossiaea bombayensis – vulnerable species listing. (NSW Environment and Heritage) Available at http://www.environment.nsw.gov.au/topics/animals-and-plants/threatened-species/nsw-threatened-species-scientific-committee/determinations/final-determinations/2008-2010/bossiaea-bombayensis-vulnerable-species-listing
Potter S, Bragg JG, Turakulov R, Eldridge MDB, Deakin J, Kirkpatrick M, Edwards RJ, Moritz C (2021) Limited introgression between rock-wallabies with extensive chromosomal rearrangements. Molecular Biology and Evolution 39(1),.
| Crossref | Google Scholar |
Pickup M, Young AG (2007) Population size, self-incompatibility and genetic rescue in diploid and tetraploid races of Rutidosis leptorrhynchoides (Asteraceae). Heredity 100(3), 268-274.
| Crossref | Google Scholar |
Purcell S, Neale B, Todd-Brown K, Thomas L, Ferreira MAR, Bender D, Maller J, Sklar P, de Bakker PIW, Daly MJ, Sham PC (2007) PLINK: a tool set for whole-genome association and population-based linkage analyses. American Journal of Human Genetics 81(3), 559-575.
| Crossref | Google Scholar |
Reinartz JA, Les DH (1994) Bottleneck‐induced dissolution of self‐incompatibility and breeding system consequences in Aster furcatus (Asteraceae). American Journal of Botany 81(4), 446-455.
| Crossref | Google Scholar |
Reydon TAC, Kunz W (2021) Classification below the species level: when are infraspecific groups biologically meaningful? Biological Journal of the Linnean Society 134, 246-254.
| Crossref | Google Scholar |
Ross J (2008) A new species of Bossiaea (Fabaceae: Bossiaeeae) from Victoria. Muelleria: An Australian Journal of Botany 26, 54-56.
| Crossref | Google Scholar |
Rossetto M, Bragg J, Kilian A, McPherson H, van der Merwe M, Wilson PD (2018) Restore and renew: a genomics‐era framework for species provenance delimitation. Restoration Ecology 27(3), 538-548.
| Crossref | Google Scholar |
Rossetto M, Yap J-YS, Lemmon J, Bain D, Bragg J, Hogbin P, Gallagher R, Rutherford S, Summerell B, Wilson TC (2021) A conservation genomics workflow to guide practical management actions. Global Ecology and Conservation 26, e01492.
| Crossref | Google Scholar |
Schoen DJ, Brown AHD (2001) The conservation of wild plant species in seed banks: attention to both taxonomic coverage and population biology will improve the role of seed banks as conservation tools. BioScience 51, 960-966.
| Crossref | Google Scholar |
Tallmon D, Luikart G, Waples R (2004) The alluring simplicity and complex reality of genetic rescue. Trends in Ecology & Evolution 19(9), 489-496.
| Crossref | Google Scholar |
Thompson IR (2012) A revision of eastern Australian Bossiaea (Fabaceae: Bossiaeeae). Muelleria: An Australian Journal of Botany 30(2), 106-174.
| Crossref | Google Scholar |
Threatened Species Scientific Comittee (2017) Conservation advice: Bossiaea fragrans. (Department of Climate Change, Energy, the Environment and Water) Available at https://www.environment.gov.au/biodiversity/threatened/species/pubs/84403-conservation-advice-11052018.pdf
Whiteley AR, Fitzpatrick SW, Funk WC, Tallmon DA (2015) Genetic rescue to the rescue. Trends in Ecology & Evolution 30, 42-49.
| Crossref | Google Scholar | PubMed |
Whitelaw BL, Finn JK, Zenger KR, Cooke IR, Morse P, Strugnell JM (2023) SNP data reveals the complex and diverse evolutionary history of the blue-ringed octopus genus (Octopodidae: Hapalochlaena) in the Asia-Pacific. Molecular Phylogenetics and Evolution 186, 107827.
| Crossref | Google Scholar |
Yu G, Smith DK, Zhu H, Guan Y, Lam TT-Y (2017) ggtree: an R package for visualization and annotation of phylogenetic trees with their covariates and other associated data. Methods in Ecology and Evolution 8, 28-36.
| Crossref | Google Scholar |
Zheng X, Levine D, Shen J, Gogarten SM, Laurie C, Weir BS (2012) A high-performance computing toolset for relatedness and principal component analysis of SNP data. Bioinformatics 28, 3326-3328.
| Crossref | Google Scholar | PubMed |