

Low-emission beef production in the Southern Rangelands of Western Australia: an analysis of herd structure and stocking rate experiencing droughts
C. d’Abbadie A *
A *
A
Abstract
Reconciling profitable cattle production with rangeland health and reduced emissions is a key challenge in the southern rangelands of Western Australia (WA). Stocking rate and herd structure selection are crucial decisions to achieve this balance. This study assessed the emission profiles of three contrasting herd structures (weaner production, live export, and slaughter production), and three stocking rates within a herd–carbon accounting modelling framework. The analysis considers the impact of varying drought frequencies on these cattle production systems. Herd models were developed for the semiarid southern WA rangelands. Stocking rates were set at 100%, 80% and 66% of the government recommended rate. Drought events (represented by Decile 2 rainfall years) were introduced at different frequencies within a 30-year simulation period. Slaughter production with a 66% stocking rate exhibited the lowest and most consistent carbon footprint, averaging around 15 kg CO2 equivalents/kg liveweight sold. Higher stocking rates and weaner production systems generally resulted in increased carbon footprint variability. Selecting a herd structure producing heavy steers and heifers for slaughter, combined with a conservative stocking rate (66% of recommended), offers a combined economic and environmental benefit for cattle production in the southern rangelands of WA. This strategy promotes financial sustainability while minimising emissions and enhancing resilience to drought events.
Keywords: beef production, bioeconomic modelling, carbon footprint, drought, emissions, herd structure, Rangeland economics, Southern Rangelands, stocking rate.
Introduction
Extensive cattle production in Western Australia (WA) contributes to the state’s agricultural greenhouse gas (GHG) emissions. Although agriculture accounts for roughly 11% of WA’s total emissions (Department of Climate Change, Energy, the Environment and Water DCCEEW 2023), cattle production alone is responsible for approximately 30% of agricultural GHGs, with half likely originating from rangelands (Curnow et al. 2022). Enteric methane and manure emissions are the primary drivers of this carbon footprint (CF) (Table A1).
The Southern Rangelands of WA are characterised by semiarid shrublands with a highly variable climate and an average annual rainfall below 300 mm (Department of Primary Industries and Regional Development (DPIRD) 2022). In these environments, it is challenging to match the stocking rate to the carrying capacity of the rangelands (Burnside et al. 1995). Twenty percent of Australia’s land area, or the quarter of the 1.17 million cattle on pastoral stations in Western Australia, are found in the Southern Rangelands (Shackleton 2021). Throughout Australia, the majority land use on rangelands is extensive grazing. According to the Productivity Commission (2002), pastoral leasehold land makes up around 44% (338 million hectares) of Australia’s mainland, with 96 million hectares of the land being in Western Australia. Recent research has shed light on the emission profile of WA’s cattle herd. Studies suggest that the CF for the Southern Rangelands is around 18 kg carbon dioxide equivalents (CO2e)/kg liveweight, excluding land-use changes (Wiedemann et al. 2022, 2024). Wiedemann et al. (2024) propose that improvements in herd efficiency could reduce the CF to 15.8 kg CO2e/kg liveweight, potentially by increasing the proportion of grain-finished cattle, which reduces emissions (Table A2).
However, these studies offer average emission values, and do not account for the substantial variability within the Southern Rangelands. Climate fluctuations and differences in herd structures employed by pastoralists significantly affect emissions. For example, Bastin (2014) highlighted that the region experiences low-rainfall years (Decile 2) at least every decade. Additionally, Australian pastoral enterprises fall into three main categories (AusVet Animal Health Services 2006):
Specialised breeding: These enterprises raise cattle for sale at weaning.
Breeding and growing: These enterprises raise cattle beyond weaning for sale as yearlings, destined for finishing at feedlots or at specialised finishing operations.
Breeding and finishing: These enterprises raise cattle beyond weaning and finish them for slaughter, typically for domestic or export markets (Purvis 1986, 1988; Walsh 2009).
A recent study by d’Abbadie et al. (2024) explored the economic implications of various herd structures and stocking rates in response to drought frequency within the Southern Rangelands of WA. Their findings suggested that, with appropriate infrastructure, a herd structure focusing on heavy steers (breeding and finishing) could be more profitable than breeding and growing. Additionally, a low stocking rate appears to mitigate risk during frequent droughts while maintaining consistent market supply regardless of seasonality (Table A3).
Building on d’Abbadie et al. (2024), this paper investigates the carbon footprint associated with different herd structures and stocking rates under frequent drought scenarios. Three distinct herd structures combined with three stocking rates were analysed. Each combination was then exposed to various drought simulations, followed by a carbon footprint assessment to evaluate the resulting emissions over the study period (Table A4).
Methodology
Herd and carbon footprint modelling
This study employed two bioeconomic herd budgeting models, Breedcow and Dynama, developed by the Queensland Department of Agriculture and Fisheries (Holmes et al. 2017). These well-established models are used in this study in their latest versions without significant modifications. However, to ensure consistency and expedite analysis across models, an automated process in Visual Basic for Applications (VBA) for Microsof Excel was developed to run the multiple simulations (Table A5).
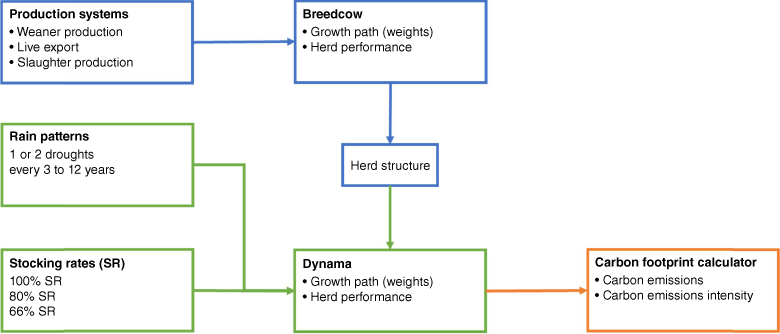
We opted for Breedcow and Dynama over other options like CLEM (An-Vo et al. 2024) due to their successful validation within Australian rangelands (Holmes et al. 2010; Walsh and Cowley 2016; Bowen et al. 2019; Bowen and Chudleigh 2021; d’Abbadie et al. 2024). Fig 1 depicts the conceptual framework employed to assess various herd structures and stocking rates, utilising inputs and outputs from both models (Table A6).
The conceptual framework for the simulations. The blue boxes depict the inputs and outputs used to build the initial herd structures. The green boxes outline the additional inputs and outputs used to assess the production systems and the stocking rate strategies in a dynamic environment. The orange box corresponds to the carbon footprint calculator.
The Greenhouse Gas Protocol Agricultural Guidance (GGP 2015) categorises greenhouse gas (GHG) emissions into three scopes: Scope 1 (direct emissions from farm activities), Scope 2 (emissions from purchased energy), and Scope 3 (indirect emissions in the value chain). This study focuses on Scope 1, 2, and embedded emissions (Scope 3) associated with pastoral station inputs’ production and transportation. (In the Australian context, a pastoral station is an extensive pastoral property that runs livestock (cattle or sheep). These properties are known as ranches in USA or estancias in Argentina. In this paper we will refer to them as stations.)
We applied the PICCC’s carbon footprint accounting framework (Primary Industries Climate Challenges Centre, Lopez et al. 2024) and excluded soil organic and above-ground carbon sequestration from the analysis. The model generates the station’s total annual emissions (tonnes CO2e) and carbon footprint (kg CO2e/kg liveweight sold). The analysis boundary is the perimeter of the station.
Modelling assumptions
The study assumes a semiarid mulga (Acacia aneura) property, with no permanent surface water but fully developed infrastructure (fences, trap yards, water points) allowing full animal control and segregation of breeder, steer, and heifer herds. One-year-old heifers are placed in a separate paddock to ensure first joining at 2 years old. Heifer retention allows for herd growth or maintenance.
Continuous mating with peak calving in December was assumed. Two efficient musters (April–May and August–September) ensured high weaning efficiency, feed demand control, and accurate budgeting. This strategy promotes high conception rates, low mortality, and herd genetic control (Rangelands Natural Resource Management (RNRM) 2017; McQuie and McQuie 2018). April–May musters focus on weaning, whereas August–September musters focus on selling steers and heifers. Culling of unmated cows, bulls, and cows of suitable weight occurred during both musters.
The assumed breed for all herd structures was Droughtmaster. An 85% conception rate is assumed for all age groups except 3–4 year old cows (40%). Expected calf loss from conception to weaning was assumed to be 8%, with a 5% death rate for cows and bulls, and 1% for unmated cows. The bull-to-cow ratio was 3.5%, with 15% annual bull herd replacement. Cows not producing calves were segregated for a year to gain weight before sale, and culled after 10 years. These parameters were based on discussions with pastoralists, available data, and trial data (e.g. Fletcher et al. 1996; Materne et al. 2017; Rangelands Natural Resource Management (RNRM) 2017; McQuie and McQuie 2018).
Growth paths used in the models were also based on discussions with pastoralists (Rangelands Natural Resource Management (RNRM) 2017; McQuie and McQuie 2018), trial data (Fletcher et al. 1996; Materne et al. 2017), and were adjusted to reflect carrying capacity and ensure a rising plane of nutrition for improved meat quality. Cows weaning calves received an additional 0.35 Animal Equivalents (AE) (Holmes et al. 2017). Table 1 details starting and ending weights for various animal classes. The models primarily follow the Old Man Plains trial strategy (Materne et al. 2017; Bastin et al. 2024), where stocking rates are adjusted to match land carrying capacity.
| Cattle class | Start weight | End weight | Paddock weight at sale | |
|---|---|---|---|---|
| Weaners | 150 | 250 | 205 | |
| Heifers 1 year | 240 | 410 | 340 | |
| Heifers 2 years | 410 | 450 | 500 | |
| Cows >3 years | 450 | 450 | 500 | |
| Steers 1 year | 255 | 430 | 380 | |
| Steers 2 years | 430 | not defined | 560 | |
| Bulls all ages | 700 | 700 | 700 |
With the above assumptions, we evaluated three herd structures and three stocking rates, resulting in nine scenarios. Herd structures target specific weights for relevant steer and heifer markets:
Weaner Production: Selling 6–10 month old weaner steers and culling weaner heifers at 210 and 200 kg, respectively.
Live Export Production: Selling 18–24 month old steers and culling heifers for live export at 380 and 340 kg, respectively.
Slaughter Cattle Production: Selling 30–36 month old steers and heifers weighing 560 and 500 kg, respectively, finished on pasture.
The three stocking rates assumed are:
5000 AE (100% of the recommended stocking rate)
4000 AE (80% of the recommended stocking rate)
3300 AE (66% of the recommended stocking rate)
The 100% stocking rate represents a long-term sustainable rate that matches available feed with stock numbers in average rainfall years, which is recommended to station managers by government agencies. The two lower stocking rates allow for building a ‘vegetative haystack’ reserve for use during drought years, reducing the need for destocking and accelerating herd recovery to desired levels.
Dynamic models were developed to simulate the impact of drought using the Dynama model previously described. Drought was represented as a Decile 2 rainfall year; that is, a year with rainfall amounts that fall between the 10th and 20th percentiles of the historical distribution of annual rainfall for that region. These models encompass weaner, live export, and slaughter herd structures and cover a 30-year period.
The models initially established a steady state based on a Decile 5 rainfall year (above-average rainfall). Drought frequencies were then introduced, consisting of one or two consecutive drought years (Decile 2 rainfall) occurring every 3–12 years throughout the 30-year analysis. In other words, the model examined the effect of ‘Y’ consecutive drought years every ‘X’ number of years. For example, a frequency of 2:5 represents two consecutive drought years followed by three average rainfall years, repeated throughout the 30-year simulation.
Drought years in the models primarily reflected decreased summer rainfall, while nondrought years represented Decile 5 rainfall. Recovery lengths aligned with observed rainfall variability in the Southern Rangelands, typically involving one drought followed by 4–5 years of recovery, or consecutive droughts followed by 6–9 years of recovery.
When responding to drought, destocking prioritised retaining the breeding herd. Steers and unmated cows were sold first, with the level of destocking informed by discussions with pastoralists. The model assumed destocking occurs during the first mustering event (April–May). Table 2 presents the modelled stocking rates for both Decile 5 and Decile 2 rainfall years. As shown in Table 2, the model assumed that the pasture quality and quantity in a Decile 5 rainfall year is enough to carry 5000 AE, and a Decile 2 rainfall year provides enough feed to carry 2500 AE. The underlying assumption is that when suffering a drought, lower stocking rates that provide haystack will have quality feed to survive the drought. This is because this environment is water limited and not nutrient limited (Materne et al. 2017).
| Stocking rate strategy | 100% SR | 80% SR | 66% SR | |
|---|---|---|---|---|
| Initial steady state | 100% SR [5000] | 80% SR [4000] | 66% SR [3300] | |
| Drought: Year 1 | 50% SR [2500] | 70% SR [3500] | 66% SR [3300] | |
| Drought: Year 2 | 50% SR [2500] | 50% SR [2500] | 66% SR [3300] | |
| After the drought | 100% SR [5000] | 80% SR [4000] | 66% SR [3300] | |
| Logic | Availability of feed | Use the haystack to preserve the breeding herd. | Use the haystack to preserve the breeding herd. |
Crucially, the analysis assumed that following a drought, the pastoralist did not purchase additional cattle to rebuild the herd. Whereas such purchases are more feasible in eastern Australia with their larger cattle populations, WA pastoralists are more likely to retain breeding stock, with only opportunistic purchases potentially accelerating recovery.
Results
Station emissions
This section explores the impact of herd structure, stocking rate, and drought frequency on station emissions (total annual emissions) and carbon footprint (emissions per kg of liveweight sold).
Fig. 2 presents the average annual station emissions across a 30-year simulation for various scenarios. When considering one drought event, the 80% stocking rate (SR) scenario consistently displayed the highest emissions, regardless of the chosen herd structure. These emissions further increased with more frequent droughts due to minimal postdrought herd recovery. In contrast, the 66% SR scenario maintained a stable emission profile across all drought frequencies as it avoided destocking during droughts. The 100% SR scenario exhibited increasing emissions with more frequent droughts due to the need to destock.
The station’s 30-year average carbon emissions with different drought frequencies for one or two consecutive droughts for the slaughter production, live export and weaner production systems, and their associated stocking rates (SR).
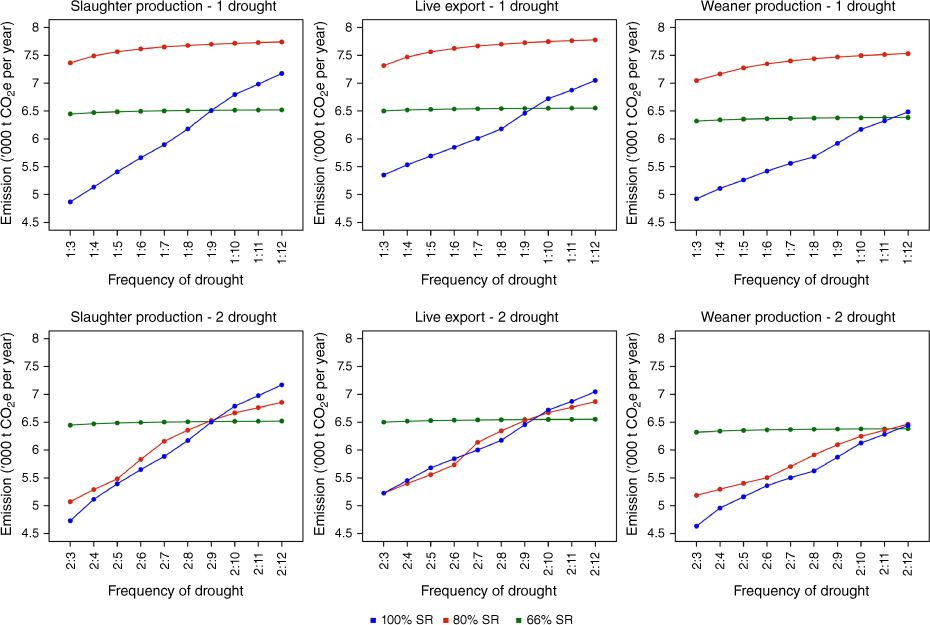
A key driver of station emissions is animal numbers. Although the 100% SR scenario must destock during droughts due to feed limitations, the self-replacing herd requires a long period (10–12 years depending on the herd structure) to recover to the target stocking rate.
Similar results hold true for scenarios with two consecutive droughts. The 66% SR and 100% SR scenarios exhibited comparable emission patterns to those observed with one drought. The 80% SR scenario mirrored the 100% SR scenario, again regardless of the chosen herd structure. This similarity arose because the 80% SR required destocking during the second drought year as grazing pressure from cattle exceeded available feed resources.
Fig. 2 also suggests minimal differences in emissions between herd structures. However, the weaner production system exhibited slightly lower emissions compared to the other two systems. This can be attributed to the combined influence of animal numbers and animal weight on emissions. Although the weaner production system maintained a larger herd size, the average animal weight was lower compared to the other structures with the same carried AEs. The emissions coming from the breeder herd in the weaner production system are in proportion larger than the other production systems (see Appendix).
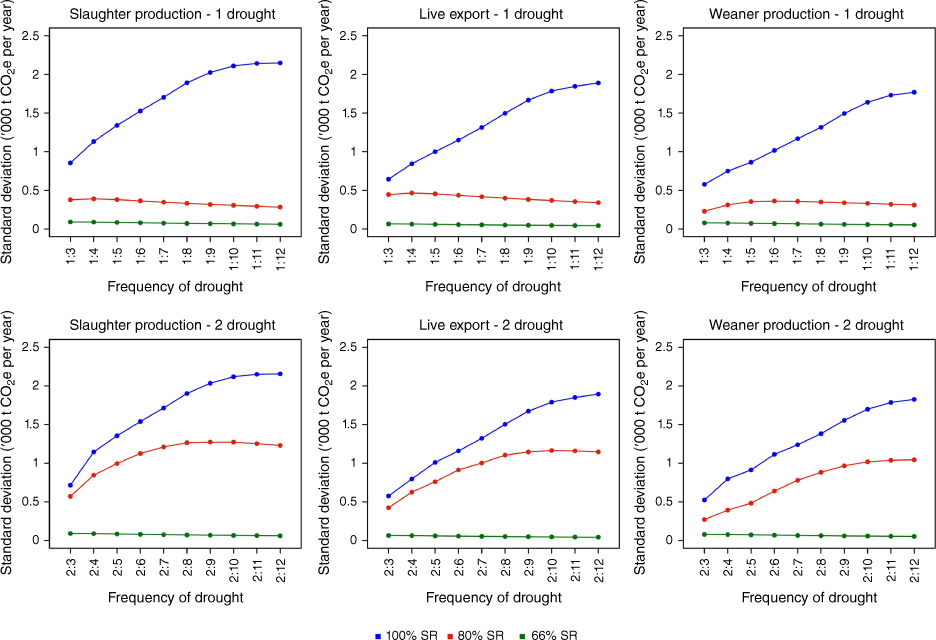
Although Fig. 2 depicts average emissions, understanding the variability across simulations is useful. Fig. 3 presents the standard deviation of station emissions for each scenario. The 66% SR scenario demonstrated the lowest standard deviation, indicating minimal emission fluctuation across the simulation period due to the consistent herd size regardless of drought frequency. Conversely, the 100% SR scenario experienced the highest standard deviation due to destocking and subsequent herd rebuilding.
Carbon footprint of sold livestock
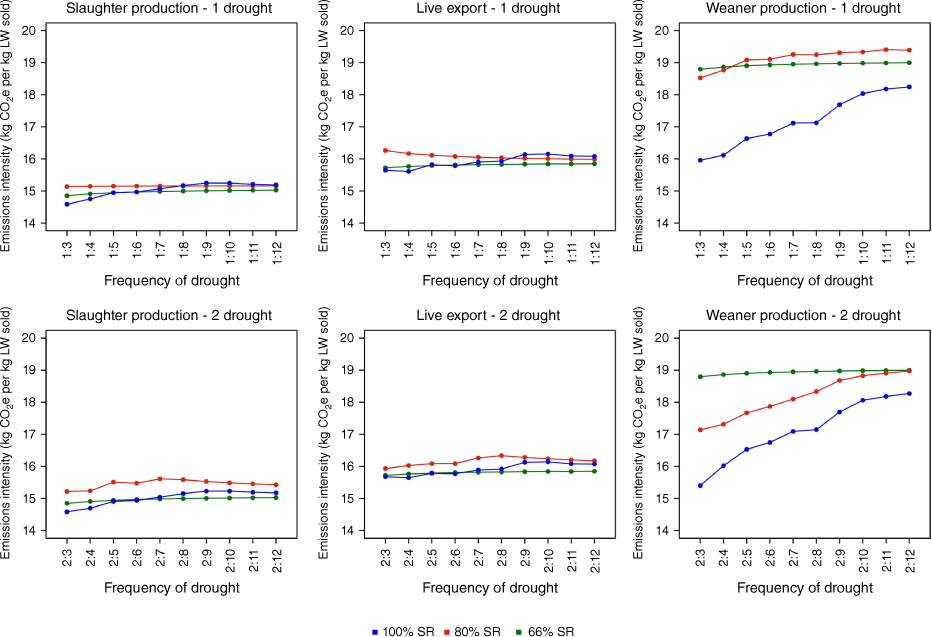
Figs 4 and 5 explore the average and standard deviation of the carbon footprint (emissions per kg of liveweight sold) for each herd structure and stocking rate across different drought frequencies.
The station’s 30-year average carbon emissions intensity per kilogram of lifeweight (LW) sold with different drought frequencies for one or two consecutive droughts for the slaughter production, live export and weaner production system, and their associated stocking rates (SR).
The station’s 30-year carbon emissions intensity standard deviation per kilogram of lifeweight (LW) sold with different drought frequencies for one or two consecutive droughts for the slaughter production, live export and weaner production system, and their associated stocking rates (SR).
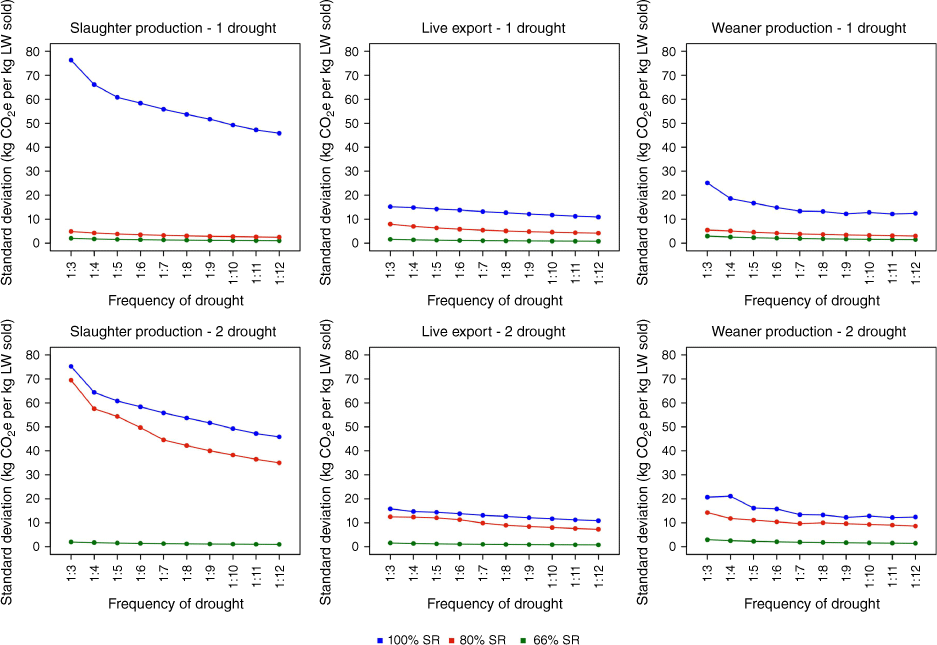
Independent of stocking rate, the slaughter production system consistently exhibited the lowest carbon footprint, followed by the live export production system. The weaner production system showed more variable results. Whereas the 66% SR scenario maintained high but stable emission intensities, the 100% SR scenario experienced significant shifts depending on the drought frequency. Frequent droughts significantly decreased the carbon footprint of the weaner production system at 100% SR. A similar trend is observed for the weaner production system at 80% SR that experienced double droughts. This trend can be explained by the focus on weaner production in this system, which necessitates a larger breeding herd component. During destocking, the breeder herd size is reduced, requiring subsequent rebuilding while simultaneously selling weaners. This strategy affects overall emissions; however, the system maintains immediate livestock sales postdrought, resulting in a low emission intensity profile. The impact of the breeder herd and the other animal classes to the emissions distribution can be observed in the Appendix.
Considering the variability of the carbon footprint, the 66% SR scenario consistently exhibited the lowest standard deviation across all herd structures and drought periods. Stocking rates necessitating destocking led to a significant increase in carbon footprint variability. For instance, the slaughter production system at 100% SR displayed the highest standard deviation for carbon footprint. This is a consequence of the substantial postdrought herd destocking and the extended period required to rebuild the herd and produce the targeted 2-year-old steers and heifers for sale.
Discussion
This study identified a combination of factors that minimise the carbon footprint of grass-finished cattle in the WA southern rangelands. Specifically, a slaughter production system with a 66% stocking rate yielded the lowest and most consistent carbon footprint, averaging around 15 kg CO2e per kg of liveweight sold. Notably, this combination aligns with previous research demonstrating its superior profitability and drought resilience (d’Abbadie et al. 2024). These findings suggest that adopting this management strategy can simultaneously enhance financial performance, environmental sustainability, and resilience to drought events.
This study’s estimated carbon footprint (15 kg CO2e/kg) was lower than current regional estimates (approximately 18 kg CO2e/kg sold) reported by Wiedemann et al. (2022, 2024). This difference can be primarily attributed to the herd efficiency assumptions employed in this study, given this study assumed herd conception rates and death rates exceeding industry averages (McLean et al. 2023; Wiedemann et al. 2024), on the assumption they are achievable (Rangelands Natural Resource Management (RNRM) 2017). A more efficient herd translates to higher output for a given stocking rate, consequently reducing the carbon footprint per unit of production.
Wiedemann et al. (2024) explored a scenario where the emission profile could decrease to 15.3 kg CO2e/kg liveweight sold by incorporating a more efficient herd and finishing a higher proportion of steers with grain in a feedlot. Although this suggests that grain finishing could potentially lower emissions, this study focused solely on the grass-finished cattle production systems prevalent in the southern rangelands. Our findings emphasise the importance of herd efficiency in achieving market-weight and condition for slaughter steers while maintaining a fully grass-fed production system.
It is crucial to acknowledge that neither this study nor the referenced literature account for land-use carbon sequestration when calculating the carbon footprint of sold cattle. Currently, carbon sequestration projects implemented on nonlivestock-competing land uses may contribute to an overall reduction in emissions for these enterprises (Hacker and McDonald 2021). Future research efforts should integrate these land-use considerations for a more comprehensive assessment.
The results of this study suggest that a two-pronged approach is critical for reducing the carbon footprint of cattle production in the southern rangelands. Firstly, there is a need to prioritise herd efficiency improvements, potentially through improved breeding practices and animal health management. Secondly, a reduction in stocking rates appears beneficial. As demonstrated by d’Abbadie et al. (2024), such adjustments can enhance both drought resilience and profitability for pastoral stations in the southern rangelands. Additionally, maintaining lower stocking rates can contribute to a more stable and lower carbon footprint profile. These combined strategies could appeal to consumers willing to pay a premium either for low-emission beef or lower stocking rate systems that better preserve the environment conditions of rangelands.
Conclusion
This study investigated the influence of herd structure, stocking rate, and drought frequency on both station emissions and the carbon footprint of liveweight sold from grass-finished cattle production in the southern rangelands of Western Australia. The findings highlight the potential to achieve a lower carbon footprint (approximately 15 kg CO2e/kg liveweight sold) through a combination of a slaughter production system and a 66% stocking rate. This strategy aligns with previous research indicating its advantages in terms of profitability and drought resilience. Furthermore, these results emphasise the critical role of herd efficiency in minimising emissions within a grass-fed production system.
Although this study provides valuable insights, there are opportunities for further research. A key area for future exploration is the integration of land-use carbon sequestration into the carbon footprint assessment. Current practices often exclude this crucial factor, potentially underestimating the positive environmental contribution of extensive grazing systems. By quantifying the carbon sequestration potential of the southern rangelands, a more holistic understanding of the environmental impact of cattle production in this region can be established.
Incorporating land-use carbon sequestration necessitates a multifaceted approach. Firstly, robust data on soil carbon stocks and sequestration rates across different vegetation types and grazing regimes within the rangelands is required. Secondly, the development of practical modelling tools that integrate both livestock production and land-use carbon sequestration would be highly beneficial for informing sustainable grazing management strategies.
By understanding the interplay between herd efficiency, stocking rates, land-use practices, and carbon sequestration, stakeholders in the southern rangelands can make informed decisions that optimise both productivity and environmental sustainability. Such advancements can position the region’s cattle industry to meet growing consumer demand for low-emission beef while maintaining its economic viability and ecological integrity.
Data availability
The data that support this study will be shared upon reasonable request to the corresponding author.
Acknowledgements
The author would like to thank Prof. Ross Kingwell whose comments have improved this manuscript.
References
An-Vo D, Cobon D, Owens J, Liedloff A, Cowan T, Power S (2024) Impacts of environmental feedbacks on the production of a Central Queensland beef enterprise in a future climate. Agricultural Systems 214, 103838.
| Crossref | Google Scholar |
Bastin G, Cowley R, Friedel M, Materne C (2024) Applying two remotely-sensed methods for monitoring grazing impacts in the Australian arid zone. The Rangeland Journal 45(4), 141-159.
| Crossref | Google Scholar |
Bowen MK, Chudleigh F (2021) An economic framework to evaluate alternative management strategies for beef enterprises in northern Australia. Animal Production Science 61, 271-281.
| Crossref | Google Scholar |
Bowen MK, Chudleigh F, Whish G, Phelps D (2019) Central West Mitchell Grasslands livestock production systems. Preparing for, responding to, and recovering from drought. (State of Queensland, Department of Agriculture and Fisheries, Queensland: Brisbane) Available at https://futurebeef.com.au/projects/improving-profitability-and-resilience-of-beef-and-sheep-businesses-in-queensland-preparing-for-responding-to-and-recovering-from-drought/ [Accessed 19 October 2021]
d’Abbadie C, Kingwell R, Vercoe P, Plunkett B, Peggs A (2024) Heavy steers and heifers run at low stocking rates enhance drought resilience in a pastoral region of Australia. Agricultural Systems 218, 103993.
| Crossref | Google Scholar |
Department of Primary Industries and Regional Development (DPIRD) (2022) Rangelands of Western Australia. (Perth, Western Australia). Available at https://www.agric.wa.gov.au/rangelands/rangelands-western-australia [accessed July 2024]
GGP (2015) GHG Protocol Agricultural Guidance. Greenhouse Gas Protocol. p. 103. Available at https://ghgprotocol.org/sites/default/files/standards/GHG%20Protocol%20Agricultural%20Guidance%20%28April%2026%29_0.pdf [accessed March 2024]
Hacker RB, McDonald SE (2021) Prospects for sustainable use of the pastoral areas of Australia’s southern rangelands: a synthesis. The Rangeland Journal 43, 185-209.
| Crossref | Google Scholar |
Holmes WE, Chudleigh F, Simpson G (2017) ‘Breedcow and Dynama herd budgeting software package. A manual of budgeting procedures for extensive beef herds. Version 6.02.’ (Department of Agriculture and Fisheries: Brisbane, Queensland) Available at https://breedcowdynama.com.au [accessed 19 October 2021]
Lopez MB, Dunn J, Wiedemann S, Eckard R (2024) A Greenhouse Accounting Framework for Beef and Sheep properties based on the Australian National Greenhouse Gas Inventory methodology. Available at http://piccc.org.au/Tools [updated February 2024]
Purvis JR (1986) Nurture the land: My philosophies of pastoral management in central Australia. The Australian Rangeland Journal 8, 110-117.
| Crossref | Google Scholar |
Purvis JR (1988) The story of Umberumbra. Range Management Newsletter, 88, 13-20. Available at https://www.austrangesoc.com.au/wp-content/uploads/2019/05/88-3_Aug_1988_RMN.pdf [accessed March 2024]
Shackleton T (2021) ‘The pastoral industry snapshot. Pastoral Lands Board.’ (Government of Western Australia) Available at https://www.wa.gov.au/system/files/2024-06/plb-pastoral-industry-snapshot-december-2021.pdf [accessed July 2024]
Walsh D, Cowley R (2016) Optimizing beef business performance in northern Australia: what can 30 years of commercial innovation teach us? The Rangeland Journal 38, 291-305.
| Crossref | Google Scholar |
Wiedemann S, Longworth E, Campbell D, Duff K (2022) Carbon footprint and reduction options for Harvest Road Group operations. Available at https://www.mla.com.au/globalassets/mla-corporate/news-and-events/documents/p.psh.1259-final-report-public-240322-3.pdf
Wiedemann S, Longworth E, O’Shannessy R (2024) Net greenhouse-gas emissions and reduction opportunities in the Western Australian beef industry. Animal Production Science 64, AN23111.
| Crossref | Google Scholar |
Appendix
The following tables show the station’s 30-year average distribution Scope 1 (Sc 1) and Scope 3 (Sc 3) carbon emissions as per Lopez et al. (2024). Note that there are no Scope 2 emissions as the assumption is that the station is not connected to the electricity grid. Scope 1 emissions are subdivided by origin of the herd class: Breeders, Heifers, Steers and Bulls. These emissions encompass enteric methane, manure management, leaching and run off and atmospheric deposition directly related to the animal class activity. The remaining emissions within Scope 1 are reported as others.
| Production system | Stocking rate | Emissions origin | Frequency of drought | ||||||||||
|---|---|---|---|---|---|---|---|---|---|---|---|---|---|
| 1:3 (%) | 1:4 (%) | 1:5 (%) | 1:6 (%) | 1:7 (%) | 1:8 (%) | 1:9 (%) | 1:10 (%) | 1:11 (%) | 1:12 (%) | ||||
| Slaughter production | 66% SR | Sc 1 – Breeders | 49.1 | 49.2 | 49.2 | 49.3 | 49.3 | 49.3 | 49.4 | 49.4 | 49.4 | 49.4 | |
| Sc 1 – Heifers | 17.9 | 17.9 | 17.9 | 17.8 | 17.8 | 17.8 | 17.8 | 17.8 | 17.8 | 17.8 | |||
| Sc 1 – Steers | 28.7 | 28.6 | 28.6 | 28.6 | 28.5 | 28.5 | 28.5 | 28.5 | 28.5 | 28.5 | |||
| Sc 1 – Bulls | 1.5 | 1.5 | 1.5 | 1.5 | 1.5 | 1.5 | 1.5 | 1.5 | 1.5 | 1.5 | |||
| Sc 1 – Other | 1.5 | 1.5 | 1.5 | 1.5 | 1.5 | 1.5 | 1.5 | 1.5 | 1.5 | 1.5 | |||
| Sc 3 | 1.3 | 1.3 | 1.3 | 1.3 | 1.3 | 1.3 | 1.3 | 1.3 | 1.3 | 1.3 | |||
| 80% SR | Sc 1 – Breeders | 49.8 | 49.9 | 49.9 | 49.9 | 50.0 | 50.0 | 50.0 | 50.0 | 50.0 | 50.0 | ||
| Sc 1 – Heifers | 18.7 | 18.5 | 18.3 | 18.2 | 18.1 | 18.1 | 18.0 | 18.0 | 18.0 | 18.0 | |||
| Sc 1 – Steers | 27.3 | 27.5 | 27.7 | 27.8 | 27.9 | 27.9 | 28.0 | 28.0 | 28.0 | 28.0 | |||
| Sc 1 – Bulls | 1.6 | 1.6 | 1.6 | 1.5 | 1.5 | 1.5 | 1.5 | 1.5 | 1.5 | 1.5 | |||
| Sc 1 – Other | 1.3 | 1.3 | 1.3 | 1.3 | 1.3 | 1.3 | 1.3 | 1.3 | 1.3 | 1.3 | |||
| Sc 3 | 1.3 | 1.2 | 1.2 | 1.2 | 1.2 | 1.2 | 1.2 | 1.2 | 1.2 | 1.2 | |||
| 100% SR | Sc 1 – Breeders | 58.6 | 56.5 | 54.9 | 53.8 | 53.0 | 52.5 | 52.1 | 51.8 | 51.6 | 51.4 | ||
| Sc 1 – Heifers | 20.9 | 20.1 | 19.6 | 19.3 | 19.1 | 18.9 | 18.8 | 18.6 | 18.6 | 18.5 | |||
| Sc 1 – Steers | 14.5 | 17.6 | 20.0 | 21.6 | 22.8 | 23.7 | 24.4 | 24.9 | 25.4 | 25.7 | |||
| Sc 1 – Bulls | 2.1 | 2.0 | 1.9 | 1.8 | 1.8 | 1.8 | 1.7 | 1.7 | 1.7 | 1.7 | |||
| Sc 1 – Other | 2.0 | 1.8 | 1.7 | 1.7 | 1.6 | 1.5 | 1.5 | 1.4 | 1.4 | 1.3 | |||
| Sc 3 | 2.0 | 1.9 | 1.8 | 1.7 | 1.7 | 1.6 | 1.6 | 1.5 | 1.5 | 1.4 | |||
| Production system | Stocking rate | Emissions origin | Frequency of drought | ||||||||||
|---|---|---|---|---|---|---|---|---|---|---|---|---|---|
| 2:3 (%) | 2:4 (%) | 2:5 (%) | 2:6 (%) | 2:7 (%) | 2:8 (%) | 2:9 (%) | 2:10 (%) | 2:11 (%) | 2:12 (%) | ||||
| Slaughter production | 66% SR | Sc 1 – Breeders | 49.1 | 49.2 | 49.2 | 49.3 | 49.3 | 49.3 | 49.4 | 49.4 | 49.4 | 49.4 | |
| Sc 1 – Heifers | 17.9 | 17.9 | 17.9 | 17.8 | 17.8 | 17.8 | 17.8 | 17.8 | 17.8 | 17.8 | |||
| Sc 1 – Steers | 28.7 | 28.6 | 28.6 | 28.6 | 28.5 | 28.5 | 28.5 | 28.5 | 28.5 | 28.5 | |||
| Sc 1 – Bulls | 1.5 | 1.5 | 1.5 | 1.5 | 1.5 | 1.5 | 1.5 | 1.5 | 1.5 | 1.5 | |||
| Sc 1 – Other | 1.5 | 1.5 | 1.5 | 1.5 | 1.5 | 1.5 | 1.5 | 1.5 | 1.5 | 1.5 | |||
| Sc 3 | 1.3 | 1.3 | 1.3 | 1.3 | 1.3 | 1.3 | 1.3 | 1.3 | 1.3 | 1.3 | |||
| 80% SR | Sc 1 – Breeders | 57.8 | 55.6 | 54.4 | 53.0 | 52.5 | 52.3 | 52.0 | 51.8 | 51.6 | 51.4 | ||
| Sc 1 – Heifers | 19.7 | 19.4 | 19.1 | 19.1 | 18.9 | 18.7 | 18.6 | 18.5 | 18.4 | 18.4 | |||
| Sc 1 – Steers | 16.9 | 19.6 | 21.3 | 23.0 | 23.9 | 24.3 | 24.9 | 25.3 | 25.6 | 25.8 | |||
| Sc 1 – Bulls | 2.1 | 1.9 | 1.8 | 1.8 | 1.7 | 1.7 | 1.7 | 1.7 | 1.6 | 1.6 | |||
| Sc 1 – Other | 1.9 | 1.8 | 1.8 | 1.6 | 1.5 | 1.5 | 1.5 | 1.4 | 1.4 | 1.4 | |||
| Sc 3 | 1.7 | 1.6 | 1.6 | 1.5 | 1.4 | 1.4 | 1.4 | 1.4 | 1.3 | 1.3 | |||
| 100% SR | Sc 1 – Breeders | 59.5 | 56.4 | 54.8 | 53.7 | 53.0 | 52.4 | 52.1 | 51.8 | 51.6 | 51.4 | ||
| Sc 1 – Heifers | 21.2 | 20.1 | 19.6 | 19.3 | 19.1 | 18.9 | 18.8 | 18.6 | 18.5 | 18.5 | |||
| Sc 1 – Steers | 13.1 | 17.7 | 20.1 | 21.7 | 22.8 | 23.7 | 24.4 | 25.0 | 25.4 | 25.7 | |||
| Sc 1 – Bulls | 2.2 | 2.0 | 1.9 | 1.9 | 1.8 | 1.8 | 1.7 | 1.7 | 1.7 | 1.7 | |||
| Sc 1 – Other | 2.0 | 1.9 | 1.8 | 1.7 | 1.6 | 1.5 | 1.5 | 1.4 | 1.4 | 1.3 | |||
| Sc 3 | 2.0 | 1.9 | 1.8 | 1.7 | 1.7 | 1.6 | 1.6 | 1.5 | 1.5 | 1.4 | |||
| Production system | Stocking rate | Emissions origin | Frequency of drought | ||||||||||
|---|---|---|---|---|---|---|---|---|---|---|---|---|---|
| 1:3 (%) | 1:4 (%) | 1:5 (%) | 1:6 (%) | 1:7 (%) | 1:8 (%) | 1:9 (%) | 1:10 (%) | 1:11 (%) | 1:12 (%) | ||||
| Live export | 66% SR | Sc 1 – Breeders | 56.3 | 56.3 | 56.4 | 56.4 | 56.4 | 56.4 | 56.4 | 56.5 | 56.5 | 56.5 | |
| Sc 1 – Heifers | 20.3 | 20.3 | 20.3 | 20.3 | 20.3 | 20.3 | 20.2 | 20.2 | 20.2 | 20.2 | |||
| Sc 1 – Steers | 18.6 | 18.6 | 18.6 | 18.6 | 18.5 | 18.5 | 18.5 | 18.5 | 18.5 | 18.5 | |||
| Sc 1 – Bulls | 1.9 | 1.9 | 1.9 | 1.9 | 1.9 | 1.9 | 1.9 | 1.9 | 1.9 | 1.9 | |||
| Sc 1 – Other | 1.5 | 1.5 | 1.5 | 1.5 | 1.5 | 1.5 | 1.5 | 1.5 | 1.5 | 1.5 | |||
| Sc 3 | 1.4 | 1.4 | 1.4 | 1.4 | 1.4 | 1.4 | 1.4 | 1.4 | 1.4 | 1.4 | |||
| 80% SR | Sc 1 – Breeders | 57.7 | 57.5 | 57.4 | 57.3 | 57.3 | 57.2 | 57.2 | 57.2 | 57.1 | 57.1 | ||
| Sc 1 – Heifers | 21.0 | 20.8 | 20.7 | 20.6 | 20.5 | 20.5 | 20.4 | 20.4 | 20.4 | 20.3 | |||
| Sc 1 – Steers | 16.4 | 16.9 | 17.3 | 17.5 | 17.6 | 17.7 | 17.8 | 17.9 | 17.9 | 18.0 | |||
| Sc 1 – Bulls | 2.0 | 2.0 | 1.9 | 1.9 | 1.9 | 1.9 | 1.9 | 1.9 | 1.9 | 1.9 | |||
| Sc 1 – Other | 1.3 | 1.3 | 1.3 | 1.3 | 1.3 | 1.3 | 1.2 | 1.2 | 1.2 | 1.2 | |||
| Sc 3 | 1.5 | 1.5 | 1.5 | 1.5 | 1.4 | 1.4 | 1.4 | 1.4 | 1.4 | 1.4 | |||
| 100% SR | Sc 1 – Breeders | 60.2 | 59.6 | 59.2 | 58.8 | 58.5 | 58.3 | 58.2 | 58.1 | 58.1 | 58.0 | ||
| Sc 1 – Heifers | 21.3 | 21.1 | 20.8 | 20.6 | 20.6 | 20.5 | 20.4 | 20.4 | 20.3 | 20.3 | |||
| Sc 1 – Steers | 12.5 | 13.6 | 14.4 | 15.0 | 15.5 | 15.9 | 16.2 | 16.5 | 16.7 | 16.8 | |||
| Sc 1 – Bulls | 2.0 | 2.0 | 2.0 | 2.0 | 2.0 | 2.0 | 1.9 | 1.9 | 1.9 | 1.9 | |||
| Sc 1 – Other | 1.8 | 1.7 | 1.7 | 1.6 | 1.6 | 1.5 | 1.5 | 1.4 | 1.4 | 1.3 | |||
| Sc 3 | 2.1 | 2.0 | 1.9 | 1.9 | 1.9 | 1.8 | 1.7 | 1.7 | 1.7 | 1.6 | |||
| Production system | Stocking rate | Emissions origin | Frequency of drought | ||||||||||
|---|---|---|---|---|---|---|---|---|---|---|---|---|---|
| 2:3 (%) | 2:4 (%) | 2:5 (%) | 2:6 (%) | 2:7 (%) | 2:8 (%) | 2:9 (%) | 2:10 (%) | 2:1 (%)1 | 2:12 (%) | ||||
| Live export | 66% SR | Sc 1 – Breeders | 56.3 | 56.3 | 56.4 | 56.4 | 56.4 | 56.4 | 56.4 | 56.5 | 56.5 | 56.5 | |
| Sc 1 – Heifers | 20.3 | 20.3 | 20.3 | 20.3 | 20.3 | 20.3 | 20.2 | 20.2 | 20.2 | 20.2 | |||
| Sc 1 – Steers | 18.6 | 18.6 | 18.6 | 18.6 | 18.5 | 18.5 | 18.5 | 18.5 | 18.5 | 18.5 | |||
| Sc 1 – Bulls | 1.9 | 1.9 | 1.9 | 1.9 | 1.9 | 1.9 | 1.9 | 1.9 | 1.9 | 1.9 | |||
| Sc 1 – Other | 1.5 | 1.5 | 1.5 | 1.5 | 1.5 | 1.5 | 1.5 | 1.5 | 1.5 | 1.5 | |||
| Sc 3 | 1.4 | 1.4 | 1.4 | 1.4 | 1.4 | 1.4 | 1.4 | 1.4 | 1.4 | 1.4 | |||
| 80% SR | Sc 1 – Breeders | 61.2 | 60.1 | 59.5 | 58.9 | 58.6 | 58.4 | 58.2 | 58.0 | 57.9 | 57.8 | ||
| Sc 1 – Heifers | 20.9 | 20.5 | 20.5 | 20.4 | 20.6 | 20.6 | 20.5 | 20.5 | 20.4 | 20.4 | |||
| Sc 1 – Steers | 12.0 | 13.7 | 14.5 | 15.2 | 15.6 | 15.9 | 16.2 | 16.5 | 16.7 | 16.9 | |||
| Sc 1 – Bulls | 2.2 | 2.1 | 2.1 | 2.0 | 2.0 | 2.0 | 2.0 | 2.0 | 2.0 | 2.0 | |||
| Sc 1 – Other | 1.9 | 1.8 | 1.7 | 1.7 | 1.5 | 1.5 | 1.5 | 1.4 | 1.4 | 1.4 | |||
| Sc 3 | 1.9 | 1.8 | 1.8 | 1.8 | 1.7 | 1.6 | 1.6 | 1.6 | 1.5 | 1.5 | |||
| 100% SR | Sc 1 – Breeders | 60.6 | 59.8 | 59.2 | 58.8 | 58.5 | 58.3 | 58.2 | 58.1 | 58.0 | 57.9 | ||
| Sc 1 – Heifers | 21.7 | 21.2 | 20.8 | 20.6 | 20.5 | 20.5 | 20.4 | 20.4 | 20.3 | 20.3 | |||
| Sc 1 – Steers | 11.6 | 13.2 | 14.4 | 15.0 | 15.5 | 15.9 | 16.2 | 16.5 | 16.7 | 16.9 | |||
| Sc 1 – Bulls | 2.1 | 2.1 | 2.0 | 2.0 | 2.0 | 2.0 | 2.0 | 1.9 | 1.9 | 1.9 | |||
| Sc 1 – Other | 1.8 | 1.7 | 1.7 | 1.6 | 1.6 | 1.5 | 1.5 | 1.4 | 1.4 | 1.3 | |||
| Sc 3 | 2.1 | 2.0 | 1.9 | 1.9 | 1.9 | 1.8 | 1.7 | 1.7 | 1.7 | 1.6 | |||
| Production system | Stocking rate | Emissions origin | Frequency of drought | ||||||||||
|---|---|---|---|---|---|---|---|---|---|---|---|---|---|
| 1:3 (%) | 1:4 (%) | 1:5 (%) | 1:6 (%) | 1:7 (%) | 1:8 (%) | 1:9 (%) | 1:10 (%) | 1:11 (%) | 1:12 (%) | ||||
| Weaner production | 66% SR | Sc 1 – Breeders | 68.7 | 68.8 | 68.8 | 68.8 | 68.8 | 68.9 | 68.9 | 68.9 | 68.9 | 68.9 | |
| Sc 1 – Heifers | 18.2 | 18.1 | 18.1 | 18.1 | 18.1 | 18.1 | 18.1 | 18.1 | 18.0 | 18.0 | |||
| Sc 1 – Steers | 7.6 | 7.6 | 7.6 | 7.6 | 7.6 | 7.5 | 7.5 | 7.5 | 7.5 | 7.5 | |||
| Sc 1 – Bulls | 2.3 | 2.3 | 2.3 | 2.3 | 2.3 | 2.3 | 2.3 | 2.3 | 2.3 | 2.3 | |||
| Sc 1 – Other | 1.5 | 1.5 | 1.5 | 1.5 | 1.5 | 1.5 | 1.5 | 1.5 | 1.5 | 1.5 | |||
| Sc 3 | 1.7 | 1.7 | 1.7 | 1.7 | 1.7 | 1.7 | 1.7 | 1.7 | 1.7 | 1.7 | |||
| 80% SR | Sc 1 – Breeders | 66.8 | 67.4 | 67.8 | 68.1 | 68.3 | 68.4 | 68.5 | 68.6 | 68.7 | 68.8 | ||
| Sc 1 – Heifers | 21.0 | 20.2 | 19.8 | 19.4 | 19.2 | 19.0 | 18.9 | 18.8 | 18.7 | 18.7 | |||
| Sc 1 – Steers | 6.7 | 6.9 | 7.0 | 7.1 | 7.2 | 7.2 | 7.2 | 7.3 | 7.3 | 7.3 | |||
| Sc 1 – Bulls | 2.3 | 2.3 | 2.3 | 2.3 | 2.3 | 2.3 | 2.3 | 2.3 | 2.3 | 2.3 | |||
| Sc 1 – Other | 1.4 | 1.3 | 1.3 | 1.3 | 1.3 | 1.3 | 1.3 | 1.3 | 1.3 | 1.3 | |||
| Sc 3 | 1.8 | 1.8 | 1.7 | 1.7 | 1.7 | 1.7 | 1.7 | 1.7 | 1.7 | 1.7 | |||
| 100% SR | Sc 1 – Breeders | 63.7 | 63.7 | 63.9 | 63.9 | 64.1 | 64.4 | 64.9 | 65.4 | 65.8 | 66.0 | ||
| Sc 1 – Heifers | 24.7 | 24.3 | 24.1 | 23.9 | 23.6 | 23.3 | 22.8 | 22.3 | 21.9 | 21.7 | |||
| Sc 1 – Steers | 4.9 | 5.5 | 5.7 | 6.0 | 6.2 | 6.3 | 6.5 | 6.6 | 6.7 | 6.7 | |||
| Sc 1 – Bulls | 2.2 | 2.2 | 2.2 | 2.2 | 2.2 | 2.2 | 2.2 | 2.2 | 2.2 | 2.2 | |||
| Sc 1 – Other | 1.9 | 1.9 | 1.8 | 1.7 | 1.7 | 1.6 | 1.6 | 1.5 | 1.5 | 1.5 | |||
| Sc 3 | 2.6 | 2.4 | 2.3 | 2.3 | 2.2 | 2.2 | 2.1 | 2.0 | 2.0 | 2.0 | |||
| Production system | Stocking rate | Emissions origin | Frequency of drought | ||||||||||
|---|---|---|---|---|---|---|---|---|---|---|---|---|---|
| 2:3 (%) | 2:4 (%) | 2:5 (%) | 2:6 (%) | 2:7 (%) | 2:8 (%) | 2:9 (%) | 2:10 (%) | 2:11 (%) | 2:12 (%) | ||||
| Weaner production | 66% SR | Sc 1 – Breeders | 68.7 | 68.8 | 68.8 | 68.8 | 68.8 | 68.9 | 68.9 | 68.9 | 68.9 | 68.9 | |
| Sc 1 – Heifers | 18.2 | 18.1 | 18.1 | 18.1 | 18.1 | 18.1 | 18.1 | 18.1 | 18.0 | 18.0 | |||
| Sc 1 – Steers | 7.6 | 7.6 | 7.6 | 7.6 | 7.6 | 7.5 | 7.5 | 7.5 | 7.5 | 7.5 | |||
| Sc 1 – Bulls | 2.3 | 2.3 | 2.3 | 2.3 | 2.3 | 2.3 | 2.3 | 2.3 | 2.3 | 2.3 | |||
| Sc 1 – Other | 1.5 | 1.5 | 1.5 | 1.5 | 1.5 | 1.5 | 1.5 | 1.5 | 1.5 | 1.5 | |||
| Sc 3 | 1.7 | 1.7 | 1.7 | 1.7 | 1.7 | 1.7 | 1.7 | 1.7 | 1.7 | 1.7 | |||
| 80% SR | Sc 1 – Breeders | 65.2 | 65.6 | 65.5 | 65.8 | 66.3 | 66.0 | 66.4 | 66.8 | 67.0 | 67.3 | ||
| Sc 1 – Heifers | 23.4 | 22.7 | 22.5 | 22.2 | 21.5 | 21.7 | 21.2 | 20.8 | 20.5 | 20.3 | |||
| Sc 1 – Steers | 5.1 | 5.5 | 5.8 | 6.1 | 6.3 | 6.5 | 6.7 | 6.8 | 6.8 | 6.9 | |||
| Sc 1 – Bulls | 2.3 | 2.3 | 2.3 | 2.3 | 2.3 | 2.3 | 2.3 | 2.3 | 2.3 | 2.3 | |||
| Sc 1 – Other | 1.9 | 1.8 | 1.8 | 1.8 | 1.7 | 1.6 | 1.6 | 1.5 | 1.5 | 1.5 | |||
| Sc 3 | 2.1 | 2.1 | 2.1 | 2.0 | 2.0 | 1.9 | 1.9 | 1.9 | 1.8 | 1.8 | |||
| 100% SR | Sc 1 – Breeders | 63.7 | 63.9 | 64.4 | 64.4 | 64.6 | 64.8 | 65.3 | 65.7 | 66.1 | 66.3 | ||
| Sc 1 – Heifers | 26.0 | 25.0 | 24.1 | 23.8 | 23.4 | 23.0 | 22.5 | 22.1 | 21.7 | 21.5 | |||
| Sc 1 – Steers | 3.4 | 4.5 | 5.1 | 5.5 | 5.8 | 6.1 | 6.3 | 6.4 | 6.5 | 6.6 | |||
| Sc 1 – Bulls | 2.3 | 2.3 | 2.3 | 2.3 | 2.2 | 2.2 | 2.2 | 2.2 | 2.2 | 2.2 | |||
| Sc 1 – Other | 2.1 | 1.9 | 1.8 | 1.8 | 1.7 | 1.7 | 1.6 | 1.5 | 1.5 | 1.5 | |||
| Sc 3 | 2.4 | 2.5 | 2.3 | 2.3 | 2.2 | 2.2 | 2.1 | 2.1 | 2.0 | 2.0 | |||