An evaluation of the DDH/100 mm stocking rate index and an alternative approach to stocking rate estimation
R. B. Hacker A B and W. J. Smith AA NSW Department of Primary Industries, Trangie Agricultural Research Centre, PMB 19, Trangie, NSW 2823, Australia.
B Corresponding author. Email: ron.hacker@dpi.nsw.gov.au
The Rangeland Journal 29(2) 139-148 https://doi.org/10.1071/RJ07001
Submitted: 8 January 2007 Accepted: 19 July 2007 Published: 24 October 2007
Abstract
Long-term data for (simulated) daily pasture growth and moving 12-monthly rainfall totals were used to examine the performance of the DDH/100 mm stocking rate index under theoretically ideal management for three locations in the Western Division of NSW. Stocking rate was adjusted either monthly or biannually based on rolling 12-monthly values for either pasture growth or rainfall. Under these ‘ideal’ conditions, monthly values of the index fluctuated widely around the carrying capacity benchmark. In practice, such comparisons would not provide a reliable assessment of the sustainability of the current stocking rate or of the need to adjust stock number to match seasonal conditions.
Stocking rates calculated from pasture growth estimates were similar to those derived simply from rainfall and the carrying capacity benchmark, and produced similar levels of pasture utilisation. This ‘benchmark method’ of stocking rate determination thus provides a readily calculated, dynamic benchmark against which actual stocking rate may be compared.
Due to lag effects, application of calculated proper stocking rates may lead to excessive pasture utilisation under low rainfall conditions (12-monthly totals less than 120–150 mm for the locations studied or, as a rule of thumb, the 10th percentile). Continuous paddock monitoring and projection of 12-monthly rainfall totals are therefore essential components of sustainable management.
Short-term trends in the stocking rate index, driven by rainfall at constant stocking rate, will not provide any generally reliable indication of impending dry spells or feed deficits.
Additional keywords: benchmark method, carrying capacity, proper stocking, tactical grazing, utilisation.
Introduction
Decisions regarding stocking rate are a major means by which rangeland livestock producers manage total grazing pressure, i.e. the balance between total forage demand and forage supply. Failure to achieve an appropriate balance can limit animal production and eventually degrade landscape function (Freudenberger et al. 1997). However, estimating the forage available is difficult under extensive conditions, and individuals routinely use a wide variety of environmental cues reflecting weather, livestock condition and behaviour, feral animals, and the state of vegetation and soil to assist with this process (Carman et al. 1998). Any tool that will assist with this fundamental aspect of management decision making has potential to contribute significantly to the economic and ecological sustainability of rangeland pastoralism.
One tool currently promoted to livestock producers, particularly by advocates of ‘time-control grazing methods’ (McCosker 2000), is the relative stocking rate index DDH/100 mm (DSE days per ha per 100 mm of annual rainfall) (Bartle 2003; Martyn 2005). This indicator is used in conjunction with, and is derived from, a grazing chart which is used to plan and record the number of livestock-days of grazing in each paddock. The index is calculated monthly from rainfall and DSE days accumulated over a moving 12-month window. Animal growth path may be ignored in practice so that the value of DSE days is often an estimate only.
Two main approaches to use of the index have been advocated. The first (Bartle 2003) involves ongoing adjustment of animal numbers to keep the actual value of DDH/100 mm within about ±10% of a ‘carrying capacity benchmark’ derived from the long-term carrying capacity (DSE days/ha) and average annual rainfall. Excessive movement of the index above or below this benchmark implies overstocking or understocking, respectively, for the current seasonal conditions. A variation of this approach (Guest and Guest 2005) is to regard the carrying capacity benchmark as a ‘ceiling’ that should not be exceeded, rather than a target, since beyond this point rainfall rather than stock numbers determine the value of the index and the opportunity for ‘control’ is lost. Generally, this approach implies that if a property were always appropriately stocked in relation to seasonal conditions, the DDH/100 mm index should closely track the carrying capacity benchmark.
The second approach involves pre-planned response to short-term trends in the index based on the assertion that ‘…a rising actual DDH/100 mm for two consecutive months is a key indicator of an impending dry spell or feed deficit’ (Martyn 2005). Assuming that stocking rate is held constant this is equivalent to asserting that ‘dry spells or feed deficits’ are usually associated with declining rolling annual rainfall totals for two consecutive months.
Since the index has intuitive appeal, and is calculated from data that are readily available to livestock producers, its widespread application could have considerable benefits for the pastoral industry. To date, however, neither of the approaches to index interpretation outlined above has been subject to objective assessment.
In this paper we provide such an assessment based on both the performance of the index under theoretically proper stocking – the expectation being that it should closely track the carrying capacity benchmark under these conditions – and its trend in relation to future seasonal conditions. We then discuss how the concepts embodied in the index may be used to assist practical stocking rate decisions.
Materials and methods
Our evaluation of the stocking rate index was based both on its performance under an ideal stocking regime and the extent to which its short-term trends could be expected to anticipate future seasonal conditions.
We used simulated estimates of daily pasture growth to calculate values of the carrying capacity benchmark (DDH/100 mm) and proper stocking rates (DSE/ha), the basis for defining the ideal stocking regime. The ‘proper stocking rate’ is intended to achieve ‘proper use’ of the pasture, or ‘proper stocking’, as defined by the Society for Range Management (1998). Although this glossary defines ‘carrying capacity’ in terms of average animal numbers that can be sustainably carried on a management unit, the term as used here refers to numbers expressed on a per ha basis.
Daily pasture growth
Daily pasture growth estimates (1 January 1889–31 December 2002) for Bourke, Cobar and Broken Hill, in the Western Division of NSW, were derived from the WinGRASP model (Littleboy and McKeon 1997). Several parameter sets for this model are available for western NSW (Richards et al. 2001) and pasture growth estimates were produced by running the appropriate set with daily meteorological data obtained from the SILO database (Table 1).

|
Pasture growth simulations thus broadly covered the range of rainfall seasonality typical of western NSW, from slight summer dominance (Bourke), through aseasonal or non-seasonal (Cobar) to slight winter dominance (Broken Hill), and a range of average annual rainfall values (Table 1).
Previous experience suggested that the parameter sets selected were the most appropriate for the locations. The ‘Kinchega’ set was derived from an experimental site ~80 km (directly) from Broken Hill and accommodates the growth of winter annuals characteristic of this environment. The ‘NSW average’ set was selected for Cobar and Bourke as it reflects winter growth better than alternative sets derived from more northerly environments dominated by C4 grasses.
Carrying capacity and the carrying capacity benchmark
Carrying capacity was calculated, after Johnston et al. (1996), as:

where CC is the carrying capacity in DSE/ha, AAPG is the average annual pasture growth (kg/ha) for calendar years, a is the proper use factor for annual pasture growth (sensu Society for Range Management 1998), set at 0.175 after Johnston et al. (1996), and b is the annual dry matter intake (kg) per DSE, set at 400 kg. Since the proper use factor is applied to annual growth it was not varied to accommodate changes in phenology or season. Similarly the consumption rate was set at a year-in-year-out level.
The carrying capacity benchmark, as described by Bartle (2003), was thus calculated as:

where AAR is the average annual rainfall (mm).
Proper stocking rate based on pasture utilisation (SRu)
Pasture growth data were used to estimate proper stocking rate on a monthly basis. Two possible approaches were considered. The first was to apply a proper use factor to pasture grown over some defined period, similar to both Johnston et al. (1996) and Scanlan et al. (1994). The second was to assume that all growth in excess of a residual amount required for ecological maintenance was available for consumption. We adopted the first approach. The second was rejected because at reasonable levels of residual biomass – say 300 kg/ha, considered by Short (1987) to be the approximate threshold for unrestricted intake by both sheep and kangaroos in semi-arid rangelands – the stocking rate required to consume all of the available biomass in high rainfall years would be impractical in extensive grazing systems. (Note that this intake threshold, derived from sheep and kangaroo functional responses in the semi-arid zone of NSW, is considerably below the pasture benchmarks established for sheep production in higher rainfall zones (Bell and Blackwood 1993). The difference probably results from the structure and accessibility to grazing of sparse rangeland vegetation compared with high rainfall pastures with close to 100% ground cover).
A hybrid procedure, in which the proper use factor was varied as a function of annual pasture growth, was not attempted since the form of the required relationship is unknown. The proper stocking rates used in this study may therefore be conservative in periods of high pasture growth.
We applied the proper use approach to pasture growth accumulated over a 12-month period. Annual pasture growth was considered more appropriate than seasonal growth, as used by Scanlan et al. (1994), in the absence of distinct wet and dry seasons. It also ensured that major variations in stocking rate (including destocking) did not result simply from the pulsed nature of pasture growth in semi-arid environments or from regular inter-seasonal variations in growth rate. At the same time, the interval was short enough to prevent any influence of seasonal conditions far removed from the period in which the proper stocking rate must be applied.
Proper stocking rate (DSE/ha) for current seasonal conditions was thus calculated on the first day of each month by substituting in Eqn 1 the actual pasture growth for the immediately preceding 12-month period, i.e.

where SRu is the proper stocking rate determined by the ‘utilisation’ method (DSE/ha), APG is the total pasture growth for the preceding 12 months (kg/ha) and a and b have the same values given above. Consumption was held constant, rather than altered in relation to pasture growth, because we considered that provision of adequate feed to animals was integral to proper stocking.
Proper stocking rate based on the carrying capacity benchmark (SRb)
As an alternative to the pasture utilisation approach, we also calculated proper stocking rates from the carrying capacity benchmark and 12-monthly rainfall (the benchmark method). The calculation takes the form:

where SRb is the proper stocking rate (DSE/ha) based on the carrying capacity benchmark, AR is the total rainfall (mm) for the preceding 12 months and the carrying capacity benchmark is as defined in Eqn 2. This calculation was performed on the first day of each month, based on rainfall for the 12-month period to the end of the preceding month.
Proper stocking rates derived by the utilisation and benchmark methods are not strictly independent. For calendar years, but not for other rolling 12-month periods, values of APG used in the utilisation method will be a subset of the 114 years of growth estimates that contribute to AAPG, and hence CC, in the benchmark method.
Calculation of the stocking rate index
Application of the proper stocking rates calculated monthly by either Eqn 3 or Eqn 4 represents the ideal (though impractical) stocking regime under which to evaluate the performance of the index. The proper stocking rate applied on the first day of each month is maintained until the first day of the next month when it is recalculated. If the stocking rate index can be usefully applied in the manner described by Bartle (2003) it should remain close to the carrying capacity benchmark under these conditions.
The value of the index, determined on the last day of each month, was thus calculated as:

where DDH/100 mm(u/b) is the stocking rate index for proper stocking rates determined by either the utilisation method (Eqn 3) or the benchmark method (Eqn 4), DDHi is the number of DSE days per ha accumulated in month i under the proper stocking rate, and AR is the total rainfall (mm) for the 12-month period over which grazing days are accumulated.
Biannual stocking rate adjustment
Because monthly stocking rate adjustment is impractical under extensive conditions, the operation of the index was also evaluated when adjustment occurred only in autumn and spring, a management scenario much more closely related to what might be achievable by livestock producers in the rangelands. Stocking rates calculated by either Eqn 3 or Eqn 4 were applied on 1 April and 1 October, and held constant between these dates. The DDH/100 mm(u/b) index was calculated, as usual, by Eqn 5.
Realised pasture utilisation
Even with monthly adjustment of stocking rate the desired level of pasture utilisation may not be achieved since the proper stocking rate is necessarily determined from past conditions but applied under future conditions. The level of pasture utilisation actually realised (realised utilisation, RU) can thus only be determined retrospectively and was calculated for the same 12-month periods implied by Eqn 5 as:

where RU is the realised utilisation (%) for proper stocking rates calculated by either the utilisation (u) or benchmark (b) method and TG is the total pasture growth (kg/ha) for the 12-month period over which RU is determined.
Trends in rainfall and the stocking rate index
To examine the assertion that a rising DDH/100 mm index for 2 consecutive months is indicative of ‘an impending dry spell or feed deficit’, rainfall records for the three locations were examined to establish dry periods and their antecedent rainfall conditions. The rationale is that if animal numbers remain constant over the two month period, as would be expected before identification of an impending dry spell, an upward trend in the index must be associated with a declining trend in the rolling 12-month rainfall totals.
‘Dry periods’ were considered to start in any month for which the 12-month moving rainfall total (to the end of that month) was less than either the median or 20th percentile value of annual (calendar year) totals, and to persist until the last month in which this condition was met. The rainfall trend at the start of each dry period was then determined by the trend in moving 12-month totals for the 2 months before the start of the period. A downward trend in these values, together with the inevitable downward trend from the second month to the start month, would lead to an increase in the DDH/100 mm index for 2 consecutive months at constant stocking rate. In addition, we identified periods of consistently declining rainfall totals over three consecutive months (i.e. 2 consecutive months of downward trend) in those periods not classified as ‘dry’ by the definitions above.
Results and discussion
Carrying capacity benchmarks
The carrying capacity benchmarks and actual carrying capacities derived from simulated pasture growth from 1889 to 2002 (Table 2) are somewhat higher than might be realised on many local properties but are not unreasonable for better quality land in good condition. The figure for Bourke, for example, is comparable with the value of 55.6 DDH/100 mm calculated from the ‘normal average stocking rate’ of a grazier practicing cell grazing on alluvial floodplains ~100 km distant (average annual rainfall 385 mm; G. Finlayson, personal communication).

|
Index behaviour
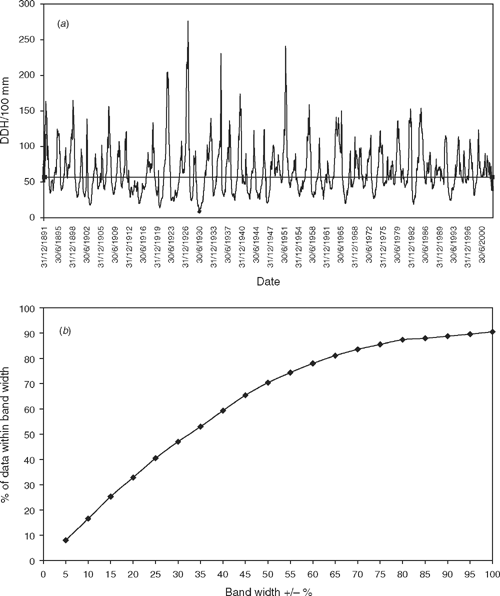
For all three locations, fewer than 20% of monthly values of the stocking rate index DDH/100 mm(u) lay within 10% of the carrying capacity benchmark when stocking rate was adjusted monthly based on Eqn 3; a small percentage of values varied from the benchmark by over 100% (Table 3; Fig. 1a, b).

|
|
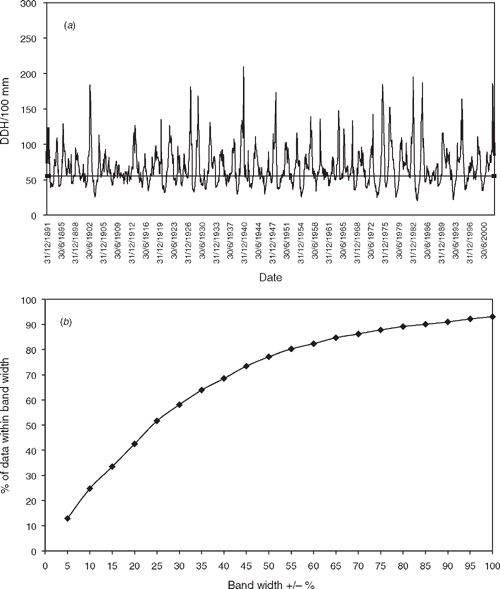
When proper stocking rate was calculated by use of the carrying capacity benchmark and antecedent rainfall, and stocking rate was again adjusted monthly, the performance of the index (DDH/100 mm(b)) was slightly improved but extreme fluctuations still occurred; again, a small percentage of observations deviated from the benchmark by over 100% of its value (Table 3; Fig. 2a, b).
|
Adjustment of stocking rate biannually reduced the percentage of index values within 10% of the benchmark (Table 3). Despite its impracticality the monthly adjustment regime thus appears to provide a better theoretical basis for evaluation of the index.
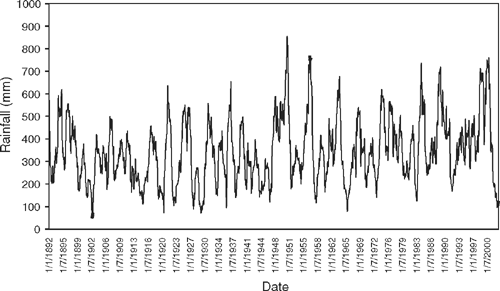
We interpret the erratic behaviour of the index to result from the interaction between widely varying 12-monthly rainfall totals (Fig. 3) and the lagged effects involved in determining proper stocking rate and calculating the stocking rate index. For any calculation of the index the 12 months of rainfall which contribute to the rolling total are not the same as those which determine the number of grazing days accumulated each month by either method of calculation, the offset varying from 12 months in the first month of the index period to one month in the last.
|
Fluctuation of the index about the benchmark, which is based on average annual rainfall, is not symmetrical but skewed towards higher values (Figs 1a, 2a). This reflects the distribution of 12-monthly rainfall totals which is typically not normal but skewed to the left, with median values below the mean. Mean and median values (mm) for rolling 12-month rainfall totals were 251 and 229, 347 and 330, and 373 and 353 for Broken Hill, Bourke and Cobar, respectively.
The performance of the index under proper stocking clearly does not satisfy the expectation implied by Bartle (2003). Under this stocking regime the index bears little relationship to the carrying capacity benchmark. In practice, therefore, comparisons between index values and a carrying capacity benchmark can provide no reliable information concerning the appropriateness of the actual stocking rate, or the need to adjust animal numbers to match seasonal conditions.
Better performance might perhaps be expected in less variable environments. However, even at Orange on the Central Tablelands of NSW (AAR 878 mm) the variation in rolling 12-month rainfall totals is sufficiently large (CV = 25.5%) that the behaviour of the index in relation to a carrying capacity benchmark would probably be almost as erratic as that described above.
Periods of ‘ideal’ index behaviour
Despite the deficiencies of the index when considered over the long run it is possible that short-term performance could at times conform to the ideal expectation.
With biannual stocking rate adjustment, approximating a practical grazing regime, relatively long periods in which the index remains within 10% of the benchmark under proper stocking do occur (Table 4). However, these periods are not so long that erratic behaviour would not be experienced within practical time frames.

|
Relationship between proper stocking rates calculated by alternative methods
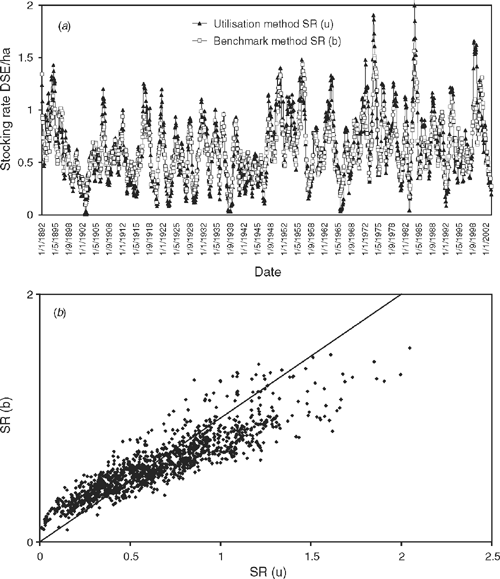
During the course of the study we observed that stocking rates calculated by the utilisation method (Eqn 3) and the benchmark method (Eqn 4) showed a similar pattern and were highly correlated at all locations, although peaks and troughs sometimes differed considerably (Fig. 4). Although the two methods are not entirely independent, as discussed above, we did not expect the strength of the relationship observed. At both Bourke and Cobar stocking rates calculated by the benchmark method tended to be conservative relative to the utilisation method although for Broken Hill the reverse was the case.
|
The correlation between the stocking rates calculated by the two methods suggests that SRb, which can be readily calculated from data available to producers, might be a useful surrogate for the more theoretical SRu.
Realised utilisation
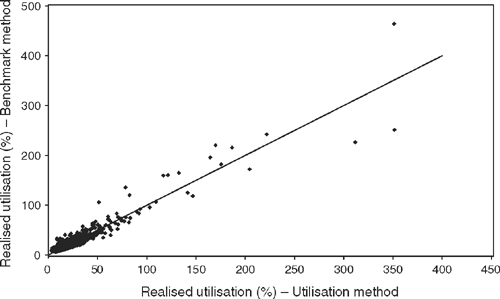
Realised utilisation was similar for proper stocking rates determined by the two methods (Fig. 5; Table 5). Some calculated values of RU were spurious (above 100%) since no destocking rules were applied in the simulation. However, within the range of utilisation levels that might be tolerated in practice, say 0–50%, the two methods produced comparable results.
|

|
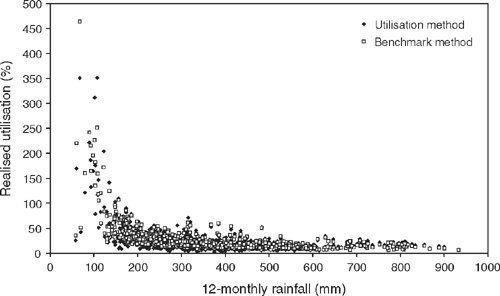
Spurious values occurred when rainfall or pasture growth in a 12-month window fell to very low levels. The example for Cobar (Fig. 6) is typical of the general relationship for all three locations. Very high or spurious values predominated when 12-monthly rainfall declined below ~150 mm. The corresponding values for Bourke and Broken Hill were 150 and 120 mm, respectively. As a conservative ‘rule of thumb’, the threshold could be taken as the 10th percentile for each location (185, 170 and 135 mm for Cobar, Bourke and Broken Hill, respectively). When 12-month rainfall totals fall below this level proper stocking rates calculated by either method are likely to lead to serious overgrazing.
|
Mean values of RU (Table 5) were from 5.3 to 8.4% higher than the theoretical value of 17.5%. Mean values varied little between locations but were slightly higher for the benchmark method. Higher variability of rainfall at Broken Hill (Fig. 3) resulted in more variable levels of RU for this location. Coefficients of variation for RU (ranging from 86.2 to 116.4%) were considerably higher than for 12-monthly rainfall (Fig. 3), probably reflecting the effect of low rainfall years in producing high or spurious values.
For both the utilisation and benchmark methods RU ≤20%, compared with the theoretical value of 17.5%, was achieved for ~60% of observations, while RU ≤30% was achieved for ~85% of observations. Discrepancies between RU and the theoretical value, and the presence of spurious values in the simulation, arise from the lag between the period used for stocking rate determination and the period of application. Such effects are inevitable given the variation in 12-monthly rainfall totals shown in Fig. 3. This variation also ensures that the DDH/100 mm index may fluctuate widely over short periods, even at constant stocking rate, and that any attempt to reduce the discrepancy between realised and theoretical values by altering the proper use factor is unlikely to succeed.
Stocking rate adjustment based on index trends
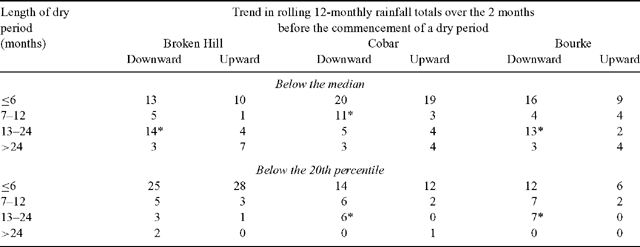
Short-term trends in rolling 12-monthly rainfall totals, and corresponding trends in the DDH/100 mm index at constant stocking rate, are unlikely to provide reliable evidence of impending dry spells or feed deficits (Table 6). Downward rainfall tends in this table would result in a rising index for 2 consecutive months. Although some significant shifts from the null (0.5) probability were observed they are not sufficiently general to lend confidence to the view that dry periods are reliably associated with a rising index over two consecutive months at constant stocking rate.
|
Furthermore, numerous instances were observed in which a declining trend in the rolling rainfall total over 2 months (i.e. over three consecutive observations) occurred outside the defined dry periods and their immediately preceding indicator period. Ignoring the magnitude of the trend, the number of these observations ranged from 79 to 95 for dry periods based on median rainfall and from 211 to 224 for dry periods defined by the 20th percentile criterion. Conditions leading to a rising index over 2 consecutive months, at constant stocking rate, thus, commonly occurred at times when no dry spell was imminent.
Hence, when trends in the stocking rate index are driven by rainfall they have no value as predictors of impending dry periods. Spatial and temporal variation in rainfall patterns prevents any general claim for the value of short-term index trends as predictors of future seasonal conditions, even for periods less than 6 months.
Application
Because SRb fairly closely tracks SRu, and results in similar levels of pasture utilisation, it provides a ‘dynamic benchmark’ which can be readily calculated and to which actual stocking rate may be compared. Although comparison of the DDH/100 mm index with the carrying capacity benchmark provides no useful signal for judging the appropriateness of the current stocking rate, comparison of actual stocking rate (DSE/ha) with SRb will provide such a signal and should be readily implemented by graziers provided a realistic estimate of carrying capacity is available. In practice, such an estimate will need to consider the condition of the land resource and its capacity to respond to rainfall, as well as the long-term stocking history of the property.
Although SR(b) will fluctuate widely because of variation in 12-monthly rainfall totals, this variation does not detract from its value as a dynamic benchmark in the way that similar variation in the DDH/100 mm index detracts from its value when compared with the static carrying capacity benchmark. The carrying capacity benchmark provides a measure of rainfall use efficiency for rangeland environments analogous to similar measures that have been widely applied to crop production in southern Australia (French and Schultz 1984a). The derived dynamic benchmark, SRb, represents the maximum grazing intensity that could be sustainably achieved under current conditions though in practice many factors, including the inability to source sufficient livestock, may prevent its realisation. The parallel with the application of water use efficiencies to crop production in the higher rainfall zone (French and Schultz 1984b) may again be drawn.
Although SRb will provide a dynamic benchmark for proper stocking continuous monitoring of the level of utilisation actually achieved will be required, as advocated by both Bartle (2003) and Martyn (2005), and is critical when rainfall in any 12-month period is below the 120–150 mm, or 10th percentile, threshold. Naïve application of the calculated proper stocking rate under these conditions could result in serious overgrazing. To be alerted to such situations livestock producers should project 12-month rainfall totals 3–6 months ahead based on monthly averages (not monthly medians which cannot be meaningfully added), with adjustment for seasonal climate outlooks at times when indicators such as the SOI Phase provide useful information. If rainfall is likely to fall below the threshold, application of the calculated stocking rate should be tempered by careful scrutiny of the levels of utilisation and ground cover observed in the field.
Conclusions
Comparison of the DDH/100 mm index with a fixed carrying capacity benchmark (DDH/100 mm(BM)) will not provide reliable information regarding the sustainability of the current stocking rate or the need to adjust stock numbers to match seasonal conditions. However, proper stocking rates calculated by applying rolling 12-month rainfall totals to the carrying capacity benchmark are similar to those determined from pasture utilisation, and result in similar levels of realised utilisation. The carrying capacity benchmark could thus be a useful tool if used to calculate proper stocking rates for comparison with actual stocking rate, essentially establishing a ‘dynamic benchmark’.
Use of a dynamic benchmark, however, will not replace the need for continuous monitoring of paddock utilisation levels, and other indicators, as the utilisation realised by the proper stocking rate sequence may greatly exceed sustainable levels under low rainfall conditions (12-monthly rainfall total less than 120–150 mm or, broadly, the 10th percentile).
Analysis of trends in 12-monthly rainfall totals before dry spells, which will be associated with complimentary trends in the DDH/100 mm index at constant stocking rate, indicate that they have no general significance as indicators of impending dry spells or feed deficits.
Acknowledgements
We are grateful to Peter Timmers for assistance with operation of the Win GRASP model and to Sean Martyn, Brian Marshall, and Mark Gardiner for discussion of the findings. Gavin Melville provided the significance tests reported in Table 6. Financial support was provided by Australian Wool Innovations Limited and Land & Water Australia through the Land Water and Wool program.
Bartle R.
(2003) Measuring stocking rate and carrying capacity relative to rainfall. Australian Farm Journal February, 28–29.

French R. J., Schultz J. E.
(1984a) Water use efficiency of wheat in a Mediterranean-type environment I. The relation between yield, water use and climate. Australian Journal of Agricultural Research 35, 743–764.
| Crossref | GoogleScholarGoogle Scholar |

French R. J., Schultz J. E.
(1984b) Water use efficiency of wheat in a Mediterranean-type environment II. Some limitations to efficiency. Australian Journal of Agricultural Research 35, 765–775.
| Crossref | GoogleScholarGoogle Scholar |

Guest J., Guest K.
(2005) Grazing chart means managing drought. Australian Farm Journal February, 64–65.

Johnston P. W.,
McKeon G. M., Day K. A.
(1996) Objective ‘safe’ grazing capacities for south-west Queensland Australia: development of a model for individual properties. The Rangeland Journal 18, 244–258.
| Crossref | GoogleScholarGoogle Scholar |

Martyn S.
(2005) Managing the dry spell and planning recovery. Australian Farm Journal February, 63–64.

McCosker T.
(2000) Cell grazing – the first 10 years in Australia. Tropical Grasslands 34, 207–218.

Scanlan J. C.,
McKeon G. M.,
Day K. A.,
Mott J. J., Hinton A. W.
(1994) Estimating safe carrying capacities of extensive cattle-grazing properties within tropical, semi-arid woodlands of north-eastern Australia. The Rangeland Journal 16, 64–76.
| Crossref | GoogleScholarGoogle Scholar |


