

Developing flow cytometry for precise evaluation of amphibian sperm viability: technical report
Leah Jacobs A * , Talisin Hammond A , Natalie Calatayud A B C , Patricia Byrne A and Thomas Jensen A D
A
B
C
D
Abstract
In the past decade, flow cytometry has become a useful tool for evaluating cellular viability characteristics for non-domestic animals such as non-human primates, marine animals, and birds. This technology has the potential to vastly improve sperm-quality assessments, concentration counts and cell sorting in a more time-efficient and reliable manner.
The study aimed to validate the efficacy of using flow cytometry for amphibian sperm by comparing its results with those obtained through traditional means of sperm-quality assessment.
Sperm samples were collected from testes macerates of the African clawed frog (Xenopus laevis) and subjected to both flow cytometry and microscopy analyses. Flow cytometry allowed for the simultaneous assessment of sperm viability and concentration by using fluorescent probes, whereas microscopy provided a traditional means of assessing sperm characteristics.
Sperm concentrations measured by flow cytometry and fluorescent microscopy were highly correlated, although flow cytometry methods estimated higher concentrations. Sperm viability measured by flow cytometry and that measured by fluorescent microscopy were not significantly correlated and were significantly different, varying by only ~8% in viability, on average.
Although flow cytometry overestimated concentration and live/dead assessments, the discrepancies were slight enough to indicate that flow cytometry can still be a valuable method for assessing amphibian sperm.
These results validated the utility of flow cytometry as a reliable tool for assessing amphibian sperm viability and concentration, offering a promising alternative to traditional, time-consuming methods.
Keywords: amphibian, assisted reproductive technology, flow cytometry, fluorescence, sperm, sperm viability, testis, Xenopus.
Introduction
Precise assessment of sperm quality is paramount for optimizing assisted reproductive techniques and gaining comprehensive insights into male reproductive health. Traditional methods, although valuable, are often time-consuming, subjective, and prone to observation bias (Freund and Carol 1964; Sikka and Hellstrom 2016). In response to these limitations, flow cytometry (FC) has emerged as a powerful technology for sperm-quality assessment (Lo et al. 2008). Originally developed for cell-based applications, FC is popular because of its high-throughput, multi-parametric approach (Lo et al. 2008). By leveraging FC, researchers can obtain precise and unbiased data on various sperm parameters with higher precision, enabling simultaneous examination of a wide array of sperm-cell attributes (Graham 2001; Lo et al. 2008). This efficiency is particularly beneficial for species with small volumes and cell counts, where conventional methods may fall short (Prathalingam et al. 2006; Yang et al. 2016). FC applications offer significant impacts and valuable insights into reproductive biology, particularly for conservation efforts in rare species where access, supply, or sample volumes are limited (Gillan et al. 2005). The applicability of FC in cases of limited sample availability has allowed conservation practitioners to continue expanding in such areas as sex-sorting, cytogenetics, and sperm viability and function (De Baulny et al. 1997).
In amphibian-based reproductive technologies, the use of FC for sperm quantification and quality assessment remains underexplored. For many species, its potential implications are vast. Sperm retrieval is integral to preserving genetic diversity through cryopreservation and artificial fertilization (AF). Obtaining sufficient volumes of spermic urine for quality assessment while preserving enough for AF is a significant challenge. To address this issue, FC has been employed to measure multiple important sperm characteristics in a single analysis, minimizing sample wastage and optimizing sperm usage (Graham 2001; Martínez-Pastor et al. 2010; Hossain et al. 2011). By leveraging fluorescent dyes and scatter characteristics, FC can determine live and dead percentages, concentrations, and other essential sperm metrics, including mitochondrial and acrosome integrity. Additionally, FC could play a pivotal role in evaluating the quality of cryopreserved amphibian sperm, including viability, motility, and membrane integrity post-thaw, and can be tailored to suit the unique characteristics and reproductive requirements of different species. This study assesses the viability of using FC against conventional microscopy-based methods for evaluating sperm characteristics viability and concentration.
Materials and methods
Sample preparation
Xenopus testes were excised from recently euthanized males (N = 18), placed in Modified Morgan’s Reagent (1X MMR) at 4°C overnight for transportation to SDZWA. On arrival, testes were macerated in 2 mL of amphibian Ringer’s solution (SARs), then separated into two aliquots and further diluted with an additional 1 mL of SARs. One sample was run through a 40-μm filter to examine its effects on sample analysis and vitality, whereas the other sample was left unaltered.
Filtered and unfiltered samples were each divided into the following four aliquots: (1) unstained control sperm, (2) sperm stained with SYBR-14, a membrane-permeant nucleic acid stain for live sperm (LIVE/DEAD Sperm Viability Kit L-7011, ThermoFisher), (3) sperm stained with propidium iodide (PI) to detect dead or dying sperm, and (4) sperm stained with both SYBR-14 (488/516 nm) and PI (535/617 nm) to simultaneously count live and dead cells. CountBright counting beads (C36950, 385–860 nm; ThermoFisher) were added to the fourth aliquot to assess concentration by using FC.
Sperm-quality analyses
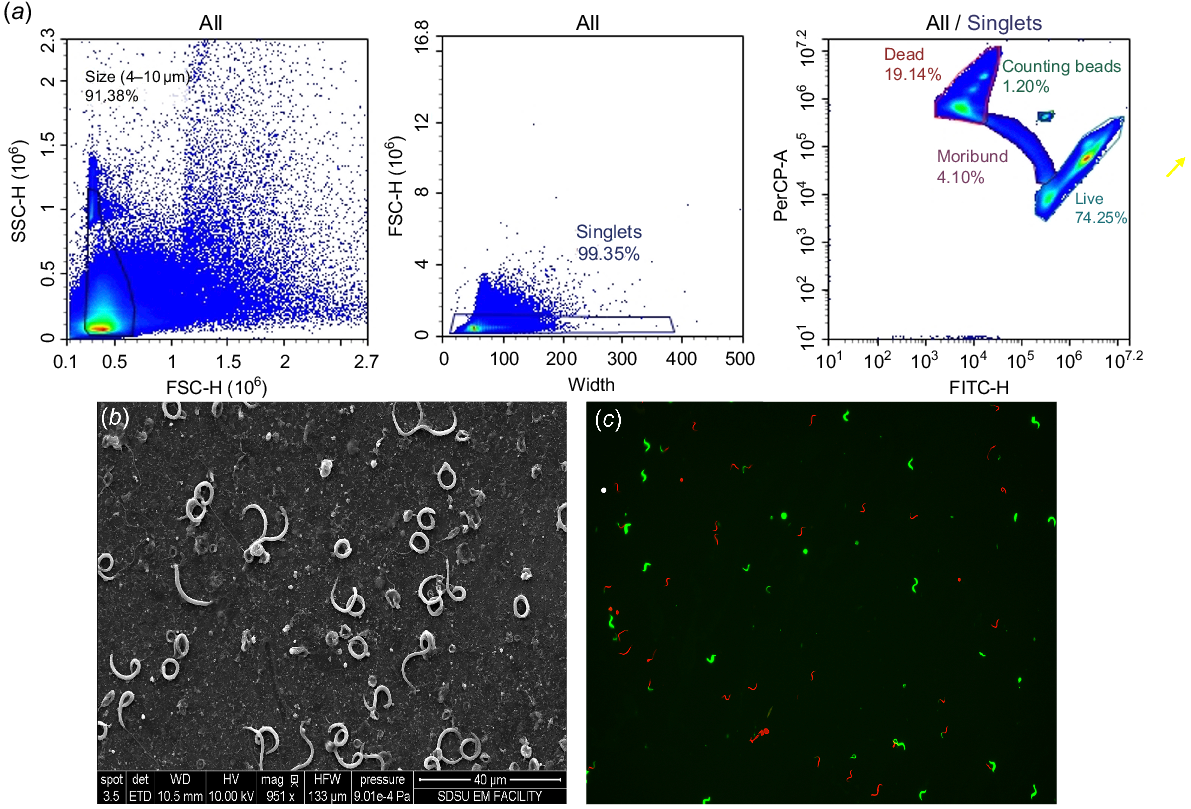
Sperm samples were analyzed using a NovoCyte Agilent flow cytometer equipped with a 488-nm solid-state laser. We used a 530/30 nm BP laser to assess live cells (SYBR-14), and a 585/40 nm BP laser to assess dead cells (stained with propidium iodide, PI). Up to 150,000 events were analyzed for each sample by using NovoExpress software (ver. 1.6.2; ACEA Biosciences). Sperm samples were gated on the basis of forward scatter versus side scatter to exclude cell debris, assess size, and identify sperm abnormalities (Fig. 1a). To validate cell population accuracy, scanning electron microscopy (SEM) images were employed to measure Xenopus sperm heads (Fig. 1b). PI and SYBR-14-stained sperm were utilized to determine concentration and viability (Fig. 1c). The flow cytometer operated at a flow rate of 53 μL/min.
(a) Methodology of flow cytometric gating. Top left: samples were gated using forward and side scatter plots based on the variability in sperm size as measured by SEM images (b). Top middle: secondarily, samples were gated to exclude doublets and clumped cells by using width × forward scatter plots. Top right: stained sperm cells were gated to assess overall concentration and viability. (b) Standard electron microscopy image of Xenopus sperm to validate size variation for concentration counts. Photo credit Ingrid Niesman, SDSU EM Facility. (c) Live/dead staining on Xenopus laevis sperm. Live sperm stained in green, indicating nuclear membrane intact; dead sperm stained in red, indicating a degraded or absent nuclear membrane (dead cell).
The study used the following two FC methods to determine sperm concentration: (1) CountBright beads assay (beads are added to each sample to determine cell concentration per microliter using the cell-to-bead ratio) and (2) concentration based on events per volume.
Events per volume counts were calculated by multiplying the total events (live, dead and moribund sperm combined) counted per 200 μL by 5 to obtain sperm/mL.
Sperm concentration was assessed using a hemacytometer (Bright-Line, Hausser Scientific Hemacytometer, Horsham, PA, USA) on a compound microscope (Omax M83E Series) at ×100 magnification. Viability was determined using a Keyence fluorescent microscope (Keyence BZ-X Series) at ×100 magnification, with at least 100 cells counted per sample to determine live/dead percentages.
Statistical analysis
All statistical analyses were conducted in the R programming environment (R Core Team 2022). We used the rptR package (ver. 0.9.22; https://cran.r-project.org/web/packages/rptR/index.html; Stoffel et al. 2017) to assess the repeatability of sperm metrics across two repeated microscopy and flow-cytometry measures on the same sample. We also used this package to assess the reproducibility or agreement of sperm concentration and viability across the different methods (microscope vs flow cytometer). This package calculates repeatability as the intra-class correlation coefficient (ICC), the proportion of the total variance in a set of measurements that is due to differences across samples rather than differences within samples (measurement error or error owing to differences in methods). Generalized linear mixed models (GLMM) were fit using the lme4 ( ver 1.1.35.4; https://cran.r-project.org/web/packages/lme4/index.html; Bates et al. 2014) and lmerTest packages (ver 3.1.3; https://cran.r-project.org/web/packages/lmerTest/index.html; Kuznetsova et al. 2017). Prior to analysis, we log-transformed sperm concentration values.
To test for correlations between FC and microscopy-based measures, three GLMMs were run, one each for volume-based FC, bead-based FC, and FC estimates of live/dead counts. These models contained microscopy-based measures as the response variables and FC measures as fixed effects and included an interaction with filtration treatment (filtered or unfiltered). Animal ID was included as a random effect.
To assess the impacts of method and filtration treatment on sperm metrics, two additional GLMMs were fit with either sperm concentration or the percentage of live sperm as a response variable and with method (FC – volume based, FC – bead based, or microscopy-based), filtration treatment (filtered or unfiltered), and an interaction among these terms as fixed effects, and animal identity as a random effect.
Results
Within sample repeatability estimates
Within sample, within-observer repeatabilities were high across both microscopy- and FC-based measures of sperm, but were higher for FC-based measures. For concentration, using microscopy resulted in an ICC of 0.81 (CI: 0.63–0.90), whereas FC volume and bead-based measures resulted in ICCs of 0.98 (0.96–0.99) and 0.99 (0.99–0.99). We collected only two measures of percentage live sperm on the same sample by using FC; ICC for this measure was 0.90 (0.82–0.95).
Effects of filtration on sperm metrics
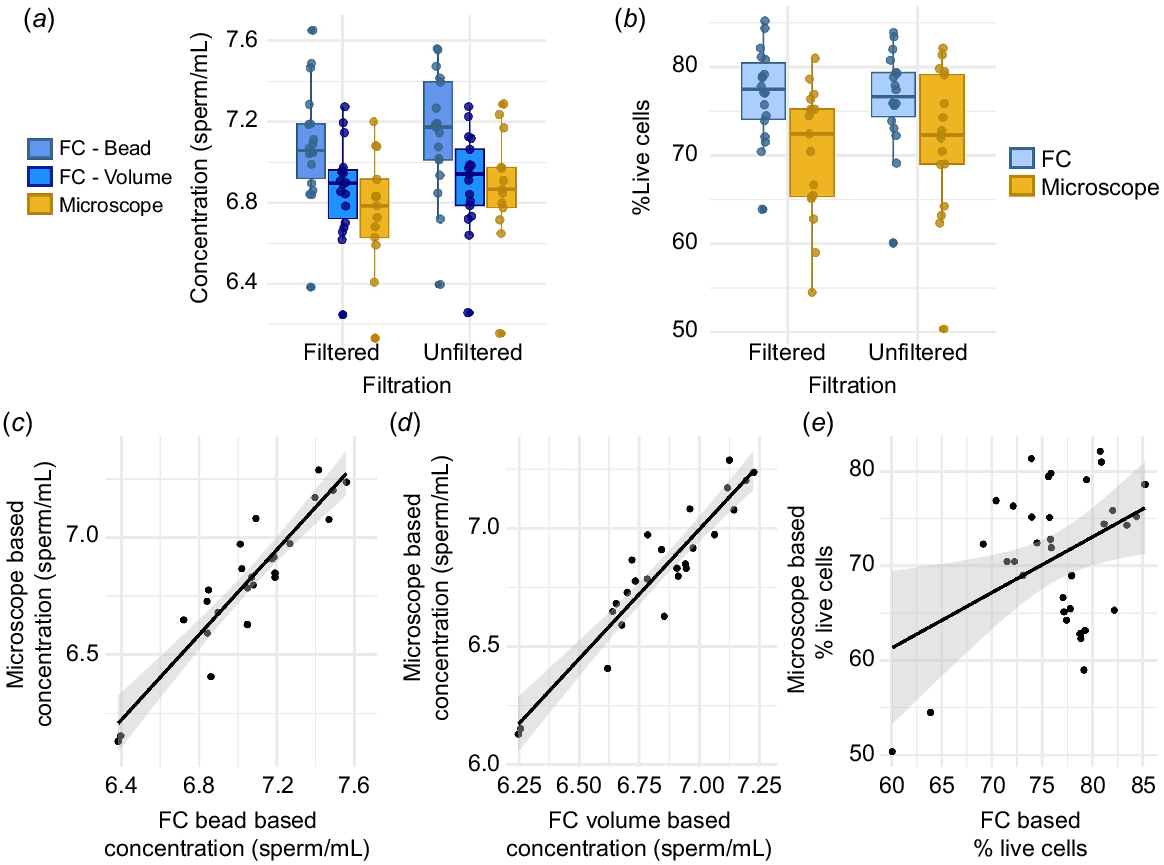
While filtration treatment did not significantly alter the relationships between microscopy- and FC-based measures of concentration (Supplementary Tables S1 and S2), on average, filtered samples did have significantly lower sperm concentrations across both methods (Table S3; Fig. 2a). Across methods, sperm concentrations were lower in filtered samples 72.3% of the time, and when they were lower, they were, on average, lower by ~2.7 million sperm (S.D. 3.5 million). There was no significant effect of filtration treatment on the percentage of live sperm (Tables S4, S5; Fig. 2b).
Sperm concentrations and viability as measured by flow cytometry (FC) and microscopy. All concentrations are log-transformed. (a) Sperm concentrations as a function of filtration treatment (filtered on left, unfiltered on right) and visualization type (FC in blue, microscopy in yellow) and (b) percentage of live sperm as a function of filtration treatment (filtered on left, unfiltered on right) and visualization type (FC in blue, microscopy in yellow). Boxplots show the median (central line) and the 25–75th percentiles (box), whiskers show 1.5 times the interquartile range. Raw data points are overlaid. Correlation between microscopy-based concentration and (c) FC bead-based concentrations and (d) FC volume-based concentrations. (e) Correlation between microscopy and FC-based measures of sperm viability. Line shows the line of best fit, with a 95% confidence interval shown in gray; raw data points are overlaid.
Effects of visualization method on sperm concentration
Sperm concentrations were highly correlated in microscopy- and FC-based visualization methods applied to the same sample (Tables S1, S2, Fig. 2c, d), but there were also significant differences in sperm concentration based on visualization method (Table S3, Fig. 2a). Sperm concentrations measured by the FC volumetric method were more tightly correlated with (Fig. 2c, d) and less significantly different from (Fig. 2a; Table S3) those measured via microscopy than from those measured by the FC bead method. Sperm concentrations were significantly lower by using microscopy than by using the FC bead, but not the FC volumetric method (Fig. 2a, Table S3). On average, sperm concentrations were ~6 million sperm per milliliter (78.9%) higher by using the FC bead method than by microscopy. ICC measures support significant reproducibility across microscopy and FC-based methods, with higher reproducibility for the FC volumetric method (ICC = 0.92, CI = 0.80–0.97, P ≤ 0.001) than the bead method (ICC = 0.76, CI = 0.49–0.92, P ≤ 0.001).
Effects of visualization method on sperm live/dead counts
The percentages of live sperm measured by FC versus microscopy methods applied to the same sample were not significantly correlated (Table S4, Fig. 2e) and were also significantly different (Table S5, Fig. 2b), with FC-based methods yielding slightly higher measures of percentage live sperm. ICC values suggested that measurements of live sperm percentages were not significantly reproducible within a sample across the two methods of quantification (ICC = 0.38, CI = 0–0.72, P = 0.07). FC-based measures of percentage live sperm were higher than microscopy-based measures 73.5% of the time, but when they were higher, it was only, on average, by 8.63% (range: 0.27–20.17).
Discussion
Our results suggest that FC offers a viable alternative to traditional microscopy-based methods for sperm analysis, despite some limitations. For instance, FC enables simultaneous assessment of multiple sperm attributes and subpopulations within a sample, as well as across multiple samples by using 96-well plate readers (Bates et al. 2014). It results in meaningfully higher within-observer repeatabilities, reducing observational bias. It may also reduce fatigue, particularly during assessments of multiple samples per day, minimizing variation compared with manual counting methods. However, FC may overestimate overall sperm concentration as well as viable sperm, while underestimating damaged subpopulations. Alternative FC cell-counting methods, such as true volumetric counting, have been developed to mitigate the variations in concentration counts but further assessment of viability should be considered when assessing via FC. The volumetric method of assessing sperm concentration was tightly correlated and not significantly different from the traditional method of assessing sperm concentration via microscopy. An additional method of assessing overall concentration by using a cell counter or spectrometry could be beneficial to further support the reliability of this method; however, our findings suggest that FC is a suitable method of sperm concentration assessment.
Effects of filtration on sperm metrics
Our results indicated that across quantification methods, filtration treatment can result in slightly lower measures of sperm concentration, but has no effect on measures of percentage of live sperm. This finding has implications for utilizing filtered samples, especially in the context of conservation practices and when working with species that produce low-volume or low-concentration sperm samples. When working with samples of small volumes or small numbers of cells, filtration, even with significantly large mesh grades, has the potential to reduce the concentration significantly. Our findings suggest that utilizing unfiltered samples or another means of sperm cell separation, for example, centrifugation, may be a more reliable protocol for obtaining sufficient cells for analysis.
Differences among concentration estimations
Our results indicated that FC bead-based methods estimate significantly higher sperm concentrations than do microscopy-based counts, although concentrations are not significantly different for FC volumetric and microscopy-based methods. All methods yield highly correlated concentrations with high reproducibility scores. The discrepancy observed when using counting beads to assess concentration versus volumetric analyses or manual counts may be attributed to the ‘vanishing bead factor’ (see Brando et al. 2001; Matos 2024). We suspect that low bead detectability in our samples may stem from excessive or vigorous vortexing leading to bead aggregation, or from high protein concentrations causing surface binding that alters fluorescence and reduces detectability. The implications of overestimating sperm concentration depend on specific end uses and species. For example, for intra-cytoplasmic sperm injection (ICSI), where a single viable sperm suffices, an overestimation might be negligible. Conversely, for artificial fertilization involving multiple eggs or clutches, an overestimated concentration could significantly affect reproductive outcomes. Thus, weighing the methodology for concentration calculations can be crucial for the application of the sample. For basic assessment purposes, we recommend using the volumetric methos of assessing concentration.
Differences among live/dead counts
FC measures of percentage live sperm were not significantly correlated with those measured via microscopy and were also significantly higher, although the overall magnitude of the difference between the two methods was low. While the lack of correlation could indicate low precision in either method for quantifying sperm viability, it also may have been related to the narrow range of measured percentages (~51–85%). FC values had a mean of 76.6% live whereas microscopy had an average of 71.0% live. Biologically, these values are sufficiently close to suggest that FC is still a valid option for assessing live/dead parameters for amphibian sperm. To further explore the utility of FC for measuring percentage live sperm, future work could collect paired microscope and FC measures across a wider range of sperm concentrations, for example, by using a serial dilution.
Conclusions
Overall, even though FC bead-based methods tended to overestimate sperm concentration, agreement was high between FC volumetric and microscopy-based measures of sperm concentration, allowing FC to serve as an efficient method for characterizing sperm concentration. FC did overestimate live/dead percentage overall and was not correlated with microscopy counts across time. Although this warrants further investigation and potential refinement in flow methodology, we suggest that utilizing the flow for live/dead percentage is still a viable method of sperm-quality assessment, owing to the small percentage discrepancy between FC and microscopy. FC offers significant advantages over manual counts, including accuracy, speed, objectivity, multi-parametric analysis, sample conservation, reproducibility, and data handling. This is crucial for programs dealing with small sample volumes obtained from endangered and threatened species, allowing for reduced impactful sampling and the conservation of genetic material. Manual live/dead and concentration counts can be subjective owing to observer variation and subjective thresholds in detecting fluorescent signals (see Fig. 1c). Manual counting errors, such as underestimating sperm counts or misidentifying fragmented, deformed or clumped sperm (as in Fig. 1b) are common and require duplicate counts and assessments for accuracy. This correlates with other studies where sperm count and motility scoring has shown variability between microscopic and computer-assisted methods. Additionally, even among different computer-assisted methodologies, machine differences resulted in biases, with various brands leading to over- or underestimations of viability parameters. However, overall, computer-based methodologies afford greater reproducibility (Centola 1996). Similarly, FC provides automated, objective, and standardized methods, reducing observer biases and enhancing result reliability over time. This study suggests that these methods may be promising for analyzing amphibian sperm characteristics.
Data availability
The data that support this study will be shared upon reasonable request to the corresponding author.
Acknowledgements
We thank the Spitzer Lab and Kintner Lab at the University of California, San Diego, for the donation of Xenopus testes. Acknowledging that our research takes place on the traditional lands of numerous Indigenous Californian Peoples, we pay our respects to them as traditional custodians of the land on which this work was conducted and pay our respect to Elders both past, present and emerging.
References
Bates D, Mächler M, Bolker B, Walker S (2014) Fitting linear mixed-effects models using lme4. Available at https://doi.org/10.48550/arXiv.1406.5823
Brando B, Göhde W, Jr., Scarpati B, D’Avanzo G (2001) The ‘vanishing counting bead’ phenomenon: effect on absolute CD34+ cell counting in phosphate-buffered saline-diluted leukapheresis samples. Cytometry 43, 154-160.
| Crossref | Google Scholar | PubMed |
Centola GM (1996) Comparison of manual microscopic and computer-assisted methods for analysis of sperm count and motility. Archives of Andrology 36, 1-7.
| Crossref | Google Scholar | PubMed |
De Baulny BO, Le Vern Y, Kerboeuf D, Maisse G (1997) Flow cytometric evaluation of mitochondrial activity and membrane integrity in fresh and cryopreserved rainbow trout (Oncorhynchus mykiss) spermatozoa. Cryobiology 34, 141-149.
| Crossref | Google Scholar |
Freund M, Carol B (1964) Factors affecting haemocytometer counts of sperm concentration in human semen. Reproduction 8, 149-155.
| Crossref | Google Scholar |
Gillan L, Evans G, Maxwell WMC (2005) Flow cytometric evaluation of sperm parameters in relation to fertility potential. Theriogenology 63, 445-457.
| Crossref | Google Scholar | PubMed |
Graham JK (2001) Assessment of sperm quality: a flow cytometric approach. Animal Reproduction Science 68, 239-247.
| Crossref | Google Scholar | PubMed |
Hossain MS, Johannisson A, Wallgren M, Nagy S, Siqueira AP, Rodriguez-Martinez H (2011) Flow cytometry for the assessment of animal sperm integrity and functionality: state of the art. Asian Journal of Andrology 13, 406-419.
| Crossref | Google Scholar |
Kuznetsova A, Brockhoff PB, Christensen RHB (2017) lmerTest package: tests in linear mixed effects models. Journal of Statistical Software 82, 1-26.
| Crossref | Google Scholar |
Lo K, Brinkman RR, Gottardo R (2008) Automated gating of flow cytometry data via robust model-based clustering. Cytometry Part A 73A, 321-332.
| Crossref | Google Scholar |
Martínez-Pastor F, Mata-Campuzano M, Álvarez-Rodríguez M, Álvarez M, Anel L, De Paz P (2010) Probes and techniques for sperm evaluation by flow cytometry. Reproduction in Domestic Animals 45, 67-78.
| Crossref | Google Scholar | PubMed |
Matos DM (2024) ‘Protein-resistant vanishing counting bead’ phenomenon: a new problem with single-platforms for CD34+ quantification? Cytotherapy 26, 649-651.
| Crossref | Google Scholar | PubMed |
Prathalingam NS, Holt WW, Revell SG, Jones S, Watson PF (2006) The precision and accuracy of six different methods to determine sperm concentration. Journal of Andrology 27, 257-262.
| Crossref | Google Scholar | PubMed |
R Core Team (2022) R: a language and environment for statistical computing. R Foundation for Statistical Computing, Vienna, Austria. Available at https://www.R-project.org
Sikka SC, Hellstrom WJG (2016) Current updates on laboratory techniques for the diagnosis of male reproductive failure. Asian Journal of Andrology 18, 392-401.
| Crossref | Google Scholar |
Stoffel MA, Nakagawa S, Schielzeth H (2017) rptR: repeatability estimation and variance decomposition by generalized linear mixed-effects models. Methods in Ecology and Evolution 8, 1639-1644.
| Crossref | Google Scholar |
Yang H, Daly J, Tiersch TR (2016) Determination of sperm concentration using flow cytometry with simultaneous analysis of sperm plasma membrane integrity in zebrafish Danio rerio. Cytometry Part A 89, 350-356.
| Crossref | Google Scholar |