

Expression of transforming growth factor β signalling molecules and their correlations with genes in loci linked to polycystic ovary syndrome in human foetal and adult tissues
Rafiatu Azumah A , Katja Hummitzsch A , Richard A. Anderson B and Raymond J. Rodgers A *
A *
A
B
Abstract
Altered signalling of androgens, anti-Müllerian hormone or transforming growth factor beta (TGFβ) during foetal development have been implicated in the predisposition to polycystic ovary syndrome (PCOS) in later life, aside from its genetic predisposition. In foetal ovarian fibroblasts, TGFβ1 has been shown to regulate androgen signalling and seven genes located in loci associated with PCOS. Since PCOS exhibits a myriad of symptoms, it likely involves many different organs.
To identify the relationships between TGFβ signalling molecules and PCOS candidate genes in different tissues associated with PCOS.
Using RNA sequencing data, we examined the expression patterns of TGFβ signalling molecules in the human ovary, testis, heart, liver, kidney, brain tissue, and cerebellum from 4 to 20 weeks of gestation and postnatally. We also examined the correlations between gene expression of TGFβ signalling molecules and PCOS candidate genes.
TGFβ signalling molecules were dynamically expressed in most tissues prenatally and/or postnatally. FBN3, a PCOS candidate gene involved in TGFβ signalling, was expressed during foetal development in all tissues. The PCOS candidate genes HMGA2, YAP1, and RAD50 correlated significantly (P < 0.01) with most TGFβ signalling molecules in at least four foetal tissues, and specifically with TGFBR1 in six out of the seven tissues examined.
This study suggests that possible crosstalk occurs between genes in loci associated with PCOS and TGFβ signalling molecules in multiple tissues, particularly during foetal development.
Thus, alteration in TGFβ signalling during foetal development could affect many tissues contributing to the multiple phenotypes of PCOS in later life.
Keywords: adult, brain, fetus, gene expression, heart, kidney, liver, ovary, polycystic ovary syndrome, testis, TGFβ.
Introduction
Polycystic ovary syndrome (PCOS) is a reproductive/metabolic disorder that affects approximately 10% of women of reproductive age and presents with varying symptoms (Hart et al. 2004, 2011; Teede et al. 2010; Comerford et al. 2012; Stuckey et al. 2014; Echiburu et al. 2016; Anagnostis et al. 2018; Glueck and Goldenberg 2019) including hyperandrogenaemia leading to hirsutism, acne or alopecia, menstrual irregularities, and infertility with metabolic features such as insulin resistance, obesity, hyperinsulinaemia, and type 2 diabetes mellitus. Women with PCOS can also develop atherogenic dyslipidaemia, elevated blood pressure, and increased levels of circulating proinflammatory molecules. The syndrome also affects the psychological health of patients, causing anxiety and depression as well as sleep disorders (Fernandez et al. 2018).
The cause(s) of PCOS remain unclear. Both genetic and foetal origins of the disorder have become the focus of current studies. Genetic studies have shown that genes found in loci associated with PCOS are dynamically expressed in human and bovine foetal ovaries during their development (Hartanti et al. 2020; Liu et al. 2020; Azumah et al. 2021). Also, dividing these genes into groups that have similar expression patterns across gestation found that they are co-expressed with genes involved in either mitochondrial function, stromal expansion, or steroidogenesis during foetal development of the ovary (Azumah et al. 2021). Even though, it is not clear how these genes further regulate pathways during foetal development, which then lead to PCOS predisposition later in life. Interestingly, these PCOS candidate genes (listed in methods and previously studied by Azumah et al. 2023 and Azumah et al. 2021) were not differentially expressed in the ovaries of adult women with PCOS when compared with controls (Liu et al. 2020), further supporting the concept that these genes could be involved in PCOS during foetal development.
Studies of the foetal origins of PCOS have identified three hormones or growth factors of interest: androgen, anti-Müllerian hormone (AMH), and transforming growth factor β (TGFβ). Animal models of PCOS commonly involve treating pregnant mothers (sheep and monkeys) or newborns of animals (mice and rats) with androgens. The resulting offspring show features of PCOS (Walters 2016; Stener-Victorin et al. 2020). Female babies born with congenital adrenal hyperplasia, a condition that involves elevation of circulating androgens, develop PCOS symptoms in later life (Goodarzi et al. 2015). However, it is unlikely that androgenisation of the foetus is the cause of PCOS as there are no androgens in our environment or lifestyle that could initiate this as a common cause of PCOS. AMH has been recently suggested as being involved in PCOS. Manipulation of maternal AMH in mouse models can lead to PCOS-like symptoms in the offspring (Tata et al. 2018). The link to humans is that pregnant PCOS women have higher AMH levels; however, these are minimally higher (Butt et al. 2022). TGFβ signalling molecules, including TGFB1/2/3, are expressed during the development of the ovary and have been postulated to be involved in the aetiology of PCOS (Hatzirodos et al. 2011; Hartanti et al. 2020; Liu et al. 2020; Azumah et al. 2021; Azumah et al. 2022). TGFβ signalling molecules appear to be upstream regulators of stroma expansion during development of the foetal ovary (Azumah et al. 2021). TGFβ1, but neither AMH nor androgen have been shown to regulate some of the PCOS candidate genes in foetal ovarian cells (Hartanti et al. 2020; Azumah et al. 2022). TGFβ1 in foetal ovarian stromal cells in vitro inhibited expression of some genes in loci associated with PCOS including INSR, C8H9orf3, RAD50, ERBB3, NEIL2, IRF1, and ZBTB16 (Hartanti et al. 2020; Azumah et al. 2022). Importantly, TGFβ1 also inhibited androgen receptor (AR) expression, while it stimulated its cofactor TGFβ-induced transcript 1 (TGFB1I1) in cultured foetal ovarian stromal cells (Hartanti et al. 2020; Azumah et al. 2022). Unlike androgens and AMH, TGFβ can control the development of stroma and deposition of fibrillar collagens (Rolfe et al. 2007), including in foetal ovarian stromal cells (Liu et al. 2022). Interestingly, the ovarian PCO morphology is characterised by increased amounts of stroma and collagen (Stein and Leventhal 1935; Hughesdon 1982; Buckett et al. 1999). Thus, TGFβ mechanistically links the (1) foetal origins with (2) the genetic origins, with (3) the morphological phenotype of PCOS, and (4) with the androgenisation effects on foetuses (Azumah et al. 2022).
Not surprisingly many of the foetal studies have focused on the ovary. However, given the multitude of symptoms in PCOS, other tissues are likely affected or involved in the aetiology of PCOS. The testis could be affected as sons of mothers with PCOS have elevated levels of AMH indicating altered Sertoli cell functions (Recabarren et al. 2008). Also, male offspring or brothers of women with PCOS present with metabolic symptoms commonly associated with PCOS (Cannarella et al. 2018; Di Guardo et al. 2020). Tissue-specific knockouts of AR in mouse brain, adipose tissue, and liver (Cox et al. 2020; Roy et al. 2022) identified a role for androgen signalling in these tissues in the development of PCOS symptoms. A direct examination of PCOS candidate genes in human foetal organs including ovary, testis, heart, liver, kidney, and brain tissues found a number of the PCOS candidate genes to be dynamically expressed (Azumah et al. 2023). We have postulated that such genes could be involved in the development of non-reproductive symptoms of PCOS (Azumah et al. 2023).
The current study seeks to understand the genetic dynamics of TGFβ signalling molecules in different tissues. Although some of these have been previously studied in the foetal ovary (Hatzirodos et al. 2011; Hartanti et al. 2020; Liu et al. 2020; Azumah et al. 2021, 2022), their expression relationships with PCOS candidate genes in other tissues have not been examined. To achieve this, we used RNA sequencing (RNAseq) data from human ovary, testis, heart, liver, kidney, non-cerebellum brain tissue, and cerebellum from 4 to 20 weeks of gestation and at different stages of postnatal life. The TGFβ signalling molecules (Munger and Sheppard 2011; Horiguchi et al. 2012; Vander Ark et al. 2018; Rifkin et al. 2022) examined included TGFβs (TGFB1-3), their latent TGFβ binding proteins (LTBP1-4), the fibrillins that they bind to (FBN1-3), TGFβ receptors (TGFBR1-3), and other related genes including Transforming Growth Factor Beta 1 Induced Transcript 1 (TGFB1I1), Transforming Growth Factor Beta Receptor 3 Like (TGFBR3L), Transforming Growth Factor Beta Induced (TGFBI), and Transforming Growth Factor Beta Receptor Associated Protein 1 (TGFBRAP1).
Materials and methods
Data extraction and analysis
We analysed normalised (counts per million) human RNA-seq data deposited in Array Express (E-MTAB-6814) from the ‘Gene expression across mammalian organ development’ project. The prenatal samples in that project were provided by the MRC-Wellcome Trust Human Developmental Biology Resource based in the United Kingdom. They were from elective abortions with normal karyotypes. Postnatal samples were provided by the NICHD Brain and Tissue Bank for Developmental Disorders at the University of Maryland, USA, and by the Chinese Brain Bank Center in Wuhan, China. They originated from individuals with diverse causes of death that, given the information available, were not associated with the organ sampled. The patient information provided in this project was sex and age or developmental status (Supplementary Tables S1–S3). The organs in this project represent the three germ layers: the ectoderm made up of brain (forebrain/cerebrum) and cerebellum (hindbrain/cerebellum); the mesoderm made up of heart, kidney, ovary, and testis; and the endoderm consisting of the liver (Cardoso-Moreira et al. 2019). The expression of TGFβ family genes (FBN1, FBN2, FBN3, LTBP1, LTBP2, LTBP3, LTBP4, TGFB1, TGFB2, TGFB3, TGFBR1, TGFBR2, TGFBR3, TGFB1I1, TGFBR3L, TGFBI, and TGFBRAP1) was studied in all seven tissues from foetuses (4–20 weeks post-conception (wpc); but missing 14, 15, and 17 wpc), from five tissues at birth until adulthood, and for kidney until 8 years of age. There were no postnatal ovary tissues available. Postnatal, we grouped the samples as prepubertal (from birth until 9 years), pubertal (13–19 years) and adulthood (each decade until 65 years of age). For testis samples, 13–14 years were considered as early puberty, and 15–19 years as late puberty as grouped in the original study (Cardoso-Moreira et al. 2019). Also, Cardoso-Moreira et al. (2019) grouped the prenatal brain into two regions: forebrain together with the midbrain referred to as the ‘brain’ and hindbrain was referred to as the ‘cerebellum’, while the brain and cerebellum from postnatal samples comprise the dorsolateral prefrontal region of the cerebral cortex and lateral cerebellar cortex, respectively.
The tissues were grouped according to function; gonads (ovary (n = 18 prenatal), testis (n = 26 prenatal, n = 13 postnatal)); metabolic tissues (heart (n = 34 prenatal, n = 10 postnatal), liver (n = 37 prenatal, n = 12 postnatal), kidney (n = 27 prenatal, n = 9 postnatal)); and brain tissues (non-cerebellum brain tissue (n = 32 prenatal, n = 21 postnatal) and cerebellum (n = 33 prenatal, n = 25 postnatal)). Tables S1–S3 show the specific details for each tissue sample used.
The TGFβ family was grouped functionally: TGFβs (TGFB1, TGFB2, and TGFB3), latent TGFβ binding proteins (LTBP1, LTBP2, LTBP3, and LTBP4), fibrillins (FBN1, FBN2, and FBN3), TGFβ receptors (TGFBR1, TGFBR2, and TGFBR3) and others (TGFB1I1, TGFBR3L, TGFBI, and TGFBRAP1). Expression levels of TGFβ family genes studied previously (Azumah et al. 2022) were extracted from normalised counts and further analysed. Specifically, time-course scatterplots were generated for TGFβ signalling molecules using ggplot2 package in R (Wickham 2016). Pearson’s correlation was then carried out using Statistical Package for the Social Sciences (IBM SPSS Statistics for Windows, v.25 (IBM Corp., Armonk, NY, USA)) for foetal samples of each tissue separately; firstly for TGFβ signalling molecules with each other, and secondly with PCOS candidate genes (HMGA2, TOX3, GATA4, YAP1, ZBTB16, IRF1, NEIL2, RAD50, KRR1, RAB5B, ARL14EP, DENND1A, THADA, MAPRE1, C9orf3/AOPEP, SUOX, SUMO1P1, ERBB3, ERBB4, PLGRKT, FBN3, INSR, FDFT1, FSHB, FSHR, LHCGR, AR, and AMH). The correlation of expression of each gene with each other within each tissue was then calculated. The outputs were collated across tissues using all significant correlations that were P < 0.01. At this stage, relationships using ln-transformed data were only examined in ovary tissues.
Results
Expression of TGFβ signalling molecules in foetal tissues
The expression of the TGFβ family of genes was studied in seven foetal tissues (ovary, testis, heart, liver, kidney, brain, and cerebellum) until mid-gestation (4–20 wpc). All the genes were dynamically expressed across all tissues with few exceptions as stated below. Although there were fewer female samples than males, there was no difference in gene expression observed between the two sexes in the same tissues, excluding the gonads. We compared the gene expression among different tissues and found that some genes were significantly expressed in gonadal tissues, whilst others were expressed in the metabolic or brain tissues at different prenatal time points.
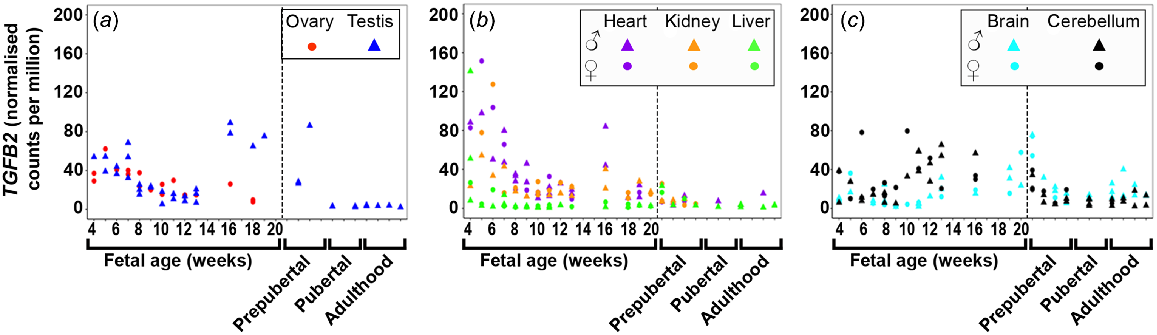
TGFB1 (Fig. S1A) and TGFB2 (Fig. 1) expression was highest at 4 weeks in both gonadal and metabolic tissues, and in general, levels in all tissues decreased as the foetuses developed. TGFB2 and TGFB3 (Figs 1 and S1B) expression increased at 16 wpc in the testis until 20 wpc, and at 16 weeks in the heart. TGFB1 expression was low in both brain tissues and levels decreased and remained low until mid-gestation. TGFB2 expression increased with gestational age in the cerebellum but remained low in the brain. TGFB3 was least expressed in both brain tissues. TGFB2 was only expressed early in foetal liver development but TGFB3 was not expressed in the foetal tissues.
Expression of transforming growth factor beta 2 (TGFB2) in (a) gonadal (n = 45), (b) metabolic (n = 104), and (c) brain (n = 65) tissues during the first half of foetal development and during lifetime.
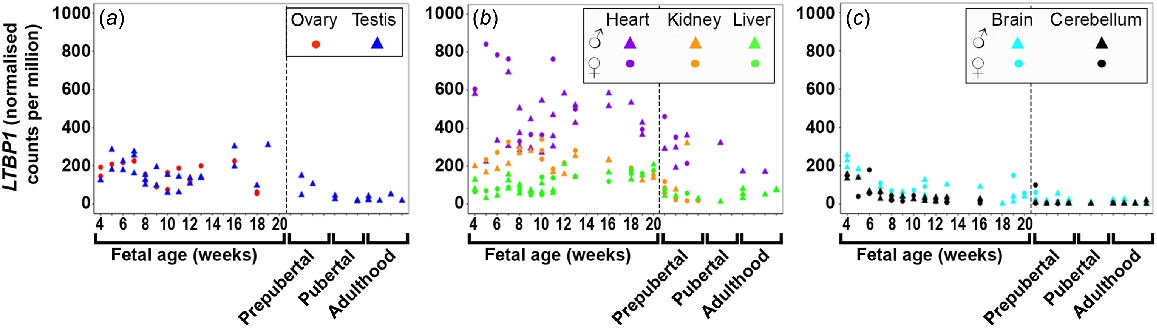
LTBP1/2/3/4 (Figs 2 and S2) were dynamically expressed in most tissues with least expression in the foetal brain tissues. LTBP1 (Fig. 2) expression was expressed highest in the heart early in gestation and then slowly declined. In all other tissues, its expression was relatively constant. The expression of LTBP2 (Fig. S2A) increased in the ovary, testis, and heart during gestation, but remained relatively constant and quite low in kidney, and both brain tissues. LTBP3 and 4 (Fig. S2B, C) were the most highly expressed LTBPs in the foetal testis and their expression increased throughout the gestational period studied. The expression of both these genes in the ovary remained steady, similar to heart and liver. The expression in the liver was the lowest of the metabolic tissues and remained constant. LTBP3 expression increased in both brain tissues, whereas LTBP4 was constantly low. LTBP2/4 were not expressed in the foetal liver tissues.
Expression of latent TGFβ binding proteins 1 (LTBP1) in (a) gonadal (n = 45), (b) metabolic (n = 104), and (c) brain (n = 65) tissues during the first half of foetal development and during lifetime.
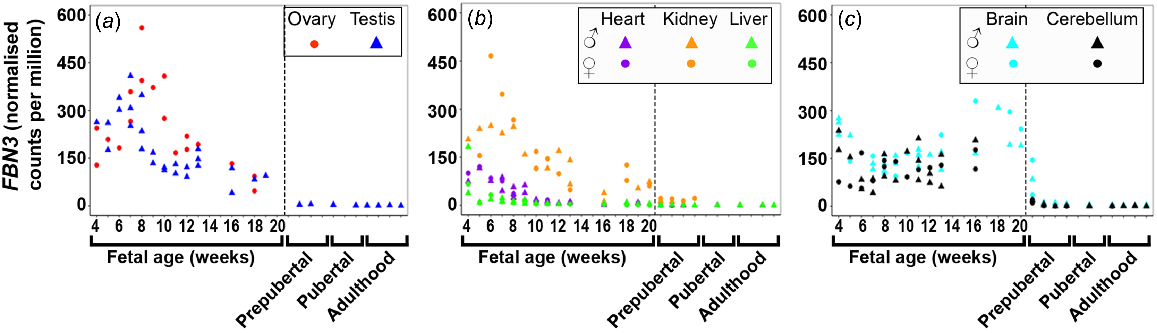
FBN1/2/3 were dynamically across many foetal tissues with the least expression in the foetal liver. FBN1 (Fig. S3A) expression remained constant in the ovary, kidney, and liver tissues and both brain tissues although levels decreased until 6 wpc in both brain tissues. The expression of FBN1 in the heart was constant except for one male heart sample at 16 wpc, which showed an extremely high level. Expression of FBN1 and FBN2 increased in testis until 16 wpc and levels decreased thereafter. FBN2 (Fig. S3B) expression remained constant in the ovary tissues and both brain tissues but levels decreased until 8 wpc in both brain tissues. While FBN2 was not expressed in the liver tissues prenatally, it was highest expressed in the early stages (first trimester) in heart tissues after which levels decreased towards mid-gestation. Both FBN1 and FBN2 were least expressed in the liver and both brain tissues. However, FBN3 (Fig. 3) was highest expressed early in gestation in all tissues except in the brain tissues, and then decreased towards mid-gestation. In cerebellum, the expression remained constantly high, whereas in brain it increased towards mid-gestation. Notably, FBN3 is the fibrillin which is most expressed in brain tissues.
Expression of fibrillin 3 (FBN3) in (a) gonadal (n = 45), (b) metabolic (n = 104), and (c) brain (n = 65) tissues during the first half of foetal development and during lifetime.
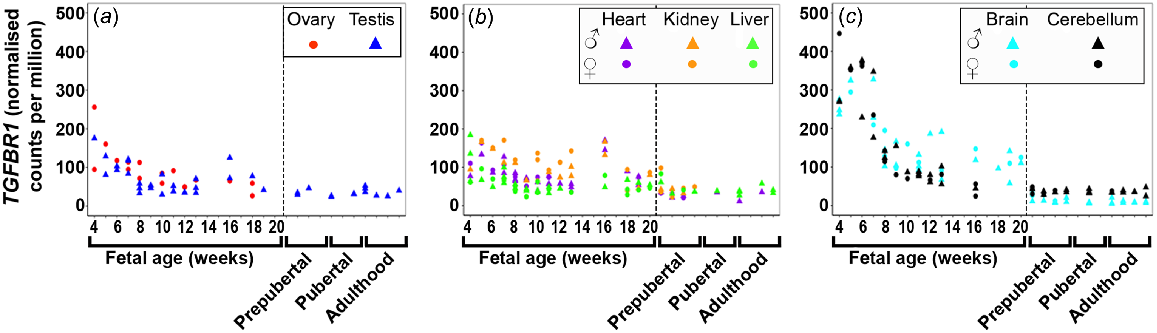
TGFBR1 (Fig. 4) expression was highest early in gestation across all tissues with the brain tissues having the highest levels, and then declined towards mid-gestation. TGFBR2 (Fig. S4A) expression increased across gestation in the testis and metabolic tissues, but remained very low and constant in the brain tissues and the ovary. TGFBR3 (Fig. S4B) expression increased in the testis and kidney, decreased in the ovary and liver, but remained low and constant in the heart and both brain tissues.
Expression of transforming growth factor beta receptor (TGFBR1) in (a) gonadal (n = 45), (b) metabolic (n = 104), and (c) brain (n = 65) tissues during the first half of foetal development and during lifetime.
In most tissues, expression of TGFB1I1 (Fig. S5A) remained relatively constant and low, except for testis where it increased towards mid-gestation and for heart where the expression drastically increased towards 10 wpc and then dropped at 16 wpc to increase again at 18 and 20 wpc. TGFB1I1 was not expressed in the foetal liver. TGFBR3L (Fig. S5B) expression was either very low or nil in all foetal tissues. TGFBI (Fig. S5C) expression was high at early gestation in heart and brain tissues and then declined. In the ovary and testis, a small increase up to 8 wpc could be observed, which then declined and stayed low in the ovary and increased in the testis from 16 wpc onwards again. TGFBI was constantly expressed in liver and kidney, whereby an increase towards 20 wpc occurred. TGFBRAP1 (Fig. S5D) was dynamically expressed across tissues studied with levels remaining relatively constant in each tissue.
Relationships of TGFβ signalling molecules in foetal tissues
Pearson’s correlations of the gene expression within each foetal tissue were carried out between the genes and gestational age and the outcomes are shown in Tables 1–5 and S4–S16. In the cases where description of significance involved more than two tissues or genes, the direction of correlation (negative or positive) are generally omitted from the text here, to minimise the complexity in the presentation of the results. However, these details can be observed in the respective tables for each gene.
In the ovary, only LTBP2 significantly correlated positively with gestational age (Table 1), while TGFB1/2, LTBP1, FBN2, and TGFBR1/2 correlated negatively. In the testis samples, FBN3 significantly correlated negatively with gestational age, whilst TGFB3, LTBP2/3/4, FBN1/2, TGFBR2/3, and TGFB1I1 correlated positively (Table 1). In the heart, TGFB1/2 and FBN2/3 significantly correlated negatively with gestational age, while FBN1 and TGFBR1/2 correlated positively. In the kidney, LTBP2 and TGFBR2 significantly correlated positively with gestational age, while TGFB2/3, LTBP1, FBN2/3, and TGFBR1/3 correlated negatively. In the liver, LTBP1/2, TGFBR2, TGFBI, and TGFBRAP1 significantly correlated with gestational age as well as TGFB2, FBN1/2/3, and TGFBR3 negatively. For brain and cerebellum tissues, LTBP1, FBN1/2, and TGFBR1/3 significantly correlated negatively with gestational age while TGBFB2 and LTBP3 correlated positively. However, TGFB3, FBN3, and TGFBRAP1 significantly correlated positively, and LTBP4 and TGFBI negatively with gestational age in brain only. TGFBR3L only positively correlated with gestational age in cerebellum. Thus, LTBP1/2/3, FBN2/3, and TGFBR1/2/3 correlated significantly (P < 0.01) in at least three tissues.
| Genes | Ovary (N = 18) | Testis (N = 27) | Heart (N = 38) | Kidney (N = 29) | Liver (N = 37) | Cerebellum (N = 33) | Brain (N = 32) | Number of organs A | |
|---|---|---|---|---|---|---|---|---|---|
| TGFB1 | −0.53a | −0.30 | −0.61c | 0.01 | −0.29 | −0.32 | −0.25 | 1− | |
| TGFB2 | −0.75c | 0.22 | −0.54c | −0.42a | −0.34a | 0.42a | 0.50b | 1+, 2− | |
| TGFB3 | −0.18 | 0.64c | 0.18 | −0.39a | −0.08 | 0.32 | 0.61c | 2+ | |
| LTBP1 | −0.48a | 0.03 | −0.11 | −0.45a | 0.70d | −0.71d | −0.54b | 1+, 2− | |
| LTBP2 | 0.55a | 0.61c | 0.22 | 0.69d | 0.75d | −0.14 | 0.25 | 3+ | |
| LTBP3 | 0.03 | 0.61c | −0.22 | 0.03 | −0.28 | 0.62c | 0.48b | 3+ | |
| LTBP4 | 0.25 | 0.69c | 0.02 | 0.20 | −0.32 | −0.22 | −0.60c | 1+, 1− | |
| FBN1 | −0.49a | 0.77d | 0.35a | 0.06 | −0.23 | −0.39a | −0.56c | 1+, 1− | |
| FBN2 | −0.70b | 0.56b | −0.38a | −0.22 | −0.34a | −0.59c | −0.60c | 1+, 3− | |
| FBN3 | −0.44 | −0.73d | −0.77d | −0.73d | −0.46b | 0.17 | 0.43a | 4− | |
| TGFBR1 | −0.69b | −0.41a | −0.16 | −0.51b | −0.40a | −0.84d | −0.66d | 4− | |
| TGFBR2 | −0.62b | 0.65c | 0.63d | 0.67c | 0.51b | −0.21 | −0.14 | 4+, 1− | |
| TGFBR3 | −0.46 | 0.62c | 0.45b | 0.55b | −0.59c | −0.49b | −0.60c | 2+, 4− | |
| TGFB1I1 | −0.09 | 0.57b | 0.25 | 0.29 | −0.29 | 0.07 | 0.08 | 1+ | |
| TGFBR3L | −0.02 | −0.17 | −0.18 | 0.15 | −0.01 | 0.54b | 0.12 | 1+ | |
| TGFBI | −0.39 | 0.31 | −0.12 | 0.13 | 0.63d | −0.29 | −0.57c | 1+, 1− | |
| TGFBRAP1 | −0.46 | −0.07 | −0.17 | −0.27 | 0.39a | −0.02 | 0.35a |
TGFB1 (Table S4) expression correlated with expression of most other genes in the brain tissues: LTBP1/2/4, FBN1/2/3, TGFBR2/3, and TGFBI in cerebellum and LTBP1, FBN1/2, TGFBR2/3, TGFB1I1, and TGFBI in brain. No correlations were observed in gonadal tissues. TGFB2 (Table 2) correlated with TGFB3, FBN1/2/3, TGFBR1, and TGFBI in at least three tissues. It correlated significantly with LTBP1, FBN1/2, and TGFBR1/2 in both gonadal tissues, but with TGFBR3 and TGFBRAP1 in only the ovary, and TGFB3 and TGFBR3L in only the testis. TGFB2 correlated with LTBP2 negatively in the ovary, but positively in the testis. TGFB3 (Table S5) expression correlated significantly with TGFB2, LTBP2/3/4, FBN1/2/3, TGFBR2/3, TGFB1I1, and TGFBI in at least three tissues.
| Genes | Ovary (N = 18) | Testis (N = 27) | Heart (N = 38) | Kidney (N = 29) | Liver (N = 37) | Cerebellum (N = 33) | Brain (N = 32) | Number of organs A | |
|---|---|---|---|---|---|---|---|---|---|
| TGFB1 | 0.28 | −0.07 | 0.60c | −0.03 | −0.05 | 0.16 | −0.28 | 1+ | |
| TGFB2 | * | * | * | * | * | * | * | ||
| TGFB3 | 0.27 | 0.76d | 0.07 | 0.70d | 0.37a | 0.664d | 0.29 | 3+ | |
| LTBP1 | 0.69b | 0.70d | 0.54c | 0.14 | 0.00 | 0.05 | −0.26 | 3+ | |
| LTBP2 | −0.51a | 0.57b | 0.01 | −0.25 | −0.10 | 0.39a | 0.40a | 1+ | |
| LTBP3 | −0.15 | 0.37 | −0.14 | 0.27 | −0.01 | 0.44a | −0.09 | ||
| LTBP4 | −0.12 | 0.11 | −0.28 | −0.30 | 0.67d | −0.07 | −0.45b | 1+, 1− | |
| FBN1 | 0.75c | 0.62c | 0.38a | 0.23 | 0.85d | 0.37a | −0.05 | 3+ | |
| FBN2 | 0.65b | 0.62c | 0.46b | 0.36 | 0.98d | 0.10 | −0.11 | 4+ | |
| FBN3 | 0.13 | 0.00 | 0.79d | 0.54b | 0.89d | 0.23 | 0.40a | 3+ | |
| TGFBR1 | 0.72c | 0.64c | 0.76d | 0.54b | 0.82d | −0.32 | −0.18 | 5+ | |
| TGFBR2 | 0.80d | 0.73d | 0.01 | −0.33 | −0.05 | 0.44a | −0.08 | 2+ | |
| TGFBR3 | 0.65b | 0.25 | 0.11 | −0.17 | 0.74d | 0.23 | −0.19 | 2+ | |
| TGFB1I1 | 0.18 | −0.04 | −0.76d | −0.36 | 0.02 | 0.28 | −0.36a | 1− | |
| TGFBR3L | −0.18 | −0.57b | −0.27 | −0.15 | −0.31 | 0.30 | −0.14 | 1− | |
| TGFBI | 0.47a | 0.77d | 0.72d | 0.32 | 0.07 | 0.40a | −0.10 | 2+ | |
| TGFBRAP1 | 0.66b | 0.38 | 0.50b | 0.03 | 0.22 | 0.16 | 0.33 | 2+ |
Positive and negative correlations are marked in pink and blue, respectively. Colour intensity corresponds with strength of correlation. ‘*’ was for the correlation between the same gene.
P-values: a < 0.05; b < 0.01; c < 0.001; d < 0.0001.
LTBP1 (Table 3) expression correlated significantly (P < 0.01) with FBN1/2, TGFBR2, and TGFBI in five out of seven tissues and with TGFB2, LTBP2, TGFBR3, and TGFBRAP1 in at least three tissues. LTBP2 (Table S6) expression positively correlated with TGFBR2 in all tissues except the ovary, where the correlation was negative, and with TGFB3, LTBP2, FBN1/2, and TGFBI in at least three tissues. LTBP3 (Table S7) correlated significantly with TGFB1I1 in all tissues and TGBFR3L in at least five tissues, and with LTBP4 and TGFBI in at least three tissues. LTBP4 (Table S8) expression correlated significantly (P < 0.01) with TGFB1I1 in five tissues and with TGFB3, LTBP3, and TGFBR1 in at least three tissues.
| Genes | Ovary (N = 18) | Testis (N = 27) | Heart (N = 38) | Kidney (N = 29) | Liver (N = 37) | Cerebellum (N = 33) | Brain (N = 32) | Number of organs A | |
|---|---|---|---|---|---|---|---|---|---|
| TGFB1 | 0.35 | 0.17 | 0.33 | −0.41a | −0.12 | 0.70d | 0.52b | 2+ | |
| TGFB2 | 0.69b | 0.70d | 0.54c | 0.14 | 0.00 | 0.05 | −0.26 | 3+ | |
| TGFB3 | 0.36 | 0.52b | 0.16 | 0.32 | −0.05 | 0.10 | −0.28 | 1+ | |
| LTBP1 | * | * | * | * | * | * | * | ||
| LTBP2 | −0.09 | 0.58b | 0.23 | −0.31 | 0.66d | 0.49b | 0.16 | 3+ | |
| LTBP3 | −0.17 | 0.11 | 0.00 | −0.48a | −0.28 | −0.39a | −0.13 | ||
| LTBP4 | 0.14 | 0.09 | 0.08 | −0.25 | −0.06 | 0.32 | 0.17 | ||
| FBN1 | 0.84d | 0.55b | 0.47b | 0.22 | 0.17 | 0.81d | 0.79d | 5+ | |
| FBN2 | 0.41 | 0.60b | 0.71d | 0.67c | 0.02 | 0.93d | 0.87d | 5+ | |
| FBN3 | −0.01 | 0.13 | 0.18 | 0.34 | −0.14 | 0.16 | 0.11 | ||
| TGFBR1 | 0.40 | 0.44a | 0.40a | 0.46a | 0.02 | 0.78d | 0.63c | 2+ | |
| TGFBR2 | 0.71c | 0.576b | 0.39a | −0.12 | 0.75d | 0.58c | 0.51b | 5+ | |
| TGFBR3 | 0.63b | 0.39a | 0.07 | −0.25 | −0.16 | 0.86d | 0.70d | 3+ | |
| TGFB1I1 | 0.27 | −0.12 | −0.22 | −0.14 | −0.25 | 0.15 | 0.07 | ||
| TGFBR3L | −0.42 | −0.60b | −0.32 | −0.45a | −0.38a | −0.36a | −0.30 | 1− | |
| TGFBI | 0.33 | 0.72d | 0.47b | 0.03 | 0.62d | 0.79d | 0.84d | 5+ | |
| TGFBRAP1 | 0.71b | 0.49a | 0.612c | 0.63c | 0.81d | 0.06 | 0.14 | 4+ |
Positive and negative correlations are marked in pink and blue, respectively. Colour intensity corresponds with strength of correlation. ‘*’ was for the correlation between the same gene.
P-values: a < 0.05; b < 0.01; c < 0.001; d < 0.0001.
No FBNs were expressed in the liver. FBN1 and FBN2 (Tables S9 and S10, respectively) correlated significantly with each other in all other tissues except the heart. Both genes correlated with LTBP1/2, TGBF1/2/3, and TGFBI, while FBN2 only with TGFB2 in at least three tissues. FBN3 (Table 4) expression significantly correlated with FBN1/2 and TGFBR3 in the testis, with TGFB1/2, TGFBR1/2, and TGFBI in the heart, and with TGFB2/3, LTBP2, and TGFBR2/3 in the kidney.
| Genes | Ovary (N = 18) | Testis (N = 27) | Heart (N = 38) | Kidney (N = 29) | Liver (N = 37) | Cerebellum (N = 33) | Brain (N = 32) | Number of organs A | |
|---|---|---|---|---|---|---|---|---|---|
| TGFB1 | 0.20 | 0.23 | 0.71d | −0.01 | −0.06 | 0.47b | 0.00 | 1+ | |
| TGFB2 | 0.13 | 0.00 | 0.79d | 0.54b | 0.89d | 0.23 | 0.40a | 3+ | |
| TGFB3 | 0.54a | −0.23 | −0.26 | 0.69d | 0.24 | 0.28 | 0.49b | 2+ | |
| LTBP1 | −0.01 | 0.13 | 0.18 | 0.34 | −0.14 | 0.16 | 0.11 | ||
| LTBP2 | 0.19 | −0.19 | −0.27 | −0.55b | −0.20 | 0.38a | 0.23 | 1− | |
| LTBP3 | 0.80d | −0.19 | 0.08 | 0.34 | 0.00 | 0.38a | 0.00 | 1+ | |
| LTBP4 | 0.44 | −0.38 | −0.13 | 0.08 | 0.69d | 0.59c | −0.44a | 2+ | |
| FBN1 | −0.24 | −0.53b | −0.14 | −0.21 | 0.84d | 0.28 | 0.18 | 1+, 1− | |
| FBN2 | −0.13 | −0.54b | 0.31 | 0.05 | 0.92d | 0.27 | 0.21 | 1+, 1− | |
| FBN3 | * | * | * | * | * | * | * | ||
| TGFBR1 | −0.09 | 0.36 | 0.46b | 0.35 | 0.81d | −0.29 | −0.12 | 2+ | |
| TGFBR2 | −0.12 | −0.48a | −0.46b | −0.79d | −0.11 | 0.07 | −0.03 | 2− | |
| TGFBR3 | −0.10 | −0.63c | −0.13 | −0.77d | 0.86d | 0.26 | 0.02 | 1+, 2− | |
| TGFB1I1 | 0.55a | −0.35 | −0.54c | −0.04 | −0.04 | 0.22 | −0.30 | 1− | |
| TGFBR3L | 0.79c | 0.08 | −0.01 | −0.03 | −0.31 | 0.41a | −0.21 | 1+ | |
| TGFBI | 0.54a | −0.04 | 0.50b | 0.20 | −0.06 | 0.30 | 0.25 | 1+ | |
| TGFBRAP1 | −0.38 | 0.00 | 0.28 | 0.40a | 0.18 | −0.12 | 0.43a |
Positive and negative correlations are marked in pink and blue, respectively. Colour intensity corresponds with strength of correlation. ‘*’ was for the correlation between the same gene.
P-values: a < 0.05; b < 0.01; c < 0.001; d < 0.0001.
TGFBR1/2/3 (Tables 5, S11 and S12, respectively) correlated significantly with FBN1/2 in at least four tissues. TGFBR1 (Table 5) correlated significantly (P < 0.01) with TGFB2, LTBP4, TGFBR3, and TGFBR3L, while TGFBR2 (Table S11) correlated with LTBP1/2, TGFBR3, and TGFBI in at least four tissues. TGFBR3 (Table S12) expression showed predominantly significant correlations in the brain tissues, with TGFB1, LTBP1, FBN1/2, TGFBR1/2, and TGFBI in brain and cerebellum, and additionally with LTBP2 in cerebellum only. TGFB1I1 (Table S13) expression correlated significantly with LTBP3/4 in at least five tissues and with TGFBR1 and TGFBI in at least three tissues, whereby the correlations with TGFBR1 in testis, heart, and kidney were all negative. TGFBR3L (Table S14) correlated significantly with LTBP3 and TGFBR1 in five out of seven tissues. TGFBI (Table S15) correlated significantly (P < 0.01) and predominantly positively with TGFB1/3, LTBP1/2/3, FBN1/2, TGFBR2, and TGFB1I1 in at least three tissues while TGFBRAP1 (Table S16) correlated with LTBP1, TGFBR2, and TGFBR3L in at least three tissues.
| Genes | Ovary (N = 18) | Testis (N = 27) | Heart (N = 38) | Kidney (N = 29) | Liver (N = 37) | Cerebellum (N = 33) | Brain (N = 32) | Number of organs A | |
|---|---|---|---|---|---|---|---|---|---|
| TGFB1 | 0.04 | −0.10 | 0.20 | −0.55b | −0.04 | 0.31 | 0.15 | 1− | |
| TGFB2 | 0.72c | 0.64c | 0.76d | 0.54b | 0.82d | −0.32 | −0.18 | 5+ | |
| TGFB3 | −0.05 | 0.05 | 0.11 | 0.35 | 0.37a | −0.26 | −0.32 | ||
| LTBP1 | 0.40 | 0.44a | 0.40a | 0.46a | 0.02 | 0.78d | 0.63c | 2+ | |
| LTBP2 | −0.63b | −0.03 | 0.03 | −0.30 | −0.10 | 0.15 | 0.01 | 1− | |
| LTBP3 | −0.49a | −0.36 | −0.38a | −0.42a | −0.11 | −0.60c | −0.50b | 2− | |
| LTBP4 | −0.45 | −0.51b | −0.48b | −0.75d | 0.52c | 0.06 | 0.18 | 1+, 3− | |
| FBN1 | 0.56a | −0.02 | 0.54b | 0.11 | 0.86d | 0.46b | 0.71d | 4+ | |
| FBN2 | 0.91d | 0.20 | 0.21 | 0.45a | 0.85d | 0.65d | 0.68d | 4+ | |
| FBN3 | −0.09 | 0.36 | 0.46b | 0.35 | 0.81d | −0.29 | −0.12 | 2+ | |
| TGFBR1 | * | * | * | * | * | * | * | ||
| TGFBR2 | 0.58a | 0.21 | 0.39a | −0.37 | 0.18 | 0.33 | 0.29 | ||
| TGFBR3 | 0.43 | −0.12 | 0.50b | −0.20 | 0.85d | 0.55c | 0.62c | 4+ | |
| TGFB1I1 | −0.24 | −0.70d | −0.78d | −0.77d | −0.19 | −0.01 | −0.30 | 3− | |
| TGFBR3L | −0.32 | −0.57b | −0.37a | −0.58b | −0.50b | −0.54b | −0.47b | 5− | |
| TGFBI | 0.14 | 0.18 | 0.61c | −0.29 | −0.01 | 0.41a | 0.60c | 2+ | |
| TGFBRAP1 | 0.68b | 0.52b | 0.37a | 0.26 | 0.36a | 0.10 | 0.03 | 2+ |
Positive and negative correlations are marked in pink and blue, respectively. Colour intensity corresponds with strength of correlation. ‘*’ was for the correlation between the same gene.
P-values: a < 0.05; b < 0.01; c < 0.001; d < 0.0001.
Analysis of relationships between the TGFβ signalling molecules was additionally conducted using ln transformed data from the foetal ovaries (Table S42) and is shown for comparison with non ln transformed data (Table S41). Essentially similar relationships were identified but with generally slightly lower statistical significance with the transformed data.
Relationships of TGFβ signalling molecules with PCOS candidate genes in foetal tissues
The correlations of PCOS candidate genes with TGFβ signalling molecules within each foetal tissue were examined (Tables 6–8 and S17–S40). Significant correlations of TGFβ signalling molecules within tissues were observed for the PCOS candidate genes HMGA2 (Table 6), YAP1 (Table 7), and RAD50 (Table 8). The least number of correlations with TGFβ signalling molecules in the different foetal tissues occurred with the PCOS candidate genes FSHB, NEIL2, SUOX, and SUMO1P1 (Tables S17, S31, S39, and S40, respectively).
| Genes | Ovary (N = 18) | Testis (N = 27) | Heart (N = 38) | Kidney (N = 29) | Liver (N = 37) | Cerebellum (N = 33) | Brain (N = 32) | Number of organs A | |
|---|---|---|---|---|---|---|---|---|---|
| TGFB1 | 0.37 | 0.26 | 0.79d | −0.04 | 0.01 | 0.74d | 0.38a | 2+ | |
| TGFB2 | 0.85d | 0.33 | 0.80d | 0.53b | 0.87d | 0.07 | −0.15 | 4+ | |
| TGFB3 | 0.01 | −0.12 | −0.34 | 0.39a | 0.29 | 0.08 | −0.35 | ||
| LTBP1 | 0.47a | 0.38 | 0.24 | 0.36 | −0.18 | 0.96d | 0.75d | 2+ | |
| LTBP2 | −0.79c | −0.11 | −0.31 | −0.61c | −0.25 | 0.57c | 0.08 | 3− | |
| LTBP3 | −0.30 | −0.35 | −0.23 | −0.08 | −0.09 | −0.39a | −0.45b | 1− | |
| LTBP4 | −0.32 | −0.50b | −0.30 | −0.35 | 0.68d | 0.29 | 0.31 | 1+, 1− | |
| FBN1 | 0.75c | −0.37 | −0.10 | −0.19 | 0.87d | 0.88d | 0.83d | 4+ | |
| FBN2 | 0.88d | −0.26 | 0.43a | 0.15 | 0.91d | 0.98d | 0.84d | 4+ | |
| FBN3 | −0.02 | 0.75d | 0.87d | 0.73d | 0.95d | 0.26 | −0.01 | 4+ | |
| TGFBR1 | 0.84d | 0.73d | 0.48b | 0.68d | 0.85d | 0.71d | 0.76d | 7+ | |
| TGFBR2 | 0.84d | −0.16 | −0.33 | −0.77d | −0.04 | 0.61c | 0.47b | 3+, 1− | |
| TGFBR3 | 0.56a | −0.42a | 0.08 | −0.53b | 0.95d | 0.90d | 0.74d | 3+, 1− | |
| TGFB1I1 | 0.00 | −0.58b | −0.63d | −0.42a | −0.09 | 0.15 | −0.18 | 2− | |
| TGFBR3L | −0.28 | −0.28 | −0.15 | −0.23 | −0.42b | −0.34 | −0.36a | 1− | |
| TGFBI | 0.30 | 0.07 | 0.56c | −0.09 | −0.06 | 0.82d | 0.79d | 3+ | |
| TGFBRAP1 | 0.67b | 0.38 | 0.42a | 0.31 | 0.18 | 0.08 | 0.01 | 1+ |
| Genes | Ovary (N = 18) | Testis (N = 27) | Heart (N = 38) | Kidney (N = 29) | Liver (N = 37) | Cerebellum (N = 33) | Brain (N = 32) | Number of organs A | |
|---|---|---|---|---|---|---|---|---|---|
| TGFB1 | 0.11 | −0.05 | 0.02 | −0.49b | 0.00 | 0.65d | 0.49b | 2+, 1− | |
| TGFB2 | 0.75c | 0.86d | 0.40a | 0.07 | 0.90d | −0.03 | −0.21 | 3+ | |
| TGFB3 | −0.12 | 0.51b | 0.18 | −0.19 | 0.34a | 0.01 | −0.40a | 1+ | |
| LTBP1 | 0.51a | 0.73d | 0.56c | 0.36 | −0.05 | 0.95d | 0.87d | 4+ | |
| LTBP2 | −0.60b | 0.45a | 0.18 | 0.00 | −0.17 | 0.49b | 0.13 | 1+, 1− | |
| LTBP3 | −0.53a | −0.02 | −0.46b | −0.77d | −0.14 | −0.45b | −0.46b | 4− | |
| LTBP4 | −0.44 | −0.08 | −0.41a | −0.70d | 0.63d | 0.17 | 0.24 | 1+, 1− | |
| FBN1 | 0.69b | 0.44a | 0.55c | 0.01 | 0.92d | 0.82d | 0.92d | 5+ | |
| FBN2 | 0.89d | 0.49a | 0.34 | 0.36 | 0.93d | 0.95d | 0.94d | 4+ | |
| FBN3 | −0.20 | 0.13 | −0.02 | −0.29 | 0.92d | 0.08 | 0.02 | 1+ | |
| TGFBR1 | 0.96d | 0.83d | 0.68d | 0.56b | 0.94d | 0.83d | 0.84d | 7+ | |
| TGFBR2 | 0.67b | 0.57b | 0.65d | 0.20 | 0.10 | 0.61c | 0.48b | 5+ | |
| TGFBR3 | 0.57a | 0.23 | 0.67d | 0.33 | 0.93d | 0.89d | 0.84d | 4+ | |
| TGFB1I1 | −0.27 | −0.35 | −0.55c | −0.60b | −0.15 | 0.03 | −0.17 | 2− | |
| TGFBR3L | −0.48a | −0.73d | −0.36a | −0.49a | −0.50b | −0.44a | −0.40a | 2− | |
| TGFBI | 0.04 | 0.52b | 0.36a | −0.18 | 0.01 | 0.77d | 0.89d | 3+ | |
| TGFBRAP1 | 0.80d | 0.60b | 0.52b | −0.05 | 0.30 | 0.10 | 0.00 | 3+ |
| Genes | Ovary (N = 18) | Testis (N = 27) | Heart (N = 38) | Kidney (N = 29) | Liver (N = 37) | Cerebellum (N = 33) | Brain (N = 32) | Number of organs A | |
|---|---|---|---|---|---|---|---|---|---|
| TGFB1 | −0.32 | −0.22 | 0.28 | −0.45a | 0.04 | 0.27 | 0.06 | ||
| TGFB2 | −0.05 | 0.46a | 0.53b | 0.29 | 0.35a | 0.04 | 0.03 | 1− | |
| TGFB3 | −0.34 | 0.17 | 0.14 | −0.07 | 0.14 | −0.15 | −0.03 | ||
| LTBP1 | 0.34 | 0.64c | 0.71d | 0.25 | 0.56c | 0.74d | 0.48b | 5+ | |
| LTBP2 | 0.24 | 0.27 | 0.15 | −0.04 | 0.19 | 0.26 | 0.24 | ||
| LTBP3 | −0.63b | −0.38 | −0.42a | −0.62c | −0.32a | −0.61c | −0.46b | 4− | |
| LTBP4 | −0.30 | −0.20 | −0.29 | −0.76d | 0.22 | −0.14 | −0.18 | 1− | |
| FBN1 | 0.21 | 0.29 | 0.55c | 0.02 | 0.63d | 0.62c | 0.65d | 4+ | |
| FBN2 | −0.04 | 0.44a | 0.52b | 0.32 | 0.41a | 0.63d | 0.57c | 3+ | |
| FBN3 | −0.62b | −0.10 | 0.14 | −0.17 | 0.33a | −0.16 | 0.20 | 1− | |
| TGFBR1 | 0.08 | 0.58b | 0.56c | 0.68c | 0.60d | 0.75d | 0.71d | 6+ | |
| TGFBR2 | −0.06 | 0.50b | 0.54b | 0.00 | 0.72d | 0.49b | 0.46b | 5+ | |
| TGFBR3 | 0.23 | 0.52b | 0.54b | 0.22 | 0.50b | 0.62c | 0.59c | 5+ | |
| TGFB1I1 | −0.53a | −0.47a | −0.53b | −0.72d | −0.35a | −0.23 | −0.40a | 2− | |
| TGFBR3L | −0.74c | −0.79d | −0.40a | −0.44a | −0.72 d | −0.52b | −0.60c | 5− | |
| TGFBI | −0.55a | 0.16 | 0.40a | −0.24 | 0.25 | 0.43a | 0.50b | 1+ | |
| TGFBRAP1 | 0.52a | 0.79d | 0.68d | −0.05 | 0.85d | 0.49b | 0.53b | 5+ |
HMGA2, YAP1, and RAD50 (Tables 6–8) correlated significantly with TGFBR1 in at least six out of the seven tissues studied. The three genes also correlated significantly with FBN1/2 and TGFBR2/3 in at least four foetal tissues. HMGA2 and YAP1 expression significantly correlated with TGFB2 in at least four tissues. While YAP1 and RAD50 correlated significantly with LTBP1/3 in at least four tissues, RAD50 expression additionally significantly (P < 0.01) correlated with TGFBR3L and TGFBRAP1 in five tissues. HMGA2 and YAP1 expression correlated significantly with all TGFβ signalling molecules in at least one tissue but this was not observed for RAD50 as there was no correlation with TGFB3 and LTBP2 in any of the tissues studied.
FSHR (Table S18) showed strong correlations with some of the TGFβ signalling molecules in liver and brain. Despite this relationship it should be noted that FSHR expression levels were very low for most tissues except for the ovary and testis, as expected (Azumah et al. 2023). LHCGR and AR also showed low expression except for the ovary and testis, and AMH showed low expression except only for the testis (Azumah et al. 2023). LHCGR (Table S19) and AR (Table S20) expression correlated with several TGFβ molecules particularly in the brain tissues. However, LHCGR significantly and negatively correlated with TGFB2, TGFBR1, and TGFBI in the testis. AR expression correlated significantly with TGFB2/3, LTBP2, FBN1, and TGFBR2 in both heart and testis, with LTBP2/3, FBN3, and TGFBR3 in testis only and LTBP1, TGFBR1, and TGFB1I1 in heart only. AMH (Table S21) expression correlated significantly and negatively with TGFB2/3, LTBP1, TGFBR1/2, and TGFBRAP1, and positively with TGFBR3L in testis. It also correlated positively with TGFB3, LTBP3, FBN3, TGFB1/1, TGFBR3L, and TGFBI in foetal ovary. INSR (Table S22) showed significant negative correlations with FBN2, TGFBR3, and TGFBI, and positive correlations with TGFBRAP1 in brain and cerebellum, and additionally positive with TGFB3 and negative with LTBP1, FBN1, and TGFBR1 in the brain. FDFT1 (Table S23) did not correlate with many TGFβ signalling molecules in any of the tissues.
ERBB3 (Table S24) significantly correlated with TGFB1/2, FBN3, TGFB1, TGFB1I1, TGFBI, and TGFBRAP1 in the heart. The positive correlations with TGFβ signalling molecules in the brain and cerebellum, whilst statistically significant, were a result of very low expression levels in these tissues (Azumah et al. 2023). ERBB4 (Table S25) correlated significantly with LTBP3, TGFBR1, and TGFBRAP1 in testis and ovary, but only with LTBP2 and FBN2 in the ovary and with TGFB1I1 in the testis. The observed correlations in the liver were also related to very low expression of ERBB4 (Azumah et al. 2023) and the TGFβ signalling molecules (Figs 1, 2, S2, S3, and S4) in this tissue. PLGRKT (Table S26) expression correlated significantly and negatively with genes in testis including TGFB2/3, LTBP2, FBN1/2, TGFBR2/3, and TGFBRAP1, whereas it correlated positively with TGFBR3L. TOX3 (Table S27) expression significantly correlated with FBN3 in five out of seven tissues and with TGFBR1/3 and TGFBR3L in at least three tissues. GATA4 (Table S28) expression correlated significantly positively with TGFB2, LTBP4, FBN1/2/3, and TGBFBR1/3 in liver and with LTBP2 positively in the ovaries, and negatively with FBN2 and TGFBR1/2 in both gonads, TGFBI in testis and TGFBRAP1 in ovary. ZBTB16 (Table S29) significantly correlated with TGFB1, LTBP1, FBN1/2, TGFBR1/2/3, and TGFBI in at least three tissues, most of which were in the testis, liver, brain, and cerebellum. IRF1 (Table S30) expression correlated significantly with LTBP4, FBN1/2/3, and TGFBR2/3 in the testis, with LTBP2/4, FBN3, TGFBR1/2, and TGFB1/1 in kidneys, with TGFB2/3 and TGFBR3L in cerebellum, and with TGFB1 and TGFBR2 in brain. KRRI (Table S32) expression correlated significantly with LTPB1/3, FBN1, and TGFBR1/2 in at least three tissues. The strongest positive correlations were with TGFBR1/2/3 in the heart and TGFBR1 in brain and cerebellum.
RAB5B (Table S33) significantly correlated positively with TGFBRAP1 in all tissues except the kidney, and with FBN1, TGFBR2/3, and TGFBR3L in at least three tissues. ARL14EP (Table S34) expression showed significant correlations (P < 0.01) with LTBP3, FBN3, and TGFBR2/3 in the heart, while DENND1A (Table S35) correlated significantly with TGFB2/3, LTBP3, TGFBR1, and TGFBR3L in cerebellum, with TGFB1 in heart and TGFB1/1 in kidney. THADA (Table S36) showed the most significant correlations in heart (TGFB2, LTBP1, FBN1/2, TGFBR1/3, TGFB1/1, TGFBI, and TGFBRAP1) and the brain and cerebellum (LTBP1/3, FBN1/2, TGFBR1/3, and TGFBI). MAPRE1 (Table S37) expression correlated significantly with LTBP1 and TGFBR1 in five out of seven tissues, and with LTBP3 and TGFB1I1 in at least three tissues. AOPEP (Table S38) expression correlated significantly with LTBP1/3, FBN1/2, TGFBR1, TGFBI, and TGFBRAP1 in at least three tissues. In the metabolic tissues, the correlations were predominantly negative, except for LTBP3, TGFB1I1, and TGFBR3L.
Analysis of relationships between the TGFβ signalling molecules and PCOS candidate genes was additionally conducted using log-transformed data from the foetal ovaries (Table S44) and is shown for comparison with non-log-transformed data (Table S43). Essentially similar relationships were identified but with generally slightly lower statistical significance with the transformed data.
Postnatal gene expression of TGFβ signalling molecules
The expression of TGFβ family genes was studied in testis, heart, liver, brain, and cerebellum from birth until adulthood, and in kidney samples from birth up to 8 years of age. There were no postnatal ovary samples. We also compared the levels of expression in the adult tissues to expression in foetal tissues. Expression levels of TGFβ signalling molecules were generally lower during adulthood compared to expression in foetal tissues.
The postnatal expression of TGFB1/2/3 (Figs 1 and S1A, B, respectively) decreased significantly from birth throughout life in all tissues except for TGFB1/3 in the heart, where expression increased. In most cases, expression levels were similar to those in foetal tissues, except for TGFB3 in the cerebellum where expression levels were very high at birth and afterwards decreased substantially.
LTBP1/2/4 (Figs 2 and S2A, C, respectively) levels were very low and constant in brain tissues, whereas LTBP3 (Fig. S2B) levels were relatively high. Expression of all four genes decreased from birth until adulthood in the testis and were dynamically expressed in the metabolic tissues with the least expression in the liver. LTBP2/3/4 levels increased with age while LTBP1 levels decreased in heart tissues.
FBN1/2/3 (Figs 3 and S3A, B) expression declined after birth and remained low throughout adulthood in all tissues studied. TGFBR1/2/3 (Figs 4 and S4A, B) levels remained constant in most postnatal tissues with few exceptions. TGFBR2 levels increased after birth until before puberty in kidney and testis, and before adulthood in the heart. The same patterns were observed in kidney and testis for TGFBR3.
TGFB1I1 (Fig. S5A) and TGFBI (Fig. S5C) expression had similar patterns in the testis: higher expression during prepubertal stages and lower expression during adulthood. Their levels in the brain and cerebellum were low and constant from birth. Both genes were dynamically expressed in metabolic tissues. However, TGFBR3L (Fig. S5B) expression was low and constant in all tissues except in the brain and cerebellum, where its expression increased significantly from birth until adulthood. TGFBRAP1 (Fig. S5D) levels remained constant in metabolic tissues, brain, and cerebellum, similar to their expression in the respective foetal tissues. However, in the testis, the levels decreased during late puberty and remained low and constant during adulthood.
Discussion
In this study, we examined the expression patterns and levels of TGFβ signalling molecules from 4 to 20 weeks of gestation and at different stages of postnatal human life. Seven different tissues were included. The relationships between the expression of these genes in foetal tissues to each other and to gestational age, and prenatal and/or postnatal levels of expression were compared. The expression of TGFβ signalling molecules was also related to expression of PCOS candidate genes within each foetal tissue. While some of the expression patterns observed in the human foetal ovary were consistent with our previous findings in bovine foetal ovaries during 8–18 wpc (Hatzirodos et al. 2011, 2019; Azumah et al. 2021), expression patterns from mid- to late gestation as seen previously in bovine (Hatzirodos et al. 2011, 2019; Azumah et al. 2021) could not be inferred because of the lack of human samples at these gestational phases. Also, no postnatal ovary samples were available for this study. Notably, foetal testis tissues were included in this study based on previous evidence of PCOS-like symptoms, especially metabolic ones (Cannarella et al. 2018; Di Guardo et al. 2020), observed in brothers of PCOS women. Here, we highlight from this plethora of information the most significant findings.
Studies on the role of androgens, insulin, AMH, and TGFβ1 in the signalling pathways associated with PCOS have recently been reviewed (Walters et al. 2022). In particular, TGFβ signalling molecules have been associated with fibrosis in various tissues including the heart, kidney, lung, liver, and ovary, and the mechanisms involved have been reviewed (Gressner et al. 2002; Biernacka et al. 2011; Zhou et al. 2017). Interestingly, these regulators have been previously associated with the development of fibrous ovarian stroma observed in PCOS women as well as its predisposition to PCOS (Hatzirodos et al. 2011). Skeletal muscle of women with PCOS tend to have higher expression of genes controlled by TGFβ and produce more collagens (Stepto et al. 2020). Also, TGFβ2 levels in circulation correlate with androgen levels in women (Raja-Khan et al. 2014), clearly showing a connection between TGFβs and androgens. Recent studies have shown that TGFβ1 could regulate some genes in loci associated with PCOS in cultured foetal ovarian fibroblasts (Hartanti et al. 2020; Azumah et al. 2022). Specifically, TGFB1 inhibited expression of genes including INSR, C8H9orf3, RAD50, ERBB3, NEIL2, IRF1, and ZBTB16 in foetal ovarian fibroblasts in vitro (Hartanti et al. 2020; Azumah et al. 2022). Note that androgens and AMH, which have been used to induce PCOS in animals previously (Dumesic et al. 1997; Abbott et al. 2006; Walters 2016; Tata et al. 2018; Risal et al. 2019; Hartanti et al. 2020; Stener-Victorin et al. 2020), did not regulate any of the PCOS candidate genes in foetal ovarian fibroblasts in vitro (Hartanti et al. 2020; Azumah et al. 2022). TGFβ1 also inhibited the expression of the androgen receptor (AR) and stimulated expression of its cofactor TGFβ induced transcript 1 (TGFB1I1) (Hartanti et al. 2020; Azumah et al. 2022). These findings further infer crosstalk between TGFβ signalling pathways and androgen signalling. Collectively, all these results further affirm TGFβ’s possible role in the aetiology of PCOS.
Examining genes in loci associated with PCOS also sheds light on the aetiology of PCOS. We had previously found these PCOS candidate genes to be dynamically expressed during foetal ovary development (Hartanti et al. 2020; Liu et al. 2020; Azumah et al. 2021), whereas in adult ovarian stroma there was no difference in the expression of these genes between control and PCOS samples (Liu et al. 2020). We also found recently that many of the PCOS genes were dynamically expressed across gestation in many other foetal tissues (Azumah et al. 2023). In the foetal bovine ovary, we found PCOS expression patterns across gestation could be divided into similarly expressed groups and that genes in these groups were co-expressed with genes involved in either mitochondrial function, stroma expansion, or steroidogenesis (Azumah et al. 2021). The mitochondrial genes were both nuclear and mitochondrially encoded (Azumah et al. 2021). Upstream regulators associated with these pathways according to Ingenuity Pathway Analyses (IPA) and KEGG analyses identified TGFβ1/2/3 among others are upstream regulators of genes involved in stroma expansion (Azumah et al. 2021). Furthermore, a meta-analysis involving lean (BMI ≤ 23) and obese (BMI > 23) PCOS patients in a systematic and comparative study by Idicula-Thomas et al. (2020), found that some PCOS candidate genes and TGFβ signalling genes were differentially expressed in different tissues. ZBTB16, FSHR, GATA4, TGFB1I1, AR, and LTBP4 were downregulated in cumulus cells and TGFB2 in subcutaneous adipose tissue of lean PCOS women, while INSR, THADA, PLGRKT, TGFBI, FBN1, and LTBP1 were downregulated in endometrial tissues in obese PCOS women (Idicula-Thomas et al. 2020). A recent study showed that correlations between the expression of HMGA2/YAP1 and RAD50/YAP1 were significant in at least five of the seven foetal tissues analysed (ovary, testis, kidney, liver, heart, cerebellum, and brain) during the first half of human foetal development (Azumah et al. 2023). Thus, there is clearly a real possibility that misregulation of genes in loci associated with PCOS during foetal development could be involved in the aetiology of PCOS.
In the current study, the expression of three PCOS candidate genes (HMGA2, YAP1, and RAD50) in particular correlated significantly with many TGFβ signalling molecules during the first half of human foetal development in most tissues. Although the specific roles of the three genes in the aetiology of PCOS remain unknown, their functional roles are intriguingly associated directly or indirectly with some phenotypes of the syndrome. In numerous studies, HMGA2 has been associated with birthweight as well as adult and childhood height (Weedon et al. 2007; Horikoshi et al. 2013; Beaumont et al. 2018). Birthweight has been associated with the risk of obesity and hyperandrogenaemia, while ponderal index (weight per cubic length) at birth has been independently associated with some symptoms of PCOS in adulthood (Yu et al. 2011; Davies et al. 2012). Low birthweight, for instance, has been associated with coronary artery disease, hypertension, obesity, and insulin resistance among others [see review by (Calkins and Devaskar 2011)]. Understanding the role of HMGA2 in the foetal onset of adult disorders/symptoms observed in PCOS will enhance the understanding of the aetiology of PCOS.
HMGA2 and YAP1 are involved in epithelial–mesenchymal transition (EMT) during embryogenesis through TGFβ signalling (Thuault et al. 2006; Vignali and Marracci 2020; Martínez Traverso et al. 2022). Both HMGA2 and YAP1 are also involved in the Hippo signalling pathway, which regulates organ size by regulating cell differentiation and apoptosis (Huang et al. 2005; Varelas 2014; Zhang et al. 2014; Shen et al. 2015; Xu et al. 2021) including in the ovary (Clark et al. 2022). Interaction between TGFβ and Hippo signalling pathways has been shown to stimulate hepatocytes to undergo an EMT-like response in a TGFβ-enriched microenvironment (Oh et al. 2018). HMGA2 regulates YAP1 stability via the Hippo–YAP signalling pathway and possibly inhibits its ubiquitination, which has been shown to regulate the progression of EMT in human breast cancer cell lines (Xu et al. 2021). Additionally, YAP1 has also been shown to regulate fibrosis in liver (Martin et al. 2016), lung (Chen et al. 2019), and heart (Li et al. 2022), contributing to numerous diseases including cardiovascular diseases, diabetes, and cancers (Salloum et al. 2021). In the ovary, HMGA2 has been associated with the Polycystic Ovary Morphology (PCOM) phenotype in PCOS patients of Han Chinese ancestry, potentially promoting the proliferation of ovarian granulosa cells via the HMGA2/IMP2 pathway (Li et al. 2019). This could possibly account for the increased proliferation of early preantral follicles and decreased apoptosis in granulosa cells in PCOS (Stubbs et al. 2007; Das et al. 2008; Li et al. 2019). HMGA2 genetics has also been significantly associated with both hyperandrogenaemia and oligo/amenorrhea in women with PCOS (Bakhashab and Ahmed 2019). More so, YAP1, which is highly expressed in mammalian oocytes and preimplantation embryos, is essential for normal ovarian development and function, as well as granulosa cell proliferation (Yu et al. 2016; Ji et al. 2017). YAP1 is also regulated by oestrogen, follicle-stimulating hormone (FSH), and luteinising hormone (LH) (Ji et al. 2017; Sun and Diaz 2019; de Andrade et al. 2022; Moon et al. 2022). However, the consequences of this regulation in PCOS women has not been studied. In granulosa cells of women with PCOS, a significant decrease in DNA methylation levels were observed in the promoter region of YAP1, accounting for a significant increase in the mRNA and protein expression levels of YAP1 (Jiang et al. 2017). Treatment of granulosa cells from healthy women with testosterone reduced YAP1 methylation in a dose-dependent manner (Jiang et al. 2017), whereas LH or FSH had no effect. This implies regulatory roles of androgens on this gene. It is not known if the exposure to high levels of androgens and AMH during pregnancy in PCOS women leads to dysregulation of any of the genes in loci associated with PCOS, such as YAP1 and HMGA2, as well as TGFβ signalling molecules during foetal development.
Conclusion
Most TGFβ signalling molecules were actively expressed in all foetal tissues studied, except in the liver, and the expression levels of some correlated with the expression of PCOS candidate genes. The findings and interpretations of this study also confirm that the dynamic expression of both TGFβ signalling molecules and PCOS candidate genes occurs during foetal and postnatal development in gonadal, metabolic, and brain tissues. Thus, perturbations operating at different pre- and postnatal times would likely affect different genes to different degrees. This could be one mechanism to perhaps help account for the variations of symptoms and phenotypes observed in women with PCOS.
Data availability
All data generated or analysed during this study are included in this published article and its supplementary information files.
Conflicts of interest
R.A.A. reports consultancy work for Ferring Merck, IBSA, Roche Diagnostics. The other authors of this manuscript have nothing to declare and no conflicts of interest that could be perceived as prejudicing the impartiality of the research reported.
Declaration of funding
Funding was received from Australian Research Training Program (R.A.) and the Faculty of Health and Medical Science Divisional Scholarship (R.A.), Robinson Research Institute Career Development Fellowship (K.H.) and Building On Ideas Grant (K.H.), National Health and Medical Research Council of Australia Centre for Research Excellence in the Evaluation, Management and Health Care Needs of Polycystic Ovary Syndrome (R.J.R.; GTN1078444) and The Centre for Research Excellence on Women’s Health in Reproductive life (R.A., R.J.R. and K.H.; GTN1171592) and the UK Medical Research Council (R.A.A.; grant No. G1100357). The funders did not play any role in the study design, data analysis, decision to publish, or preparation of the manuscript.
Author contributions
R.A., K.H., and R.J.R. designed the study. R.A. performed statistical analysis. R.A., K.H., and R.J.R. interpreted the data and contributed to discussion. R.A., K.H., R.A.A., and R.J.R. wrote the manuscript. R.J.R. is the guarantor of this work, had full access to all the data in the study, and assumes full responsibility for the integrity of the data and the accuracy of the data analysis.
Acknowledgements
We are grateful to Margarida Cardoso-Moreira of the Center for Molecular Biology of Heidelberg University, Heidelberg, Germany, and the Evolutionary Developmental Biology Laboratory, The Francis Crick Institute, London NW1 1AT, UK, for providing data to facilitate this study and also the ‘Gene expression across mammalian organ development’ project for making their RNA-seq data available.
References
Abbott DH, Dumesic DA, Levine JE, Dunaif A, Padmanabhan V (2006) Animal models and fetal programming of the polycystic ovary syndrome. In ‘Androgen excess disorders in women’. (Eds R Azziz, JE Nestler, D Dewailly) pp. 259–272. (Humana Press) doi:10.1007/978-1-59745-179-6_23
Anagnostis P, Tarlatzis BC, Kauffman RP (2018) Polycystic ovarian syndrome (PCOS): long-term metabolic consequences. Metabolism 86, 33-43.
| Crossref | Google Scholar | PubMed |
Azumah R, Hummitzsch K, Hartanti MD, St John JC, Anderson RA, Rodgers RJ (2021) Analysis of upstream regulators, networks, and pathways associated with the expression patterns of polycystic ovary syndrome candidate genes during fetal ovary development. Frontiers in Genetics 12, 762177.
| Crossref | Google Scholar | PubMed |
Azumah R, Liu M, Hummitzsch K, Bastian NA, Hartanti MD, Irving-Rodgers HF, Anderson RA, Rodgers RJ (2022) Candidate genes for polycystic ovary syndrome are regulated by TGFβ in the bovine foetal ovary. Human Reproduction 37(6), 1244-1254.
| Crossref | Google Scholar | PubMed |
Azumah R, Hummitzsch K, Anderson RA, Rodgers RJ (2023) Genes in loci genetically associated with polycystic ovary syndrome are dynamically expressed in human fetal gonadal, metabolic and brain tissues. Frontiers in Endocrinology 14, 1149473.
| Crossref | Google Scholar | PubMed |
Bakhashab S, Ahmed N (2019) Genotype based risk predictors for polycystic ovary syndrome in Western Saudi Arabia. Bioinformation 15(11), 812-819.
| Crossref | Google Scholar | PubMed |
Beaumont RN, Warrington NM, Cavadino A, Tyrrell J, Nodzenski M, Horikoshi M, Geller F, Myhre R, Richmond RC, Paternoster L, et al. (2018) Genome-wide association study of offspring birth weight in 86 577 women identifies five novel loci and highlights maternal genetic effects that are independent of fetal genetics. Human Molecular Genetics 27(4), 742-756.
| Crossref | Google Scholar | PubMed |
Biernacka A, Dobaczewski M, Frangogiannis NG (2011) TGF-β signaling in fibrosis. Growth Factors 29(5), 196-202.
| Crossref | Google Scholar | PubMed |
Buckett WM, Bouzayen R, Watkin KL, Tulandi T, Tan SL (1999) Ovarian stromal echogenicity in women with normal and polycystic ovaries. Human Reproduction 14(3), 618-621.
| Crossref | Google Scholar | PubMed |
Butt MS, Saleem J, Aiman S, Zakar R, Sadique I, Fischer F (2022) Serum anti-Müllerian hormone as a predictor of polycystic ovarian syndrome among women of reproductive age. BMC Women’s Health 22(1), 199.
| Crossref | Google Scholar | PubMed |
Calkins K, Devaskar SU (2011) Fetal origins of adult disease. Current Problems in Pediatric and Adolescent Health Care 41(6), 158-176.
| Crossref | Google Scholar | PubMed |
Cannarella R, Condorelli RA, Mongioì LM, La Vignera S, Calogero AE (2018) Does a male polycystic ovarian syndrome equivalent exist? Journal of Endocrinological Investigation 41, 49-57.
| Crossref | Google Scholar | PubMed |
Cardoso-Moreira M, Halbert J, Valloton D, Velten B, Chen C, Shao Y, Liechti A, Ascencao K, Rummel C, Ovchinnikova S, Mazin PV, Xenarios I, Harshman K, Mort M, Cooper DN, Sandi C, Soares MJ, Ferreira PG, Afonso S, Carneiro M, Turner JMA, VandeBerg JL, Fallahshahroudi A, Jensen P, Behr R, Lisgo S, Lindsay S, Khaitovich P, Huber W, Baker J, Anders S, Zhang YE, Kaessmann H (2019) Gene expression across mammalian organ development. Nature 571(7766), 505-509.
| Crossref | Google Scholar | PubMed |
Chen Y, Zhao X, Sun J, Su W, Zhang L, Li Y, Liu Y, Zhang L, Lu Y, Shan H, Liang H (2019) YAP1/Twist promotes fibroblast activation and lung fibrosis that conferred by miR-15a loss in IPF. Cell Death & Differentiation 26(9), 1832-1844.
| Crossref | Google Scholar | PubMed |
Clark KL, George JW, Przygrodzka E, Plewes MR, Hua G, Wang C, Davis JS (2022) Hippo signaling in the ovary: emerging roles in development, fertility, and disease. Endocrine Reviews 43(6), 1074-1096.
| Crossref | Google Scholar | PubMed |
Comerford KB, Almario RU, Kim K, Karakas SE (2012) Lean mass and insulin resistance in women with polycystic ovary syndrome. Metabolism 61(9), 1256-1260.
| Crossref | Google Scholar | PubMed |
Cox MJ, Edwards MC, Rodriguez Paris V, Aflatounian A, Ledger WL, Gilchrist RB, Padmanabhan V, Handelsman DJ, Walters KA (2020) Androgen action in adipose tissue and the brain are key mediators in the development of PCOS traits in a mouse model. Endocrinology 161(7), bqaa061.
| Crossref | Google Scholar |
Das M, Djahanbakhch O, Hacihanefioglu B, Saridogan E, Ikram M, Ghali L, Raveendran M, Storey A (2008) Granulosa cell survival and proliferation are altered in polycystic ovary syndrome. The Journal of Clinical Endocrinology & Metabolism 93(3), 881-887.
| Crossref | Google Scholar | PubMed |
Davies MJ, March WA, Willson KJ, Giles LC, Moore VM (2012) Birthweight and thinness at birth independently predict symptoms of polycystic ovary syndrome in adulthood. Human Reproduction 27(5), 1475-1480.
| Crossref | Google Scholar | PubMed |
de Andrade LG, Portela VM, Dos Santos EC, Aires KdV, Ferreira R, Missio D, da Silva Z, Koch J, Antoniazzi AQ, Goncalves PBD, Zamberlam G (2022) FSH regulates YAP-TEAD transcriptional activity in bovine granulosa cells to allow the future dominant follicle to exert its augmented estrogenic capacity. International Journal of Molecular Sciences 23(22), 14160.
| Crossref | Google Scholar | PubMed |
Di Guardo F, Ciotta L, Monteleone M, Palumbo M (2020) Male equivalent polycystic ovarian syndrome: hormonal, metabolic and clinical aspects. International Journal of Fertility & Sterility 14(2), 79-83.
| Crossref | Google Scholar | PubMed |
Dumesic DA, Abbott DH, Eisner JR, Goy RW (1997) Prenatal exposure of female rhesus monkeys to testosterone propionate increases serum luteinizing hormone levels in adulthood. Fertility and Sterility 67(1), 155-163.
| Crossref | Google Scholar | PubMed |
Echiburu B, Crisosto N, Maliqueo M, Perez-Bravo F, de Guevara AL, Hernandez P, Cavada G, Rivas C, Clavel A, Sir-Petermann T (2016) Metabolic profile in women with polycystic ovary syndrome across adult life. Metabolism 65(5), 776-782.
| Crossref | Google Scholar | PubMed |
Fernandez RC, Moore VM, Van Ryswyk EM, Varcoe TJ, Rodgers RJ, March WA, Moran LJ, Avery JC, McEvoy RD, Davies MJ (2018) Sleep disturbances in women with polycystic ovary syndrome: prevalence, pathophysiology, impact and management strategies. Nature and Science of Sleep 10, 45-64.
| Crossref | Google Scholar |
Glueck CJ, Goldenberg N (2019) Characteristics of obesity in polycystic ovary syndrome: etiology, treatment, and genetics. Metabolism 92, 108-120.
| Crossref | Google Scholar | PubMed |
Goodarzi MO, Carmina E, Azziz R (2015) DHEA, DHEAS and PCOS. Journal of Steroid Biochemistry and Molecular Biology 145, 213-225.
| Crossref | Google Scholar | PubMed |
Gressner AM, Weiskirchen R, Breitkopf K, Dooley S (2002) Roles of TGF-β in hepatic fibrosis. Frontiers in Bioscience 7(4), 793-807.
| Crossref | Google Scholar |
Hart R, Hickey M, Franks S (2004) Definitions, prevalence and symptoms of polycystic ovaries and polycystic ovary syndrome. Best Practice & Research Clinical Obstetrics & Gynaecology 18(5), 671-683.
| Crossref | Google Scholar | PubMed |
Hart R, Doherty DA, Mori T, Huang R-C, Norman RJ, Franks S, Sloboda D, Beilin L, Hickey M (2011) Extent of metabolic risk in adolescent girls with features of polycystic ovary syndrome. Fertility and Sterility 95(7), 2347-2353.e1.
| Crossref | Google Scholar | PubMed |
Hartanti MD, Rosario R, Hummitzsch K, Bastian NA, Hatzirodos N, Bonner WM, Bayne RA, Irving-Rodgers HF, Anderson RA, Rodgers RJ (2020) Could perturbed fetal development of the ovary contribute to the development of polycystic ovary syndrome in later life? PLoS ONE 15(2), e0229351.
| Crossref | Google Scholar | PubMed |
Hatzirodos N, Bayne RA, Irving-Rodgers HF, Hummitzsch K, Sabatier L, Lee S, Bonner W, Gibson MA, Rainey WE, Carr BR, Mason HD, Reinhardt DP, Anderson RA, Rodgers RJ (2011) Linkage of regulators of TGF-β activity in the fetal ovary to polycystic ovary syndrome. The FASEB Journal 25(7), 2256-2265.
| Crossref | Google Scholar | PubMed |
Hatzirodos N, Hummitzsch K, Irving-Rodgers HF, Breen J, Perry VEA, Anderson RA, Rodgers RJ (2019) Transcript abundance of stromal and thecal cell related genes during bovine ovarian development. PLoS ONE 14(3), e0213575.
| Crossref | Google Scholar | PubMed |
Horiguchi M, Ota M, Rifkin DB (2012) Matrix control of transforming growth factor-β function. Journal of Biochemistry 152(4), 321-329.
| Crossref | Google Scholar | PubMed |
Horikoshi M, Yaghootkar H, Mook-Kanamori DO, Sovio U, Taal HR, Hennig BJ, Bradfield JP, St Pourcain B, Evans DM, Charoen P, et al. (2013) New loci associated with birth weight identify genetic links between intrauterine growth and adult height and metabolism. Nature Genetics 45(1), 76-82.
| Crossref | Google Scholar | PubMed |
Huang J, Wu S, Barrera J, Matthews K, Pan D (2005) The Hippo signaling pathway coordinately regulates cell proliferation and apoptosis by inactivating Yorkie, the Drosophila Homolog of YAP. Cell 122(3), 421-434.
| Crossref | Google Scholar | PubMed |
Hughesdon P (1982) Morphology and morphogenesis of the Stein-Leventhal ovary and of so-called “hyperthecosis”. Obstetrical & Gynecological Survey 37(2), 59-77.
| Crossref | Google Scholar | PubMed |
Idicula-Thomas S, Gawde U, Bhaye S, Pokar K, Bader GD (2020) Meta-analysis of gene expression profiles of lean and obese PCOS to identify differentially regulated pathways and risk of comorbidities. Computational and Structural Biotechnology Journal 18, 1735-1745.
| Crossref | Google Scholar | PubMed |
Ji S-Y, Liu X-M, Li B-T, Zhang Y-L, Liu H-B, Zhang Y-C, Chen Z-J, Liu J, Fan H-Y (2017) The polycystic ovary syndrome-associated gene Yap1 is regulated by gonadotropins and sex steroid hormones in hyperandrogenism-induced oligo-ovulation in mouse. MHR: Basic Science of Reproductive Medicine 23(10), 698-707.
| Crossref | Google Scholar | PubMed |
Jiang L-L, Xie J-K, Cui J-Q, Wei D, Yin B-L, Zhang Y-N, Chen Y-H, Han X, Wang Q, Zhang C-L (2017) Promoter methylation of yes-associated protein (YAP1) gene in polycystic ovary syndrome. Medicine 96(2), e5768.
| Crossref | Google Scholar | PubMed |
Li M, Zhao H, Zhao S-G, Wei D-M, Zhao Y-R, Huang T, Muhammad T, Yan L, Gao F, Li L, Lu G, Chan W-Y, Leung PCK, Dunaif A, Liu H-B, Chen Z-J (2019) The HMGA2-IMP2 pathway promotes granulosa cell proliferation in polycystic ovary syndrome. The Journal of Clinical Endocrinology & Metabolism 104(4), 1049-1059.
| Crossref | Google Scholar | PubMed |
Li T-Y, Su W, Li L-L, Zhao X-G, Yang N, Gai J-X, Lv X, Zhang J, Huang M-Q, Zhang Q, Ji W-H, Song X-Y, Zhou Y-H, Li X-L, Shan H-L, Liang H-H (2022) Critical role of PAFR/YAP1 positive feedback loop in cardiac fibrosis. Acta Pharmacologica Sinica 43(11), 2862-2872.
| Crossref | Google Scholar | PubMed |
Liu M, Hummitzsch K, Hartanti MD, Rosario R, Bastian NA, Hatzirodos N, Bonner WM, Irving-Rodgers HF, Laven JSE, Anderson RA, Rodgers RJ (2020) Analysis of expression of candidate genes for polycystic ovary syndrome in adult and fetal human and fetal bovine ovaries. Biology of Reproduction 103(4), 840-853.
| Crossref | Google Scholar | PubMed |
Liu M, Hummitzsch K, Bastian NA, Hartanti MD, Wan Q, Irving-Rodgers HF, Anderson RA, Rodgers RJ (2022) Isolation, culture, and characterisation of bovine ovarian fetal fibroblasts and gonadal ridge epithelial-like cells and comparison to their adult counterparts. PLoS ONE 17(7), e0268467.
| Crossref | Google Scholar | PubMed |
Martin K, Pritchett J, Llewellyn J, Mullan AF, Athwal VS, Dobie R, Harvey E, Zeef L, Farrow S, Streuli C, Henderson NC, Friedman SL, Hanley NA, Piper Hanley K (2016) PAK proteins and YAP-1 signalling downstream of integrin beta-1 in myofibroblasts promote liver fibrosis. Nature Communications 7(1), 12502.
| Crossref | Google Scholar |
Martínez Traverso IM, Steimle JD, Zhao X, Wang J, Martin JF (2022) LATS1/2 control TGFB-directed epithelial-to-mesenchymal transition in the murine dorsal cranial neuroepithelium through YAP regulation. Development 149(18), dev200860.
| Crossref | Google Scholar |
Moon S, Lee O-H, Kim B, Park J, Hwang S, Lee S, Lee G, Kim H, Song H, Hong K, Cho J, Choi Y (2022) Estrogen regulates the expression and localization of YAP in the uterus of mice. International Journal of Molecular Sciences 23(17), 9772.
| Crossref | Google Scholar | PubMed |
Munger JS, Sheppard D (2011) Cross talk among TGF-β signaling pathways, integrins, and the extracellular matrix. Cold Spring Harbor Perspectives in Biology 3(11), a005017.
| Crossref | Google Scholar | PubMed |
Oh S-H, Swiderska-Syn M, Jewell ML, Premont RT, Diehl AM (2018) Liver regeneration requires Yap1-TGFβ-dependent epithelial-mesenchymal transition in hepatocytes. Journal of Hepatology 69(2), 359-367.
| Crossref | Google Scholar | PubMed |
Raja-Khan N, Urbanek M, Rodgers RJ, Legro RS (2014) The role of TGF-β in polycystic ovary syndrome. Reproductive Sciences 21(1), 20-31.
| Crossref | Google Scholar | PubMed |
Recabarren SE, Sir-Petermann T, Rios R, Maliqueo M, Echiburu B, Smith R, Rojas-Garcia P, Recabarren M, Rey RA (2008) Pituitary and testicular function in sons of women with polycystic ovary syndrome from infancy to adulthood. The Journal of Clinical Endocrinology & Metabolism 93(9), 3318-3324.
| Crossref | Google Scholar | PubMed |
Rifkin D, Sachan N, Singh K, Sauber E, Tellides G, Ramirez F (2022) The role of LTBPs in TGF beta signaling. Developmental Dynamics 251(1), 75-84.
| Crossref | Google Scholar |
Risal S, Pei Y, Lu H, Manti M, Fornes R, Pui H-P, Zhao Z, Massart J, Ohlsson C, Lindgren E, Crisosto N, Maliqueo M, Echiburu B, Ladron de Guevara A, Sir-Petermann T, Larsson H, Rosenqvist MA, Cesta CE, Benrick A, Deng Q, Stener-Victorin E (2019) Prenatal androgen exposure and transgenerational susceptibility to polycystic ovary syndrome. Nature Medicine 25(12), 1894-1904.
| Crossref | Google Scholar | PubMed |
Rolfe KJ, Irvine LM, Grobbelaar AO, Linge C (2007) Differential gene expression in response to transforming growth factor-β1 by fetal and postnatal dermal fibroblasts. Wound Repair and Regeneration 15(6), 897-906.
| Crossref | Google Scholar | PubMed |
Roy S, Abudu A, Salinas I, Sinha N, Cline-Fedewa H, Yaw AM, Qi W, Lydic TA, Takahashi DL, Hennebold JD, Hoffmann HM, Wang J, Sen A (2022) Androgen-mediated perturbation of the hepatic circadian system through epigenetic modulation promotes NAFLD in PCOS mice. Endocrinology 163(10), bqac127.
| Crossref | Google Scholar |
Salloum S, Jeyarajan AJ, Kruger AJ, Holmes JA, Shao T, Sojoodi M, Kim M-H, Zhuo Z, Shroff SG, Kassa A, Corey KE, Khan SK, Lin W, Alatrakchi N, Schaefer EAK, Chung RT (2021) Fatty acids activate the transcriptional coactivator YAP1 to promote liver fibrosis via p38 mitogen-activated protein kinase. Cellular and Molecular Gastroenterology and Hepatology 12(4), 1297-1310.
| Crossref | Google Scholar | PubMed |
Shen S, Guo X, Yan H, Lu Y, Ji X, Li L, Liang T, Zhou D, Feng X-H, Zhao JC, Yu J, Gong X-G, Zhang L, Zhao B (2015) A miR-130a-YAP positive feedback loop promotes organ size and tumorigenesis. Cell Research 25(9), 997-1012.
| Crossref | Google Scholar | PubMed |
Stein IF, Leventhal ML (1935) Amenorrhea associated with bilateral polycystic ovaries. American Journal of Obstetrics and Gynecology 29, 181-191.
| Crossref | Google Scholar |
Stener-Victorin E, Padmanabhan V, Walters KA, Campbell RE, Benrick A, Giacobini P, Dumesic DA, Abbott DH (2020) Animal models to understand the etiology and pathophysiology of polycystic ovary syndrome. Endocrine Reviews 41(4), bnaa010.
| Crossref | Google Scholar |
Stepto NK, Hiam D, Gibson-Helm M, Cassar S, Harrison CL, Hutchison SK, Joham AE, Canny BJ, Moreno-Asso A, Strauss BJ, Hatzirodos N, Rodgers RJ, Teede HJ (2020) Exercise and insulin resistance in PCOS: muscle insulin signalling and fibrosis. Endocrine Connections 9(4), 346-359.
| Crossref | Google Scholar | PubMed |
Stubbs SA, Stark J, Dilworth SM, Franks S, Hardy K (2007) Abnormal preantral folliculogenesis in polycystic ovaries is associated with increased granulosa cell division. The Journal of Clinical Endocrinology & Metabolism 92(11), 4418-4426.
| Crossref | Google Scholar | PubMed |
Stuckey BGA, Opie N, Cussons AJ, Watts GF, Burke V (2014) Clustering of metabolic and cardiovascular risk factors in the polycystic ovary syndrome: a principal component analysis. Metabolism 63(8), 1071-1077.
| Crossref | Google Scholar | PubMed |
Sun T, Diaz FJ (2019) Ovulatory signals alter granulosa cell behavior through YAP1 signaling. Reproductive Biology and Endocrinology 17(1), 113.
| Crossref | Google Scholar |
Tata B, Mimouni NEH, Barbotin A-L, Malone SA, Loyens A, Pigny P, Dewailly D, Catteau-Jonard S, Sundstrom-Poromaa I, Piltonen TT, Dal Bello F, Medana C, Prevot V, Clasadonte J, Giacobini P (2018) Elevated prenatal anti-Mullerian hormone reprograms the fetus and induces polycystic ovary syndrome in adulthood. Nature Medicine 24(6), 834-846.
| Crossref | Google Scholar | PubMed |
Teede H, Deeks A, Moran L (2010) Polycystic ovary syndrome: a complex condition with psychological, reproductive and metabolic manifestations that impacts on health across the lifespan. BMC Medicine 8(1), 41.
| Crossref | Google Scholar |
Thuault S, Valcourt U, Petersen M, Manfioletti G, Heldin C-H, Moustakas A (2006) Transforming growth factor-β employs HMGA2 to elicit epithelial-mesenchymal transition. The Journal of Cell Biology 174(2), 175-183.
| Crossref | Google Scholar | PubMed |
Vander Ark A, Cao J, Li X (2018) TGF-β receptors: in and beyond TGF-β signaling. Cellular Signalling 52, 112-120.
| Crossref | Google Scholar | PubMed |
Varelas X (2014) The Hippo pathway effectors TAZ and YAP in development, homeostasis and disease. Development 141(8), 1614-1626.
| Crossref | Google Scholar | PubMed |
Vignali R, Marracci S (2020) HMGA genes and proteins in development and evolution. International Journal of Molecular Sciences 21(2), 654.
| Crossref | Google Scholar | PubMed |
Walters KA (2016) Androgens in polycystic ovary syndrome: lessons from experimental models. Current Opinion in Endocrinology, Diabetes & Obesity 23(3), 257-263.
| Crossref | Google Scholar | PubMed |
Walters KA, Moreno-Asso A, Stepto NK, Pankhurst MW, Rodriguez Paris V, Rodgers RJ (2022) Key signalling pathways underlying the aetiology of polycystic ovary syndrome. Journal of Endocrinology 255(1), R1-R26.
| Crossref | Google Scholar | PubMed |
Weedon MN, Lettre G, Freathy RM, Lindgren CM, Voight BF, Perry JRB, Elliott KS, Hackett R, Guiducci C, Shields B, et al. (2007) A common variant of HMGA2 is associated with adult and childhood height in the general population. Nature Genetics 39(10), 1245-1250.
| Crossref | Google Scholar | PubMed |
Wickham H (2016) Package ‘ggplot2’. Create elegant data visualisations using the grammar of graphics. Version 2(1). pp. 1–189. (Springer Chem). doi:10.1111/j.1467-789X.2011.00867.x
Xu J, Fang X, Long L, Wang S, Qian S, Lyu J (2021) HMGA2 promotes breast cancer metastasis by modulating Hippo-YAP signaling pathway. Cancer Biology & Therapy 22(1), 5-11.
| Crossref | Google Scholar | PubMed |
Yu ZB, Han SP, Zhu GZ, Zhu C, Wang XJ, Cao XG, Guo XR (2011) Birth weight and subsequent risk of obesity: a systematic review and meta-analysis. Obesity Reviews 12(7), 525-542.
| Crossref | Google Scholar | PubMed |
Yu C, Ji S-Y, Dang Y-J, Sha Q-Q, Yuan Y-F, Zhou J-J, Yan L-Y, Qiao J, Tang F, Fan H-Y (2016) Oocyte-expressed yes-associated protein is a key activator of the early zygotic genome in mouse. Cell Research 26(3), 275-287.
| Crossref | Google Scholar | PubMed |
Zhang W, Gao Y, Li P, Shi Z, Guo T, Li F, Han X, Feng Y, Zheng C, Wang Z, Li F, Chen H, Zhou Z, Zhang L, Ji H (2014) VGLL4 functions as a new tumor suppressor in lung cancer by negatively regulating the YAP-TEAD transcriptional complex. Cell Research 24(3), 331-343.
| Crossref | Google Scholar | PubMed |
Zhou F, Shi L-B, Zhang S-Y (2017) Ovarian fibrosis: a phenomenon of concern. Chinese Medical Journal 130(3), 365-371.
| Crossref | Google Scholar | PubMed |