Image-based recognition of parasitoid wasps using advanced neural networks
Hossein Shirali A * , Jeremy Hübner
  B * , Robin Both A , Michael Raupach
  B , Markus Reischl
  A , Stefan Schmidt
  C and Christian Pylatiuk
  A
A
A
B
C Deceased.
Abstract
Hymenoptera has some of the highest diversity and number of individuals among insects. Many of these species potentially play key roles as food sources, pest controllers and pollinators. However, little is known about the diversity and biology and ~80% of the species have not yet been described. Classical taxonomy based on morphology is a rather slow process but DNA barcoding has already brought considerable progress in identification. Innovative methods such as image-based identification and automation can further speed up the process. We present a proof of concept for image data recognition of a parasitic wasp family, the Diapriidae (Hymenoptera), obtained as part of the GBOL III project. These tiny (1.2–4.5 mm) wasps were photographed and identified using DNA barcoding to provide a solid ground truth for training a neural network. Taxonomic identification was used down to the genus level. Subsequently, three different neural network architectures were trained, evaluated and optimised. As a result, 11 different genera of diaprids and one mixed group of ‘other Hymenoptera’ can be classified with an average accuracy of 96%. Additionally, the sex of the specimen can be classified automatically with an accuracy of >97%.
Keywords: AI, artificial intelligence, biodiversity, Diapriidae, DNA barcoding, genus classification, Hymenoptera, image-based identification, integrative taxonomy, machine learning, neural network architectures, taxonomic identification.
Introduction
Although the highest (insect) diversity is known to occur in the tropics (Godfray et al. 1999; Dunn and Fitzpatrick 2012), several recent studies (e.g. Chimeno et al. 2022, 2023) suggest that there is a very high number of unknown arthropod species in Germany. Most of these taxa are among the insect domains Diptera and Hymenoptera, and referred to as ‘dark taxa’ (Hartop et al. 2022). The highest diversity and individual numbers among insects also occur in the small-bodied groups (but not because of the size; Rainford et al. 2016), making even basic tasks such as specimen handling and mounting a challenge (Morinière et al. 2019). Although many of these species play potentially key roles in all types of habitats as food sources, pest controllers, pollinators, etc. little is known about the diversity and biology (Dunn and Fitzpatrick 2012). Hallmann et al. (2017) recorded a devastating 75% decline in insect biomass within 27 years. That number is especially concerning due to the fact that 30% of all predicted species (Eukaryotes and Prokaryotes) worldwide are insects (Mora et al. 2011) and also because up to 80% of insects are as yet undescribed (Stork 2018). Consequently, politicians have become increasingly aware of the ongoing biodiversity crisis and projects such as GBOL III: Dark Taxa were funded to learn more about hidden insect diversity (Hausmann et al. 2020). Although the extinction rate of numerous taxa is higher than ever (De Vos et al. 2015), descriptive taxonomy and morphological identification of such complex insect groups remains a rather slow process. One of the advancements in species identification and delineation, the DNA barcoding approach (Hebert et al. 2003), has helped increase the rate of the process of species identification, the detection of new species, the evaluation of species complexes and the interpretation of unclear systematics (Blagoev et al. 2009; Goldstein and DeSalle 2011; Hübner et al. 2023). Combining innovative methods with classic morphology is a cost- and time-efficient means of tackling hidden diversity (Padial et al. 2010; Schlick-Steiner et al. 2010).
Another promising new technology that is growing in prominence is advanced artificial intelligence (AI). There are many examples of how to advance biological research with these new technologies. Toscano-Miranda et al. (2022) listed and compared, for example, the applications of AI in pest control. Folliot et al. (2022) used machine learning applications in combination with acoustics to monitor pollinating insects, wood use and ecological interactions in a forest. Wührl et al. (2022) presented a promising state-of-the-art insect sorting device, the ‘DiversityScanner’, powered by a convolutional neural network (CNN). This device identified specimens to family level with a success rate of up to 100% (on average 91.4%), depending on the family they belonged to. Similarly, Borowiec et al. (2022) discussed the application of deep learning across various ecological and evolutionary studies, highlighting the potential in predictive modelling and pattern recognition in complex biological data.
The better and more finely scaled these automated identifications become, however, the more opportunities arise for advances in insect research. One potential application could be to only highlight specimens that are not possible to align with a certain group that the algorithm is able to recognise. Targeted evaluation without the expensive and time-consuming hand-picking would be possible (Wührl et al. 2022).
As is true for the DNA barcoding system, neural networks can only be as good as the reference on which these are based or with which trained. As barcodes change over time (Hebert et al. 2003), depending on the data available for the clustering algorithms, neural networks can distinguish categories based on the quantity and quality of the images used for training.
Our study is based on data from a parasitoid wasp family, the Diapriidae (Hymenoptera) that was obtained in the framework of the GBOL III project (Hausmann et al. 2020). These parasitoids play important roles in the ecosystem, e.g. for pest control and are used commercially in agriculture (e.g. Trichopria drosophilae to fight the invasive pest Drosophila suzukii; Rossi Stacconi et al. 2019). Although these tiny (1.2–4.5 mm) wasps occur worldwide, the biology is barely known (Johnson 1992). The known diversity of Diapriidae is limited to ~2000 described species and this is likely only the tip of the iceberg (P. Hebert, pers. comm.). In the framework of GBOL III: Dark Taxa project, one of the two local subfamilies was further examined as a proof of concept of how to approach highly diverse groups with disproportionately high rates of unknown diversity. The GBOL dataset is highly suitable for classification with AI because thousands of specimens were photographed, barcoded and (therefore reliably and fine-scale) identified, allowing a robust foundation for network training. Genetic results were morphologically confirmed and new findings were examined further. Our work should be interpreted as proof of concept that AI can be a valuable, rapid means of evaluating extremely species-rich taxa with high levels of cryptic diversity or bulk samples.
Materials and methods
Dataset
The dataset used for automated classification includes 11 genera of parasitoid wasps, of which 10 belong to the family Diapriidae and subfamily Diapriniiae. Only one taxon, the genus Ismarus, is from the family Ismaridae. Both the Diapriinae and Ismaridae were selected for the proof of concept because the diversity, while still challenging, is significantly less incomprehensible and the identification less demanding than for the more diverse and abundant subfamily Belytinae. The specimens were mostly collected in southern Germany, mainly in Bavaria. Since 2011, Malaise traps have been set regularly to cover various (even the most specialised) habitats, ranging from private gardens to the high alpine region. A complete list of evaluated specimens and associated location data are available in Hübner and Shirali (2024). A standardised integrative taxonomic approach consisting of DNA barcoding and morphology was used to identify the specimens: specimens were preliminary identified (to genus if possible and sex) and sequenced (Padial et al. 2010; Schlick-Steiner et al. 2010; Chimeno et al. 2023). The Sanger sequencing of the preliminarily identified material was conducted at the CCBD in Guelph, Canada (see https://ccdb.ca/) using a voucher recovery approach. Genetic results were uploaded to the BOLD platform (see https://www.boldsystems.org/) for cross-referencing. After the molecular analysis, all questionable specimens were re-evaluated morphologically. Images of other hymenopteran species were pooled into another group, ‘other Hymenoptera’, comprising 121 images of other Hymenoptera such as Braconidae, Ichneumonidae, Chalcidoidea and also some Diapriidae that did not belong to the 10 previously mentioned genera because these belonged to the subfamily Belytinae. The word ‘class’ hereinafter will refer to target groups that belong together and are to be sorted. This does not refer to the taxonomic hierarchical term.
We employed two systems for image capturing: an Olympus camera E-M10 with a Novoflex Mitutoyo Plan Apo 5× microscope lens, controlled by OM Capture software (ver. 3.0, see https://www.om-digitalsolutions.com/en/) was used to take deep-focused images by stacking 70–130 individual images; and we took images with a prototype of the Entomoscope (Wührl et al. 2024). All specimens were photographed in ethanol, mimicking the light and sample conditions used for the DiversityScanner. All images were subsequently stacked using Helicon Focus (ver. 8, see https://www.heliconsoft.com/heliconsoft-products/helicon-focus/). We used 2257 colour images in our study, as summarised in Table 1. One additional test dataset, including non-Hymenoptera specimens, has been curated to evaluate our pipeline’s performance to exclude non-target species using an outlier detection model. This step is vital to avoid misclassifications in practical applications, such as mistakenly identifying a honey bee (Apis) as a target Hymenoptera species. Detailed taxonomy and the number of images in these test datasets are presented in Table 2. DNA barcoding and morphological (expert knowledge) methods were applied to identify the species. All images are available in Hübner and Shirali (2024).
| Genus | Training | Validation | Testing | |
|---|---|---|---|---|
| Aneurhynchus | 104 | 11 | 20 | |
| Basalys | 306 | 35 | 60 | |
| Coptera | 85 | 9 | 17 | |
| Entomacis | 71 | 8 | 14 | |
| Idiotypa | 42 | 5 | 19 | |
| Ismarus (Ismaridae) | 61 | 7 | 12 | |
| Monelata | 115 | 13 | 23 | |
| Paramesius | 110 | 13 | 22 | |
| Psilus | 56 | 6 | 10 | |
| Spilomicrus | 114 | 12 | 22 | |
| Trichopria | 564 | 63 | 111 | |
| Other Hymenoptera | 93 | 10 | 18 | |
| Female | 713 | 79 | 140 | |
| Male | 915 | 103 | 180 | |
| Unknown | 93 | 10 | 18 | |
| Total | 1721 | 192 | 338 |
Data preprocessing
In the computer vision field, the efficiency of model training and classification accuracy is significantly influenced by the quality and preparation of input images. This section delineates the preprocessing steps to prepare the insect image dataset for effective machine-learning model training.
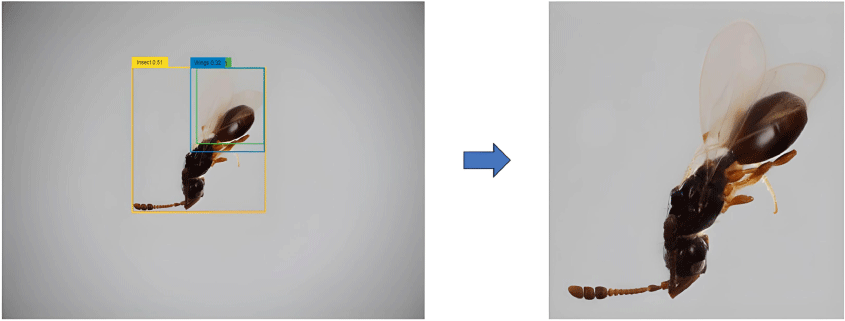
To enhance the model’s focus on the insect and to minimise background noise, images are first cropped to the Region of Interest (ROI) using the Grounding DINO model (Liu et al. 2023), as depicted in Fig. 1. This model employs a zero-shot object detection approach, leveraging image and text features to predict bounding boxes around the insect based on the text prompt ‘Insect. Wasp. Wings.’ with a box threshold of 0.29 and text threshold of 0.25. These cropped images are resized to a uniform size of 224 × 224 pixels. This standardisation step preserves critical insect features for further processing.
To enrich the dataset and prevent overfitting, data augmentation techniques such as horizontal and vertical flip, rotation (−30° to +30°), horizontal shift (1–8% of the image width), vertical shift (1–8% of the image height) and zooming in or out (up to 8%) are applied. These techniques help the model learn from a more diverse representation of insect features.
The preprocessed images are compiled into the final dataset and randomly split into a training dataset (~69%), a validation dataset (~11%) and a testing dataset (~20%), considering class imbalance to effectively assess the model’s performance and generalisability. These steps ensure that the dataset is thoroughly prepared for the subsequent model training and evaluation phases, establishing a solid foundation for precise, robust insect classification.
Deep learning model architectures
Three different deep learning models were selected and evaluated in this study: ConvNeXt (Li et al. 2022), BEiTv2 (Peng et al. 2022) and YOLOv8 (G. Jocher, A. Chaurasia and J. Qui, see https://github.com/ultralytics/ultralytics). These models were selected for proficiency in handling complex computer vision tasks, particularly in identification and classification. Our approach is grounded in transfer learning and fine-tuning methodologies, ensuring that the models are adapted to our specific requirements.
ConvNeXt XLarge (Li et al. 2022) is an advanced convolutional neural networks (CNNs) variant known for the exceptional feature extraction capabilities. This incorporates multiple layers designed to process and interpret intricate image details, leveraging advanced activation functions and optimisers to ensure efficient learning and high classification accuracy. The model supports multi-label classification with a sigmoid activation function and handles an image size of 224 × 224 pixels with a batch size of 32 and stochastic depth regularisation with a rate of 0.3. The class weights are similarly adjusted for genera classes. The second model is BEiTv2 (Peng et al. 2022), a Transformer-based model adapted to understanding and interpreting complex image patterns. The unique attention mechanism is instrumental in identifying subtle variations within images, making this a crucial tool for ensuring model stability and robustness under diverse imaging conditions. The model processes images of 224 × 224 pixels with a batch size of 32 and employs a dropout regularisation of 0.3 applied to Attention-MLP (multilayer perceptron) blocks. Class weights for genera classes are weighted by a factor of three. The third model is YOLOv8, the latest iteration in the YOLO (You Only Look Once) series, selected for the rapid object detection capabilities that are also suitable for classification tasks. The architecture, balanced for speed and accuracy, makes this ideal for real-time applications for which immediate, precise classification is essential. Owing to the framework’s limitation in not supporting multi-label classification, we train two separate models, one for genus classification and one for sex determination. Both models leverage ImageNet pre-training weights (Russakovsky et al. 2015) and all layers are made trainable, an approach that maximises learning from our dataset. These models are designed for multi-output classification, utilising a softmax activation function. The models are capable of processing larger images of 640 × 640 pixels, operating with a batch size of 64 and incorporating a dropout regularisation of 0.3. The class weights for both models are set to default. This configuration ensures optimal performance and accuracy in our classification tasks. In conclusion, the architecture of each model has been tailored to meet the specific requirements of this project. ConvNeXt’s advanced convolutional approach, BEiT’s attention-based mechanism, and YOLO’s speed and precision collectively contribute to the successful implementation of the classification tasks in this study.
Training setup and process
A standard personal computer with a powerful NVIDIA RTX 4080 GPU was used with Python (ver. 3.10), TensorFlow (ver. 2.10.1), PyTorch (ver. 2.0.1), Keras, CUDA (ver. 11.7) and Anaconda software was used for classification. This integrated environment provides the efficiency and flexibility to train deep learning models. During the training process, all three models were trained for a maximum of 150 machine-learning epochs using the AdamW optimiser with a consistent learning rate of 0.001. We employed a four-fold cross-validation approach to optimise model performance. This allowed us to assess the models’ performance on different subsets of the data, mitigating the risk of overfitting and providing a more robust evaluation of the generalisation capabilities. In addition to cross-validation, we also applied early stopping, model check pointing, and learning rate reduction techniques, with training progress monitored. Notably, model weights were saved whenever improvements were observed during validation. BEiTv2 and YOLOv8 utilised categorical cross entropy for loss functions, whereas ConvNeXt employed binary cross entropy.
Outlier detection
An algorithm for automatic classification is expected to reliably differentiate between insects that belong to the predefined classes for classification and specimens that do not belong to these classes. To enhance this capability, we implemented a preliminary filtering stage using an outlier detection model prior to our main image classifier. This allowed the automatic filtering of collections that had not previously been presorted for the predefined classes. This outlier detection model classified a specimen into one of the two groups, ‘Hymenoptera for classification’ and ‘Non-Hymenoptera’. ‘Hymenoptera for classification’ includes specimens within the Hymenoptera genera we targeted for detailed analysis. The second group, ‘Non-Hymenoptera,’ consisted of all other insect specimens that do not belong to the order Hymenoptera. This broad category includes a variety of insects, some examples of which are provided in Table 2 as other insects. This prefiltering is carried out by a one-class support vector machine (OCSVM) based on the BEiTv2 – a pretrained deep learning model with ImageNet weights. Da Silva Puls et al. (2023) have demonstrated that ViTs perform best for this task. During this process, the classification layer is removed, leaving the model to serve as an effective feature extractor. This model transforms the input images into a lower-dimensional feature space, capturing low-level and high-level image features. Subsequently, a OCSVM on these feature representations extracted from the training dataset is trained. Any new testing data that falls within the boundary of the OCSVM is assigned to the trained class and data points outside the boundary are declared as outliers or Non-Hymenoptera.
Principal Component Analysis (PCA) is subsequently employed to reduce the dimensionality of the data from 1024 to 128 features per image to maintain data quality while reducing computational complexity. In this next step, the data are normalised using the mean and variance of the training dataset. Subsequently, the OCSVM is trained on the reduced, normalised feature representations. This approach does not involve training a neural network, therefore there is no need for a separate validation dataset. Instead, the validation dataset is combined with the training dataset for training the OCSVM on the positive class, making this suitable for detecting outliers that, in this context, are the other insects.
The entire approach is implemented using the open-source machine learning library Scikit-learn (Pedregosa et al. 2011). Parameter tuning is performed through a grid search to optimise the OCSVM’s performance.
Results
Classification performance metrics
The performance metrics for genus and sex classification of the three different deep learning (DL) models are provided in Table 3. The performance metrics include the test classification accuracy and the F1-score for the best model selected across four training runs using fourfold cross-validation.
| Architectures | Genus accuracy | Genus F1-score | Sex accuracy | Sex F1-score | |
|---|---|---|---|---|---|
| BEiTv2 | 0.96 | 0.95 | 0.97 | 0.98 | |
| ConvNeXt XLarge | 0.94 | 0.94 | 0.95 | 0.96 | |
| YOLOv8 | 0.89 | 0.90 | 0.94 | 0.94 |
A value of one corresponds to 100%.
The performance metrics show that BEiTv2 consistently outperforms the other models in genus and sex classification tasks. ConvNeXt XLarge also exhibits strong performance, while YOLOv8 performs competitively, albeit with lower accuracy and F1-score than in the two other models. For this reason, only the classification results of the best-performing model, BEiTv2 are presented below.
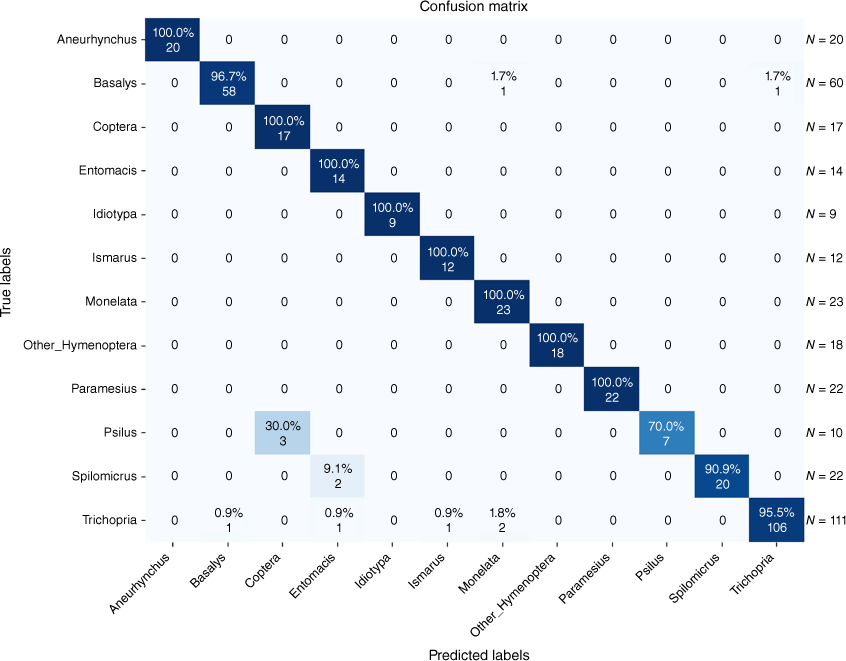
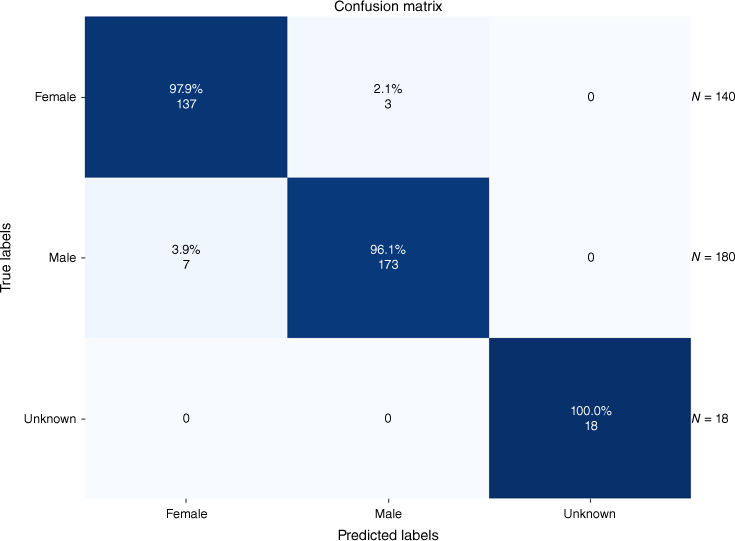
The classification results for the 11 predefined classes of Hymenoptera and one ‘Other_Hymenoptera’ class are depicted in a confusion matrix in Fig. 2 and 3 for the tasks of genus and sex classification.
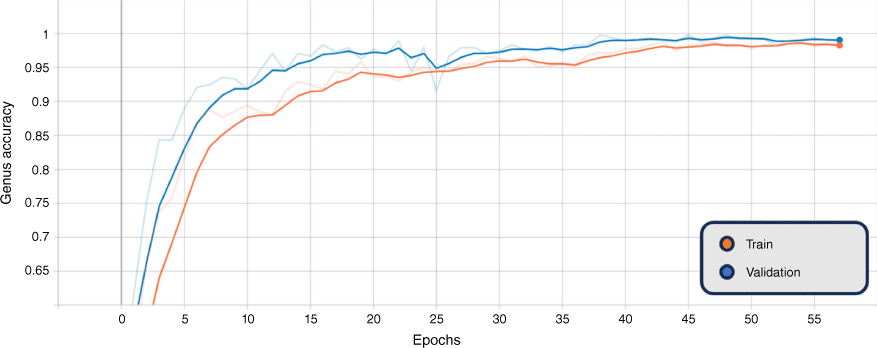
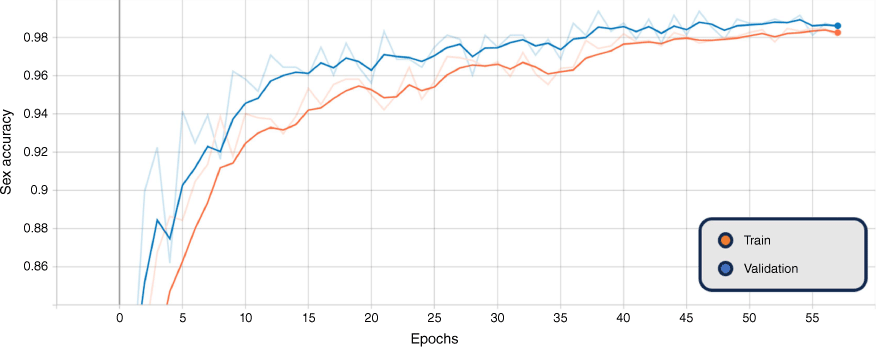
In addition, the graphs of the classification results for training and validation accuracy, and loss for the BEiTv2 model are given in Fig. 4, 5 and 6. These figures represent the best fold of the cross-validation training process. These provide a comprehensive view of the model’s learning progress throughout training, illuminating the overall performance and convergence behaviour.
Smoothed training (orange) and validation (blue) genus accuracy, BEiTv2, with the original graph transparent. Note: ‘Epoch’ refers to a machine-learning epoch.
Smoothed training (orange) and validation (blue) sex accuracy, BEiTv2, with the original graph transparent. Note: ‘Epoch’ refers to a machine-learning epoch.
Smoothed training (orange) and validation (blue) combined genus and sex loss, BEiTv2, with the original graph transparent. Note: ‘Epoch’ refers to a machine-learning epoch.
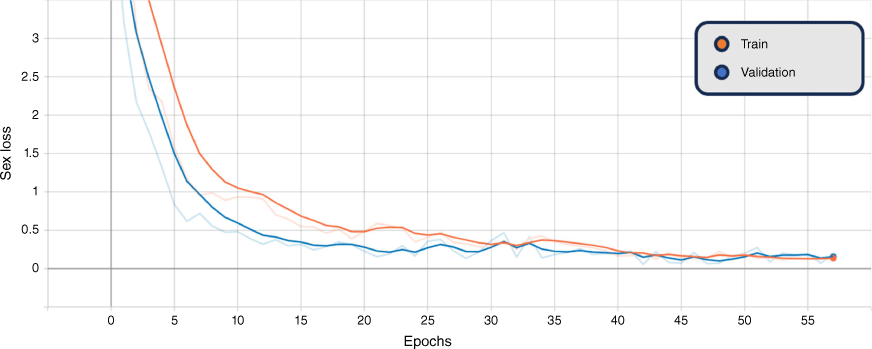
The figures show a steady increase in accuracy and corresponding decrease in loss, suggesting the model is learning effectively. Notably, the close alignment of the training and validation curves indicates that the model is not overfitting, performing similarly on both seen and unseen data. Moreover, the absence of a plateau in improvement or a significant gap between training and validation performance suggests that underfitting is not occurring. Hence, the model exhibits a balanced learning trajectory, suggesting robustness and reliability when applied to similar unseen data.
Class activation maps
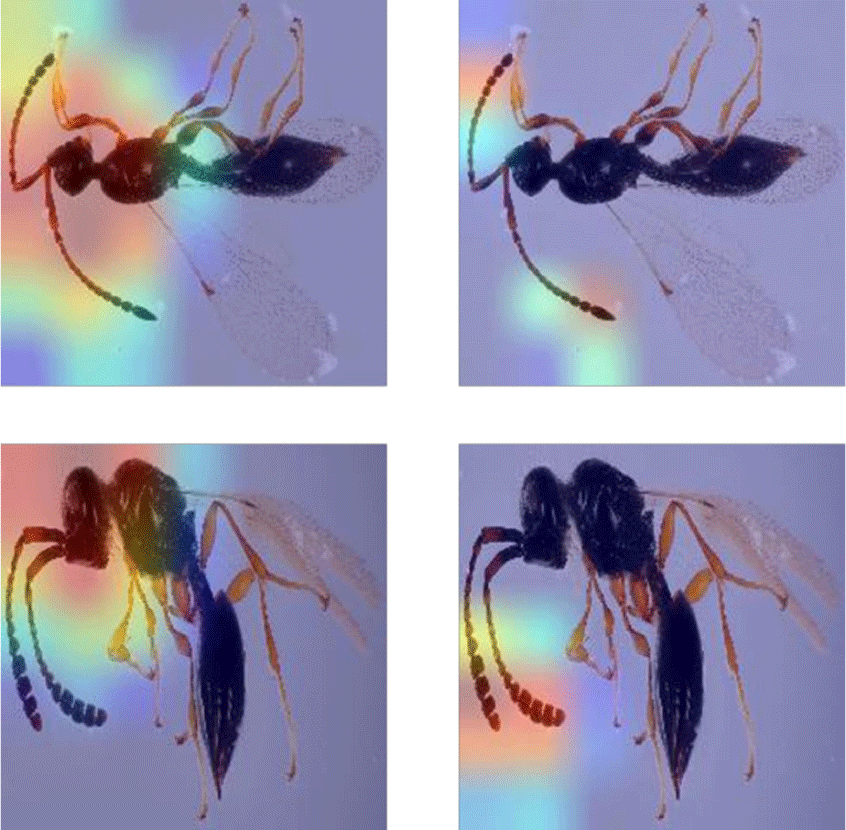
Class Activation Mapping (CAM) (Zhou et al. 2016) is a technique used for generating heat maps to highlight class-specific regions of images that impact the classification result. In Fig. 7, heat maps for two different insect specimens are provided as examples: the genus Paramesius (top) and Spilomicrus (bottom). The left side represents heat maps associated with the predicted genus. The antennae, head and thorax are consistently significant in predicting the genus. On the right side, the heat maps related to sex prediction are displayed, in which the antennae are crucial for sex prediction. These results show that the classification algorithm considers features similarly to how a taxonomic expert would.
Identification of non-target Hymenoptera
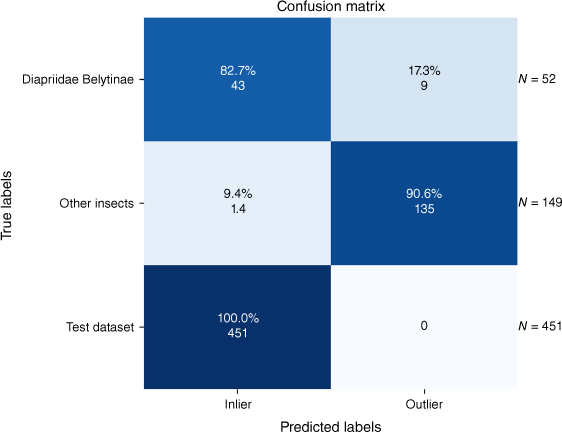
The outlier detection method was assessed using two different test datasets: one is described in Table 2 and the other is a split of our main dataset. The results are visualised in Fig. 8. The method misclassified 23 of the total of 652 resulting images.
In the context of our study, ‘inliers’ are images that the outlier model correctly identifies as belonging to the category of Hymenoptera but not necessarily to the specific target genera of Diapriidae that are our classification focus. Conversely, ‘outliers’ are images that do not belong to the category of Hymenoptera and are therefore beyond the focus of our model’s training criteria.
Notably, this approach achieved 100% accuracy on the test split of our dataset as expected because our outlier model was trained specifically on this dataset. Regarding the ‘Other Insects’ images, this model demonstrated prowess by identifying 90.6% of the images as outliers. This indicates the model’s ability to distinguish these insects from Hymenoptera effectively. The Diapriidae and Belytinae images, as part of ‘Other Hymenoptera,’ presented a unique challenge. There were variations in image quality, background and differences in camera sources. Despite these challenges, our model detected 82.7% of the images as inliers, underscoring the potential for accurate classification even under adverse conditions. Overall, these results demonstrate the model’s robustness and accuracy in classifying closely related but non-target Hymenoptera species, even under non-ideal conditions.
Discussion
The network approach demonstrated is restricted to the European Diapriidae fauna, particularly the subfamily Diapriinae because within the framework of the GBOL III project, specimens and species of this subfamily were investigated and barcoded as proof of concept. The Diapriidae (even if the dataset is limited to German material only) is simply too diverse and complex to be investigated in such a short period of time. Nevertheless, most of the genera that were subject to our approach are distributed worldwide. Also, there are many species, e.g. Spilomicrus formosus that even inhabit several continents (in this case, Europe, Asia and North America), making our DL model a powerful tool regarding the fact that over 90% of the sampling area of the barcoded material was limited to Bavaria, Germany.
The success rate at which the DL model was able to distinguish between different genera was high (up to 100%). Exceptions could be detected distinguishing between the genera Psilus and Coptera. A closer examination of these was not surprising as genera are closely related and appear highly similar. Although Psilus was described by Panzer (1801) and Coptera by Say (1836) 35 years later, confusion remained regarding distinguishing between these over a century after description (Nixon 1980). The most reliable morphological feature is the wing that is folded lengthwise in Coptera and without a fold in Psilus. However, both genera usually lie on the sides with applied wings and therefore distinguishing between these without changing the position to a dorsal view is almost impossible. Another obstacle we faced was that there was not enough material to train the models on rare taxa. Idiotypa, Diapria or Tetramopria are genera with low species and individual counts.
The class activation heatmaps highlight, as expected, the antennae of the insects that taxonomists also use to distinguish between sexes. What was less expected was that the CAMs highlighted the head region. Although the head shape could be used to identify genera, other body features would be used by a specialist. Wing venation (that is often not visible in the images) and the shape of the abdomen (that is not always helpful and dependent on orientation) would be more intuitive for distinguishing Paramesius and Spilomicrus (example provided in Fig. 7). Therefore, CAMs may have the potential to find descriptive characters for species descriptions in future.
Although the algorithm cannot identify these to genus level, the family can be determined and therefore used to specifically sort for rare, unidentifiable specimens that would save even a specialist vast amounts of time due to the generally high specimen numbers of most diaprids.
In furthering this research, we developed a web application, DiapriidaeClassificationApp, to make the identification process more accessible and user-friendly (see https://gitlab.kit.edu/kit/iai/ber/diapriidaeclassificationapp). However, noting that the application’s accuracy is highly dependent on the quality of the images used is crucial. Only high-quality lab images with consistent, comparable illumination are suitable for the app’s analysis. Images taken with a smartphone, that often vary in quality and lighting conditions, are unlikely to yield reliable results. This limitation emphasises the need for standardised image-capturing methods to ensure the app’s effectiveness in species identification.
Conclusion
AI has been proven to be a reliable and efficient tool for identifying the highly diverse taxon Diapriinae to genus level in Europe. One of the greatest advantages lies in the fact that a user does not need a profound knowledge of morphology or other taxonomic experience to achieve identification results. Making these groups available for completely different research fields, such as ecology or pest control, is a significant advancement and an affordable, non-invasive alternative to (meta-) barcoding-based species identification. This technology should be further developed and can be applied to a wide variety of species groups, e.g. other parasitoid wasps. Another potential application could be to power the DiversityScanner with the new DL models to allow more accurate delimitations and targeted specimen selection.
Data availability
All images are available in Hübner and Shirali (2024). Additionally, a preprint version of this article is available in Shirali et al. (2024).
Declaration of funding
Our work is part of the German Barcode of Life III: Dark Taxa project and was funded partially by the German Federal Ministry of Education and Research (FKZ 16LI1901B). The work was also supported by funding from the Museum für Naturkunde Berlin and the Natural, Artificial and Cognitive Information Processing (NACIP) program of the Helmholtz Association.
Dedication
We dedicate this paper to the memory of Stefan Schmidt, who sadly passed away. Stefan’s significant contributions to the research were invaluable, and his expertise and dedication greatly aided the completion of this work. He will be deeply missed.
Acknowledgements
We thank students Viktor Deines and Jerome Anton for countless hours of imaging all the specimens investigated.
References
Blagoev G, Hebert P, Adamowicz S, Robinson E (2009) Prospects for using DNA barcoding to identify spiders in species-rich genera. ZooKeys 16, 27-46.
| Crossref | Google Scholar |
Borowiec ML, Dikow RB, Frandsen PB, McKeeken A, Valentini G, White AE (2022) Deep learning as a tool for ecology and evolution. Methods in Ecology and Evolution 13, 1640-1660.
| Crossref | Google Scholar |
Chimeno C, Hausmann A, Schmidt S, Raupach MJ, Doczkal D, Baranov V, Hübner J, Höcherl A, Albrecht R, Jaschhof M, Haszprunar G, Hebert PDN (2022) Peering into the darkness: DNA barcoding reveals surprisingly high diversity of unknown species of Diptera (Insecta) in Germany. Insects 13, 82.
| Crossref | Google Scholar | PubMed |
Chimeno C, Rulik B, Manfrin A, Kalinkat G, Hölker F, Baranov V (2023) Facing the infinity: tackling large samples of challenging Chironomidae (Diptera) with an integrative approach. PeerJ 11, e15336.
| Crossref | Google Scholar | PubMed |
da Silva Puls E, Todescato MV, Carbonera JL (2023) An evaluation of pre-trained models for feature extraction in image classification. arXiv v1, 2310.02037 [Preprint, posted 3 October 2023].
| Crossref | Google Scholar |
De Vos JM, Joppa LN, Gittleman JL, Stephens PR, Pimm SL (2015) Estimating the normal background rate of species extinction. Conservation Biology 29, 452-462.
| Crossref | Google Scholar | PubMed |
Dunn RR, Fitzpatrick MC (2012) Every species is an insect (or nearly so): on insects, climate change, extinction, and the biological unknown. In ‘Saving a Million Species’. (Ed. L Hannah) pp. 217–237. (Island Press and Center for Resource Economics: Washington, DC, USA) 10.5822/978-1-61091-182-5_13
Folliot A, Haupert S, Ducrettet M, Sèbe F, Sueur J (2022) Using acoustics and artificial intelligence to monitor pollination by insects and tree use by woodpeckers. Science of The Total Environment 838, 155883.
| Crossref | Google Scholar | PubMed |
Godfray HCJ, Lewis OT, Memmott J (1999) Studying insect diversity in the tropics. Philosophical Transactions of the Royal Society of London – B. Biological Sciences 354, 1811-1824.
| Crossref | Google Scholar | PubMed |
Goldstein PZ, DeSalle R (2011) Integrating DNA barcode data and taxonomic practice: determination, discovery, and description. BioEssays 33, 135-147.
| Crossref | Google Scholar | PubMed |
Hallmann CA, Sorg M, Jongejans E, Siepel H, Hofland N, Schwan H, Stenmans W, Müller A, Sumser H, Hörren T, Goulson D, de Kroon H (2017) More than 75 percent decline over 27 years in total flying insect biomass in protected areas. PLoS One 12, e0185809.
| Crossref | Google Scholar |
Hartop E, Srivathsan A, Ronquist F, Meier R (2022) Towards large-scale integrative taxonomy (LIT): resolving the data conundrum for dark taxa. Systematic Biology 71, 1404-1422.
| Crossref | Google Scholar |
Hausmann A, Krogmann L, Peters RS, Rduch V, Schmidt S (2020) GBOL III: dark taxa. iBOL Barcode Bulletin 10, 2-4.
| Crossref | Google Scholar |
Hebert PDN, Ratnasingham S, De Waard JR (2003) Barcoding animal life: cytochrome c oxidase subunit I divergences among closely related species. Proceedings of the Royal Society of London – B. Biological Sciences 270, S96-S99.
| Crossref | Google Scholar | PubMed |
Hübner J, Shirali H (2024) DiapriidaeGenusImageDataset. Zenodo v2, 22 April 2024 [Data set].
| Crossref | Google Scholar |
Hübner J, Chemyreva VG, Notton D (2023) Taxonomic and nomenclatural notes on Geodiapria longiceps Kieffer, 1911 (Hymenoptera, Diapriidae) and synonymy of the genus Geodiapria Kieffer, 1910. ZooKeys 1183, 1-11.
| Crossref | Google Scholar | PubMed |
Johnson N (1992) Catalog of world species of Proctotrupoidea, exclusive of Platygastridae (Hymenoptera). Memoirs of the American Entomological institute 51, 1-825.
| Crossref | Google Scholar |
Li Z, Gu T, Li B, Xu W, He X, Hui X (2022) ConvNeXt-based fine-grained image classification and bilinear attention mechanism model. Applied Sciences 12, 9016.
| Crossref | Google Scholar |
Liu S, Zeng Z, Ren T, Li F, Zhang H, Yang J, Li C, Yang J, Su H, Zhu J (2023) Grounding DINO: marrying dino with grounded pre-training for open-set object detection. arXiv v4, 2303.05499 [Preprint, posted 23 March 2023] .
| Crossref | Google Scholar |
Mora C, Tittensor DP, Adl S, Simpson AGB, Worm B (2011) How many species are there on Earth and in the ocean? PLoS Biology 9, e1001127.
| Crossref | Google Scholar |
Morinière J, Balke M, Doczkal D, Geiger MF, Hardulak LA, Haszprunar G, Hausmann A, Hendrich L, Regalado L, Rulik B, Schmidt S, Wägele JW, Hebert PDN (2019) A DNA barcode library for 5,200 German flies and midges (Insecta: Diptera) and its implications for metabarcoding‐based biomonitoring. Molecular Ecology Resources 19, 900-928.
| Crossref | Google Scholar | PubMed |
Padial JM, Miralles A, De La Riva I, Vences M (2010) The integrative future of taxonomy. Frontiers in Zoology 7, 16.
| Crossref | Google Scholar | PubMed |
Pedregosa F, Varoquaux G, Gramfort A, Michel V, Thirion B, Grisel O, Blondel M, Prettenhofer P, Weiss R, Dubourg V, Vanderplas J, Passos A, Cournapeau D, Brucher M, Perrot M, Duchesnay É (2011) Scikit-learn: machine learning in Python. Journal of Machine Learning Research 12, 2825-2830 Available at http://jmlr.org/papers/v12/pedregosa11a.html.
| Google Scholar |
Peng Z, Dong L, Bao H, Ye Q, Wei F (2022) BEiTv2: masked image modeling with vector-quantized visual tokenizers. arXiv v2, 2208.06366 [Preprint, posted 3 October 2022].
| Crossref | Google Scholar |
Rainford JL, Hofreiter M, Mayhew PJ (2016) Phylogenetic analyses suggest that diversification and body size evolution are independent in insects. BMC Evolutionary Biology 16, 8.
| Crossref | Google Scholar | PubMed |
Rossi Stacconi MV, Grassi A, Ioriatti C, Anfora G (2019) Augmentative releases of Trichopria drosophilae for the suppression of early season Drosophila suzukii populations. BioControl 64, 9-19.
| Crossref | Google Scholar |
Russakovsky O, Deng J, Su H, Krause J, Satheesh S, Ma S, Huang Z, Karpathy A, Khosla A, Bernstein M (2015) Imagenet large scale visual recognition challenge. International Journal of Computer Vision 115, 211-252.
| Crossref | Google Scholar |
Say T (1836) Descriptions of new species of North American Hymenoptera, and observations on some already described. Boston Journal of Natural History 1, 209-305.
| Google Scholar |
Schlick-Steiner BC, Steiner FM, Seifert B, Stauffer C, Christian E, Crozier RH (2010) Integrative taxonomy: a multisource approach to exploring biodiversity. Annual Review of Entomology 55, 421-438.
| Crossref | Google Scholar | PubMed |
Shirali H, Hübner J, Both R, Raupach M, Schmidt S, Pylatiuk C (2024) Image-based recognition of parasitoid wasps using advanced neural networks. bioRxiv 2024, 2024.01.01.573817 [Preprint, posted 2 January 2024].
| Crossref | Google Scholar |
Stork NE (2018) How many species of insects and other terrestrial arthropods are there on Earth? Annual Review of Entomology 63, 31-45.
| Crossref | Google Scholar | PubMed |
Toscano-Miranda R, Toro M, Aguilar J, Caro M, Marulanda A, Trebilcok A (2022) Artificial-intelligence and sensing techniques for the management of insect pests and diseases in cotton: a systematic literature review. The Journal of Agricultural Science 160, 16-31.
| Crossref | Google Scholar |
Wührl L, Pylatiuk C, Giersch M, Lapp F, von Rintelen T, Balke M, Schmidt S, Cerretti P, Meier R (2022) DiversityScanner: robotic handling of small invertebrates with machine learning methods. Molecular Ecology Resources 22, 1626-1638.
| Crossref | Google Scholar | PubMed |
Wührl L, Rettenberger L, Meier R, Hartop E, Graf J, Pylatiuk C (2024) Entomoscope: an open-source photomicroscope for biodiversity discovery. IEEE Access 12, 11785-11794.
| Crossref | Google Scholar |
Zhou B, Khosla A, Lapedriza A, Oliva A, Torralba A (2016) Learning deep features for discriminative localization. In ‘Proceedings of the 2016 IEEE Conference on Computer Vision and Pattern Recognition (CVPR)’, 27–30 June 2016, Las Vegas, NV, USA. pp. 2921–2929. (IEEE) 10.1109/CVPR.2016.319


