

Effects of extra potassium supply and rootstocks indicate links between water, solutes and energy in Shiraz grapevines (Vitis vinifera) pericarps
Yin Liu A B C D * , Stephen Tyerman A E , Leigh Schmidtke A B C and Suzy Rogiers A C F
A
B
C
D
E
F
Abstract
Potassium (K) is essential for the development of grapevines (Vitis vinifera), accumulating into berries during maturation. Elevated K has been associated with high sugar and low acidity in juice. Characterising the accumulation patterns of K and other components in pericarps treated with various experimental factors may indicate potential regulators of berry K levels. A soil fertiliser trial using nutrient solutions with two K supply rates was conducted on potted Shiraz vines during berry ripening. Doubled-K supply increased L-malic acid content in the early-ripening phase, and increased K and magnesium concentrations in the late-ripening phase. Doubled-K supply reduced the ratio of K to sodium in later ripening phases, suggesting that the accumulation of K relative to sodium was limited in more mature berries supplied with extra K. Pericarp water percentage, sugar, K and ATP were correlated in both treatments, indicating links between hydration, solute transport and energy in maturing berries. In a separate rootstock trial over the two growing seasons, Shiraz scions grafted onto 420-A rootstock produced berries with lower K concentration and content than those grafted onto Ramsey or Ruggeri-140 rootstocks and own-rooted vines. This study demonstrated that the K supply and berry ripening phase impacted the berry K level.
Keywords: Grape berry pericarp, ionic homeostasis, nutrient, potassium, ripening phase, rootstock, vascular transport, Vitis vinifera.
Introduction
Potassium (K) is essential for the growth and development of grapevines (Vitis vinifera). In warm growing regions, high berry K concentration in wine grapes is associated with undesired high sugar and low acidity of grape juice for vinification (Villette et al. 2020). During ripening, K accumulates into berries predominantly through the phloem (Rogiers et al. 2000, 2006, 2017). Potassium is directly involved in berry sugar accumulation (Coetzee et al. 2017). In grape berry flesh and juice, K was positively correlated with total soluble solids (TSS) and sugar concentration, and negatively correlated with titratable acidity and the tartaric acid/malic acid ratio (Walker and Blackmore 2012; Ramos and Romero 2017). However, the processes and regulators of K transport into berries are unclear, requiring identification of the potential targets for managing grape berry K content.
To alter berry K content, K fertiliser can be applied to the soil to increase K availability for uptake (Coetzee et al. 2017). However, the K concentration in harvest-ripe Shiraz berries was not significantly altered by increasing K supply, possibly as a result of the downregulation of genes encoding pericarp K+ transporters and channels (Coetzee et al. 2019). Despite this, a ternary relationship was evident between K, sugar and water in berries, and it was suggested this was a function of their co-transport in the phloem (Coetzee et al. 2017). Rootstock is another management practice that can influence juice K concentration (Kodur et al. 2010; Walker and Blackmore 2012; Xiao et al. 2020). It was found that the uptake of K in rootstocks was positively related to the dry weight and growth rate of the grapevine, while the translocation of K was positively related to the shoot/root ratio (Kodur et al. 2010). Ramsey increased berry K levels (Kodur et al. 2010), while Ruggeri-140 could produce fruits with lower K concentrations (Walker and Blackmore 2012). These rootstock studies assessed the composition of juice; however, a significant quantity of K is also distributed in berry skins (32%) (Storey 1987; Rogiers et al. 2006) while the seeds only harbour 6% of the total berry K at maturity (Rogiers et al. 2006). Analysing the K content of the entire pericarp, including skin and flesh, may better represent berry K accumulation.
Potassium is transported into berries through vascular tissue, therefore vascular transport characteristics and other compounds that can be accumulated in berries could impact on K accumulation. Multiple inorganic elements are imported mainly through the xylem or phloem into ripening grape berries, depending on the element’s mobility in the two vascular pathways. Phloem mobile elements include K, magnesium (Mg) and phosphorus (P), while xylem mobile elements include calcium (Ca) and sodium (Na) (Rogiers et al. 2006). In plants, Na+ can be transported by K+ transporters and channels, and the non-selective cation transporters (Maathuis and Amtmann 1999). However, Na+ cannot fulfil the role of K+ as an enzyme cofactor in metabolism, so a high cellular K/Na ratio may be an indicator of salinity stress resistance and the capacity to maintain cell vitality (Maathuis and Amtmann 1999). The antagonistic relationship between the various inorganic elements may affect K uptake by roots and partitioning patterns, and thus may play a role in berry K content regulation.
Grape berries accumulate solutes through the apoplastic pathway (Zhang et al. 2006), with increased energy consumption compared with the berries in the pre-veraison stage. Thus, the fluctuation in the rate of energy supply and consumption could impact on solute accumulation patterns. Respiration synthesises ATP to energise a wide range of biological activities, which are vital to cells. Loss of cell vitality was found in the grape berry mesocarp in later ripening phases and was considered to be a physiological phenomenon of the transition from berry ripening to berry senescence (Krasnow et al. 2008; Tilbrook and Tyerman 2008). Cell death in Shiraz was also found to be associated with berry hypoxia, fermentation and ethanol production (Xiao et al. 2018). Given that the energy production efficiency of fermentation is lower than that of aerobic respiration, oxygen (O2) deficiency may reduce the energy supply required to accumulate solutes into berries. Evaluating the energy status, as indicated by ATP and ethanol, along with solute content during berry ripening could provide insight into the relationship between K accumulation and energy regulation.
To gain insight into the regulation of K level during berry ripening, two trials were conducted on Shiraz grapevines for assessing the effect of increased K supply and rootstock on berry K accumulation pattern. In the 2019/2020 season, potted Shiraz vines were fertilised fortnightly with two K levels, from 50 days after anthesis (DAA) at the stage of berries pea-size (7 mm diameter, E-L 31 stage) until over-ripe (132 DAA) at E-L 39 stage (Coombe 1995). Berries were sampled at seven timepoints during ripening, followed by a berry size and pericarp chemical analysis, including fresh mass, dry mass, water mass, water percentage, TSS, total sugar summarising the sucrose, fructose and glucose, L-malic acid, K, Mg, P, Ca and Na. Berries sampled at the beginning and the end of ripening were also analysed for pericarp ATP and ethanol contents, as indicators of berry energy status. The impact of rootstocks on berry K levels of scions of Shiraz was assessed on vines on their own roots or Ramsey, Ruggeri-140 and 420-A rootstocks, in the 2018/2019 season and 2019/2020 seasons.
Materials and methods
K fertiliser trial. Impact of increased K supply rate during berry ripening in potted Shiraz vines
A replicated design was implemented on Shiraz grapevines (Vitis vinifera L.) grown in 15-L pots in a medium of washed sand in a bird-proof enclosure at Charles Sturt University (CSU), NSW, Australia (35.06°S, 147.36°E; elevation, 227 m), in the 2019/2020 season. The bird-proof enclosure provided the vines with natural environmental levels of temperature, light, wind and rainfall. Climate data of this grapevine growing season (see Supplementary Fig. S1a, b), recorded by the weather station Wagga Wagga AMO (Station Number: 072150; 35.16°S, 147.46°E; elevation, 212 m), was accessed through Climate Data Online, Bureau of Meteorology (http://www.bom.gov.au/climate/data). The straight-line distance between the experimental site and the climate station is 14.3 km. Growing degree days (GDD) units were calculated from 1 September 2019 to 31 March 2020 inclusive (Jarvis et al. 2017), providing weather information during berry ripening in this season and could be used to compare with other seasons. The GDD unit patterns from the beginning of September until the end of March from the 2015/2016 season to the 2019/2020 season are in Fig. S1c, indicating that the weather in the 2019/2020 season was at the average level among these five growing seasons. The vines were 3 years old and pruned to six shoots with two bunches per shoot. Given that vines grown outdoors experienced dynamic weather, and that washed sand used to grow the vines had low water-holding capacity, the volume and length of irrigation varied during the growing season. The vines were drip irrigated (4 L h−1) for 5–15 min every 6–12 h, depending on the daily weather conditions. No water stress was observed during the experiment. All vines were administered a comprehensive soil fertiliser (Megamix Plus Nutrient, Rutes Pty Ltd, Australia) every 2 weeks from budburst. There was a larger design consisting of eight blocks, with 24 potted vines per block, to assess the impact of specific nutrients on shoot growth. After fruit set, 14 vines in seven blocks (two vines per block) carrying approximately 10 bunches from the larger design were chosen as the experimental vines for the K fertiliser trial. Two experimental groups of vines were identified in the trial, including the Standard-K supply and the Doubled-K supply group. Two vines in one of the chosen seven blocks were allocated to either the Standard-K or Doubled-K group, providing seven biological replicates per experimental group.
Treatment was commenced from 50 days after anthesis (DAA) (berries pea-size, E-L 31 stage) with the application of the Standard-K fertiliser to the Standard-K supply group, and the Doubled-K fertiliser to the Doubled-K supply group. Each group received three solutions, which were a 100-fold diluted Megamix Plus Nutrient (Rutes Pty Ltd, Australia) (Solution-1) and two additional solutions (Solution-2 and Solution-3) based on modified Hoagland solutions (Baby et al. 2014). The concentration of elements in Solution-1 (100-fold diluted Megamix Plus Nutrient) was calculated from product information. Nutrient concentrations in Solution-2 and Solution-3 differed in the Standard-K fertiliser and the Doubled-K fertiliser (Table 1). Vines in the Doubled-K supply group obtained a doubled total K amount compared to the Standard-K supply group. Due to the lack of K in Solution-2 and Solution-3 in the Standard-K fertiliser, vines in the Standard-K supply group obtained K only from Solution-1 (38.36 mM), while the vines in the Doubled-K supply group obtained K from three solutions with K concentrations of 38.36 mM, 17.4 mM and 24 mM, respectively (Table 1, see bold data). At each treatment time, the same volume (200 mL) of three solutions was applied to the corresponding group of plants. The three solutions were applied on different days separately in the same week, to minimise the nutrient loss and the excessive osmotic stress. The treatment was repeated for seven times during berry ripening until over-ripe at 132 DAA.
| Treatment | Element | Solution-1 (mM) | Solution-2 (mM) | Solution-3 (mM) | |
|---|---|---|---|---|---|
| Standard-K fertiliser | Nitrogen | 92.81 | 75.6 | 0 | |
| Potassium | 38.36 | 0 | 0 | ||
| Phosphorus | 32.29 | 0 | 0 | ||
| Boron | 0.55 | 0 | 0 | ||
| Iron | 0.29 | 0 | 0 | ||
| Magnesium | 0.12 | 10.5 | 10.5 | ||
| Manganese | 0.06 | 0 | 0 | ||
| Zinc | 0.05 | 0 | 0 | ||
| Copper | 0.03 | 0 | 0 | ||
| Molybdenum | 0.02 | 0 | 0 | ||
| Chloride | 0 | 37.8 | 0 | ||
| Sulfur | 0 | 0 | 10.5 | ||
| Doubled-K fertiliser | Nitrogen | 92.81 | 76.2 | 0 | |
| Potassium | 38.36 | 17.4 | 24 | ||
| Phosphorus | 32.29 | 0 | 0 | ||
| Boron | 0.55 | 0 | 0 | ||
| Iron | 0.29 | 0 | 0 | ||
| Magnesium | 0.12 | 5.40 | 7.2 | ||
| Manganese | 0.06 | 0 | 0 | ||
| Zinc | 0.05 | 0 | 0 | ||
| Copper | 0.03 | 0 | 0 | ||
| Molybdenum | 0.02 | 0 | 0 | ||
| Chloride | 0 | 42 | 0 | ||
| Sulfur | 0 | 0 | 19.2 |
To assess vine nutrient status, vegetative tissues, including leaf petioles and the rachis together with the pedicels, were analysed for inorganic elements. The leaf petioles located opposite the bunches were collected in the middle of the sampling period (111 DAA), while the rachis and pedicels were collected at the end of the sampling period (143 DAA). After sampling, the vegetative tissues were dried at 60°C for 10 days and then ground to a fine powder by a TissueLyser II (Qiagen). The dried ground samples, including petioles, rachises and pedicels, were analysed for the inorganic elements, using inductively coupled plasma optical emission spectroscopy (ICP-OES) at the Environmental and Analytical Laboratories at CSU. Five elements, Ca, K, Mg, P and Na, were quantified in three vegetative tissues with seven replicates for each.
Before sampling, the berry number was between 80 and 100 per vine, which was sufficient for sampling more than 10 times. The initial berry samples were collected on the same day the treatments commenced (50 DAA). Each replicate sample contained five berries from each vine carrying 10 clusters, targeting one random berry per bunch from either the upper, middle or lower portion of the bunch. Following the initial sampling, berries were sampled a further six times, on 63 DAA (veraison), 77 DAA, 88 DAA, 103 DAA, 123 DAA (harvest ripeness) and 143 DAA (over-ripe). Berries were snap frozen by liquid nitrogen (LN2) on the sampling date, then stored at −70°C until processing. The seeds of berries were removed manually after crushing with a mortar and pestle under LN2. The remaining frozen pericarp of the five berries was ground and homogenised by the TissueLyser II (Qiagen) with LN2, contributing to one biological replicate for pericarp parameters analysis. The pericarp samples remained frozen during homogenisation and were subsequently stored at −70°C until the chemical analysis described below. Pericarp ATP and ethanol content were only analysed in samples collected on 50 DAA (pre-veraison), 63 DAA (veraison), 123 DAA (harvest ripeness) and 143 DAA (over-ripe).
Frozen ground pericarp samples with recorded fresh mass (about 1 g) were thawed and dried at 60°C for 10 days. Pericarp water mass was calculated using the mass variation of the sample before and after drying. Inorganic elements were analysed in the dried pericarp samples by ICP-OES, including Ca, K, Mg, Na and P. The pericarp K/Na ratio was determined by dividing the K content by the Na content of the same sample.
Pericarp ATP content was measured by a luminescence assay according to a published method (Smyth and Black 1984; Bajerski et al. 2018) with modification. The frozen ground pericarp samples with recorded fresh mass (100–120 mg) were extracted with 1 mL perchloric acid (0.83 M) on ice for 20 min, followed by adding 250 μL Bicine (1 M, pH 7.75 adjusted with 4 M KOH) supplemented with PVP40. The addition rate of PVP40 into the 1 M Bicine solution (pH 7.75) was 50 mg mL−1. The mixtures were neutralised to pH 7.2–7.8 using KOH (4 M) and pH indicator papers (WHA2629990, Whatman). The neutralised mixtures were centrifuged by 12,000g at 4°C for 10 min. The supernatants were collected as ATP extracts, and then stored at −20°C until ATP determination. ATP standards for generating standard curves were prepared with Bicine (66 mM, pH 7.75 adjusted with 4 M KOH), followed by sterile filtration and storage at −20°C until ATP determination.
The ATP extract was diluted two-fold by autoclaved MilliQ water, and then used for ATP assessment with a Kinase-Glo Luminescent Kinase Assay (V6711, Promega) with ATP standards. Following the addition of 50 μL of the reagent from the Kinase-Glo Luminescent Kinase Assay with 50 μL ATP extract or ATP standard in a Nunc F96 MicroWell White Polystyrene Plate (236105, Thermo Scientific), the relative light units (RLU) were detected by a Synergy HTX Multi-Mode Reader (BioTek). The luminescence assay was conducted in technical duplicate. The recorded sample fresh mass, pericarp water percentage, ATP extract volume, dilution factor and standard curves were used to calculate the ATP concentration and content of the sample.
After sample aliquoting for element and ATP analysis, the remaining frozen powder of berry pericarp samples was thawed. A volume of 1.5 mL grape juice was centrifuged at 15,000g for 2 min, followed by adjusting the pH of 1 mL supernatants by adding 5–40 μL KOH (10 M) to pH 8–9 indicated by litmus pH test strips. Alkalised grape juices (pH: 8–9) were used to determine the total sugar, L-malic acid and ethanol concentrations. Ethanol was measured using a Thermo Scientific enzymatic assay kit (product code: CDK984300) with 96 well microplates (CLS3474, Corning Costar) and a Synergy HTX Multi-Mode Reader (BioTek). Total sugar, combining sucrose, glucose and fructose, and L-malic acid were measured using Thermo Scientific enzymatic assay kits (product code 984310 and 984317) in a Konelab (Arena X20, Thermo Fisher Scientific) following the manufacturer’s instructions. The factor and standard curves were used to calculate the concentration and content of ethanol, sugar and L-malic acid in the sample. TSS of juice without alkalisation was measured by a Pocket Refractometer (Atago, PAL-1).
Rootstock trial. Comparison of berry K levels in Shiraz grown on own rooted vines or 420-A, Ramsey or Ruggeri-140 rootstocks
Shiraz grapevine berries (Clone BVCR12), located at the Waite Campus of the University of Adelaide, SA, Australia, were sampled from vines on their own roots or one of the three rootstocks: (1) Ramsey; (2) Ruggeri-140; and (3) 420-A. Berry samples were collected from the eastern and western sides of the north-south oriented rows of the canopy in the 2018/2019 and the 2019/2020 seasons. Ten replicates, each containing 11–26 berries, were sampled weekly from veraison (65 DAA in the 2018/2019 season; 73 DAA in the 2019/2020 season) until the end of ripening (108 DAA in the 2018/2019 season; 114 DAA in the 2019/2020 season). During sampling, berries were snap frozen in LN2 in the vineyard, and then stored at −80°C until processing and analysis. The frozen ground berry samples with recorded fresh mass (470–530 mg) were dried at 65°C for 3 days. Dried berry samples were extracted by 2 mL nitric acid (0.22 M) in 50 mL cap-sealed tubes (352070, Falcon; 430829, Corning), which was incubated on a hot block (SCP Science, DigiPREP) at 100°C for 2 h. After extraction, solids were removed by centrifugation at 15,000g for 10 min. The supernatants were collected as K extracts. After 10-fold dilution with MilliQ water, the K concentration of extracts was measured by flame photometry (Model 420 Flame Photometer, Sherwood Scientific) following the manufacturer’s instructions. The results from flame photometry, K extract volume, dilution factor and sample fresh mass were used to calculate the K concentration and content of the berry sample.
Data visualisation and statistical analysis
Data were processed and visualised using Excel and MATLAB. N-way ANOVA with two-way interactions and type three sums of squares, multiple comparisons following ANOVA by Tukey’s honestly significant difference criterion, correlation coefficient, linear regression, and principal component analysis (PCA) were undertaken using MATLAB ver. 9.13.0.2105380 (R2022b). Two-way ANOVA was conducted on inorganic elements in vegetative tissue, to assess the effect of tissue and fertiliser K level. Two-way repeated measures ANOVA were undertaken on pericarp parameters in both trials. The ANOVA conducted for the K fertiliser trial involved two explanatory factors, DAA and fertiliser K level as fixed effects, as well as one within-subject factor, plant, as a random factor. The ANOVA conducted for the rootstock trial examined two explanatory factors, DAA and rootstock as fixed effects, and the within-subject factor, plant, as a random factor. PCA was undertaken using mean centred and variance-scaled data block in singular value decomposition. A two-way repeated measures ANOVA with explanatory factors DAA and rootstock as well as vine as the subject factors was undertaken on the concentration and content of berry K in 2018/2019 season and 2019/2020 season.
The significance of the factor contribution to data variation was indicated by the p value of the ANOVA (Tables S1–S3). Assessed by multiple comparison tests following ANOVA, significant differences (P < 0.05) between experimental groups on the same sampling date are shown by asterisks in the figures, and by the P-values in the ‘Results’ and ‘Discussion’ sections.
In the K fertiliser trial, the box plot, showing the median, the lower and upper quartiles, any outliers (dots in the figures), and the minimum and maximum values other than outliers, were used to demonstrate the distribution of sample data. The box plots for the two treatment groups were plotted in the same figures to demonstrate the alteration in berry components on the same sampling date, as well as in developmental evolution patterns across the berry ripening period. Boxes of two groups on the same sampling date were separated, resulting in 14 boxes on 7 sampling dates. In the rootstock trial, the bar chart along with the error bar representing the standard error of the mean was used to show the impact of rootstock on every sampling date.
Results
Doubled-K fertilisation increased pericarp L-malic acid content in the earlier phase of ripening
Shiraz vines allocated to the experimental group were supplied with a doubled K rate compared with those in the control group supplied with a standard K rate. The elements Ca, K, Mg, Na and P, as well as the ratio of K to Na, were analysed in the petiole, rachis and pedicel to assess the vine nutrient status (Fig. S2). Two-way ANOVA for the inorganic elements concentrations indicated that only the uptake of K into the experimental vines was significantly increased in the Doubled-K fertiliser group (P = 0.0374) (Table S1). The K level in the fertiliser did not affect the concentrations of other elements or the tissue K/Na ratio. Element concentrations in the same tissue type did not differ under the various fertilisers, as indicated by the multiple comparisons test following ANOVA (Table S1). The concentrations of the inorganic elements in the vegetative tissues were indicators of their availability for transport into berries.
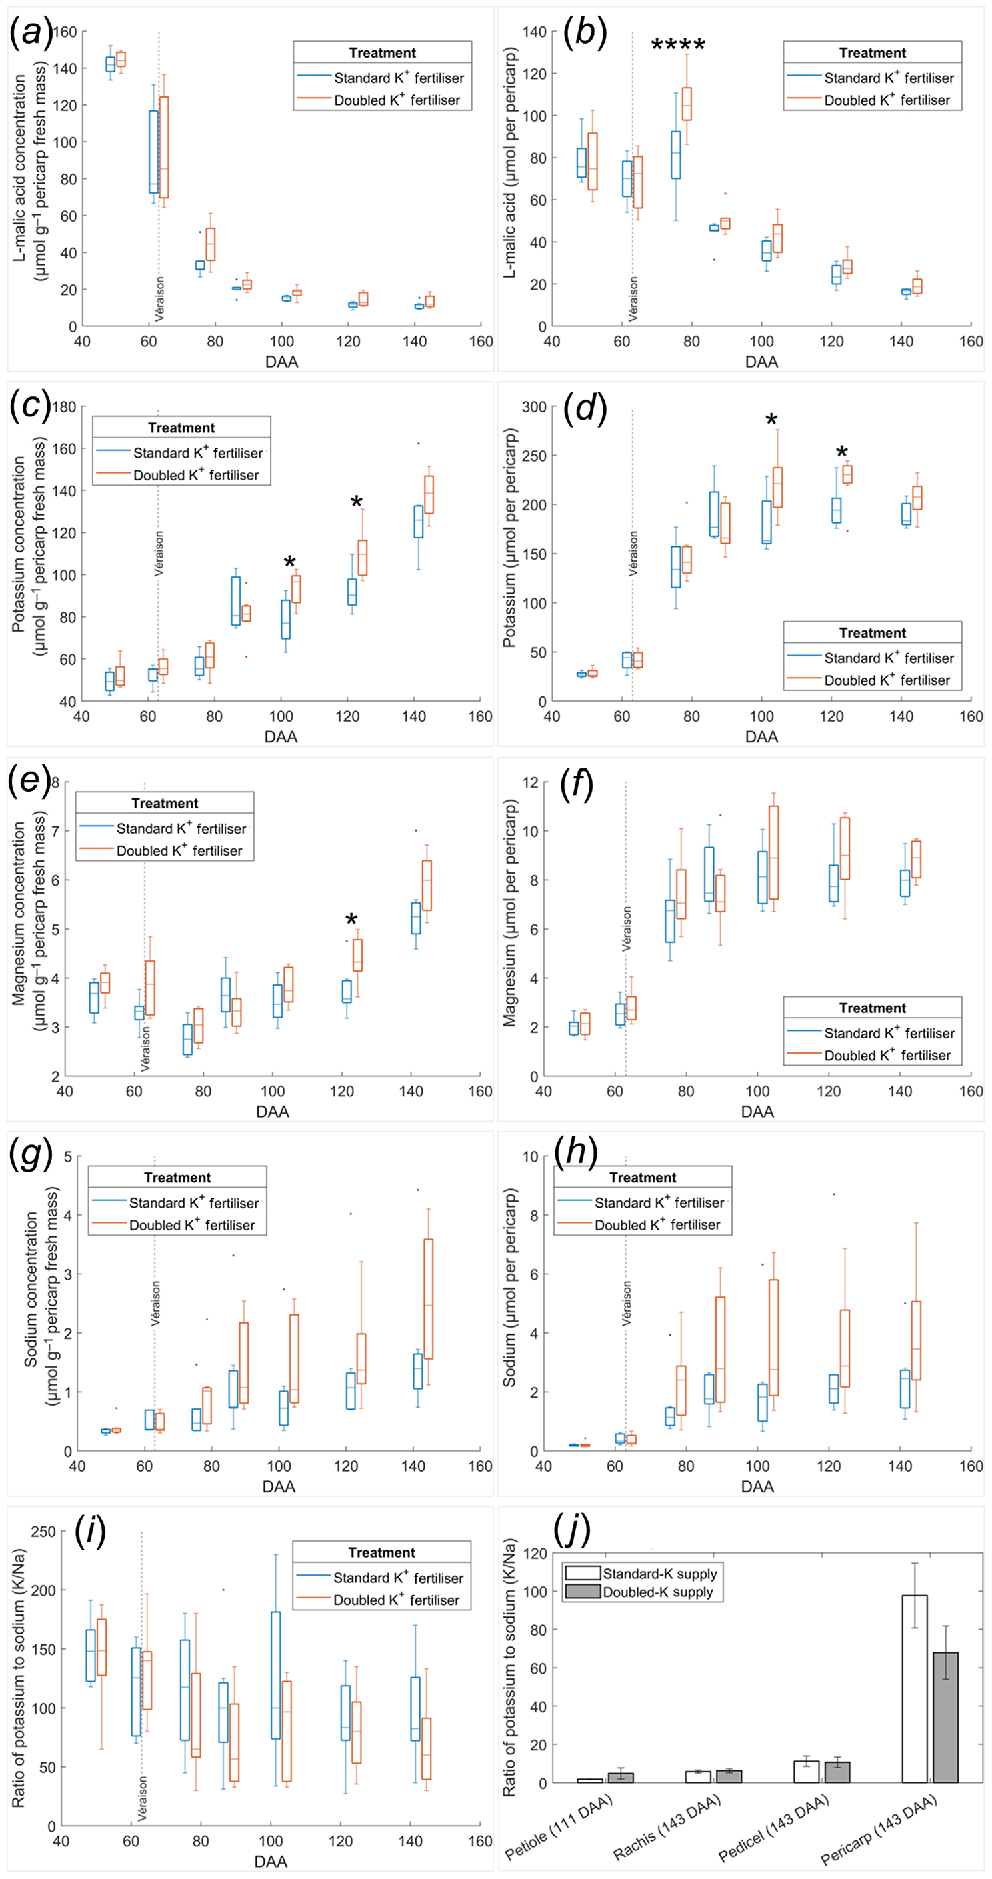
Shiraz pericarp parameters, including level of hydration, metabolites and inorganic elements, followed the same trends for vines under Doubled-K fertiliser as those under Standard-K supply (Figs 1, S3 and S4). In the Standard-K fertilisation, L-malic acid concentration declined exponentially from 140 μmol g−1 pericarp fresh mass at 50 DAA to 20 μmol g−1 pericarp fresh mass at 103 DAA with further minor decreases in later ripening, attaining 10 μmol g−1 pericarp fresh mass (Fig. 1a). The Doubled-K fertiliser resulted in similar trends, with final L-malic acid concentrations at 13 μmol g−1 pericarp fresh mass at 143 DAA. In addition, pericarp L-malic acid content in both groups declined linearly at a relatively consistent rate across ripening, except for the middle phase of ripening (77 DAA) when the content rose in both treatments (Fig. 1b). Doubling K supply contributed to the variation in pericarp L-malic acid content via interaction with DAA (P = 0.0027) (Table S2), significantly increasing the value at 77 DAA compared with Standard-K supply (P = 0.00008) as indicated by the multiple comparisons test following ANOVA. The pericarp L-malic acid concentration during berry ripening varied significantly between biological replicates, indicated by the significant interaction between DAA and plant (P = 0.005) (Table S2).
Seasonal evolution of pericarp concentration and content of L-malic acid (a, b), K (c, d), Mg (e, f), and Na (g, h), as well as the pericarp K/Na ratio (i) compared with those of vegetative tissues (j) in the Shiraz K fertiliser trial. (a–i) Vertical dash lines represent the onset of ripening (veraison). Box plots from two groups are separated by sampling dates 50, 63, 77, 88, 103, 123, or 143 DAA. *P < 0.05 between the two treatments on the same sampling date; ****P < 0.0001 between the two treatments on 77 DAA. (j) Mean values are presented with error bars indicating the s.e.m. n = 7.
Shiraz pericarp fresh mass increased more than two-fold (P < 0.0001) between 63 and 77 DAA to peak at 2.5 g and then stabilised until 103 DAA prior to declining by 25% at 143 DAA (P < 0.001) (Fig. S3a). There was no impact of fertiliser on pericarp fresh mass (P = 0.9558). As expected, pericarp water mass (Fig. S3c) followed similar trends as fresh mass. Pericarp dry mass did not decline during the later ripening phase (Fig. S3d). TSS increased linearly across the sampling period in both the Standard-K fertiliser (r2 = 0.904, P < 0.0001). and Doubled-K fertiliser group (r2 = 0.918, P < 0.0001) from five to 30°Brix (Fig. S3e).
Pericarp total sugar concentration also changed over time, increasing more rapidly during the earlier ripening phase, relative to the later phase (Fig. S4a) and peaking at 1 mmol g−1 pericarp fresh mass. Pericarp total sugar content ceased to increase beyond 103 DAA, peaking at 2 mmol per pericarp (Fig. S4b), with similar accumulation patterns as that of water. No fertiliser effects were apparent on sugar concentration (P = 0.6493) or content (P = 0.7006) as assessed by ANOVA with no main treatment, but there were significant interactive effects between the fertiliser and biological (plant to plant) variation on the sugar concentration (P = 0.0001) and sugar content (P = 0.0006) (Table S2).
Pericarp ATP concentration and content were not altered by K fertiliser rates (Fig. S4c, d), although biological (plant to plant) variation significantly impacted ATP concentration (P = 0.0357) (Table S2). In both treatments, pericarp ATP concentration was highest at the earliest sampling date with 0.11 μmol g−1 pericarp fresh mass and subsequently declined 75% to 0.03 μmol g−1 at the last sampling date (P < 0.0001, Fig. S4c). Overall, ATP concentration was between 1% and 14% lower in the Doubled-K fertiliser treatment than in the Standard-K supply (P = 0.0491). ATP content followed a different trend, with a maximum value at 123 DAA prior to declining 60% at 143 DAA (P < 0.0001, Fig. S4d). Pericarp ATP content in the Standard-K fertiliser treatment was higher than those of the Doubled-K fertiliser group (P = 0.0226) by 6% to 15% across berry development.
The Doubled-K supply did not alter pericarp ethanol concentration and content. Ethanol concentration steadily increased during berry ripening, peaking at about 3.5 μmol g−1 pericarp fresh mass at 143 DAA (Fig. S4e). The pericarp ethanol content displayed a similar trend to that in pericarp ATP content, with the maximum values detected at 123 DAA (Fig. S4f).
Doubled-K fertilisation raised the K and Mg concentrations and reduced K/Na ratio in mature pericarps
There were significant two-way interactions between the effects of berry development (DAA) and fertiliser on pericarp K concentration (P = 0.0092) and K content (P = 0.0161) (Table S2). K concentration continuously increased during berry ripening, especially between 77 DAA and 88 DAA (P < 0.01), and between 123 DAA and 143 DAA (P < 0.0001) (Fig. 1c). Doubled-K fertiliser significantly increased pericarp K concentration at 103 DAA (P = 0.0478) and 123 DAA (P = 0.0188), compared with the Standard-K treatment on the same sampling dates. The final pericarp K concentrations were 128 μmol g−1 pericarp fresh mass in the Standard-K fertiliser and 138 μmol g−1 pericarp fresh mass in the Doubled-K fertiliser treatment. Pericarp K content increased three-fold between 63 DAA (veraison) and 77 DAA (P < 0.0001) in the same treatment group (Fig. 1d). Pericarp K content peaked at 88 DAA in the Standard-K fertiliser group with 190 μmol per pericarp, however pericarp K content in the Doubled-K fertiliser group further increased to 220 μmol per pericarp at 103 DAA and 123 DAA. Pericarps of vines supplied with Doubled-K fertiliser contained significantly higher K content at 103 DAA (P = 0.0159) and 123 DAA (P = 0.0188) than those in the Standard-K supply group.
K content did not differ between Standard- and Doubled-K fertiliser groups at 143 DAA (P = 0.6046). Conversely, pericarp Mg accumulated slowly in the earlier ripening phase until after 103 DAA, reaching the final concentration between 4.5 and 7 μmol g−1 pericarp fresh mass in both treatment groups (Fig. 1e). Compared with the Standard-K treatment, Doubled-K fertiliser increased the Mg concentration significantly only at 123 DAA (P = 0.0451) than the Standard-K group on this date. The effect of fertiliser on pericarp Mg concentration interacted significantly with the effect of DAA (P = 0.0103) (Table S2). Maximum pericarp Mg content was delayed from 88 DAA in the Standard-K group to 103 DAA in the Doubled-K fertiliser group, with the maximal values of 8 or 9 μmol per pericarp, respectively (Fig. 1f). Pericarp Na concentration and content were higher in the Doubled-K fertiliser group, but the variation between two treatments was not significant (P > 0.05), which was associated with the more variable data in the Doubled-K fertiliser group Fig. 1g, h).
Pericarp P concentration increased steadily during berry ripening (Fig. S4g), following a similar pattern to that of pericarp K concentration. The maximum values of pericarp P concentration at 143 DAA were only 15 μmol g−1 pericarp fresh mass in both treatments. A similar accumulation trend between K and P was also evident for content, with no significant increase after reaching 20 μmol per pericarp at 88 DAA in the Standard-K group, and 22 μmol per pericarp at 103 DAA in the Doubled-K fertiliser group (Fig. S4h).
Pericarp Ca concentration remained relatively stable during berry ripening, with values between 3 and 7.5 μmol g−1 pericarp fresh mass in both treatments (Fig. S4i). Pericarp Ca content reached peak values between 6 and 16 μmol per pericarp at 103 DAA in both groups (Fig. S4j).
In Standard-K supply, the pericarp K/Na ratio was greater than 90 throughout ripening. However, the pericarp K/Na ratio was lower than 80 in Doubled-K fertiliser group after 88 DAA (Fig. 1i). ANOVA indicates the K treatment did not significantly alter the pericarp K/Na ratio (P = 0.4898) (Table S2). However, Doubled-K fertiliser decreased the pericarp K/Na ratio after 50 DAA, which appeared to be significantly lower at 88 DAA (P = 0.024) and 143 DAA (P = 0.0136) than the initial value at 50 DAA. By contrast, the K/Na ratio in Standard-K supplied berries did not significantly vary with the ripening phase. On the last sampling date (143 DAA), the Doubled-K supply group tended to have lower K/Na ratio than Standard-K supply group in the pericarp, but this trend was not evident in the rachis or pedicel (Fig. 1j).
Relationships between pericarp parameters in two K supply rates
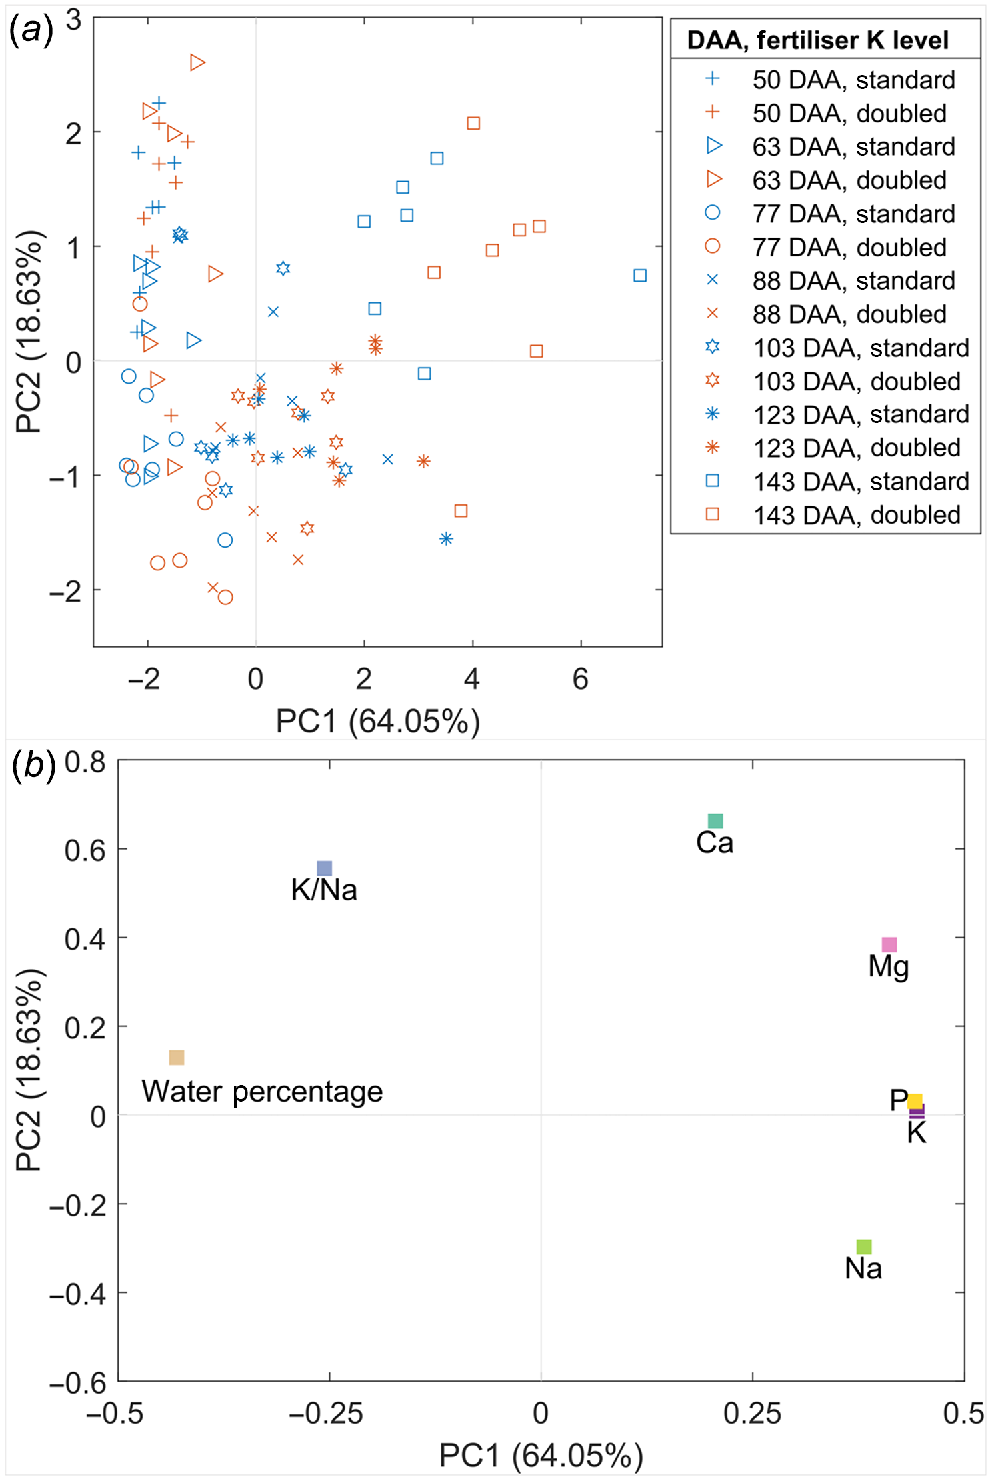
Shiraz pericarp water percentage and the concentration of five inorganic elements were analysed using PCA to evaluate their distribution patterns during berry ripening as well as the impact of increased K supply on element accumulation (Fig. 2). The combination of principal component (PC) 1 (64.05% variation) and PC2 (18.63% variation) express the majority of data variance (82.68%). Pericarps from the Doubled-K supply group were separated from the Standard-K fertiliser group from 77 DAA onwards, tending to distribute with larger values of PC1 and smaller values of PC2. Ripening berries (DAA: 77–123) were separated from less-ripened (DAA <77) and over-mature berries (143 DAA) by PC2 (Fig. 2a). Over-mature berries (143 DAA) were distinguished from the other berries on PC1 (Fig. 2a). The earlier ripening phases samples were projected into the upper left portion of the scores plot corresponding to the variable loadings projection for higher water percentage and K/Na ratio (Fig. 2b). Besides, samples with higher Mg, P, K and Na concentrations (the ones corresponding to the later ripening phases), were projected in the area defined by positive values on PC1 (Fig. 2b). The distribution patterns agree with the plots for these parameters against with DAA (Figs 1, S3 and S4). The concentrations of Na, K and P were higher in the more mature pericarps than those in the less ripened pericarps. Furthermore, the mature pericarps supplied with doubled K appeared to contain increased Na, K and P than those supplied with standard K. Another set of PCA for pericarp metabolite and element concentrations in earlier and later stages of ripening displayed that less ripened pericarps were characterised by a higher water percentage, L-malic acid, ATP and K/Na ratio (Fig. S5). The variables K/Na ratio and Na concentration were mainly loaded on PC3 (6.84% variation) rather than PC2 (Fig. S5c, d).
Principal component analysis for the pericarp water percentage and inorganic element concentrations in the Shiraz K fertiliser trial, including the distribution of samples in the scores plot (a) and the parameters in the loadings plot (b).
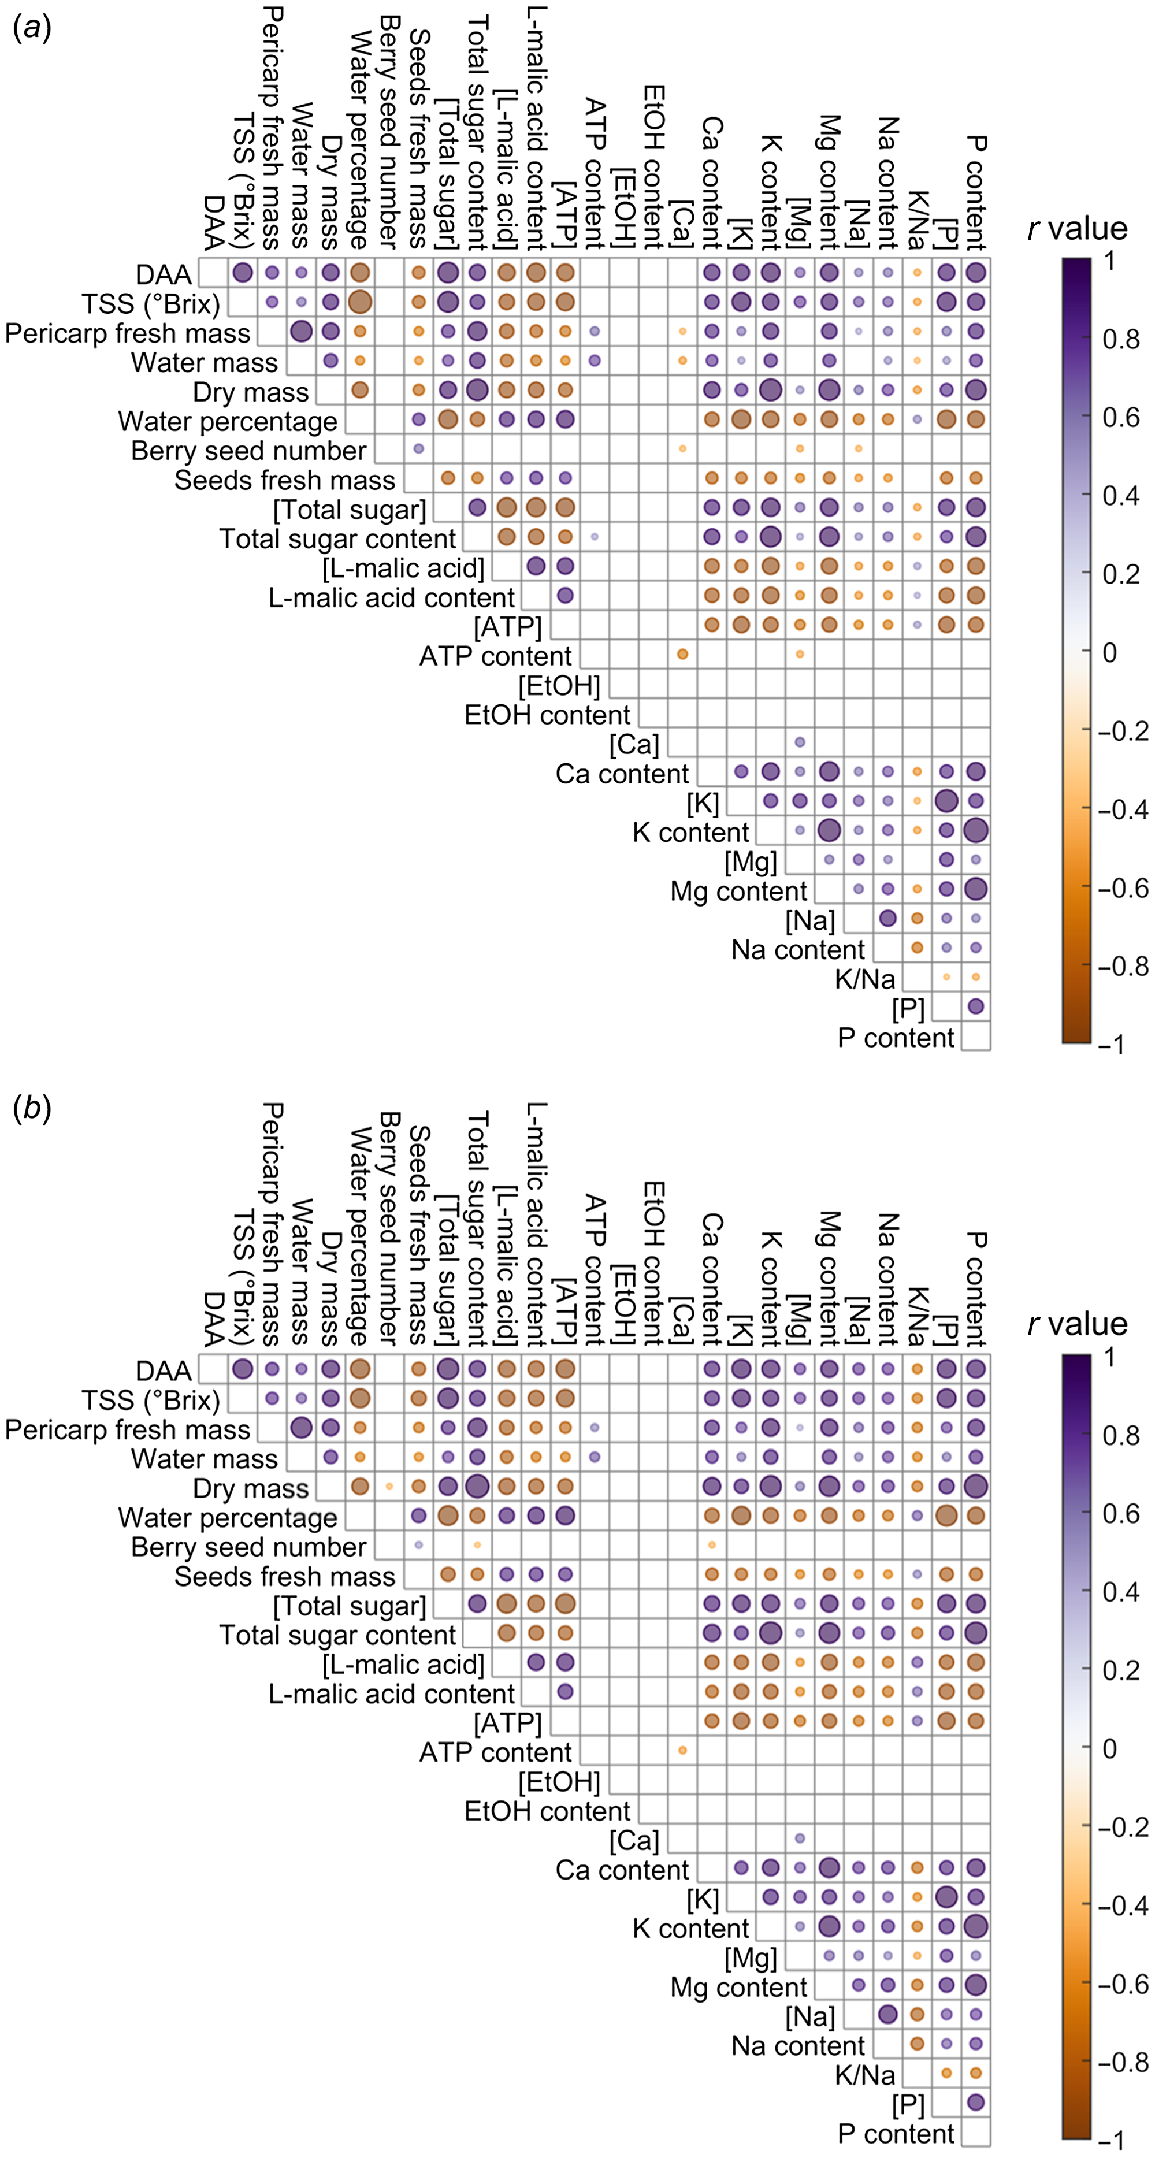
Pericarp parameters in ripening Shiraz berries were analysed via correlation coefficient for the Standard-K and Doubled-K supply (Fig. 3), involving four ripening phases, pre-veraison (50 DAA), veraison (63 DAA), harvest maturity (123 DAA) and over maturation (143 DAA). Notably in both treatments, water mass and sugar content were positively correlated, while water percentage and sugar concentration were negatively correlated. Element concentrations and contents were positively correlated with DAA, TSS, pericarp dry mass, as well as sugar concentration and content. By contrast, element concentrations and contents were negatively correlated with water percentage, seed fresh mass, L-malic acid concentration and content, as well as ATP concentration. Evident in only the Standard-K treatment, were a small positive correlation between ATP content and total sugar content, and negative correlations between ATP content and Mg concentration, between berry seed number and Mg concentration, between berry seed number and Na concentration, between pericarp fresh mass and Ca concentration, and between water mass and Ca concentration (Fig. 3a). Positive correlations between pericarp water mass and Na concentration, and between K/Na ratio and seed fresh mass, and a negative correlation between K/Na ratio and Mg concentration were apparent only for the Doubled-K fertiliser group (Fig. 3b). By comparing the correlations of K/Na ratio with other parameters in two treatments (Fig. 3), Doubled-K fertilisation resulted in more significant correlations indicated by the larger dots representing smaller P-values.
Comparison of the correlation coefficients for pericarp parameters in Shiraz fertilised with Standard-K (a) or Doubled-K (b) concentration, using samples at 50 DAA (pre-veraison), 63 DAA (veraison), 123 DAA (harvest maturity) and 143 DAA (over maturation). The dots filled with deeper colours represent the more positive (purple) or negative (brown) correlations. The size of the dot represents the absolute value of log10(P), with more significant correlations represented by larger dots. Data with P > 0.05 are not presented. Ethanol concentration and content below the detection limit were removed before the cross-correlation analysis.
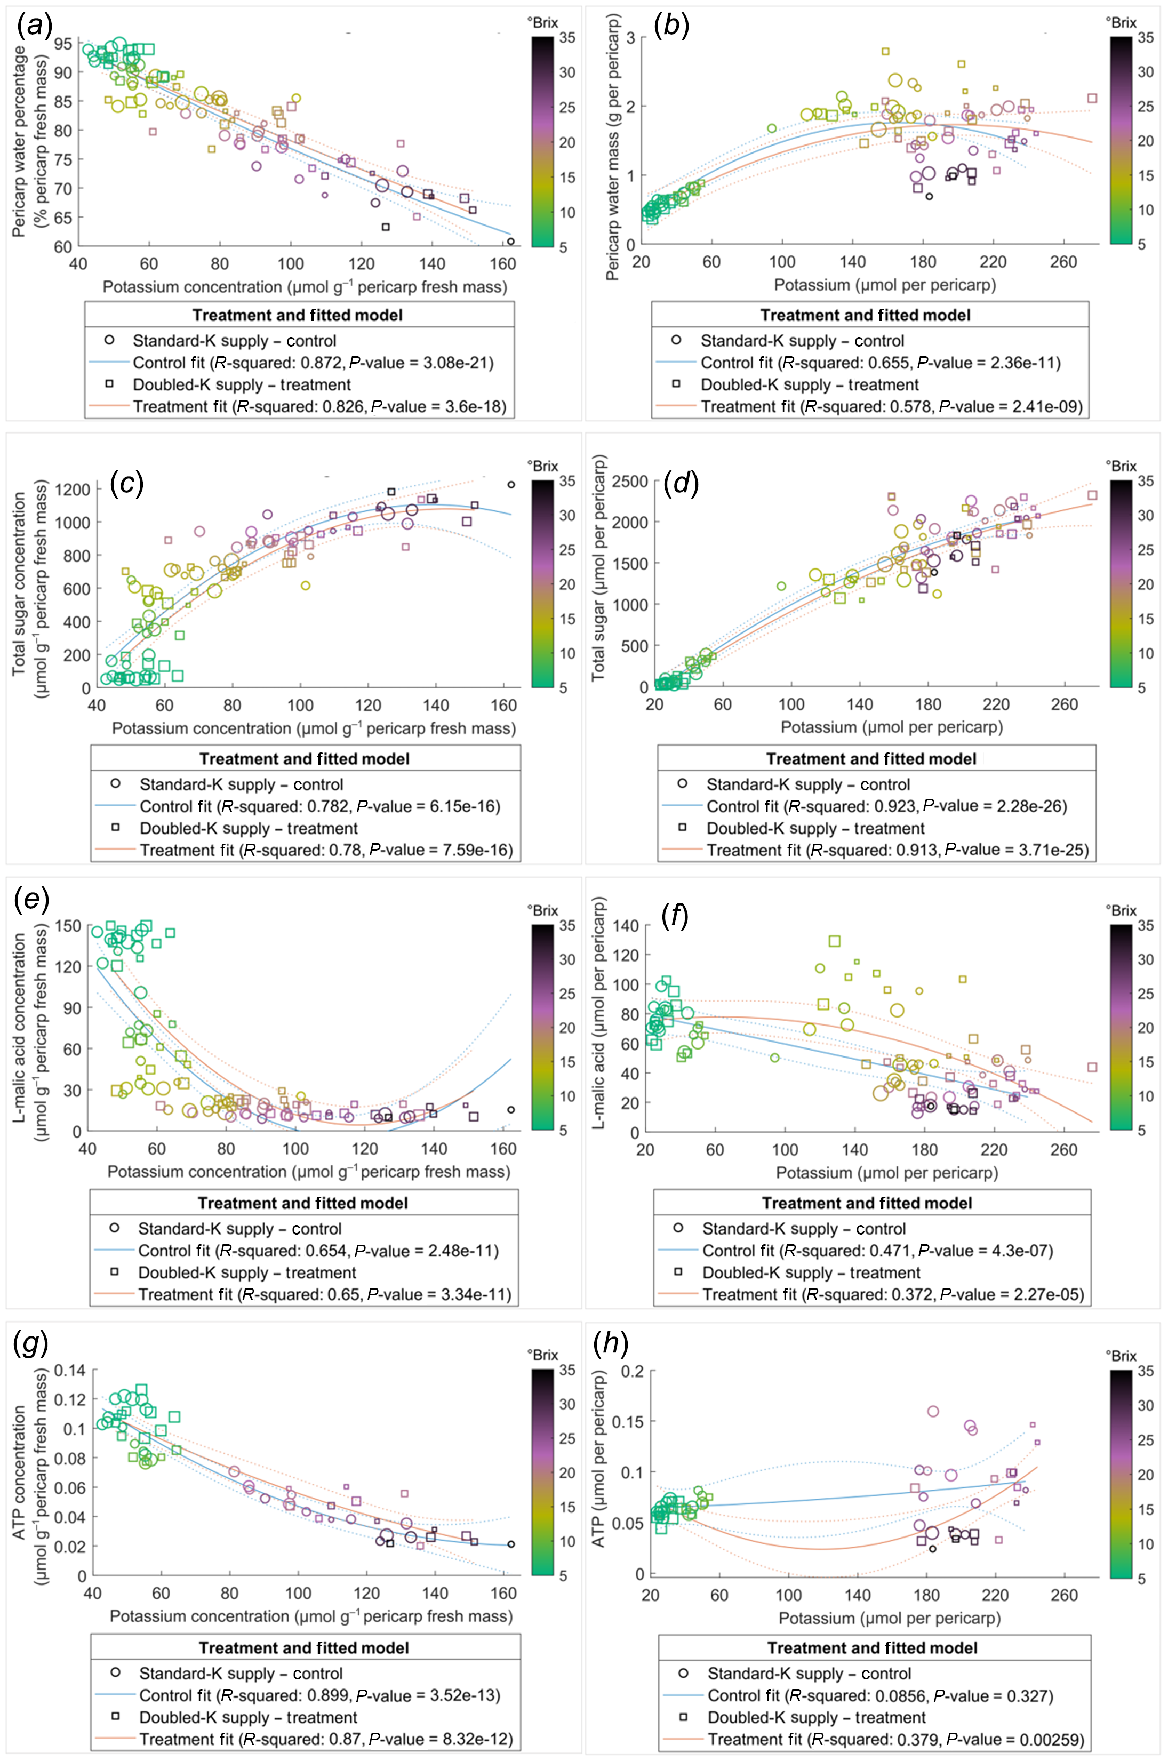
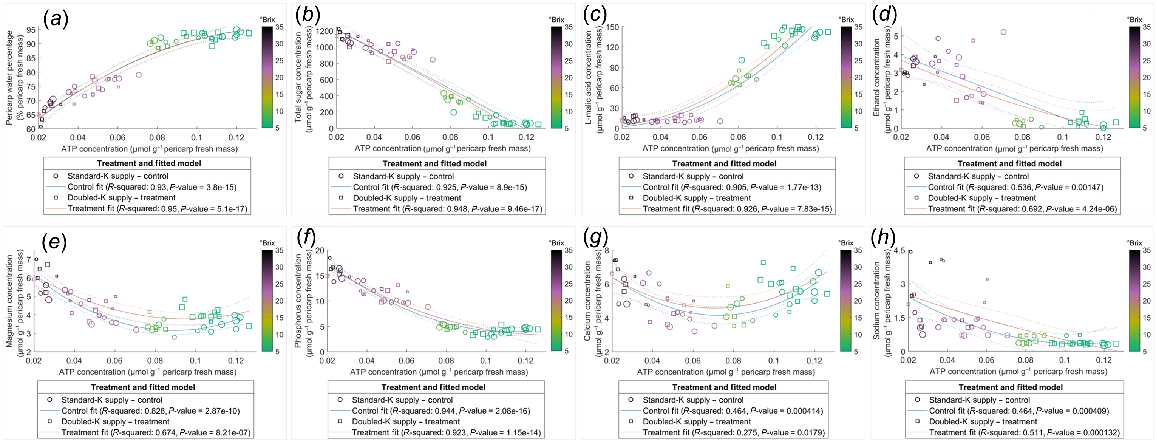
Pericarp K concentration was correlated negatively with water percentage (Fig. 4a) and positively with total sugar content (Fig. 4d). However, the relationships between K and other compounds examined in the current study were not always linearly correlated across the ripening phase, for instance, as evident in the clustering of TSS (Fig. 4). Data points with similar TSS, indicated by the colour of circles, clustered in the plots of relationships which were not linearly associated, such as water mass (Fig. 4b), sugar concentration (Fig. 4c), L-malic acid concentration and content (Fig. 4e, f), and ATP content (Fig. 4h), suggesting the relationships between K and these compounds varied in pericarps with different ripeness. The negative correlation between K and ATP concentrations was stronger in pericarps with TSS below 25°Brix. This is indicated by the nonlinear correlation for those data points with TSS higher than 25°Brix (deep purple to dark circles) (Fig. 4g). The relationships between the concentrations of ATP and other components were also dependent on pericarp maturity (Fig. 5), with little influence from the K supply rates.
Relationships of K with water (a, b), total sugar (c, d), L-malic acid (e, f), and ATP (g, h) in the Shiraz pericarps treated with Standard-K or Doubled-K fertiliser. Each data point represents one sample. The colour of the data points represents the TSS (°Brix) of the samples. Larger circles or squares indicate a greater pericarp K/Na ratio. Trendlines are fitted using the second polynomial linear regression.
Relationships of ATP concentration with water percentage (a), total sugar concentration (b), L-malic acid concentration (c), ethanol concentration (d), Mg concentration (e), P concentration (f), Ca concentration (g), and Na concentration (h) in Shiraz pericarps of vines treated with Standard-K or Doubled-K fertiliser. (d) Ethanol concentrations below the detection limit are not presented. Each data point represents one sample. The colour of data points represents the TSS (°Brix) of the samples. Larger circles or squares indicate higher pericarp K/Na ratios. Trendlines are fitted using the second polynomial linear regression.
Shiraz berry K levels during ripening in own rooted vines or on three different rootstocks
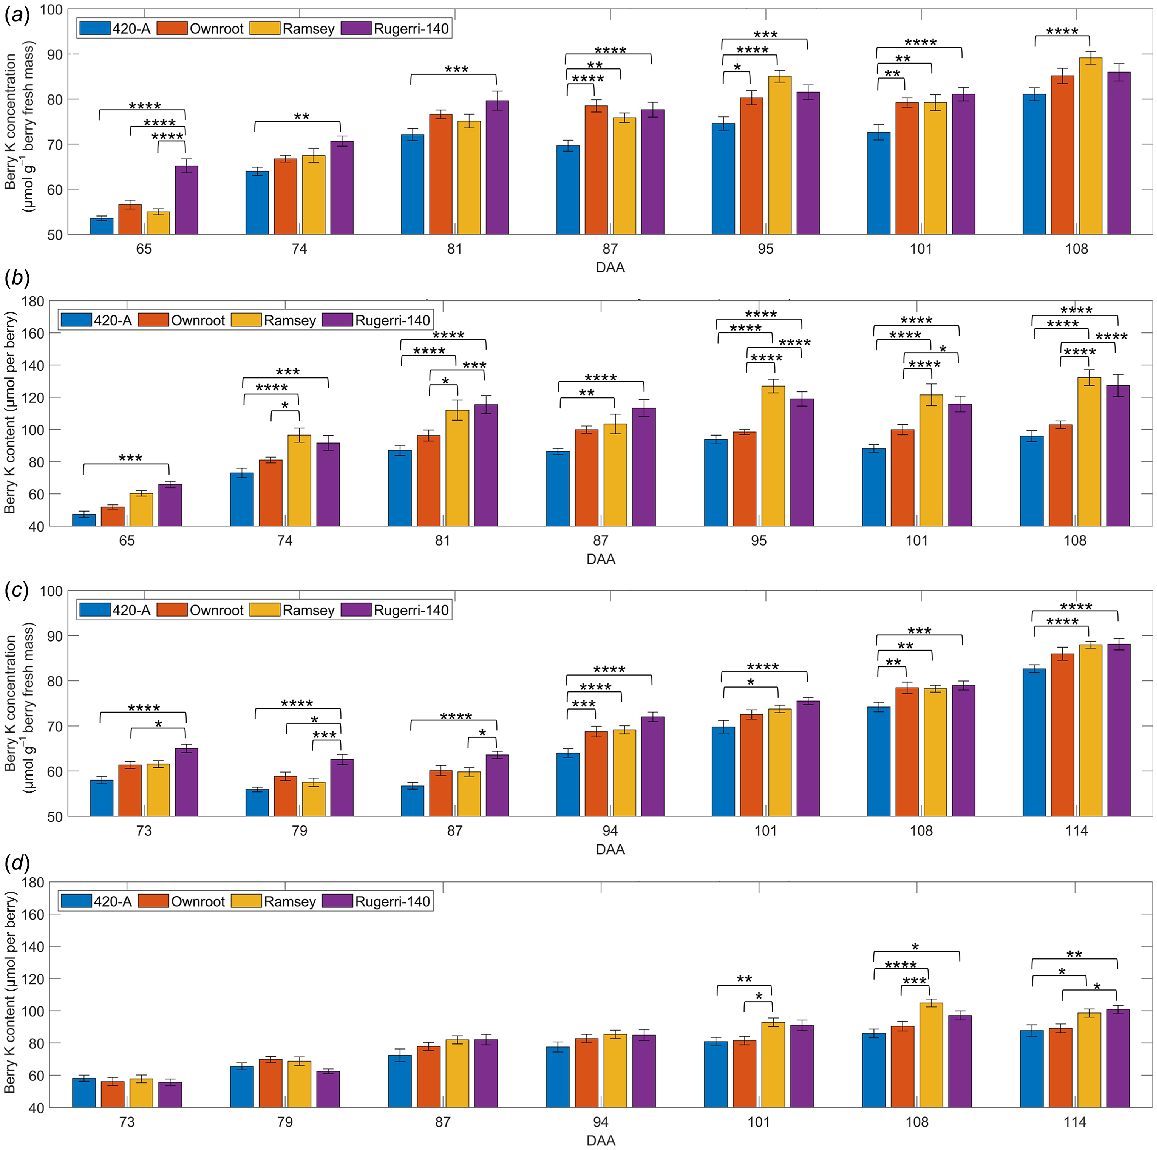
In the rootstock trial, Shiraz berry K concentration and content were affected significantly by DAA (P < 0.0001) and rootstock (P < 0.05) in 2018/2019 and 2019/2020 seasons (Fig. 6) (Table S3). Rootstock also impacted berry fresh mass (P = 0.0007) only in 2018/2019 seasons (Fig. S6) (Table S3). The interactive effect between rootstock and DAA on berry K concentration was significant only in the 2018/2019 season (P < 0.0001), while their interaction on berry K content was significant in both seasons (P < 0.0001). Significant interactions were also observed between rootstock and biological replicate (plant) on berry K concentration, K content and fresh mass in both seasons (Table S3). Berries grown on vines grafted on the 420-A rootstock contained the lowest K concentration and content across two seasons, with top values at approximately 80 μmol g−1 berry fresh mass and 90 μmol per berry. K concentration in berries from vines grown on Ramsey rootstock was relatively low at veraison but was the highest late in ripening in both seasons. On the last sampling date of the two ripening seasons, berry K concentrations were 2.3–4.7% greater for Ramsey rootstock (about 89 μmol g−1 berry fresh mass in the 2018/2019 season; about 88 μmol g−1 berry fresh mass in the 2019/2020 season) compared to own rooted vines (about 85 μmol g−1 berry fresh mass in the 2018/2019 season; about 86 μmol g−1 berry fresh mass in the 2019/2020 season) (Fig. 6a, c). Berry K content was also high for Ramsey rootstock in both seasons. Rootstock Ruggeri-140 carried berries containing the highest K concentrations among the rootstocks and own rooted vines in the earlier ripening phase, until reaching around 75 μmol g−1 berry fresh mass at 81 DAA in the 2018/2019 season, or 101 DAA in the 2019/2020 season. Berry fresh mass tended to be lower for 420-A rootstock relative to the other rootstocks but was comparable to that of own rooted vines (Fig. S6). Ramsey and Rugerri-140 rootstocks produced berries with higher berry mass on all sampling dates in the 2018/2019 season, but the mass of berries grown on these two rootstocks was not significantly higher than those from other rootstocks for most sampling dates in the 2019/2020 season (Fig. S6).
Impact of rootstocks on Shiraz berry K concentration (a, c) and content (b, d) in 2018/2019 (a, b) and 2019/2020 (c, d) seasons. Data are presented as mean values with error bars indicating the s.e.m. (n = 10). Significant differences between treatments on the same sampling day are indicated by asterisks (*).
Discussion
Increased K supply could alter berry composition at harvest
Solutes will be transferred from the roots to the vegetative tissues and eventually into the berries. It is possible that the increased K supply may be absorbed by the vines but could not be further accumulated into berries. Thus, we analysed the five elements in vegetative tissues, petiole, rachis and pedicel (Fig. S2) to better understand the impact of doubling K supply to the vines’ vegetative tissues. It is also necessary to ensure other elements examined in the pericarps did not vary in the vegetative tissues between groups, as this may impact on partitioning to the berry components during ripening. The concentration of elements in vegetative tissues (Fig. S2) indicated the berries received the same amount of most analysed elements from the vegetative tissues, except that K was increased by the Doubled-K treatment. Doubled-K fertiliser increased K and Mg concentration in pericarps simultaneously between 103 and 123 DAA (Fig. 1c, e), suggesting the co-transfer of K and Mg to the berry through the phloem. The increased pericarp Mg concentration in the Doubled-K fertiliser group suggested that increased K availability could promote berry Mg accumulation potentially via translocation from other tissues. Berry hypoxia and greater ethanol production coincided during Shiraz berry ripening (Xiao et al. 2018), and was considered to be important in the physiological transition to berry senescence. In the current study, Mg concentration (Fig. 1e) and ethanol concentration and content (Fig. S4e) increased simultaneously at 123 DAA, possibly associated with the role of Mg2+ in cell energisation under O2 deficiency (Igamberdiev and Kleczkowski 2011). Therefore, doubling K supply may accelerate the import of solutes into berries, subsequently increasing energy requirements. The energisation of the hypoxic berries was potentially assisted by the promoted accumulation of Mg.
The element accumulation pattern in pericarps indicated that extra K supply promoted the accumulation of K and Mg in the mid to late ripening phases (Fig. 1c–e), although Doubled-K nutrition did not impact on most measured ripening parameters, including those relating to berry size and sugar accumulation. The increased K supply also did not intensify berry dehydration, a common occurrence in Shiraz berries late in ripening (Rogiers and Holzapfel 2015) as evidenced by no changes in pericarp water percentage or total sugar concentration. Even though the significant increase in pericarp K concentration and content at 103 DAA and 123 DAA (Fig. 1c, d) was caused by greater K intake by berries, these treatment effects were not apparent at the end of the season. These results are similar to that of a study where K fertiliser was applied only at veraison (56 DAA) and analysed in berries with harvest maturity (Coetzee et al. 2017, 2019). The current study initiated a treatment similar to Coetzee’s study from 50 DAA, followed by repeating the treatment for another six times during berry ripening until over-mature. Although no difference between the two treatments was found in the over-mature pericarps, the K concentration and content on 103 and 123 DAA (Fig. 1c, d), as well as the Mg concentrations on 123 DAA (Fig. 1e), were increased by doubling K supply. The stability of K and other elements in matured berries suggests ionic homeostasis in the later stages of ripening. During the later ripening phases, K partitioning to the berry may rely on remobilised K reserves to make up for the shortfall in newly acquired K, to ensure berry maturation under various external nutrient situations. Doubled-K supply did significantly interact with berry maturity, as evidenced by the interaction between DAA and fertiliser K level (Table S2), to increase pericarp content of L-malic acid at 77 DAA (Fig. 1b). These results are supported by the investigations reporting higher malic acid concentrations in berries from vines fertilised with higher K rates (Marcuzzo et al. 2021). The impact of increased K supply on grape berry solute contents at harvest could be different, depending on the harvest time.
Potential links between pericarp ATP and K levels
Pericarp ATP concentration and content declined considerably during the ripening period in both treatments (Fig. S4c, d), indicating a loss of energisation in the later phases of ripening. The decline is likely the result of increased hypoxia as evidenced by the higher pericarp ethanol and some cell death later in ripening (Fig. S4e, f) and the increased berry ethanol levels during ripening shown in previous studies (Xiao et al. 2018). The negative correlations between ATP concentration and total sugar concentration (Fig. 3) signified that the import of sugar may not be limited by the ATP status decline during most of the berry’s development, supporting the reported high energy efficiency of berry sugar accumulation (Savoi et al. 2021). The strong negative correlations between water percentage and K concentration (Figs 3 and 4a), as well as the positive correlation between sugar content and K content (Fig. 4d), are supported by previous observations of a ternary link between berry sugar, K and water (Coetzee et al. 2017). Additionally, water percentage, water mass, total sugar concentration and content, L-malic acid concentration and content, K concentration and content, and ATP concentration were significantly correlated with each other in both treatment groups, as indicated by the correlation coefficient analysis (Fig. 3). The trendline fitted for ATP concentration against the concentrations of other metabolites and elements were not shifted by increasing K supply (Fig. 5), suggesting that although the K availability may be altered, energy supply and utility within berries was maintained stable and efficient during berry maturation. ATP supply is likely to be involved in regulating solute accumulation and metabolism with secondary effects on water transport in ripening Shiraz berries.
Late in ripening, when TSS exceeded 25°Brix and K concentration was greater than 100 μmol g−1 pericarp fresh mass, the trendline fitted to pericarp ATP and K concentrations switched from a straight line to a curve (Fig. 4g), suggesting a change in the dynamics between ATP content and K accumulation. Severe berry hypoxia late in ripening (Xiao et al. 2018) may limit ATP production, which could be detrimental to membrane energisation. In Arabidopsis thaliana, inhibited K+ efflux through GORK channels improved hypoxia tolerance (Wang et al. 2017). Loss of cell vitality in hypoxic berries (Xiao et al. 2018) may be associated with cellular K+ transport in later phases of ripening. Further studies assessing the direct impact of K+ and ATP on pericarp membrane function during hypoxia are required to clarify these observations and the potential role of ATP in grape berry maturation.
Potential links between pericarp K/Na ratio and ripening progression
Altering the K availability to Shiraz during berry ripening may regulate element redistribution in grapevines. In addition to augmenting K levels between 103 and 123 DAA, Doubling K supply increased the pericarp Na concentration and content across development (P = 0.0183) (Fig. 1g, h), but not in the petiole, rachis or pedicels (Fig. S2). Increased pericarp Na concentration and content also contributed to the reduced pericarp K/Na ratio in the Doubled-K fertiliser group from 88 DAA (Fig. 1i), coinciding with a significant drop in L-malic acid content (Fig. 1b) and almost complete cessation of sugar accumulation (Fig. S4b). In comparison, there was no significant developmental variation in pericarp K/Na ratio in the Standard-K treatment (Fig. 1i). Thus, in vines supplied with Doubled-K fertilisation, the accumulation of Na relative to K may be augmented in berries during the later ripening phases. However, the mechanism for this observation in Shiraz fertilised with extra K is unknown.
Pericarp K content was significantly increased by doubling K supply (Fig. 1d) by the time sugar accumulation was complete (Fig. S4b). However, K concentration and content in this group did not differ from those in the Standard-K fertiliser group on the last sampling date, perhaps indicating a degree of K homeostasis. Besides, there was no significant variation of pericarp L-malic acid between two treatments in the later ripening phase, although there was increased content of L-malic acid in the Doubled-K supply group in the early-ripening phase (Fig. 1b). These observations indicate that K accumulation and L-malic acid exhaustion were more active in the Doubled-K supply group, which might be associated with the reduction of K/Na ratio from the onset of ripening (Fig. 1i). The K/Na ratio was correlated negatively with total sugar concentration and content, and positively with L-malic acid and concentration and content, in both treatments (Fig. 3). Although no obvious sample clustering was apparent in score plots of PC1 versus PC3 (Fig. S5c), an inspection of PC3 indicates a positive loading for Na and a negative loading for K/Na, with the position of K close to the origin on both axes (Fig. S5d). These associations infer that the K/Na ratio was influenced more by the Na concentration than the K concentration in pericarps. The reduced K/Na ratio might impact metabolism, namely since Na+ cannot replace K+ as a co-enzyme (Maathuis and Amtmann 1999). Thus, increased K supply throughout berry ripening could lead to a reduced pericarp K/Na ratio, correlated with the increased Na concentration in pericarps supplied with higher K (Fig. 1g, h), which indicated that Na+ transport may be promoted potentially through K+ transporters and channels (Maathuis and Amtmann 1999). The lower pericarp K/Na ratio by increasing K supply may be associated with faster berry maturation and eventually berry senescence, but this needs to be confirmed by further investigations.
Berry K levels were lowest with rootstock 420-A
Shiraz berries from scions on rootstock 420-A contained the lowest K levels in the 2018/2019 season and the 2019/2020 season (Fig. 6), possibly linked with the observation that 420-A reduced K uptake by the scions. This is supported by the study reporting low K levels in vegetative tissues of scions on this rootstock (Hickey et al. 2016). It was also found that Pinot Noir scions grafted on rootstock 420-A had lower K content in petioles sampled at full bloom, compared with those grafted on 101-14 Millardet et De Grasset, 3309 Couderc, 44-53 Malegue, 5 C Teleki, or Harmony (Candolfi-Vasconcelos et al. 1997). The highest berry K concentration was in Ruggeri-140 in the earlier phases of ripening in both seasons, and then in Ramsey after 95 DAA in the 2018/2019 season and 110 DAA in the 2019/2020 season. However, the total K content per berry in Ramsey and Ruggeri-140 was higher than in own-rooted vines, indicating that both Ramsey and Ruggeri 140 rootstocks may somehow promote K accumulation into individual berries. The K concentration in shoots grown on grafted vines was positively correlated with K concentration in xylem sap (Kodur et al. 2010), so K distribution in various tissues may be the result of a combination of xylem and phloem flows. Increased berry K level is predominantly the result of accumulation through the phloem, which is highly active during ripening (Rogiers et al. 2006; Zhang et al. 2006), however xylem flow into Shiraz berries was reduced but remained functional after veraison (Rogiers et al. 2000; Scharwies and Tyerman 2017), thus potentially contributing to berry K accumulation.
Given that DAA significantly altered berry K concentration and content in two seasons (Table S3), berry ripening progression predominated the amount of K accumulated in berries. Therefore, the factors affecting berry ripening progression, such as seasonal variation in weather and other environmental conditions, may affect berry K content. The effect of rootstocks on berry fresh mass varied between growing seasons (Fig. S6, Table S3), indicating that environmental factors interacted with rootstock on berry development. The impact of rootstocks on berry K concentration significantly interacted with the impact of DAA in the 2018/2019 season but not in the 2019/2020 season (Table S3), reflecting the seasonal variation in the rootstocks’ effect on berry K accumulation. Future assessments of the interactions between rootstocks and environmental conditions on berry K accumulation could further characterise the impact of viticultural strategies using rootstocks to manipulate berry ripening.
Conclusion
A soil fertiliser trial was conducted on Shiraz potted vines using two K rates during berry maturation. Pericarp K levels were analysed along with other important metabolites and attributes throughout the fertilisation treatment. Repeated measurement on pericarp parameters presented significant variations in L-malic acid, K and Mg between the two K supply rates at specific timepoints during berry ripening. Characterisation of pericarp attribute patterns indicated that altered K supply did not have consistent effects across ripening but affected pericarp solute accumulation and metabolism differently at various maturity phases. Doubled-K fertiliser to potted vines did not alter the pericarp hydration or energy status as indicated by ATP and ethanol, but it altered the correlations between ATP and water percentage, K and other metabolites point towards the multiple roles of ATP and thus results in a linkage between hydration, metabolism and solute accumulation during berry ripening. This potential linkage requires further exploration and assessments of energy regulation in maturing grape berries. Increased K supply reduced the pericarp K/Na ratio in later ripening phases, suggesting that the accumulation of pericarp Na relative to K was increased by fertilising with extra K. Positive correlations were apparent between the pericarp K/Na ratio and L-malic acid, but negative correlations with sugar. In a separate study in the 2018/2019 and 2019/2020 seasons, berry total K content analysis for own-rooted and rootstock-applied Shiraz demonstrated that the 420-A rootstock was associated with lower berry K concentration and content during ripening in two growing seasons.
The results of these two trials demonstrated that altering K supply to Shiraz could impact on berry attributes and ripening progression, linking with ionic homeostasis and energy regulation in solute accumulation during berry maturation. Both the K supply rate and the berry ripening phase affect berry chemical composition at harvest.
Data availability
The data that support this study will be shared upon reasonable request to the corresponding author.
Declaration of funding
This research was supported by the Australian Research Council Training Centre for Innovative Wine Production (www.ARCwinecentre.org.au; project number IC170100008), funded by the Australian Government with additional support from Wine Australia, Charles Sturt University, and industry partners. The University of Adelaide is a member of the Wine Innovation Cluster.
Author contributions
Conceptualisation: YL and SR. Methodology: SR, ST and YL. Analysis and data visualisation: YL and LS. Writing – original draft: YL. Writing – review and editing: SR, ST, LS and YL. Supervision: SR, ST and LS.
Acknowledgements
The authors thank Helen Pan (Charles Sturt University) and Wendy Sullivan (University of Adelaide) for laboratory arrangements and technical assistance. The authors appreciate the reviewers for their critical and helpful comments to improve the manuscript. This paper forms part of the PhD thesis of Liu (2023).
References
Baby T, Hocking B, Tyerman SD, Gilliham M, Collins C (2014) Modified method for producing grapevine plants in controlled environments. American Journal of Enology and Viticulture 65(2), 261-267.
| Crossref | Google Scholar |
Bajerski F, Stock J, Hanf B, Darienko T, Heine-Dobbernack E, Lorenz M, Naujox L, Keller ERJ, Schumacher HM, Friedl T, Eberth S, Mock H-P, Kniemeyer O, Overmann J (2018) ATP content and cell viability as indicators for cryostress across the diversity of life. Frontiers in Physiology 9, 921.
| Crossref | Google Scholar | PubMed |
Coetzee ZA, Walker RR, Deloire AJ, Barril C, Clarke SJ, Rogiers SY (2017) Impact of reduced atmospheric CO2 and varied potassium supply on carbohydrate and potassium distribution in grapevine and grape berries (Vitis vinifera L.). Plant Physiology and Biochemistry 120, 252-260.
| Crossref | Google Scholar | PubMed |
Coetzee ZA, Walker RR, Liao S, Barril C, Deloire AJ, Clarke SJ, Tyerman SD, Rogiers SY (2019) Expression patterns of genes encoding sugar and potassium transport proteins are simultaneously upregulated or downregulated when carbon and potassium availability is modified in Shiraz (Vitis vinifera L.) berries. Plant and Cell Physiology 60(10), 2331-2342.
| Crossref | Google Scholar | PubMed |
Coombe BG (1995) Growth Stages of the Grapevine: adoption of a system for identifying grapevine growth stages. Australian Journal of Grape and Wine Research 1(2), 104-110.
| Crossref | Google Scholar |
Hickey CC, Hatch TA, Stallings J, Wolf TK (2016) Under-trellis cover crop and rootstock affect growth, yield components, and fruit composition of Cabernet Sauvignon. American Journal of Enology and Viticulture 67(3), 281-295.
| Crossref | Google Scholar |
Igamberdiev AU, Kleczkowski LA (2011) Magnesium and cell energetics in plants under anoxia. Biochemical Journal 437, 373-379.
| Crossref | Google Scholar | PubMed |
Jarvis C, Barlow E, Darbyshire R, Eckard R, Goodwin I (2017) Relationship between viticultural climatic indices and grape maturity in Australia. International Journal of Biometeorology 61(10), 1849-1862.
| Crossref | Google Scholar | PubMed |
Kodur S, Tisdall JM, Tang C, Walker RR (2010) Accumulation of potassium in grapevine rootstocks (Vitis) as affected by dry matter partitioning, root traits and transpiration. Australian Journal of Grape and Wine Research 16(2), 273-282.
| Crossref | Google Scholar |
Krasnow M, Matthews M, Shackel K (2008) Evidence for substantial maintenance of membrane integrity and cell viability in normally developing grape (Vitis vinifera L.) berries throughout development. Journal of Experimental Botany 59, 849-859.
| Crossref | Google Scholar | PubMed |
Maathuis FJM, Amtmann A (1999) K+ nutrition and Na+ toxicity: the basis of cellular K+/Na+ ratios. Annals of Botany 84(2), 123-133.
| Crossref | Google Scholar |
Marcuzzo P, Gaiotti F, Lucchetta M, Lovat L, Tomasi D (2021) Tuning potassium fertilization to improve pH and acidity in Glera grapevine (Vitis vinifera L.) under a warming climate. Applied Sciences 11(24), 11869.
| Crossref | Google Scholar |
Ramos MC, Romero MP (2017) Potassium uptake and redistribution in Cabernet Sauvignon and Syrah grape tissues and its relationship with grape quality parameters. Journal of the Science of Food and Agriculture 97(10), 3268-3277.
| Crossref | Google Scholar | PubMed |
Rogiers SY, Holzapfel BP (2015) The plasticity of berry shrivelling in ‘Shiraz’: a vineyard survey. VITIS – Journal of Grapevine Research 54(1), 1-8.
| Google Scholar |
Rogiers S, Keller M, Holzapfel BP, Virgona JM (2000) Accumulation of potassium and calcium by ripening berries on field vines of Vitis vinifera (L) cv. Shiraz. Australian Journal of Grape and Wine Research 6(3), 240-243.
| Crossref | Google Scholar |
Rogiers SY, Greer DH, Hatfield JM, Orchard BA, Keller M (2006) Mineral sinks within ripening grape berries (Vitis vinifera L.). VITIS – Journal of Grapevine Research 45(3), 115-123.
| Google Scholar |
Rogiers SY, Coetzee ZA, Walker RR, Deloire A, Tyerman SD (2017) Potassium in the grape (Vitis vinifera L.) berry: transport and function. Frontiers in Plant Science 8, 1629.
| Crossref | Google Scholar | PubMed |
Savoi S, Torregrosa L, Romieu C (2021) Transcripts switched off at the stop of phloem unloading highlight the energy efficiency of sugar import in the ripening V. vinifera fruit. Horticulture Research 8(1), 193.
| Crossref | Google Scholar | PubMed |
Scharwies JD, Tyerman SD (2017) Comparison of isohydric and anisohydric Vitis vinifera L. cultivars reveals a fine balance between hydraulic resistances, driving forces and transpiration in ripening berries. Functional Plant Biology 44(3), 324-338.
| Crossref | Google Scholar | PubMed |
Smyth DA, Black CC, Jr (1984) Measurement of the pyrophosphate content of plant tissues. Plant Physiology 75(3), 862-864.
| Crossref | Google Scholar | PubMed |
Storey R (1987) Potassium localization in the grape berry pericarp by energy-dispersive X-ray microanalysis. American Journal of Enology and Viticulture 38(4), 301-309.
| Crossref | Google Scholar |
Tilbrook J, Tyerman SD (2008) Cell death in grape berries: varietal differences linked to xylem pressure and berry weight loss. Functional Plant Biology 35, 173-184.
| Crossref | Google Scholar | PubMed |
Villette J, Cuéllar T, Verdeil J-L, Delrot S, Gaillard I (2020) Grapevine potassium nutrition and fruit quality in the context of climate change. Frontiers in Plant Science 11, 123.
| Crossref | Google Scholar | PubMed |
Walker RR, Blackmore DH (2012) Potassium concentration and pH inter-relationships in grape juice and wine of Chardonnay and Shiraz from a range of rootstocks in different environments. Australian Journal of Grape and Wine Research 18(2), 183-193.
| Crossref | Google Scholar |
Wang F, Chen Z-H, Liu X, Colmer TD, Shabala L, Salih A, Zhou M, Shabala S (2017) Revealing the roles of GORK channels and NADPH oxidase in acclimation to hypoxia in Arabidopsis. Journal of Experimental Botany 68(12), 3191-3204.
| Google Scholar | PubMed |
Xiao Z, Rogiers SY, Sadras VO, Tyerman SD (2018) Hypoxia in grape berries: the role of seed respiration and lenticels on the berry pedicel and the possible link to cell death. Journal of Experimental Botany 69(8), 2071-2083.
| Crossref | Google Scholar | PubMed |
Xiao Z, DeGaris KA, Baby T, McLoughlin SJ, Holzapfel BP, Walker RR, Schmidtke LM, Rogiers SY (2020) Using rootstocks to lower berry potassium concentrations in ‘Cabernet Sauvignon’ grapevines. VITIS – Journal of Grapevine Research 59(3), 117-126.
| Google Scholar |
Zhang X-Y, Wang X-L, Wang X-F, Xia G-H, Pan Q-H, Fan R-C, Wu F-Q, Yu X-C, Zhang D-P (2006) A shift of phloem unloading from symplasmic to apoplasmic pathway is involved in developmental onset of ripening in grape berry. Plant Physiology 142(1), 220-232.
| Crossref | Google Scholar | PubMed |