Optimal crop canopy architecture to maximise canopy photosynthetic CO2 uptake under elevated CO2 – a theoretical study using a mechanistic model of canopy photosynthesis
Qingfeng Song A B , Guilian Zhang A B and Xin-Guang Zhu A B CA CAS Key Laboratory of Computational Biology and CAS-MPG Partner Institute for Computational Biology, Shanghai Institutes for Biological Sciences, Chinese Academy of Sciences, Shanghai, 200031, China.
B State Key Laboratory of Hybrid Rice, CAS-MPG Partner Institute for Computational Biology, Shanghai Institutes for Biological Sciences, Chinese Academy of Sciences, Shanghai, 200031, China.
C Corresponding author. Email: zhuxinguang@picb.ac.cn
Functional Plant Biology 40(2) 108-124 https://doi.org/10.1071/FP12056
Submitted: 22 February 2012 Accepted: 26 November 2012 Published: 22 January 2013
Journal Compilation © CSIRO Publishing 2013 Open Access CC BY-NC-ND
Abstract
Canopy architecture has been a major target in crop breeding for improved yields. Whether crop architectures in current elite crop cultivars can be modified for increased canopy CO2 uptake rate (Ac) under elevated atmospheric CO2 concentrations (Ca) is currently unknown. To study this question, we developed a new model of canopy photosynthesis, which includes three components: (i) a canopy architectural model; (ii) a forward ray tracing algorithm; and (iii) a steady-state biochemical model of C3 photosynthesis. With this model, we demonstrated that the Ac estimated from ‘average’ canopy light conditions is ~25% higher than that from light conditions at individual points in the canopy. We also evaluated theoretically the influence of canopy architectural on Ac under current and future Ca in rice. Simulation results suggest that to gain an optimal Ac for the examined rice cultivar, the stem height, leaf width and leaf angles can be manipulated to enhance canopy photosynthesis. This model provides a framework for designing ideal crop architectures to gain optimal Ac under future changing climate conditions. A close linkage between canopy photosynthesis modelling and canopy photosynthesis measurements is required to fully realise the potential of such modelling approaches in guiding crop improvements.
Additional keywords: canopy architecture, elevated CO2, photosynthesis, ray tracing, sunlit–shaded model.
Introduction
Improving photosynthetic capacity is one of the main approaches to further enhance crop productivity (Long et al. 2006b; Zhu et al. 2010), since canopy rather than leaf photosynthesis is closely related to crop yields. One of the major mechanisms underlying the improved crop yields during the ‘green revolution’ has been improved canopy architectures. In particular, selection of cultivars with more erect leaves, especially at the top of the canopy, has led to improved light environments inside a canopy and hence, improved canopy photosynthetic CO2 uptake rate (Ac) (Long et al. 2006b). Though there is still some controversy regarding whether improving photosynthesis can lead to increased crop yields, this may be more related to using leaf rather than canopy photosynthesis in deriving the relationship (Zelitch 1982). The challenge now is how to identify the ideal canopy architectural and leaf metabolic features to breed or engineer for increased canopy photosynthesis for current, and more importantly, for future elevated CO2 conditions. This is a challenge, partially due to the lack of efficient methods to measure Ac, although many efforts have been devoted to developing canopy photosynthesis chambers (Reicosky and Peters 1977; Steduto et al. 2002). Given the logistic difficulty of estimating canopy photosynthesis in the field, mathematical modelling has typically been used to estimate Ac.
Many canopy photosynthesis models with different levels of details have been developed to date. Depending on the level of complexity, these models can be roughly divided into three categories: (i) the big-leaf model (Running and Coughlan 1988; Thornley and Johnson 1990; Sellers et al. 1992; Amthor 1994; Kull and Jarvis 1995; Lloyd et al. 1995); (ii) the sunlit–shaded model (de Pury and Farquhar 1997; Wang and Leuning 1998; Dai et al. 2004); (iii) and the multi-layer model (deWit 1965; Duncan et al. 1967; Lemon et al. 1971; Norman 1979). The big-leaf model assumes that the leaf nitrogen is optimally distributed to match the light environments inside a canopy (Sellers et al. 1992; Amthor 1994; Lloyd et al. 1995). Farquhar (Farquhar 1989) demonstrated that equations describing leaf photosynthesis are the same as those for chloroplast photosynthesis as long as (a) the chloroplast photosynthetic capacity is proportional to the irradiance it absorbs; and (b) the responses of the photosynthetic CO2 uptake to irradiance are identical among different chloroplasts. This principle was extended to the canopy and formed the basis for the big-leaf canopy photosynthesis models. However, inside a canopy, the light distribution is highly heterogeneous both spatially and temporarily, mostly due to the heterogeneity of leaf angles and the sunflecks deep in the canopy (de Pury and Farquhar 1997). Such heterogeneities are ignored in current big-leaf, sunlit–shaded and multilayer models. Given this inaccuracy, some model parameters – namely the photosynthetic capacity (Lloyd et al. 1995) and the smoothness of the transition from light-limited to light-saturated photosynthesis (Sellers et al. 1992; Amthor 1994), i.e. the curvature factor – can be adjusted in the big leaf model. This improves the prediction accuracy of the big-leaf models; however, it renders big-leaf models essentially unscaleable in the sense that these parameters, e.g. curvature factors, need to be modified dependent on the leaf area index (LAI), leaf nitrogen content and the proportion of diffuse light (de Pury and Farquhar 1997). This also makes direct interpretation of the parameters used in the big-leaf model very difficult.
The other extreme of the canopy photosynthesis model is the multi-layer model, where the whole canopy is divided into many categories of leaves, each with different light levels. Most of these models are based on two assumptions: (i) that radiation attenuation inside canopy can be predicted by Beer’s Law (Monsi and Saeki 2005); and (ii) that the light inside a canopy can be divided into two categories, i.e. direct and diffuse light, dependent on the different attenuation in canopies (Goudriaan 1977). In these models the predicted light environment for each leaf category is combined with leaf photosynthesis models to predict Ac. These multi-layer models have the flexibility of incorporating the heterogeneity in both environmental and physiological parameters. So far, these models are considered as the most accurate canopy photosynthesis models, with the major drawback of being complex and requiring longer computation time.
The intermediate class of models are the sunlit–shade canopy photosynthesis models. The sunlit–shaded canopy photosynthesis model simplifies the multi-layer model by dividing the whole canopy into two categories of leaves: (i) sunlit; and (ii) shaded leaves (Sinclair et al. 1976; Norman 1980). The key for the prediction accuracy relies on the capacity to predict (a) the proportion of the sunlit leaf area and shaded leaf area; and (b) the light levels in the sunlit and shaded leaves. Modelling comparison has demonstrated that the sunlit-shaded model predicted similar Ac as the multi-layer canopy models (de Pury and Farquhar 1997). Besides sunlit–shaded models, another approach to simplify the multi-layer model is to derive analytical solutions of canopy photosynthesis (Acock et al. 1978; Johnson and Thornley 1984). However, the predictions using this approach are not as accurate as the sunlit–shaded models (Boote and Loomis 1991).
The sunlit–shaded model has been used in various applications. First, it has been used to identify options to engineer for higher canopy CO2 uptake rates (Zhu et al. 2004a; Ort et al. 2011).It has also been extended to include the interaction of stomatal conductance and photosynthesis and even the response of stomatal conductance to water vapour deficit and soil water content, which enabled prediction of net photosynthesis, latent and sensible heat flux of a canopy under a wide range of soil water availability and meteorological conditions (Wang and Leuning 1998). The sunlit–shaded model was also applied in forest studies, for example, to calculate the forest primary production (Kotchenova et al. 2004), CO2 uptake (Catovsky et al. 2002) and the effect of urban forest on air pollutant dry deposition (Hirabayashi et al. 2011). Recently, it was used to model the growth and production of the bioenergy crop Miscanthus × giganteus (Miguez et al. 2009). The sunlit–shaded canopy photosynthesis model was also used as a major tool in the agro-ecology, e.g. in the study of canopy transpiration (Tuzet et al. 2003; Yang et al. 2009; Chen et al. 2011) and evapotranspiration of winter wheat (Mo and Liu 2001), effect of elevated CO2 on plant (Reynolds et al. 1992) and the effects of clouds and atmospheric particles on plant (Roderick et al. 2001; Gu et al. 2002).
However, all these above-mentioned models are unable to predict the precise light environment inside a canopy with defined canopy architecture and therefore, cannot precisely predict the spatial and temporal heterogeneities of light inside a canopy. However, such heterogeneities of the light environment is extremely important to gain an accurate prediction of Ac, ignoring this heterogeneity can lead to an overestimate of Ac for a canopy (Zhu et al. 2012). As a result, the current used sunlit–shaded canopy photosynthesis model cannot predict the influence of modifying canopy architecture, such as tiller number, leaf shape or leaf angle on Ac. With regards to this, a few models representing 3D canopy architectures for different crops including maize (España et al. 1999; Guo et al. 2006; Zheng et al. 2008), rice (Watanabe et al. 2005; Zheng et al. 2008) and wheat (Evers et al. 2007) have been developed in recent years.
This paper describes a model of canopy photosynthesis in which the canopy architecture and light environment inside a canopy is simulated in detail: these two components are then combined with the steady-state biochemical model of C3 photosynthesis (Farquhar et al. 1980) to predict Ac. With this model, we studied the influence of canopy architecture on canopy photosynthesis and explored the theoretically impact of elevated CO2 on optimal canopy architectures required to maximise Ac.
Materials and methods
Construction of a 3D canopy architecture model
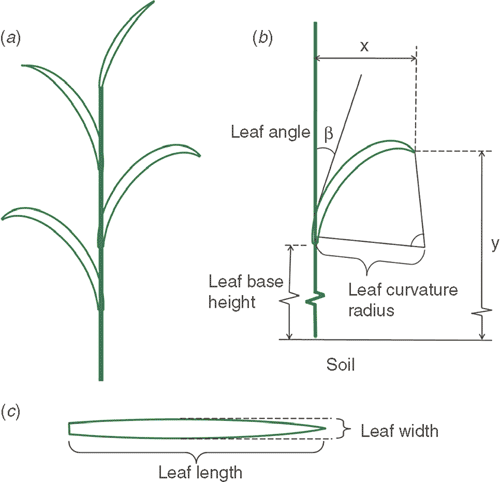
In this study, we used the architectural features of the indica rice Teqing (Oryza sativa L. subsp. indica). The cv Teqing was planted in Beijing (39.92°N and 116.46°E) on 1 June (day 150) in 2009. To define the plant structure, several parameters were measured, including tiller number, leaf number, leaf base height, leaf length, leaf width, leaf angle and leaf curvature. The parameters used in the model are illustrated in Fig. 1b, c including: leaf base height (distance between the leaf base and the ground); leaf length (maximal length of a leaf when stretched to be straight); leaf width (maximum width of each leaf); leaf angle (angle between leaf blade and stem); and leaf curvature radius (leaf curvature along its longitudinal axis was assumed to correspond to an arc of a circle, the radius of which was termed leaf curvature radius).
|
Features of the canopy architecture of rice at the grain filling stage were obtained by taking average architectural parameters from three rice plants. To illustrate the procedure used to obtain average parameters, we assumed that each plant has m tillers and each tiller has n leaves. We first ordered and labelled all tillers in a plant according to its tiller height and all leaves in a tiller according to the leaf base heights. Then each leaf can be uniquely labelled as leaf (i, m, n), where i is the plant number (i.e. 1, or 2 or 3), m and n are the tiller number and leaf number. The average of a canopy architectural parameter is then calculated as the average value of the parameter for a leaf with the same index m and n.
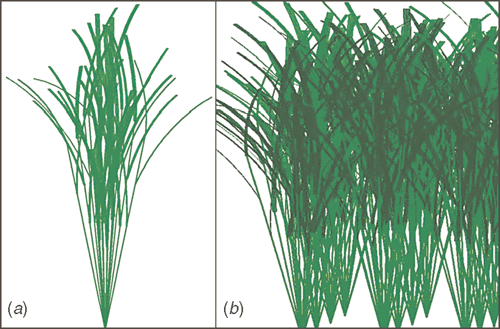
A rice plant constructed with the averaged features was used to develop a canopy model (Fig. 2). Here the canopy included 64 rice plants (eight rows by eight columns) with row and column distances both being 25 cm. Each plant in the model contained 13 tillers and each tiller contained 3–5 leaves with alternate leaf arrangement (Fig. 1a). A leaf was represented as a rectangle with measured leaf width, leaf length, leaf angle and curvature, which was divided into 5-cm long segments and each segment was divided into two parts by the major vein of the leaf. The individual section of a leaf surface, defined by four edges or four points, was defined as a facet. Leaves on a tiller were arranged alternatively with a random orientation angle and measured distance from leaf base to the base of the tiller. Tillers in a plant were arranged symmetrically so that taller tillers formed an inner circle and shorter tillers formed an outer circle. Many individual plants were generated individually and then combined to form a canopy. We randomly oriented each plant in the canopy. A MatLab script (MathWorks, Natick, MA, USA), mCanopy, was developed to construct the 3D model (code available from authors upon request). The canopy model can be adjusted by varying parameters of the canopy architectures.
|
Prediction of the light environment inside a 3D canopy with a forward ray tracing algorithm
We developed a java program (fastTracer; PICB, Shanghai, China) that uses canopy architecture model as input to simulate the light distribution inside a canopy with a forward ray tracing algorithm. The fastTracer can predict the light environment not only for a canopy with defined architecture, but also for a canopy constructed based on 3D co-ordinate data from 3D digital equipment (e.g. FASTSCAN http://www.fastscan3d.com/, accessed 4 December 2012).
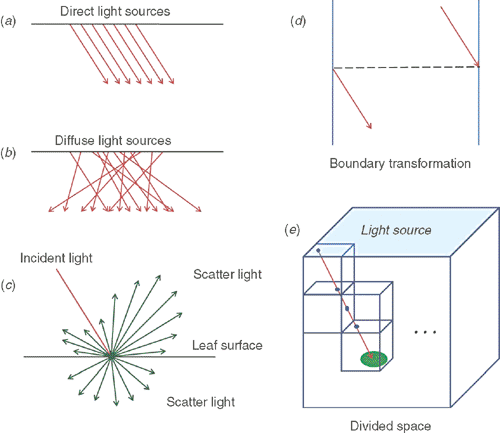
The basic unit of a leaf surface was assumed to be facet, defined by four boundaries or points. The model is able to simulate three categories of light, i.e. direct light, diffuse light and scattered light (Fig. 3a–c). The direction of direct light is determined by the solar elevation angle, which further depends on the time and location for each particular simulation (Appendix 2, Eqn A26–29). The direction of the diffuse light is randomly distributed with equal probability in each direction. Scattered light is generated once a direct or diffuse light ray hits a leaf surface with the model of Cook-Torrance bidirectional reflectance distribution function (BRDF) (Torrance and Sparrow 1967; Cook and Torrance 1981) and Lambert bidirectional transmittance distribution function (BTDF) models (Grant 1987). The directions of scattered light were simulated with a Monte Carlo method (Tucker and Garratt 1977). The leaf absorbance is different under different incident angles (Brodersen and Vogelmann 2010). As a simplification, this model assumed an average leaf absorbance of 0.85.
|
A forward ray tracing algorithm simulates the path of a light ray from its source until it is finally absorbed completely by its illuminated objective. The ray tracing process in the model is shown in Fig. S1, available as Supplementary Material to this paper. In this study, a cuboid (length 1 m, width 1 m and height 2.8 m) in the centre of the reconstructed canopy, which had a length >2 m, a width >2 m and a height <2.8 m, was chosen and only leaves inside the cuboid were used in the simulation to avoid boundary effects. The light source used in the simulation is mimicked by a cluster of light ray with a density (η) of 106 light rays per square meter above the cuboid (Fig. 3e). The cuboid is divided into many cubes and the light is traced from one cube to another (Fig. 3e). The facets in the cube were checked to determine whether it is hit by the light ray. In our algorithm, when a light ray hits the boundary of the cuboid, this light ray is moved to the opposite side of the cuboid (Fig. 3d). For direct light, the directions of the light rays are parallel to each other; while for diffuse light, the directions of these light rays are randomised. The value of photosynthetic photon flux density (PPFD) on each facet (If) is calculated by dividing the absorbed light energy (ei is the energy of each ray, N is the number of rays) intercepted by a facet with area s.


Each facet ABCD (a rectangle) has four boundaries, i.e. AB, BC, CD and DA. In our forward ray tracing algorithm, the intersection point, P(x1, y1, z1), of the light ray with the plane ABCD is first calculated. Then, it is determined whether point P is inside ABCD or not. To do this, the rectangle ABCD is divided into two triangles ABC and ACD to check whether the point falls into ABC or ACD. If the sum of the areas of PAB, PBC and PCA equals the area of ABC (Eqn 3), point P is inside the triangle ABC.

The reflected and transmitted light rays are generated once a light ray hits a leaf surface. The energy of reflected light ray (er) or transmitted light ray (et) were assumed to be 7.5% of energy of incident light ray (ei) and their directions were determined with a Monte Carlo method (Halton 1970) as in work by Lao et al. (2005).
Prediction of the macroclimatic conditions
The light environment above the canopy is influenced by atmospheric transmittance. During a growing season of a particular crop, the air transmittance varies. In this study, we assumed an atmospheric transmittance of 0.7. The directions and PPFD of direct light and diffuse light are needed to run the forward ray tracing algorithm. The PPFD of incoming solar radiation can be provided either by measured values or through prediction using mechanistic physical models. In the current study, we used a macroclimate model (Humphries and Long 1995) (Appendix 2, Eqns A22–31), which has been used in several previous studies of canopy photosynthesis e.g. (Zhu et al. 2004a, 2004b). Solar elevation angle, azimuth angle and PPFD of direct and diffuse light are calculated following Eqns A26–31 in Appendix 2. The predicted light environment inside the canopy using the forward ray tracing algorithm is used in (Eqns 1, 2) to predict the total canopy CO2 uptake rate.
Calculation of the canopy photosynthesis
The photosynthetic CO2 uptake rates (A) for each facet in a canopy is predicted by combining the steady-state biochemical model of leaf photosynthesis (Farquhar et al. 1980) with the predicted PPFD. Canopy photosynthetic CO2 uptake rate (Ac) is calculated by dividing the total photosynthetic CO2 uptake for all the leaves above a ground area Sground by the ground area.

The daily canopy photosynthetic CO2 uptake rate (Ac′) is the integral of Ac during a whole day. In the calculation, Ac is numerically integrated.

where Ac,t is the total photosynthetic CO2 uptake for a unit ground area during a particular hour; Ac,u represents the total canopy photosynthetic CO2 uptake rate at the middle of an hour, i.e. at 30th minute of each hour.
Influence of different canopy architectural parameters on Ac′ under current and future CO2 concentrations
We examined the influences on daily total canopy CO2 uptake by several canopy architectural parameters including stem height, leaf width and leaf angle. We further studied the effects of elevated CO2 on the theoretically optimal canopy architectural parameters to gain maximal Ac. In the study of the influence of elevated atmospheric CO2 concentration (Ca) on Ac, we used three scenarios: (i) current temperature (T) and current Ca of 380 μbar; (ii) elevated temperature (T + 1.5°C) and Ca of 550 μbar, mimicking the scenario of 2050; and (iii) elevated temperature (T + 3°C) and a Ca of 760 μbar, mimicking the scenario of 2100 based on work by Parry et al. (2007). The temperature dependence of the parameters for leaf photosynthesis and respiration are detailed in Eqn A7–15 in Appendix 1. Following work by Davey et al. (2004), we assumed that dark respiration (i.e. Rd) under elevated CO2 is 13% higher than that under the ambient CO2 level.
Determination of the light-limited and light saturated photosynthesis in a light response curve
In addition to label photosynthetic CO2 uptake as limited by either RuBP-limited photosynthesis or Rubisco-limited photosynthesis following the Farquhar et al. (1980) model, in this work, we also label photosynthesis as either light-limited or light-saturated. To do this, we first calculated the slope of the light response curve at each light level. The point on the light response curve where the slope is 0.005 was marked as the transition point between light-limited and light-saturated photosynthesis.
Results
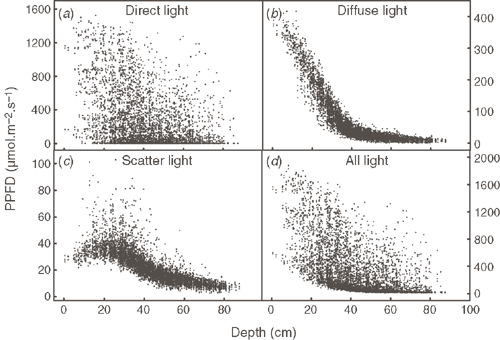
Fig. 4 shows PPFD of the predicted direct, diffuse and scattered light at every facet in the plant canopy. When fitting the data with Beer’s Law, the coefficients of determination, R2, are 0.24 for direct light, 0.90 for diffuse light and 0.41 for all light. From Fig. 4c the distribution of scattered light differs from those of direct and the diffuse light in the canopy. From the top to the bottom layers of the canopy, the PPFD of scattered light first increases and then decreases. Fig. 4d shows the gradient of total PPFD with depth on every facet in the canopy.
|
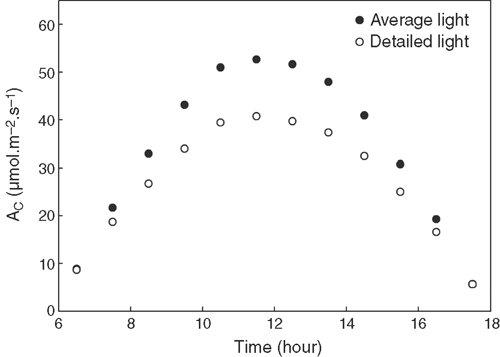
To demonstrate the impacts of using average instead of the detailed PPFD distribution on estimating Ac, we compared the Ac calculated from average and detailed PPFDs. For this analysis, the canopy was divided into 15 layers with the height of each layer being 5.49 cm. In each layer, PPFD of all facets were averaged and then used to calculate Ac. Fig. 5 shows that Ac calculated with averaged PPFD is higher than that with the detailed PPFD at each time point, especially at midday when PPFD is high. Integrating Ac for a whole day calculated with average PPFD was 25% higher than that predicted with the detailed PPFD on each facet (Fig. 5).
|
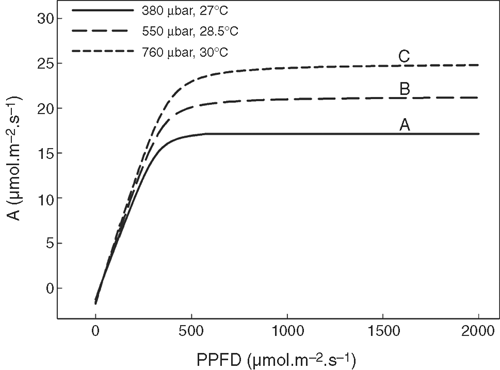
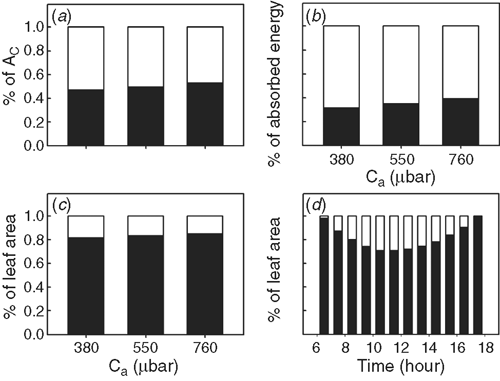
The leaf light response curves (Fig. 6) for the three combinations of CO2 and temperature were predicted with the Farquhar et al. (1980) model with the temperature response functions of photosynthetic parameters following work by Bernacchi et al. (2001). Fig. 7d shows the proportion of leaf area in a canopy performing light-limited or light-saturated photosynthesis based on the scenarios (with the current air temperature and CO2 concentration). More than 71% of the leaf area was predicted to perform light-limited photosynthesis throughout the day. At a Ca of 380 μbar, leaves performing light-limited photosynthesis absorb 32% (Fig. 7b) of total incident solar energy and contributed ~47% of Ac (Fig. 7a). With an increase in Ca, the proportion of leaf area conducting light-limited photosynthesis gradually increases (Fig. 7c). Furthermore, with increasing Ca, the proportion of RuBP-limited photosynthesis forms a greater proportion of total Ac (Fig. S2). Because in the current simulation, we assumed that plants had no photosynthesis acclimation (i.e. no changes in both the maximum rate of carboxylation at RuBP and CO2 saturation (Vcmax) and the light saturated potential rate of whole chain electron transport through PSII (Jmax) under elevated CO2, representing a scenario where plenty of nitrogen is available (Long et al. 2004). Under this assumption, at Ca of 550 and 700 μbar, photosynthesis is completely RuBP-limited (Fig. S2).
|
|
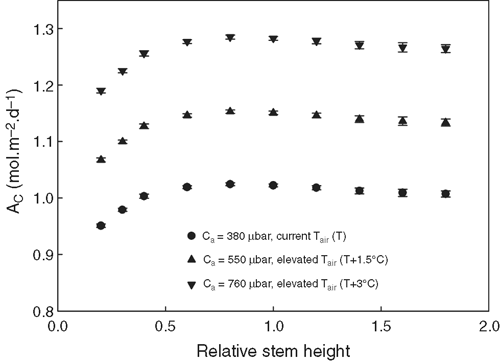
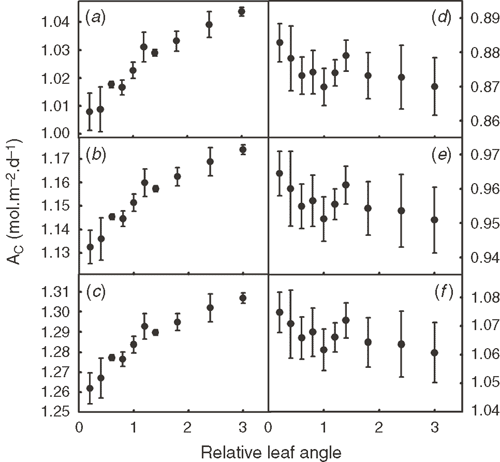
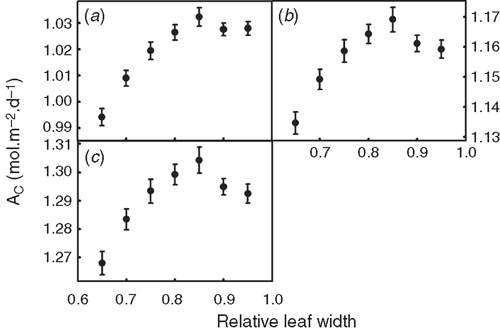
The PPFD of each facet inside a canopy was predicted and used to theoretically study the influences of different plant architectural features on Ac. Given that the canopy structure constructed was not symmetrical, we generated many canopies with varying leaf orientations but keep the overall canopy architectural features, e.g. stem height, leaf length, leaf width, leaf angle and leaf curvature, constant. Fig. 8 shows that Ac′ was not significantly affected by an increase of the stem height of the Teqing cultivar, but Ac′ gradually decreased when the stem height decreased below than 60% of the current height. Fig. 9 shows the influence of leaf angle on Ac′ of two plant canopies with LAI 4.8 (Fig. 9a–c) and 7.68 (Fig. 9d–f) under different combinations of Ca and Tair. With an increase in leaf angle, Ac′ gradually increased when the LAI was 4.8. However, Ac′ gradually decreased with leaf angle when LAI was 7.68. The increase in atmospheric CO2 concentration does not change the relationship between Ac′ and leaf angle. Fig. 10 shows the influence of leaf width on Ac′. In our simulations, LAI changed proportionally with leaf width when other parameters were kept constant. Results show that the optimal leaf width was around 85% of the current leaf width under current Ca (Fig. 10).
|
|
|
Discussion
Crop yields are related to photosynthesis of the whole canopy instead of the photosynthetic capacities of only the top leaves (Zhu et al. 2010, 2012). This has been demonstrated in different crops, e.g. in cotton (Wells et al. 1986) and soybean (Harrison and Ashley 1980). The challenge is to identify architectural and biochemical properties that can be modified to gain increased canopy photosynthetic CO2 uptake rates. In particular, although historically canopy architecture has been a major target of breeding for most crops, it is unknown whether further improving canopy architecture will increase crop yields for current and future CO2 conditions. The model developed here aimed to tackle this challenge through incorporation of three features. First, canopy architecture was abstracted into several properties, which enabled an easy construction of a diverse set of canopy architectures for different crops, not only crops with relatively simple architecture, e.g. maize (Fournier and Andrieu 1999), rice (Watanabe et al. 2005) and wheat (Fournier et al. 2003), but also crops with relatively complex architecture, e.g. soybean and tomato. This contrasts with previous models where canopy architecture is used as input and correspondingly cannot be easily modified (Zheng et al. 2008). Second, the model uses a forward ray tracing algorithm to predict the detailed PPFD of every point inside a canopy. In addition, similar to previous efforts (Lao et al. 2005), the transmitted and reflected light rays in this model are traced using a Monte Carlo approach (Tucker and Garratt 1977), which enables exploration of the effects of different leaf optical properties, i.e. leaf reflectance, transmittance and absorbance, on light environments inside a canopy. Third, the model combines the detailed light environment in a canopy with the steady-state biochemical model of C3 photosynthesis (Farquhar et al. 1980) to simulate the daily total canopy CO2 uptake rate (Ac′). With these three features, the current model enables an accurate estimate of the impacts of different canopy architectural parameters on total canopy CO2 uptake rate. Notably, the heterogeneous light environment inside a canopy has also been combined with the Farquhar et al. (1980) model in the Y-Plant system (Pearcy and Yang 1996; Pearcy and Yang 1998; Pearcy et al. 2004) and has been used to estimate the influence of different canopy features on canopy photosynthesis, revealing that leaf angle and self-shading help ameliorate photoinhibition (Pearcy et al. 2004).
With the current model, we first demonstrated that there can be a substantial difference between the estimated Ac dependent on whether the light environments on each point inside a canopy or an ‘average’ light level were used in the calculations of the photosynthetic rate. The attenuation of PPFD has been typically assumed to follow Beer’s Law (Monsi and Saeki 2005). Fig. 4b shows that PPFD of the diffuse light at different depths in a canopy is consistent with Beer’s Law (R2 = 0.90), but the distribution of direct light cannot be correctly represented by using Beer’s Law. Furthermore, even if the extinction coefficient can be estimated accurately, such models can only be used to predict the average PPFDs in different layers of a canopy (Ledent 1977). Because A becomes light saturated around 30% of the total PPFD at solar noon, leaves receiving direct light dissipate much of its absorbed solar energy as heat (Fig. 6). This, together with the non-linearity of the response of A to PPFD, results in an overestimate total CO2 uptake for models that use an ‘average’ light intensity. For example, a canopy shown in this study using averaged light led to a 25% higher Ac compared with the Ac predicted with the PPFD at individual points in the canopy. Though theoretically the estimated canopy photosynthetic CO2 uptake using PPFD of each point would be more accurate compared with prediction using an ‘average’ light level, experimental measurements of canopy photosynthetic CO2 uptake rates using canopy chambers are needed to ultimately judge the validity of these two approaches.
The canopy photosynthesis model was used to demonstrate that photosynthetic CO2 uptake of the shaded leaves can be more than 47% of the total Ac′. The canopy photosynthesis includes both light-limited and light-saturated photosynthesis. For the chosen LAI, Vcmax, Jmax and plant architecture used in this study, more than 71% of the total leaf area conducting light-limited photosynthesis (Fig. 7d). The light-limited photosynthesis accounted for ~47% of Ac′ (Fig. 7a). This demonstrates that improving photosynthesis of shaded leaves and not only that of the sunlit leaves at the top is important in terms of gaining a higher canopy photosynthetic rate. The large contribution of light-limited photosynthesis to Ac may also contribute to the lower than expected increase in Ac under elevated CO2 (Long et al. 2006a). This is because when Ca is elevated to be around 550 μbar and 760 μbar, a higher proportion of the total leaf area will perform light-limited photosynthesis, which is less responsive to elevated CO2 (Zhu et al. 2010). Some approaches to increase photosynthesis at lower layers of the canopy have been proposed recently, e.g. decreasing the leaf chlorophyll content (Ort et al. 2011), expanding the light spectrum (Chen and Blankenship 2011) and use Rubisco of increased specificity in the lower layer of the canopy (Zhu et al. 2004a; Long et al. 2006b).
Identification of optimal canopy architectural features can expedite ideal type breeding for higher crop yield potential (Peng et al. 2008; Parry et al. 2011). This is especially relevant given the currently increasing demand for food production (Tilman et al. 2011) and the recent progress in elucidating the molecular mechanisms controlling plant architecture (Wang and Li 2008). With the new mechanistic model of canopy photosynthesis, we examined the optimality of several genetically modifiable canopy architectural features, i.e. leaf width, stem height and leaf angle, for both current and future elevated CO2 conditions. First, when leaf width and correspondingly LAI increase, the Ac′ was predicted to first increase and then decrease (Fig. 10). This pattern is caused by trade-off between increased Ac and the unavoidable increase in respiratory cost under elevated LAI. The optimal leaf width for this rice cultivar is predicted to be ~85% of that in the current cultivar (Fig. 10), suggesting a potential target for genetic engineering.
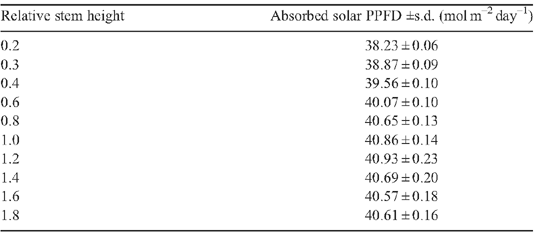
With an increase in stem height, Ac was predicted to gradually increase until it plateaued (Fig. 8). This pattern held under all three CO2 concentrations (Ca) used in this study. We note that the optimal stem height is ~80% of that of the Teqing cultivar. This indicates that even though the rice height has been dramatically decreased during the ‘green revolution’, there is still space for further decrease, which can potentially improve rice yields, given that decreased stem height contributes to logging resistance and can decrease respiratory cost for building and maintaining the extra stem tissue (Gale et al. 1985; Evans 1996; Peng et al. 1999). It is worth noting that when the stem is too short, Ac will decrease because leaves with internode lengths below a minimum threshold will create higher mutual shading and decrease the total absorbed solar energy (Table A1 in Appendix 4).
Leaf angles in different rice cultivars differ dramatically (Mohanty and Gangopadhyay 1982). Under a relatively lower LAI of 4.8, under current and elevated Ca (Fig. 9a), the Ac was predicted to gradually increase with increase of leaf angle as a result of the decreased light penetrating the canopy and falling to the ground and correspondingly increased light absorbance. Under a relative higher LAI of 7.68, an increased leaf angle decreases Ac under current and elevated Ca because erect leaves improve light distribution in a canopy. The optimal leaf angle varies for canopies with different LAIs as those features are interdependent.
In this study, the canopy features, i.e. stem height, leaf length, leaf width, leaf angle and leaf curvature were independently adjusted to examine its optimal value. However, those features interact with each other. For example, tiller number influences are related to planting density (Fagade and Dedatta 1971). Planting density can also influence the red/far-red ratio, which can further modify the leaf length and width (Franklin et al. 2003). Thus far, molecular mechanisms underlining these inter-dependencies are still not well understood. In the current model, as a simplification, we did not include these inter-dependencies. In addition to this simplification, the model also included several other simplifications that will need to be improved in the future. These include (i) photosynthetic properties in different layers of the canopy are assumed to be the same, (ii) perturbation of leaf position by wind is ignored and (iii) the CO2, temperature and humidity profiles in the canopy were assumed to be uniform.
Canopy microclimatic parameters, e.g. PPFD, leaf temperature, CO2 and water vapour concentrations, differ at different depths in a canopy. Furthermore, many leaf traits, e.g. chlorophyll concentration, Vcmax and Jmax, also vary with leaf age and position of a leaf inside a canopy. These environmental and physiological heterogeneities can influence the estimate of Ac and correspondingly, the choice of the optimal parameter values to maximise canopy photosynthesis. For example, the assumed constant chlorophyll concentration inside a canopy might potentially under-estimate PPFD in the lower layer of a canopy because chlorophyll concentration of leaves in lower layer is usually higher than that of leaves in top layer (Ciganda et al. 2008). Furthermore, using an average constant Vcmax and Jmax values instead of using actual gradients of Vcmax and Jmax values in a canopy can also potentially underestimate Ac. So far it has been a major challenge to measure these leaf physiological parameters with a throughput required to effectively parameterise a canopy photosynthesis model. In this regard, it is encouraging that a spectroscopic method (Serbin et al. 2012) based on leaf reflective spectra can estimate a range of leaf physiological parameters including chlorophyll content, leaf specific area, Vcmax and Jmax, with relatively high levels of accuracy.
In summary, we developed a new model of canopy photosynthesis, the aim of which was to provide a direct linkage between canopy architectural parameters with a detailed light distribution inside a canopy and correspondingly total canopy photosynthetic CO2 uptake rate. Although several areas in the model still need to be further developed, the model already provides a useful framework for designing ideal crop architectures to optimise light distribution and enhance photosynthetic CO2 uptake for different crops under different light and CO2 conditions. One major challenge now is to link the model predictions with experimentally-measured canopy light environments and canopy photosynthetic CO2 uptake rates. Only after such a close linkage is fully established can the potential of such modelling approach in guiding crop improvements be fully realised.
Acknowledgements
We thank Dr Jianlong Xu for providing the plants for the collection of canopy features. Funding for authors’ research is from National Science Foundation of China (Grant No. 30970213), Ministry of Science and Technology of China (Grant Nos 2011DFA31070 and S2012GR0368), the Bill and Melinda Gates Foundation (Grant No. OPP1014417), the Young Talent Frontier Program of Shanghai Institutes for Biology Sciences/Chinese Academy of Sciences (Grant No. 2011KIP311) and EU FP7 project Grassmargins (Grant No. EU 289461).
References
Acock B, Charles-Edwards DA, Fitter DJ, Hand DW, Ludwig LJ, Warren Wilson J, Withers AC (1978) The contribution of leaves from different levels within a tomato crop to canopy net photosynthesis: an experimental examination of two canopy models. Journal of Experimental Botany 29, 815–827.| The contribution of leaves from different levels within a tomato crop to canopy net photosynthesis: an experimental examination of two canopy models.Crossref | GoogleScholarGoogle Scholar |
Amthor JS (1994) Scaling CO2–photosynthesis relationships from the leaf to the canopy. Photosynthesis Research 39, 321–350.
| Scaling CO2–photosynthesis relationships from the leaf to the canopy.Crossref | GoogleScholarGoogle Scholar | 1:CAS:528:DyaK2cXksFertbs%3D&md5=fb57c12e52d0bf27ee74295d57c2486dCAS |
Bernacchi CJ, Singsaas EL, Pimentel C, Portis AR, Long SP (2001) Improved temperature response functions for models of Rubisco-limited photosynthesis. Plant, Cell & Environment 24, 253–259.
| Improved temperature response functions for models of Rubisco-limited photosynthesis.Crossref | GoogleScholarGoogle Scholar | 1:CAS:528:DC%2BD3MXhsFGrt7k%3D&md5=1a3cc1f6325b4ce24271909063c98511CAS |
Boote KJ, Loomis RS (1991) The prediction of canopy assimilation. In ‘Modeling crop photosynthesis – from biochemistry to canopy. Special Publication No. 19’. pp. 109–140. (CSSA: Madison, WI)
Brodersen CR, Vogelmann TC (2010) Do changes in light direction affect absorption profiles in leaves? Functional Plant Biology 37, 403–412.
| Do changes in light direction affect absorption profiles in leaves?Crossref | GoogleScholarGoogle Scholar |
Catovsky S, Holbrook NM, Bazzaz FA (2002) Coupling whole-tree transpiration and canopy photosynthesis in coniferous and broad-leaved tree species. Canadian Journal of Forest Research 32, 295–309.
| Coupling whole-tree transpiration and canopy photosynthesis in coniferous and broad-leaved tree species.Crossref | GoogleScholarGoogle Scholar |
Chen M, Blankenship RE (2011) Expanding the solar spectrum used by photosynthesis. Trends in Plant Science 16, 427–431.
| Expanding the solar spectrum used by photosynthesis.Crossref | GoogleScholarGoogle Scholar | 1:CAS:528:DC%2BC3MXpvFWqsr0%3D&md5=3862545a1ea1db476309cd16c1d8624cCAS |
Chen HS, Dickinson RE, Dai YJ, Zhou LM (2011) Sensitivity of simulated terrestrial carbon assimilation and canopy transpiration to different stomatal conductance and carbon assimilation schemes. Climate Dynamics 36, 1037–1054.
| Sensitivity of simulated terrestrial carbon assimilation and canopy transpiration to different stomatal conductance and carbon assimilation schemes.Crossref | GoogleScholarGoogle Scholar |
Ciganda V, Gitelson A, Schepers J (2008) Vertical profile and temporal variation of chlorophyll in maize canopy: quantitative ‘crop vigor’ indicator by means of reflectance-based techniques. Agronomy Journal 100, 1409–1417.
| Vertical profile and temporal variation of chlorophyll in maize canopy: quantitative ‘crop vigor’ indicator by means of reflectance-based techniques.Crossref | GoogleScholarGoogle Scholar | 1:CAS:528:DC%2BD1cXht1aqtb3L&md5=47e783771d5f304840f5aaabcec981d8CAS |
Cook R, Torrance KE (1981) A reflectance model for computer graphics. Computer Graphics 15, 307–316.
| A reflectance model for computer graphics.Crossref | GoogleScholarGoogle Scholar |
Dai Y, Robert ED, Wang Y-P (2004) A two-big-leaf model for canopy temperature, photosynthesis, and stomatal conductance. Journal of Climate 17, 2281–2299.
| A two-big-leaf model for canopy temperature, photosynthesis, and stomatal conductance.Crossref | GoogleScholarGoogle Scholar |
Davey PA, Hunt S, Hymus GJ, DeLucia EH, Drake BG, Karnosky DF, Long SP (2004) Respiratory oxygen uptake is not decreased by an instantaneous elevation of [CO2], but is increased with long-term growth in the field at elevated [CO2]. Plant Physiology 134, 520–527.
| Respiratory oxygen uptake is not decreased by an instantaneous elevation of [CO2], but is increased with long-term growth in the field at elevated [CO2].Crossref | GoogleScholarGoogle Scholar | 1:CAS:528:DC%2BD2cXhtVans7Y%3D&md5=371ab89edf991417ea5434abcc0d2440CAS |
de Pury DGG, Farquhar GD (1997) Simple scaling of photosynthesis from leaves to canopies without the errors of big-leaf models. Plant, Cell & Environment 20, 537–557.
| Simple scaling of photosynthesis from leaves to canopies without the errors of big-leaf models.Crossref | GoogleScholarGoogle Scholar |
deWit CT (1965) Photosynthesis of leaf canopies. Agricultural Research Report No. 663. (PUDOC: Wageningen, The Netherlands)
Duncan WG, Loomis RS, Williams WA, Hanau R (1967) A model for simulating photosynthesis in plant communities. Hilgardia 38, 181–205.
España ML, Baret F, Aries F, Chelle M, Andrieu B, Prévot L (1999) Modeling maize canopy 3D architecture: application to reflectance simulation. Ecological Modelling 122, 25–43.
| Modeling maize canopy 3D architecture: application to reflectance simulation.Crossref | GoogleScholarGoogle Scholar |
Evans LT (1996) ‘Crop evolution, adaptation and yield.’ (Cambridge University Press: Cambridge)
Evers JB, Vos J, Fournier C, Andrieu B, Chelle M, Struik PC (2007) An architectural model of spring wheat: evaluation of the effects of population density and shading on model parameterization and performance. Ecological Modelling 200, 308–320.
| An architectural model of spring wheat: evaluation of the effects of population density and shading on model parameterization and performance.Crossref | GoogleScholarGoogle Scholar |
Fagade SO, Dedatta SK (1971) Leaf area index, tillering capacity, and grain yield of tropical rice as affected by plant density and nitrogen level. Agronomy Journal 63, 503–506.
| Leaf area index, tillering capacity, and grain yield of tropical rice as affected by plant density and nitrogen level.Crossref | GoogleScholarGoogle Scholar | 1:CAS:528:DyaE3MXktF2htbY%3D&md5=6dbff88edfdbb3c623a1787eecc922f8CAS |
Farquhar GD (1989) Models of integrated photosynthesis of cells and leaves. Philosophical Transactions of the Royal Society of London. Series B, Biological Sciences 323, 357–367.
| Models of integrated photosynthesis of cells and leaves.Crossref | GoogleScholarGoogle Scholar | 1:CAS:528:DyaL1MXktlKmt7w%3D&md5=ad0a616d543e3279eba2bede496d328bCAS |
Farquhar GD, van Caemmerer S, Berry JA (1980) A biochemical-model of photosynthetic CO2 assimilation in leaves of C3 species. Planta 149, 78–90.
| A biochemical-model of photosynthetic CO2 assimilation in leaves of C3 species.Crossref | GoogleScholarGoogle Scholar | 1:CAS:528:DyaL3cXksVWrt7w%3D&md5=b0417117f3598df013ab17a3da1f67a8CAS |
Fournier C, Andrieu B (1999) ADEL-maize: an L-system based model for the integration of growth processes from the organ to the canopy. Application to regulation of morphogenesis by light availability. Agronomie 19, 313–327.
| ADEL-maize: an L-system based model for the integration of growth processes from the organ to the canopy. Application to regulation of morphogenesis by light availability.Crossref | GoogleScholarGoogle Scholar |
Fournier C, Andrieu B, Ljutovac S, Saint-Jean S (2003) ADEL-wheat: a 3D architectural model of wheat development. In the ‘Proceedings of plant growth modeling and applications’. pp. 54–63. (Tsinghua University Press/Springer: Beijing)
Franklin KA, Praekelt U, Stoddart WM, Billingham OE, Halliday KJ, Whitelam GC (2003) Phytochromes B, D, and E act redundantly to control multiple physiological responses in Arabidopsis. Plant Physiology 131, 1340–1346.
| Phytochromes B, D, and E act redundantly to control multiple physiological responses in Arabidopsis.Crossref | GoogleScholarGoogle Scholar | 1:CAS:528:DC%2BD3sXisFels7s%3D&md5=0e2d06d21f343da3cc80b0a7ee038b68CAS |
Gale MD, Youssefian S, Russell GE (1985) ‘Progress in plant breeding.’ (Butterworths: London)
Goudriaan J (1977) ‘Crop micrometeorology: a simulation study.’ (PUDOC: Wageningen, The Netherlands)
Grant L (1987) Diffuse and specular characteristics of leaf reflectance. Remote Sensing of Environment 22, 309–322.
| Diffuse and specular characteristics of leaf reflectance.Crossref | GoogleScholarGoogle Scholar |
Gu LH, Baldocchi D, Verma SB, Black TA, Vesala T, Falge EM, Dowty PR (2002) Advantages of diffuse radiation for terrestrial ecosystem productivity. Journal of Geophysical Research, D, Atmospheres 107, 4050
| Advantages of diffuse radiation for terrestrial ecosystem productivity.Crossref | GoogleScholarGoogle Scholar |
Guo Y, Ma YT, Zhan ZG, Li BG, Dingkuhn M, Luquet D, De Reffye P (2006) Parameter optimization and field validation of the functional-structural model GREENLAB for maize. Annals of Botany 97, 217–230.
| Parameter optimization and field validation of the functional-structural model GREENLAB for maize.Crossref | GoogleScholarGoogle Scholar |
Halton JH (1970) A retrospective and prospective survey of the Monte Carlo method. SIAM Review 12, 1–63.
Harrison SA, Ashley H (1980) Heritability of canopy-apparent photosynthesis and its relationship to seed yield in soybeans. Crop Science 21, 222
Hirabayashi S, Kroll CN, Nowak DJ (2011) Component-based development and sensitivity analyses of an air pollutant dry deposition model. Environmental Modelling & Software 26, 804–816.
| Component-based development and sensitivity analyses of an air pollutant dry deposition model.Crossref | GoogleScholarGoogle Scholar |
Humphries SW, Long SP (1995) WIMOVAC – a software package for modeling the dynamics of plant leaf and canopy photosynthesis. Computer Applications in the Biosciences 11, 361–371.
Johnson IR, Thornley JHM (1984) A model of instantaneous and daily canopy photosynthesis. Journal of Theoretical Biology 107, 531–545.
| A model of instantaneous and daily canopy photosynthesis.Crossref | GoogleScholarGoogle Scholar |
Kotchenova SY, Song XD, Shabanova NV, Potter CS, Knyazikhin Y, Myneni RB (2004) Lidar remote sensing for modeling gross primary production of deciduous forests. Remote Sensing of Environment 92, 158–172.
| Lidar remote sensing for modeling gross primary production of deciduous forests.Crossref | GoogleScholarGoogle Scholar |
Kull O, Jarvis PG (1995) The role of nitrogen in a simple scheme to scale-up photosynthesis from leaf to canopy. Plant, Cell & Environment 18, 1174–1182.
| The role of nitrogen in a simple scheme to scale-up photosynthesis from leaf to canopy.Crossref | GoogleScholarGoogle Scholar |
Lao C, Yan T, Li B (2005) Three dimensional canopy radiation transfer model based on Monte Carlo ray tracing. PhD thesis, China Agricultural University.
Ledent JF (1977) Calculation of extinction coefficient of incident direct solar-radiation in a plant canopy. Oecologia Plantarum 12, 291–300.
Lemon E, Stewart DW, Shawcroft RW (1971) The sun’s work in a cornfield. Science 174, 371–378.
| The sun’s work in a cornfield.Crossref | GoogleScholarGoogle Scholar | 1:STN:280:DC%2BC3cvhtFajsw%3D%3D&md5=0f198c7fb34665e9d09a32224b84b7bfCAS |
Lloyd J, Grace J, Miranda AC, Meir P, Wong SC, Miranda BS, Wright IR, Gash JHC, Mcintyre J (1995) A simple calibrated model of amazon rain-forest productivity based on leaf biochemical-properties. Plant, Cell & Environment 18, 1129–1145.
| A simple calibrated model of amazon rain-forest productivity based on leaf biochemical-properties.Crossref | GoogleScholarGoogle Scholar |
Long SP, Ainsworth EA, Rogers A, Ort DR (2004) Rising atmospheric carbon dioxide: plants face the future. Annual Review of Plant Biology 55, 591–628.
| Rising atmospheric carbon dioxide: plants face the future.Crossref | GoogleScholarGoogle Scholar | 1:CAS:528:DC%2BD2cXlvFeisb8%3D&md5=90372ae3a3ad173142e8eb82fdb1595aCAS |
Long SP, Ainsworth EA, Leakey ADB, Nosberger J, Ort DR (2006a) Food for thought: lower-than-expected crop yield stimulation with rising CO2 concentrations. Science 312, 1918–1921.
| Food for thought: lower-than-expected crop yield stimulation with rising CO2 concentrations.Crossref | GoogleScholarGoogle Scholar | 1:CAS:528:DC%2BD28XmsVagsr4%3D&md5=424f86ef2c78749f29c58152a27bf853CAS |
Long SP, Zhu XG, Naidu SL, Ort DR (2006b) Can improvement in photosynthesis increase crop yields? Plant, Cell & Environment 29, 315–330.
| Can improvement in photosynthesis increase crop yields?Crossref | GoogleScholarGoogle Scholar | 1:CAS:528:DC%2BD28Xktlyltrw%3D&md5=7cc6e6da58d9c9c07e23bb59390b59bbCAS |
Miguez FE, Zhu XG, Humphries S, Bollero GA, Long SP (2009) A semimechanistic model predicting the growth and production of the bioenergy crop Miscanthus × giganteus: description, parameterization and validation. GCB Bioenergy 1, 282–296.
| A semimechanistic model predicting the growth and production of the bioenergy crop Miscanthus × giganteus: description, parameterization and validation.Crossref | GoogleScholarGoogle Scholar |
Mo XG, Liu SX (2001) Simulating evapotranspiration and photosynthesis of winter wheat over the growing season. Agricultural and Forest Meteorology 109, 203–222.
| Simulating evapotranspiration and photosynthesis of winter wheat over the growing season.Crossref | GoogleScholarGoogle Scholar |
Mohanty CR, Gangopadhyay S (1982) Variation of leaf angle and incidence of rice blast disease. Journal of Agricultural Science 98, 225–227.
| Variation of leaf angle and incidence of rice blast disease.Crossref | GoogleScholarGoogle Scholar |
Monsi M, Saeki T (2005) On the factor light in plant communities and its importance for matter production. Annals of Botany 95, 549–567.
| On the factor light in plant communities and its importance for matter production.Crossref | GoogleScholarGoogle Scholar |
Norman JM (1979) Modeling the complete crop canopy. In ‘Modification of the aerial environment of plants’. (Eds BJ Barfield, JF Gerber) pp. 249–280. (American Society Agricultural Engineers: St. Joseph, MI)
Norman JM 1980. Interfacing leaf and canopy irradiance interception models. In ‘Predicting photosynthesis for ecosystem models’. pp. 49–67. (CRC Press: Boca Raton, FL)
Ort DR, Zhu XG, Melis A (2011) Optimizing antenna size to maximize photosynthetic efficiency. Plant Physiology 155, 79–85.
| Optimizing antenna size to maximize photosynthetic efficiency.Crossref | GoogleScholarGoogle Scholar | 1:CAS:528:DC%2BC3MXksFagsLg%3D&md5=8201498fa73c08cd12e47a0a8c303704CAS |
Parry M, Canziani O, Palutikof J, Van der Linden P, Hanson C (2007) ‘Climate change 2007: impacts, adaptation and vulnerability. Contribution of working group II to the fourth assessment report of the intergovernmental panel on climate change.’ (Cambridge University Press: Cambridge)
Parry MAJ, Reynolds M, Salvucci ME, Raines C, Andralojc PJ, Zhu XG, Price GD, Condon AG, Furbank RT (2011) Raising yield potential of wheat. II. Increasing photosynthetic capacity and efficiency. Journal of Experimental Botany 62, 453–467.
| Raising yield potential of wheat. II. Increasing photosynthetic capacity and efficiency.Crossref | GoogleScholarGoogle Scholar | 1:CAS:528:DC%2BC3cXhsFyrsbrO&md5=df4842d655dde29d4fc2f3b3f7ed0076CAS |
Pearcy RW, Yang WM (1996) A three-dimensional crown architecture model for assessment of light capture and carbon gain by understory plants. Oecologia 108, 1–12.
| A three-dimensional crown architecture model for assessment of light capture and carbon gain by understory plants.Crossref | GoogleScholarGoogle Scholar |
Pearcy RW, Yang W (1998) The functional morphology of light capture and carbon gain in the redwood forest understorey plant Adenocaulon bicolor Hook. Functional Ecology 12, 543–552.
| The functional morphology of light capture and carbon gain in the redwood forest understorey plant Adenocaulon bicolor Hook.Crossref | GoogleScholarGoogle Scholar |
Pearcy RW, Valladares F, Wright SJ, de Paulis EL (2004) A functional analysis of the crown architecture of tropical forest Psychotria species: do species vary in light capture efficiency and consequently in carbon gain and growth? Oecologia 139, 163–177.
| A functional analysis of the crown architecture of tropical forest Psychotria species: do species vary in light capture efficiency and consequently in carbon gain and growth?Crossref | GoogleScholarGoogle Scholar |
Peng J, Richards DE, Hartley NM, Murphy GP, Devos KM, Flintham JE, Beales J, Fish LJ, Worland AJ, Pelica F, Sudhakar D, Christou P, Snape JW, Gale MD, Harberd NP (1999) ‘Green revolution’ genes encode mutant gibberellin response modulators. Nature 400, 256–261.
| ‘Green revolution’ genes encode mutant gibberellin response modulators.Crossref | GoogleScholarGoogle Scholar | 1:CAS:528:DyaK1MXkvFWltbg%3D&md5=1ade383520ef988d4d5608500506b238CAS |
Peng SB, Khush GS, Virk P, Tang QY, Zou YB (2008) Progress in ideotype breeding to increase rice yield potential. Field Crops Research 108, 32–38.
| Progress in ideotype breeding to increase rice yield potential.Crossref | GoogleScholarGoogle Scholar |
Reicosky DC, Peters DB (1977) A portable chamber for rapid evapotranspiration measurements on field plots. Agronomy Journal 69, 729–732.
Reynolds JF, Chen JL, Harley PC, Hilbert DW, Dougherty RL, Tenhunen JD (1992) Modeling the effects of elevated CO2 on plants – extrapolating leaf response to a canopy. Agricultural and Forest Meteorology 61, 69–94.
| Modeling the effects of elevated CO2 on plants – extrapolating leaf response to a canopy.Crossref | GoogleScholarGoogle Scholar |
Roderick ML, Farquhar GD, Berry SL, Noble IR (2001) On the direct effect of clouds and atmospheric particles on the productivity and structure of vegetation. Oecologia 129, 21–30.
| On the direct effect of clouds and atmospheric particles on the productivity and structure of vegetation.Crossref | GoogleScholarGoogle Scholar |
Running SW, Coughlan JC (1988) A general model of forest ecosystem processes for regional applications. I. Hydrological balance, canopy gas exchange and primary production processes. Ecological Modelling 42, 125–154.
| A general model of forest ecosystem processes for regional applications. I. Hydrological balance, canopy gas exchange and primary production processes.Crossref | GoogleScholarGoogle Scholar | 1:CAS:528:DyaL1cXlslGrsb0%3D&md5=f19cff64653c6d8811fb37fd5c4f7efcCAS |
Sellers PJ, Berry JA, Collatz GJ, Field CB, Hall FG (1992) Canopy reflectance, photosynthesis, and transpiration. 3. A reanalysis using improved leaf models and a new canopy integration scheme. Remote Sensing of Environment 42, 187–216.
| Canopy reflectance, photosynthesis, and transpiration. 3. A reanalysis using improved leaf models and a new canopy integration scheme.Crossref | GoogleScholarGoogle Scholar |
Serbin SP, Dillaway DN, Kruger EL, Townsend PA (2012) Leaf optical properties reflect variation in photosynthetic metabolism and its sensitivity to temperature. Journal of Experimental Botany 63, 489–502.
| Leaf optical properties reflect variation in photosynthetic metabolism and its sensitivity to temperature.Crossref | GoogleScholarGoogle Scholar | 1:CAS:528:DC%2BC3MXhs1yms7%2FI&md5=6984fb395a16c15409910a649694805cCAS |
Sinclair TR, Murphy CE, Knoerr KR (1976) Development and evaluation of simplified models for simulating canopy photosynthesis and transpiration. Journal of Applied Ecology 13, 813–829.
| Development and evaluation of simplified models for simulating canopy photosynthesis and transpiration.Crossref | GoogleScholarGoogle Scholar |
Steduto P, Cetinkoku O, Albrizio R, Kanber R (2002) Automated closed-system canopy-chamber for continuous field-crop monitoring of CO2 and H2O fluxes. Agricultural and Forest Meteorology 111, 171–186.
| Automated closed-system canopy-chamber for continuous field-crop monitoring of CO2 and H2O fluxes.Crossref | GoogleScholarGoogle Scholar |
Thornley JHM, Johnson IR (1990) ‘Plant and crop modelling – a mathematical approach to plant and crop physiology.’ (The Blackburn Press: Caldwell, NJ)
Tilman D, Balzer C, Hill J, Befort BL (2011) Global food demand and the sustainable intensification of agriculture. Proceedings of the National Academy of Sciences of the United States of America 108, 20 260–20 264.
| Global food demand and the sustainable intensification of agriculture.Crossref | GoogleScholarGoogle Scholar | 1:CAS:528:DC%2BC3MXhs1yqsbnM&md5=fa8058c8e11f81f177118d818c9d21f7CAS |
Torrance K, Sparrow EM (1967) Theory for off-specular reflection from roughened surfaces. Journal of the Optical Society of America 57, 1105–1114.
| Theory for off-specular reflection from roughened surfaces.Crossref | GoogleScholarGoogle Scholar |
Tucker CJ, Garratt MW (1977) Leaf optical system modeled as a stochastic-process. Applied Optics 16, 635–642.
| Leaf optical system modeled as a stochastic-process.Crossref | GoogleScholarGoogle Scholar | 1:CAS:528:DyaE2sXhtFOrsr0%3D&md5=bda3747ce9eb3332c21962550e4811bdCAS |
Tuzet A, Perrier A, Leuning R (2003) A coupled model of stomatal conductance, photosynthesis and transpiration. Plant, Cell & Environment 26, 1097–1116.
| A coupled model of stomatal conductance, photosynthesis and transpiration.Crossref | GoogleScholarGoogle Scholar |
Wang YP, Leuning R (1998) A two-leaf model for canopy conductance, photosynthesis and partitioning of available energy I: model description and comparison with a multi-layered model. Agricultural and Forest Meteorology 91, 89–111.
| A two-leaf model for canopy conductance, photosynthesis and partitioning of available energy I: model description and comparison with a multi-layered model.Crossref | GoogleScholarGoogle Scholar |
Wang YH, Li JY (2008) Molecular basis of plant architecture. Annual Review of Plant Biology 59, 253–279.
| Molecular basis of plant architecture.Crossref | GoogleScholarGoogle Scholar | 1:CAS:528:DC%2BD1cXntFaqsLk%3D&md5=8ea08c18125ca3f8b6d6c80110b720d3CAS |
Watanabe T, Hanan JS, Room PM, Hasegawa T, Nakagawa H, Takahashi W (2005) Rice morphogenesis and plant architecture: measurement, specification and the reconstruction of structural development by 3D architectural modelling. Annals of Botany 95, 1131–1143.
| Rice morphogenesis and plant architecture: measurement, specification and the reconstruction of structural development by 3D architectural modelling.Crossref | GoogleScholarGoogle Scholar |
Wells R, Meredith WR, Williford JR (1986) Canopy photosynthesis and its relationship to plant productivity in near-isogenic cotton lines differing in leaf morphology. Plant Physiology 82, 635–640.
| Canopy photosynthesis and its relationship to plant productivity in near-isogenic cotton lines differing in leaf morphology.Crossref | GoogleScholarGoogle Scholar | 1:STN:280:DC%2BC3cnhslamsg%3D%3D&md5=df53d937006c3f7f756cb729dd44a66cCAS |
Yang Y, Kim SH, Timlin DJ, Fleisher DH, Quebedeaux B, Reddy VR (2009) Simulating canopy transpiration and photosynthesis of corn plants under contrasting water regimes using a coupled model. Transactions of the ASABE 52, 1011–1024.
Zelitch I (1982) The close relationship between net photosynthesis and crop yield. Bioscience 32, 796–802.
| The close relationship between net photosynthesis and crop yield.Crossref | GoogleScholarGoogle Scholar |
Zheng BY, Shi LJ, Ma YT, Deng QY, Li BG, Guo Y (2008) Comparison of architecture among different cultivars of hybrid rice using a spatial light model based on 3D digitising. Functional Plant Biology 35, 900–910.
| Comparison of architecture among different cultivars of hybrid rice using a spatial light model based on 3D digitising.Crossref | GoogleScholarGoogle Scholar |
Zhu XG, Portis AR, Long SP (2004a) Would transformation of C3 crop plants with foreign Rubisco increase productivity? A computational analysis extrapolating from kinetic properties to canopy photosynthesis. Plant, Cell & Environment 27, 155–165.
| Would transformation of C3 crop plants with foreign Rubisco increase productivity? A computational analysis extrapolating from kinetic properties to canopy photosynthesis.Crossref | GoogleScholarGoogle Scholar | 1:CAS:528:DC%2BD2cXisFKru7c%3D&md5=928e36c3974ce00ce919d2ccc4c0b554CAS |
Zhu XG, Ort DR, Whitmarsh J, Long SP (2004b) The slow reversibility of photosystem II thermal energy dissipation on transfer from high to low light may cause large losses in carbon gain by crop canopies: a theoretical analysis. Journal of Experimental Botany 55, 1167–1175.
| The slow reversibility of photosystem II thermal energy dissipation on transfer from high to low light may cause large losses in carbon gain by crop canopies: a theoretical analysis.Crossref | GoogleScholarGoogle Scholar | 1:CAS:528:DC%2BD2cXksVagsrk%3D&md5=c2ca69dee008042576459049a38cf217CAS |
Zhu XG, Long SP, Ort DR (2010) Improving photosynthetic efficiency for greater yield. Annual Review of Plant Biology 61, 235–261.
| Improving photosynthetic efficiency for greater yield.Crossref | GoogleScholarGoogle Scholar | 1:CAS:528:DC%2BC3cXnslSjsL8%3D&md5=8cab349683dc69218d0c6c170854474dCAS |
Zhu X-G, Song Q, Ort DR (2012) Elements of a dynamic systems model of canopy photosynthesis. Current Opinion in Plant Biology 15, 237–244.
| Elements of a dynamic systems model of canopy photosynthesis.Crossref | GoogleScholarGoogle Scholar | 1:CAS:528:DC%2BC38XnvVSit7w%3D&md5=906e0ee80f437f79a3c8d87a1fd0ab38CAS |
Appendix 1. Equations of leaf photosynthesis models


Appendix 2. Equations used in the calculation of macroclimates


Appendix 3. Definition and initial value of symbols
Values in parenthesis are those used in simulations, unless stated otherwise

|
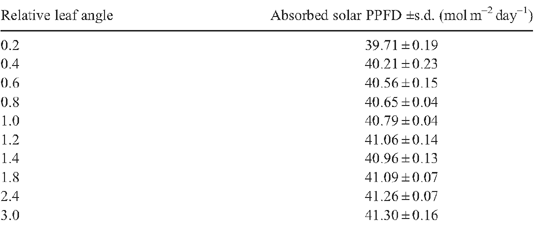
Appendix 4. Solar energy absorption for rice canopies with different canopy architectural features
|
|

|


