Azimuthal AVO signatures of fractured poroelastic sandstone layers
Zhiqi Guo 1 4 Xiang-Yang Li 2 31 College of Geo-Exploration Science and Technology, Jilin University, 938 Xi Minzhu Street, Changchun 130021, China.
2 State Key Laboratory of Petroleum Resource and Prospecting, China University of Petroleum (Beijing), Beijing 102249, China.
3 CNPC Key Laboratory of Geophysical Prospecting, China University of Petroleum (Beijing), Beijing 102249, China.
4 Corresponding author. Email: zhiqiguo@aliyun.com
Exploration Geophysics 48(1) 56-66 https://doi.org/10.1071/EG15050
Submitted: 2 June 2015 Accepted: 25 September 2015 Published: 27 October 2015
Abstract
Azimuthal P-wave amplitude variation with offset (AVO) offers a method for the characterisation of a naturally fractured system in a reservoir. This information is important for the analysis of fluid flow during production of, for example, oil, petroleum and natural gas. This paper provides a modelling scheme by incorporating the squirt-flow model for the prediction of velocity dispersion and attenuation with azimuthal reflectivity method for the calculation of frequency-dependent seismic responses. Azimuthal AVO responses from a fractured poroelastic sandstone layer encased within shale are investigated based on the proposed method. Azimuthal reflections are a combination of the dynamic information including the contrast in anisotropic properties, anisotropic propagation and attenuation within the layer, as well as tuning and interferences. Modelling results indicate that seismic responses from the top of the sandstone layer are dominated by reflection coefficients, and show azimuthal variations at far offset which is consistent with conventional azimuthal AVO theory. Reflections from the base, however, demonstrate complex azimuthal variations due to anisotropic propagation and attenuation of transmission waves within the layer. Tuning and interferences further complicate the azimuthal AVO responses for thinner layer thickness. The AVO responses of top reflections show no azimuthal variations for lower fluid mobility, while those of base reflections show visible and stable azimuthal variations even at near and moderate offsets for different fluid mobility. Results also reveal that it would be practical to investigate wavetrains reflected from the fractured layers that are regarded as integrated units, especially for thinner layers where reflections from the top and base are indistinguishable. In addition, near-offset stacked amplitudes of the reflected wavetrains show detectable azimuthal variations, which may offer an initial look at fracture orientations before AVO analysis.
Key words: attenuation, azimuthal AVO, dispersion, fluid mobility, fracture, reflectivity.
Introduction
The investigation on azimuthal seismic anisotropy is significant for the characterisation of fractured reservoirs. Azimuthal amplitude variation with offset (AVO) provides insights into properties of a fractured reservoir such as fracture orientation and fluid saturations. Rüger and Tsvankin (1995, 1997) proposed a P-wave azimuthal AVO algorithm for fracture detection. Rüger (1998) extended these works by linearising PP-wave reflection coefficients in terms of squared trigonometric functions of azimuth and incidence angle under the approximation of the weak contrast interface separating two weakly anisotropic media. Vavryčuk and Pšenčík (1998) conducted similar work by applying the first-order perturbation theory for the linearisation of formulas. For applications, Pérez et al. (1999) investigated the method of using azimuthal variations of P-wave AVO for the detection of fracture orientation. Hall and Kendall (2003) analysed P-wave amplitude variation with offset and azimuth in a 3D ocean-bottom seismic (OBC) dataset for the characterisation of natural fractures. Landrø and Tsvankin (2007) investigated the possibility to characterise fractures using azimuthal critical-angle reflections. Recently, Far et al. (2013a) incorporated Monte Carlo simulation for the consideration of uncertainty in azimuthal AVO analysis. Far et al. (2013b) extended the work to asymmetric fractures. Furthermore, Far et al. (2014) applied the method to invert for the effective fracture parameters for the Marcellus Shale that represents monoclinic symmetry.
Most of the previous studies on azimuthal AVO responses have been based on the model of a reflecting interface that separates an overburden layer and a fractured reservoir. However, Sayers and Rickett (1997) observed that reflections from the base of a fractured layer at directions parallel and perpendicular to the fracture strike show greater azimuthal variations than reflections from the top interface, and concluded that anisotropic propagation should not be neglected in azimuthal AVO modelling and analysis. After that, Schoenberg et al. (1999) extended the work of Schoenberg and Protázio (1992) to incorporate the effects of propagation and tuning in azimuthal AVO modelling for anisotropic reservoirs. Meanwhile, MacBeth (1999) investigated azimuthal P-wave attenuation induced by fluid-flow and associated behaviour of base reflections. For the description of velocity dispersion and attenuation, Chapman (2003) and Chapman et al. (2003) proposed a multi-scale equant porosity model based on the squirt-flow mechanism. Chapman et al. (2005, 2006) investigated frequency-dependent AVO responses for fluid detection. In addition, Ekanem et al. (2015) investigated azimuthal seismic attenuation associated with fluid mobility predicted by the poroelastic model for the detection of fracture orientations.
The motivation of this work is to provide an azimuthal AVO modelling method for poroelastic fractured reservoirs. First, effective medium theory based on the squirt-flow mechanism is used for the prediction of velocity dispersion and attenuation in the fractured sandstone. Then, the squirt-flow model is incorporated into the azimuthal reflectivity method for the calculation of frequency-dependent seismic responses. Finally, variations of AVO with azimuth from the top and base interfaces of the fractured unit, and those from the integrated unit, are investigated for the detection of fracture orientations.
Model and parameter for poroelastic sandstone reservoir
Rock physics model for fractured medium
In this study, the model developed by Chapman (2003) and Chapman et al. (2003) is used for the calculation of frequency-dependent stiffnesses:

where λ and μ are Lame parameters, ω is frequency, τ is time scale, φ is porosity, ε is fracture density, and κf is fluid bulk modulus.
The anisotropic elastic tensor Cijkl is calculated by considering the perturbation Cijkl1 associated with fractures, cracks and pores in the isotropic elastic tensor Cijkliso of the matrix:

We denote  and
and  as the reference Lame parameters at a specified porosity φ given by


where ρ is density, VP and VS are P- and S-wave velocities at a reference frequency ω0


and κf0, ε0, and τ0 are fluid bulk modulus, fracture density, and time scale at ω0. Accordingly, the isotropic tensor can be defined as:

where Λ and Mare frequency-independent Lame parameters. Then, for arbitrary frequency, time scale, and fluid bulk modulus, the anisotropic elastic tensor describing fluid-sensitive dispersion and attenuation in rocks can be defined as:

The predicted anisotropic medium represents transverse isotropy with a vertical axis of symmetry (VTI). Precise descriptions of the above rock physics model were given by Chapman et al. (2003).
Parameter for fluid mobility
Batzle et al. (2006) investigated the impact of permeability κ and viscosity η on velocity dispersion under controlled petroleum parameters in their laboratory experiments. They concluded that elastic properties of media can be significantly influenced by fluid mobility M defined as

Fluid mobility can be characterised by relaxation time that controls the time for pore fluids to reach pressure equilibrium. Two kinds of relaxation time involved in the effective medium theory are τm for standard microstructural flow and τf in the presence of fractures, with the relationship given by

where αf is fracture radius and αc is grain size. In this work, we assume the fracture radius is 0.5 m and the grain size is 200 μm.
Because relaxation time is proportional to the ratio of fluid viscosity η to permeability κ,

fluid mobility M is inversely proportional to relaxation time τf or τm. The decrease in τf or τm means less time for pore fluids to reach pressure equilibrium, and thus corresponds to higher fluid mobility.
In addition, dispersion and attenuation are controlled by the characteristic frequency f that is defined by the relaxation time τm:

Rock physics modelling
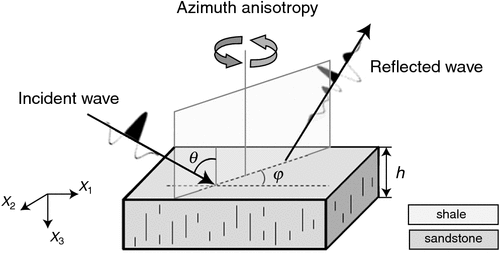
Figure 1 shows a reflector model where a sandstone layer with vertically aligned fractures is embedded in shale. The rock physics theory in Equations 1–8 describes dispersion and attenuation of the fractured sandstone by frequency-dependent and complex-valued anisotropic stiffnesses. For calculations, we assume that P- and S-wave velocities for the unfractured and water-saturated sandstone are 3400 m/s and 2000 m/s, respectively. Density is 2300 kg/m3 and 2200 kg/m3 for water and gas saturation, respectively. Matrix porosity is assumed to be 0.1. The fractures have a density of 0.05 and radius 1 m.
|
The property predicted by Equations 1–8 represents VTI anisotropy. However, the vertically fractured reflector in Figure 1 represents transverse isotropy with a horizontal axis of symmetry (HTI) for 0° azimuth, and shows monoclinic anisotropy for an arbitrary azimuth. Therefore, using the Bond matrix, we transform the predicted VTI anisotropy to the HTI anisotropy by rotating 90° around the x2 axis, and further to a monoclinic medium by rotating an azimuth around the x3 axis. As an example, the matrix (13) shows a calculated result at the 45° azimuth:

where imaginary parts of the anisotropic stiffnesses represent attenuation. The calculation is implemented at 40 Hz frequency.
Because permeability in real reservoirs can span several orders of magnitude, fluid mobility K or relaxation time τm may also vary significantly, leading to velocity dispersion and attenuation at seismic frequencies, as shown in Figure 2 and Figure 3. Equations 1–8 illustrate the philosophy and general workflow of the rock physics model, while detailed descriptions for the calculation are given by Chapman et al. (2003).
In Figure 2a, we can see that P-wave velocity V11 that is perpendicular to the fracture strike keeps constant at ~3.17 km/s for the case of τm = 4 × 10⁻³ s (high frequency elastic limit), and drops to a constant ~2.84 km/s for the case of τm = 4 × 10⁻⁹ s (low frequency Gassmann elastic limit). In contrast, V11 shows dispersion at seismic frequencies for the case of τm = 4 × 10⁻⁶ s. In Figure 2b, P-wave velocity V33 that is within the fracture plane shows similar variations as V11, but the magnitude of corresponding values shows little variation with τm, which reveals that P-wave propagating in fracture planes is less affected by fluid mobility. In Figure 3, attenuation occurs with dispersion for the case of τm = 4 × 10⁻⁶ s. Attenuation along the direction normal to fracture planes (1/Q11) is much stronger than that in the direction parallel to fracture planes (1/Q33).
In Figure 1, anisotropic velocity and attenuation of transmission waves propagating in the fractured sandstone for varied azimuth and incidence (or polar) angle should be considered. In Figure 4a, P-wave velocity VP along the direction of the fracture strike represents higher values than that in the direction normal to the fracture strike, and shows less variation with the polar angle. In contrast, as the propagation direction derivates from the fracture strike, VP shows more noticeable dependence on polar angle and decreases significantly as the propagation tends towards the direction normal to the fractures. Accordingly, in Figure 4b, the P-wave shows less attenuation in the direction of the fracture strike and suffers more attenuation normal to the fracture strike.

|
Azimuthal AVO modelling for anisotropic layered model
As shown by the calculated matrix (Equation 13), azimuthal elasticity of the fractured reservoir in Figure 1 represents monoclinic anisotropy. Therefore, appropriate azimuthal AVO modelling for such a model should be able to cope with monoclinic stiffnesses. Accordingly, Schoenberg and Protázio (1992) generalised the Zeoppritz equations to an anisotropic layered model by introducing impedance matrices for the calculation of reflection and transmission coefficients. Schoenberg et al. (1999) further applied this method for the investigation of azimuthal reflections from fractured reservoirs. The method considers a general monoclinic medium that has 13 elastic constants forming the stiffness matrix,

which can be used for azimuthal descriptions of an equivalent HTI or orthorhombic medium. In this case, anisotropic media have an up-down symmetry, and the seismic reflection interface can be regarded as the plane of mirror symmetry.
The method computes frequency-dependent reflection and transmission coefficients matrices R and T that have the form

where the first subscript denotes the type of reflected or transmitted wave and the second subscript denotes the type of incident wave. Subscript P, S, and T represent quasi-P, quasi-SV, and quasi-SH wave, respectively.
Assume a harmonic plane wave of unit amplitude in an anisotropic medium has the form

where the subscripts 1, 2, and 3 denote components of corresponding vectors. ʋ = (ʋ1, ʋ2, ʋ3) is the vibration vector of particle velocity, s = (s1, s2, s3) is slowness vector, and e = (e1, e2, e3) denotes eigenvector of the slowness vector.
The three-dimensional Christoffel equation for the harmonic plane wave in Equation 16 in a monoclinic medium is

where density of media ρ is regarded as the eigenvalue of the eigenvector e, I is unit matrix, and the matrix Γ(s) has the form

with

and two horizontal slownesses s1 and s2 are given by

where θ is the incidence angle, φ is the azimuth, and α is the P-wave velocity of the incidence medium.
For the existence of the non-zero solution of the vector e = (e1, e2, e3) in Equation 17, we have

Substituting Equation 18 into Equation 21 gives a bicubic equation on vertical slowness s3, corresponding to squared vertical slownesses s3P2, s3S2, and s3T2, satisfying

where the subscripts denotes waves of the three modes.
Substituting the solved s3P, s3S, s3T, and horizontal slownesses defined by Equation 20 into Equation 17 gives eigenvectors eP = (eP1, eP1, eP1), eS = (eS1, eS1, eS1) and eT = (eT1, eT1, eT1) which describe vibration directions of particles for each mode of waves. A special case is s3S = s3T which generates two identical eigenvalue vectors e1 and e2. In this case, eigenvectors eS and eT for quasi-SV and quasi-SH waves are the linear combinations of e1 and e2, satisfying

which guarantee orthogonality between quasi-SH and quasi-P waves, and between quasi-SH and quasi-SV waves.
Then, the impedance matrix can be constructed from the derived slownesses and eigenvectors:


If denoting the properties of the fractured layer by subscript ℓ, the impedance matrices Xℓ and Yℓ for the layer can be calculated following the same way described above. Thus, reflection and coefficient matrices given by Equation 15 are solved by


where


with diagonal cosine and sine matrices C and S depending on ωh given by


The incident P-wave generates reflected PP and model-converted PSV and PSH waves. Accordingly, Equation 26 gives reflection coefficients RPQ for each frequency, where Q = P, SV, and SH for different wave modes. Furthermore, seismograms rPQ can be obtained by multiplying wavelet spectrum F(ω) with frequency-dependent reflection coefficients RPQ (s1, s2; ω), followed by implying the inverse Fourier transform

Azimuthal AVO responses of the fractured layer
We integrate the squirt-flow rock physics model given by Chapman (2003) with the anisotropic modelling method developed by Schoenberg et al. (1999) for the calculation of azimuthal reflection coefficients and synthetic seismograms for the poroelastic fractured layer in Figure 1. This scheme is an extended work of Guo et al. (2015) where the authors investigated frequency-dependent AVO responses from fractured reservoirs at the direction normal to the fracture strike. As can be expected, for the seismic reflection model in Figure 1, azimuthal AVO responses are associated with fluid mobility in the layer, and thus include the contrast in impedance across interfaces, anisotropic propagation and attenuation within the layer and tuning and interferences.
Specifically, in this study, the azimuthal reflection coefficients matrix R is calculated by Equation 26, where matrix A and B in Equation 26 are given by Equations 28 and 29. In the computation of the matrix A and B, anisotropy stiffness cij (i, j = 1, 2, ..., 6) in Equations 24 and 25 are predicted by the rock physics model described in the section Model and parameter for poroelastic sandstone reservoir. Then, for the calculation of PP wave azimuthal reflection coefficients, RPP can be extracted from the matrix R as shown in Equation 15. Finally, the PP wave azimuthal seismogram rPP can be further computed from RPP by Equation 32.
Synthetic seismograms for layers with different fluid mobility
According to the classification on the sand reservoir given by Rutherford and Williams (1989), the type I sand has higher impedance than the surrounding layer, corresponding to positive reflection coefficients at normal incidence. The impedance of the type II sand is close to the surrounding rock which leads to weak reflection amplitudes. The type III sand has lower impedance than the surrounding rock, corresponding to negative reflection coefficients at normal incidence. Sayers and Rickett (1997) suggested that azimuthal AVO responses are sensitive to the presence of vertical fractures for the type I sand.
Thus, in Figure 1, we use the type I sand as the reflector model, and assume the surrounding shale has P- and S-wave velocities 3200 m/s and 1800 m/s, and a density of 2100 kg/m3, which are relatively lower than those of the sandstone. We first consider a 50-m-thick elastic sandstone layer with relaxation time τm = 4 × 10⁻³ s. Anisotropic stiffnesses of the sandstone are predicted by the squirt-flow model described in the section Model and parameter for poroelastic sandstone reservoir.
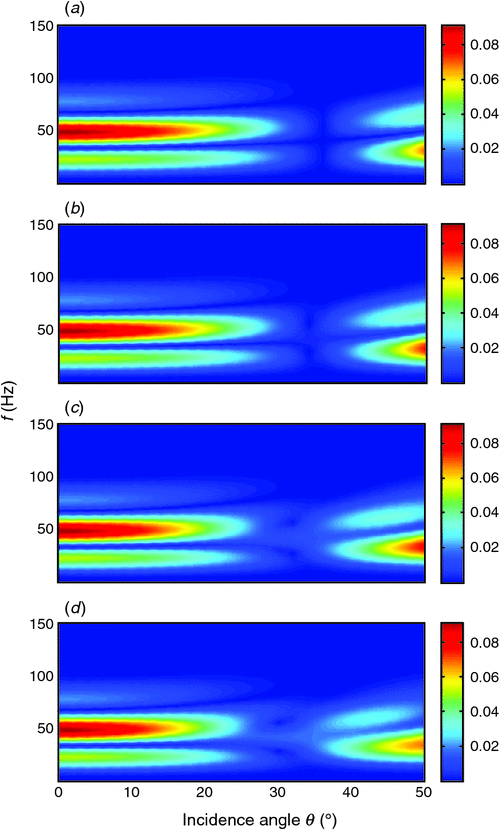
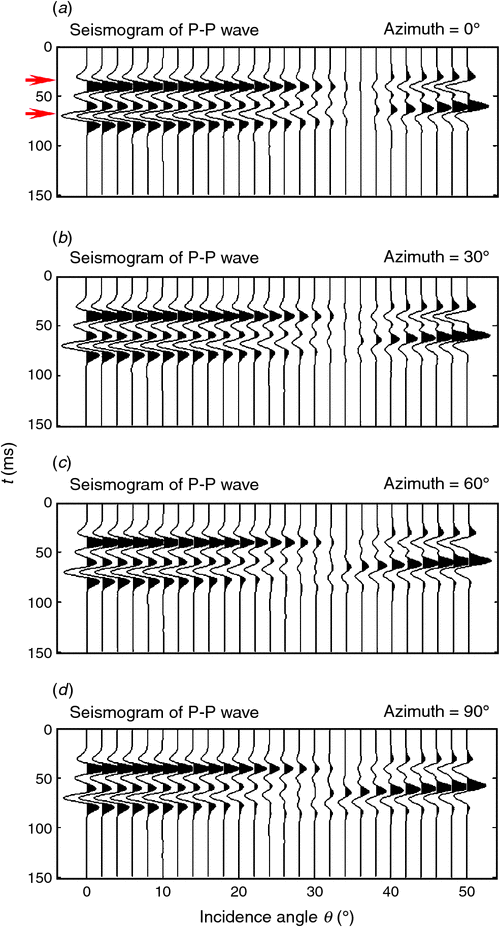
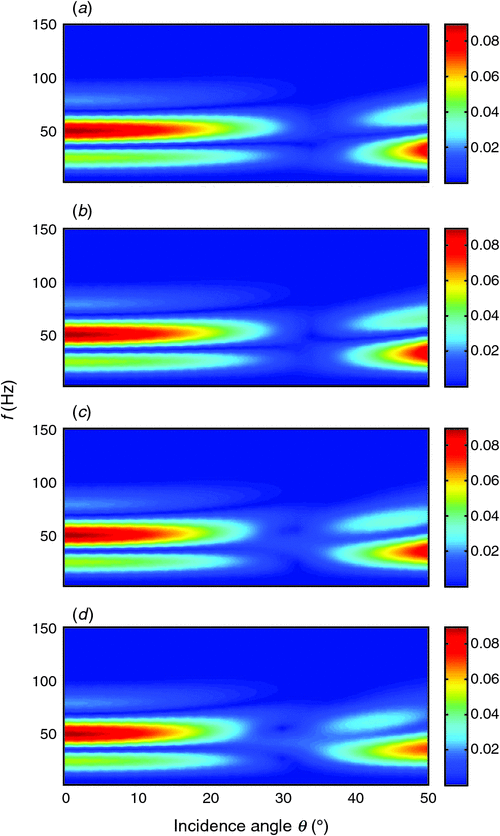
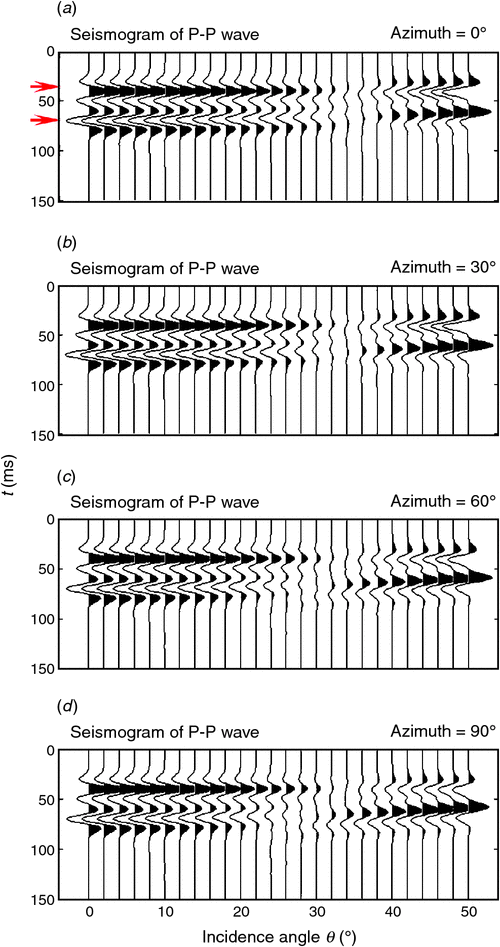
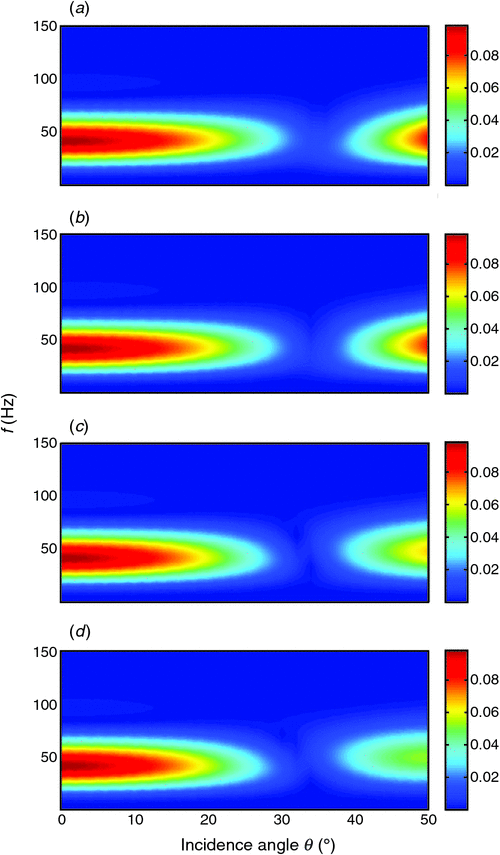
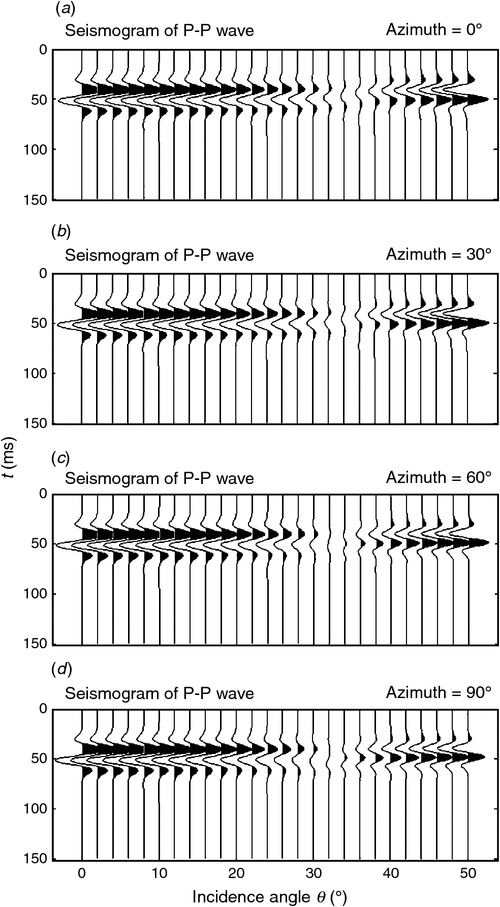
Figure 5 shows the azimuthal PP-wave reflection spectra F(ω)RPP(s1, s2; ω), and Figure 6 displays corresponding synthetic seismograms calculated by Equation 32. Seismic AVO responses at four azimuth angles are calculated. Two red arrows on the seismograms indicate positions of reflections from the top and base of the fractured layer in Figure 1.
|
|
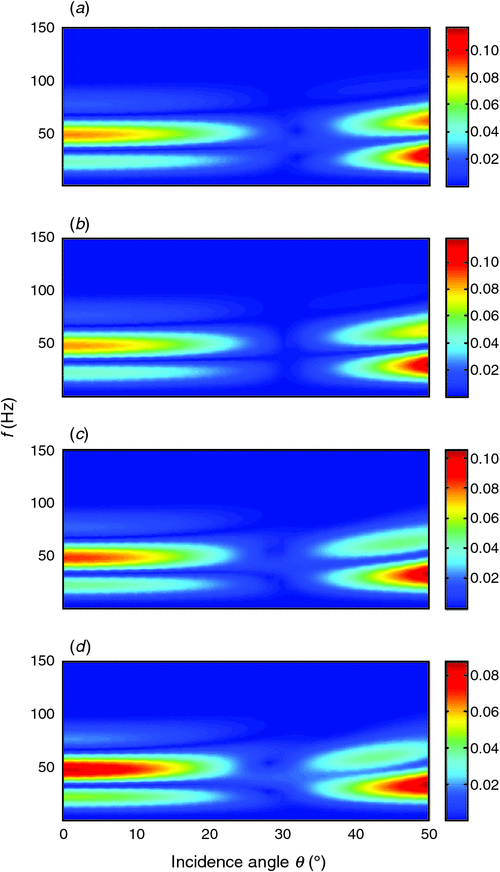
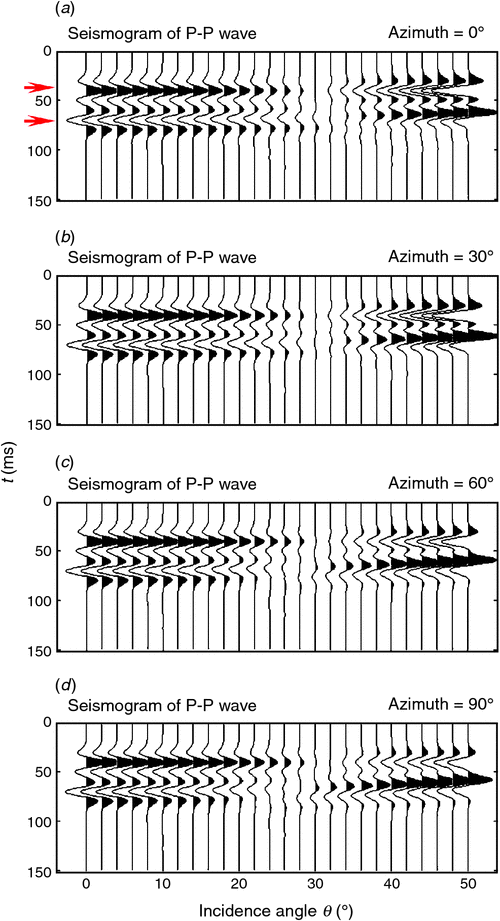
We also calculate azimuthal reflection spectra and corresponding synthetic seismograms for varied relaxation time τm for the fractured layer, and illustrate computed results in Figure 7 and Figure 8 for τm = 4 × 10⁻⁶ s, and in Figure 9 and Figure 10 for τm = 4 × 10⁻⁹ s. Other parameters are kept constant for these cases.
|
|
|
|
As shown in Figure 6, Figure 8, and Figure 10, reflections from the top and base of the layer are distinguishable, and represent phase reversal after an incidence angle of around 30°. Meanwhile, although reflections within the range below the 30° incidence angle show visible difference, more noticeable azimuthal variations in amplitudes and phases occurs for higher incidence angles. Next, we will examine the reflections in detail to illustrate the impact of anisotropic propagation and interferences on azimuthal AVO responses, and investigate the potential application of the characterisation of fractures using the observed azimuthal variations.
Reflections from the top and bottom of the layer
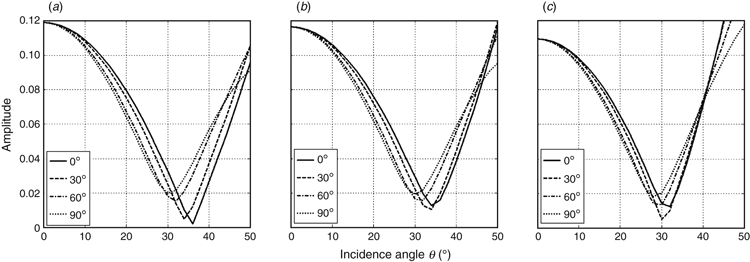
Figure 11a, b displays AVO curves picked from seismograms in Figure 6, corresponding to reflections from the top and base of the fractured layer, respectively. We can see that for the case of τm = 4 × 10⁻³ s, top reflections show very subtle azimuthal variation even for higher incidence angles. In contrast, however, base reflections show obvious azimuthal variation in AVO responses even below 35° incidence. AVO responses from the base show relatively complex patterns where the negative value of the amplitude increases to zero around incidence angle 35° and then decreases as the incidence angle increases. Absolute values of reflection amplitudes decrease as the azimuth increases from 0° to 90° at each individual incidence angle below 35°, and the opposite trends can be observed beyond the 35° incidence angle. Anisotropic propagation of the P-wave in the fractured sandstone layer is responsible for azimuthal reflections from the base of the layer. This provides an opportunity to characterise fracture orientations in the case that top reflections show no azimuthal variation.

|
Figure 12 and Figure 13 display AVO curves of the top and base reflections obtained from Figure 10 and Figure 12. For the case of τm = 4 × 10⁻⁶ s, top reflections in Figure 12a show visible azimuthal variations beyond 40° incidence, and for the case of τm = 4 × 10⁻⁹ s, azimuthal variations are noticeable beyond 30° incidence. Such azimuthal variations of top reflections show a decrease in absolute-valued amplitudes for higher incidence angles as the azimuth increases from 0° to 90°. In contrast, reflections from the base show noticeable and stable variations for the cases with different fluid mobility.

|

|
Integrated wavetrains reflected from fractured layer
The above section shows the variations of azimuthal AVO from the base of fracture orientations. For thinner layers, however, it may be impossible to distinguish the top reflection from the base reflection. In this situation, it would be practical to investigate the integrated wavetrains reflected from the fractured unit. Figure 14 illustrates azimuthal PP reflections represented by the root-mean-square amplitudes of the integrated wavetrains in Figure 6, Figure 8 and Figure 10 for the cases with different relaxation time τm.
In Figure 14, AVO responses of the reflected wavetrains for all the three cases of fluid mobility show noticeable azimuthal variations at each individual incidence angle. For each incidence angle below 30°, reflection amplitudes decrease as azimuth increases. For each incidence angle beyond 30°, reflection amplitudes increase as azimuth generally increases, except the case of τm = 4 × 10⁻⁹ s. By comparing the three cases, the variation in fluid mobility has little impact on azimuthal AVO responses below 30° incidence, while it alters AVO features beyond 30° for smaller τm (or higher fluid mobility).
According to Figure 14, Figure 15 illustrates azimuthal variations in PP-wave amplitudes stacked from 0° to 30° incidence angle. The magnitudes of the stacked amplitudes show the maximum azimuthal variations to be ~11.2% for τm = 4 × 10⁻³ s, 10.7% for τm = 4 × 10⁻⁶ s and 8.8% for τm = 4 × 10⁻⁹ s. Thus, the azimuthal variation in amplitudes stacked for near or moderate offset in terms of the integrated wavetrains may give an initial estimate on fracture orientations.
The case of different layer thickness
As the case for smaller layer thickness, Figures 16 and 17 illustrate azimuthal reflection spectra and synthetic seismograms of PP-wave for the case of a 20-m-thick fractured sandstone with relaxation time τm = 4 × 10⁻⁶ s. In the seismograms, we can see that smaller layer thickness makes it impossible to distinguish the base reflection from the top reflection. In Figure 18a, the picked AVO curves indicate that top reflections show visible azimuthal variations beyond 40° incidence. In Figure 18b, AVO responses represented by the root-mean-square amplitudes of the integrated wavetrains show obvious azimuthal variations at each incidence angle. Figure 18c shows that magnitude of amplitudes stacked from 0° to 30° incidence angle represents about maximum 7.3% azimuthal variations between 0° and 90° azimuth angle.
|
|
Discussions and conclusions
This study extends the work of Guo et al. (2015) to azimuthal AVO investigation for poroelastic fractured media. The modelling scheme incorporated the squirt-flow model into the anisotropic reflectivity method, which were both conducted in the frequency domain. Thus, the scheme appropriately considered dispersion and attenuation predicted by the poroelastic model in azimuthal AVO modelling. Moreover, the reflecting model was regarded as a layered unit which was more realistic than the conventional interface model. Hence, dynamic information of azimuthal reflections, including the contrast in properties across interfaces, anisotropic propagation and attenuation of waves within the fractured layer, as well as tuning and interferences, were both considered in the calculation.
Results indicated that AVO responses from the top of the fractured unit were dominated by reflection coefficients, showing azimuthal variations at far offset, consistent with conventional theory. However, AVO responses from the base showed complex azimuthal variations which could be related to anisotropic propagation and attenuation of transmission waves within the fractured layer and tuning and interferences for thinner layer thickness.
For the model in this study, the AVO of top reflections showed no azimuthal variations even at far offset for lower fluid mobility, while AVO of base reflections showed more noticeable and stronger azimuthal variations at near and moderate offsets for different fluid mobility. Results also revealed that it would be practical to investigate wavetrains reflected from the fractured layer that was regarded as an integrated unit, especially for thinner layer where reflections from the top and base were indistinguishable. In addition, near-offset stacked data for the integrated wavetrains showed detectable azimuthal variations, which could offer an initial look on fracture orientations before further sophisticated AVO analysis.
Finally, current results revealed that it might be too ambitious to quantify fluid flow of a poroelastic fractured reservoir using azimuthal variations of AVO responses. Nevertheless, further studied would investigate the effects of density and fluid saturation of fractures as well as layer thickness on azimuthal variations of AVO responses.
Acknowledgements
This work is supported by the National Natural Science Foundation of China under Grants 41404090 and U1262208. We thank two anonymous reviewers for their constructive suggestions for the improvement of the paper.
References
Batzle, M. L., Han, D. H., and Hofmann, R., 2006, Fluid mobility and frequency dependent seismic velocity – direct measurements: Geophysics, 71, N1–N9| Fluid mobility and frequency dependent seismic velocity – direct measurements:Crossref | GoogleScholarGoogle Scholar |
Chapman, M., 2003, Frequency dependent anisotropy due to meso-scale fractures in the presence of equant porosity: Geophysical Prospecting, 51, 369–379
| Frequency dependent anisotropy due to meso-scale fractures in the presence of equant porosity:Crossref | GoogleScholarGoogle Scholar |
Chapman, M., Maultzsch, S., Liu, E., and Li, X. Y., 2003, The effect of fluid saturation in an anisotropic multi-scale equant porosity model: Journal of Applied Geophysics, 54, 191–202
| The effect of fluid saturation in an anisotropic multi-scale equant porosity model:Crossref | GoogleScholarGoogle Scholar |
Chapman, M., Liu, E., and Li, X. Y., 2005, The influence of abnormally high reservoir attenuation on the AVO signature: The Leading Edge, 24, 1120–1125
| The influence of abnormally high reservoir attenuation on the AVO signature:Crossref | GoogleScholarGoogle Scholar |
Chapman, M., Liu, E., and Li, X. Y., 2006, The influence of fluid-sensitive dispersion and attenuation on AVO analysis: Geophysical Journal International, 167, 89–105
| The influence of fluid-sensitive dispersion and attenuation on AVO analysis:Crossref | GoogleScholarGoogle Scholar |
Ekanem, A. M., Li, X. Y., Chapman, M., and Main, I. G., 2015, Seismic attenuation in fractured porous media: insights from a hybrid numerical and analytical model: Journal of Geophysics and Engineering, 12, 210–219
| Seismic attenuation in fractured porous media: insights from a hybrid numerical and analytical model:Crossref | GoogleScholarGoogle Scholar |
Far, M. E., Sayers, C. M., Thomsen, L., Han, D., and Castagna, J. P., 2013a, Seismic characterization of naturally fractured reservoirs using amplitude versus offset and azimuth analysis: Geophysical Prospecting, 61, 427–447
| Seismic characterization of naturally fractured reservoirs using amplitude versus offset and azimuth analysis:Crossref | GoogleScholarGoogle Scholar |
Far, M. E., Thomsen, L., and Sayers, C. M., 2013b, Seismic characterization of naturally reservoirs with asymmetric fractures: Geophysics, 78, N1–N10
| Seismic characterization of naturally reservoirs with asymmetric fractures:Crossref | GoogleScholarGoogle Scholar |
Far, M. E., Hardage, B., and Wagner, D., 2014, Fracture parameter inversion for Marcellus Shale: Geophysics, 79, C55–C63
| Fracture parameter inversion for Marcellus Shale:Crossref | GoogleScholarGoogle Scholar |
Guo, Z. Q., Liu, C., Li, X. Y., and Lan, H. T., 2015, An improved method for the modeling of frequency-dependent amplitude-versus-offset variations: IEEE Geoscience and Remote Sensing Letters, 12, 63–67
| An improved method for the modeling of frequency-dependent amplitude-versus-offset variations:Crossref | GoogleScholarGoogle Scholar |
Hall, S. A., and Kendall, J., 2003, Fracture characterization at Valhall: application of P-wave amplitude variation with offset and azimuth (AVOA) analysis to a 3D ocean-bottom dataset: Geophysics, 68, 1150–1160
| Fracture characterization at Valhall: application of P-wave amplitude variation with offset and azimuth (AVOA) analysis to a 3D ocean-bottom dataset:Crossref | GoogleScholarGoogle Scholar |
Landrø, M, and Tsvankin, I, 2007, Seismic critical-angle reflectometry: a method to characterize azimuthal anisotropy? Geophysics, 72, D41–D50
| Seismic critical-angle reflectometry: a method to characterize azimuthal anisotropy?Crossref | GoogleScholarGoogle Scholar |
MacBeth, C., 1999, Azimuthal variation in P-wave signatures due to fluid flow: Geophysics, 64, 1181–1192
| Azimuthal variation in P-wave signatures due to fluid flow:Crossref | GoogleScholarGoogle Scholar |
Pérez, M. A., Gibson, R. L., and Toksöz, M. N., 1999, Detection of fracture orientation using azimuthal variation of P-wave AVO responses: Geophysics, 64, 1253–1265
| Detection of fracture orientation using azimuthal variation of P-wave AVO responses:Crossref | GoogleScholarGoogle Scholar |
Rüger, A., 1998, Variation of P-wave reflectivity with offset and azimuth in anisotropic media: Geophysics, 63, 935–947
| Variation of P-wave reflectivity with offset and azimuth in anisotropic media:Crossref | GoogleScholarGoogle Scholar |
Rüger, A., and Tsvankin, I., 1995, Azimuthal variation of AVO response for fractured reservoirs: 65th Annual International Meeting, SEG, Expanded Abstracts, 1103–1106.
Rüger, A., and Tsvankin, I., 1997, Using AVO for fracture detection: analytic basis and practical solutions: The Leading Edge, 16, 1429–1434
| Using AVO for fracture detection: analytic basis and practical solutions:Crossref | GoogleScholarGoogle Scholar |
Rutherford, S. R., and Williams, R. H., 1989, Amplitude-versus-offset variations in gas sands: Geophysics, 54, 680–688
| Amplitude-versus-offset variations in gas sands:Crossref | GoogleScholarGoogle Scholar |
Sayers, C. M., and Rickett, J. E., 1997, Azimuthal variation in AVO response for fractured gas sands: Geophysical Prospecting, 45, 165–182
| Azimuthal variation in AVO response for fractured gas sands:Crossref | GoogleScholarGoogle Scholar |
Schoenberg, M. A., and Protázio, J., 1992, ‘Zoeppritz’ rationalized and generalized to anisotropy: Journal of Seismic Exploration, 1, 125–144
Schoenberg, M. A., Dean, S., and Sayers, C. M., 1999, Azimuth-dependent tuning of seismic waves reflected from fractured reservoirs: Geophysics, 64, 1160–1171
| Azimuth-dependent tuning of seismic waves reflected from fractured reservoirs:Crossref | GoogleScholarGoogle Scholar |
Vavryčuk, V., and Pšenčík, I., 1998, PP-wave reflection coefficients in weakly anisotropic elastic media: Geophysics, 63, 2129–2141
| PP-wave reflection coefficients in weakly anisotropic elastic media:Crossref | GoogleScholarGoogle Scholar |


