A Mathematical Review of Polyphase Filterbank Implementations for Radio Astronomy
Christopher Harris A C and Karen Haines BA ICRAR, The University of Western Australia, M468, 35 Stirling Hwy, Crawley 6009, Australia
B WASP, The University of Western Australia, M024, 35 Stirling Hwy, Crawley 6009, Australia
C Corresponding author. Email: christopher.harris@icrar.org
Publications of the Astronomical Society of Australia 28(4) 317-322 https://doi.org/10.1071/AS11032
Submitted: 30 June 2011 Accepted: 29 August 2011 Published: 19 October 2011
Journal Compilation © Astronomical Society of Australia JYEAR
Abstract
The technique of polyphase filterbanks is commonly used for signal processing in radio astronomy. The rapid and ongoing evolution of parallel hardware architectures requires optimised implementations of such techniques to be redeveloped. However, much of the published research regarding polyphase filterbanks refers the reader to signal processing books with a more general scope. Furthermore, these references tend to focus on the design of filters, rather than their implementation. For this reason, this work presents a mathematical background for the implementation of a polyphase filterbank specific to radio astronomy. It also addresses the advantages and disadvantages of polyphase filterbanks in comparison with more commonly used techniques.
Keywords: methods: data analysis — methods: numerical
1 Introduction
Polyphase filterbanks are used to augment the one-dimensional fast Fourier transform (FFT) in radio astronomy signal processing, in order to reduce the spectral leakage effect. This effect can cause strong radio sources in an output channel of the FFT to hide fainter sources in other output channels. As reviewed in this work, the polyphase filterbank provides a computationally efficient approach that is well suited to radio astronomy applications. Such applications are predominantly implemented based on power-efficient Field Programmable Gate Array (FPGA) architectures. However, mainstream computing architectures can also be used for applications where acquiring FPGA hardware and developing the associated software would be considered too costly, or that require the flexibility of general purpose processors.
As serial CPU development has become limited by excessive power consumption preventing higher clock speeds, the resulting move to parallelism has given rise to a diverse range of mainstream computing architectures. Examples of such architectural paradigms include multicore CPU processors, GPU computing, and heterogeneous processors containing a variety of cores. Radio astronomy is exploring the use of such architectures for its processing needs (Wayth, et al. 2007; Harris, Haines, & Staveley-Smith 2008; Wayth, Greenhill, & Briggs 2009; Kondo, et al. 2010; Fluke, et al. 2011). However, such exploration requires the re-implementation of algorithms to take optimal advantage of the parallel processing capabilities.
For the polyphase filterbank, such implementations require an understanding of how the polyphase filter works, but the filter function itself remains unchanged. Digital signal processing and the design of filter functions are well documented, and this work draws from several standard texts (Oppenheim, Willsky, & Young 1983; Oppenheim & Schafer 2009; Crochiere & Rabiner 1983). However, such general purpose texts are broad in scope, and tend to focus on the analytical design of such filters rather than their implementation. This work provides a condensed presentation of the polyphase filterbank specifically targeted to radio astronomy applications.
The remainder of this work begins with Section 2, which briefly reviews the Fourier transform and its role in signal processing. Section 3 then discusses spectral leakage and its effect on signal processing applications that use the fast Fourier transform. Section 4 reviews commonly used approaches to reducing spectral leakage, specifically analysis filters and windowing. Section 5 reviews the polyphase filterbank, providing a detailed mathematical description and a discussion of its computational complexity and its effects on the temporal and spectral resolution of the signal. Section 6 provides a simple serial implementation of the polyphase filterbank. Section 7 then summarises the concepts presented in this work.
2 Digital Signal Processing
The Fourier transform and its generalisation the z transform provide a theoretical basis for the spectral analysis of a signal. In particular, they facilitate the conversion of signals between the time domain and the frequency domain. For the continuous-time signal x(t), defined for the time domain –∞ ≤ t ≤∞, the Fourier transform of the signal X(ω) can be obtained for the range of frequencies –∞ ≤ ω ≤∞ using the analysis Equation 1. The reverse transform is achieved by the synthesis Equation 2.


While these equations form a theoretical basis for spectral analysis, in digital signal processing the signals are neither continuous-time nor of infinite duration. Instead, processing must occur on discrete signals of finite duration, in the form of a finite set of samples. For this reason, discrete versions of the above equations must be used. However, this introduces artifacts known as spectral leakage. The following section describes the cause and effects of spectral leakage in greater detail.
3 Spectral Leakage
The discrete Fourier transform (DFT) is commonly used in digital signal processing, due largely to the development of its efficient implementation, the FFT. Consider a discrete-time signal x[n] consisting of N samples with n ∈ [0, N – 1]. The DFT of x[n] is shown in the analysis Equation 3, producing a set of N spectral coefficients X[k], with  . The original signal x[n] can be obtained from the spectral coefficients via the synthesis Equation 4.


However, because x[n] is a finite-length discrete sampling of the true signal x(t), the spectral coefficients X[k] obtained from Equation 3 can respond to frequencies well outside the vicinity of k. Since the discrete Fourier transform is linear, substituting a complex sinusoid  of frequency ν allows the derivation of the power-spectral density of the frequency response
  , shown in Equation 5. To derive this frequency response, the DFT is first applied to x[n]:
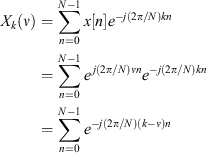
The result is a geometric series of N terms, the sum of which can be evaluated as:

This expression can be factorised, which allows the application of Euler's formula to yield:

The power-spectral density of the frequency response can then be obtained by multiplying by the conjugate:

The frequency response for the first channel X[0] of a length N = 1024 DFT is shown in Figure 1. The response for the other channels is identical, but offset by ν = k. While the main lobe of the response X 0(ν) is centred on ν = 0, there are side lobes that exist in every other channel. This is undesirable in radio astronomy, since faint spectral features can be hidden by bright spectral features in other channels. The unwanted response to adjacent channels caused by these sidelobes is commonly referred to as spectral leakage.

|
If the sampling rate is increased to the limit of continuous sampling while the total duration of the sampled signal remains constant, the frequency response tends to the sinc function of Equation 7. This can be shown by utilising the trigonometric limit in Equation 6, and normalising the response by 1/N 2 to account for a continuous power distribution rather the per element distribution of the discrete case:

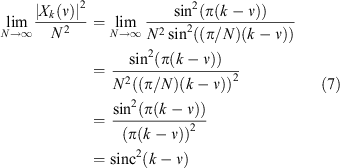
where the sinc function is defined as

The sinc function is the continuous Fourier transform of a rectangular function. It appears in the frequency response because the input to the DFT is of limited duration, rather than infinite duration. In effect the input consists of a rectangular windowing of the true signal. The introduction of this rectangular window in the time domain results in the sinc response in the frequency domain. As seen in Equation 5, the discrete sampling of the signal causes the aliasing of this true sinc response. The following section will discuss the use of windowed filters to alter the frequency response and reduce the effect of spectral leakage.
4 Filters and Windowing
The effects of spectral leakage, discussed in the previous section, can be reduced by altering the signal prior to the DFT. Specifically, an analysis filter h[n] can be used to weight the signal values as shown in Equation 3, and in the process adjust the frequency response. Although the intent of this work is to focus on the implementation of the polyphase filterbank, a filter is required for the discussion to be meaningful. For clarity, a simple non-optimal filter design will be used and is presented in this section. (The approach of subsequent sections is also valid for more advanced filter designs, for which the authors recommend Oppenheim & Schafer 2009.)

The first step in determining the values of h[n] in this naive approach is to obtain the continuous version of the filter h(t) by taking the inverse Fourier transform of the desired spectral response H(ν). For radio astronomy, the desired response is typically a normalised rectangular function in the frequency domain as shown in Equation 10. A phase shift of N/2 must be included in H(ν) since the DFT equations use the range  as opposed to
  .
.

Thus integrating  and applying Euler's formula obtains h(t) as:
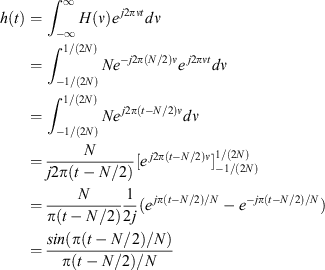
Using the sinc function defined in Equation 8, the continuous version of the analysis filter becomes:

This result resembles that of the previous section, due to mathematical similarities between the normal and inverse Fourier transforms. Not only is the sinc function the Fourier transform of the rectangular function, it is also the inverse Fourier transform of the rectangular function. While the sinc function was appearing as an undesirable artifact in the spectral response due to a rectangular windowing in the previous section, here it forms the filter that is to be used to obtain a spectral response that resembles a rectangular function.
Unfortunately, a true rectangular response is impossible, as h(t) is continuous and has infinite duration. To be usable, it must first be converted to the discrete-time analysis filter h[n]. This is achieved by using the windowing function w(t) to discretely sample the continuous filter at  as shown in Equation 12, which not only creates a discretely sampled filter but also truncates it to have finite duration.

The choice of windowing function is crucial, as it effects the distribution of the main lobe and sidelobes in the spectral response. The windowing function here has a far greater impact on the spectral response than the continuous filter. For example, using a rectangular window w R (t) defined in Equation 13 with the continuous filter in Equation 11 will result in sidelobes that are almost as large as those of the previous section. However, the sinc filter will be used to adjust the width of the frequency response for the polyphase filterbank in the subsequent section, and hence it has been introduced here.
There exists a wide range of windowing functions, including the rectangular, Bartlett, Hanning, Hamming, Blackman, and Kaiser (Oppenheim & Schafer 2009; Crochiere & Rabiner 1983) as well as many others. In general, such functions reduce the size of the sidelobes to a varying degree at the cost of a wider main lobe. For the purposes of this work, a Hanning window w H (t) as defined in Equation 14 will be used.


Thus, using a Hanning-windowed sinc function as the analysis filter h[n], the spectral response of each channel Y[k] to the range of frequencies ν present in the signal x[n] can be obtained by evaluating Equation 9 for a complex sinusoid  . This has been computed for a length N = 1024 DFT and is graphed in Figure 2 alongside the response to the plain DFT of the previous section. Note that the sidelobes are indeed smaller, at the cost of a wider main lobe. For certain types of applications, this can be further improved using the polyphase techniques presented in the following section.

|
5 Polyphase Filterbanks
The use of filtering was shown in the previous section to adjust the frequency response of the output channels X[k] of the DFT. In particular, the spectral leakage due to sidelobes in the frequency response could be reduced, but with the result that the width of the main lobe of the response was increased. This behaviour can be leveraged to further reduce the effects of spectral leakage while achieving a well-defined main lobe if additional samples of the original signal are available.
Consider an increase in the number of samples in x[n] by a factor of P, such that  where M = NP. For the purposes of this work, the sampling rate is assumed to remain constant, and the additional signal samples are instead obtained by sampling for a longer period of time. The additional samples would allow a larger DFT to be used, resulting in an increase in the number of output channels by a factor of P. If the width of the main lobe of the channel response were increased by the same factor of P, then calculating only every P
th channel would result in smaller sidelobes for the same number of output channels as the original DFT. Thus the desired filter response is:

The methodology of the previous section for the derivation of Equation 11 can be then applied. Note that the limits can be simplified to those of the original, resulting in an almost identical derivation except for the ratio of the width to the offset of the filter:
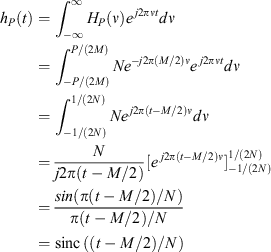
The window function must also be modified by stretching it to cover the larger filter length:

Sampling the continuous filter h
P
(t) with this window function wP
(t) at  obtains the polyphase filter:

Since the DFT need only be calculated for every P
th channel, a polyphase structure combined with a smaller DFT of length N can be used instead to implement this technique efficiently. Adapting Equation 9 to the larger number of samples M and the polyphase filter given by Equation 16, a variable substitution of  can be performed to remove redundant channels, and a polyphase structure can be introduced to remove redundant operations with the substitution m = n + N
ρ (Bunton 2003). Note that Nρ can be removed from the exponent as it creates a phase offset that is a multiple of 2π in the complex sinusoid.
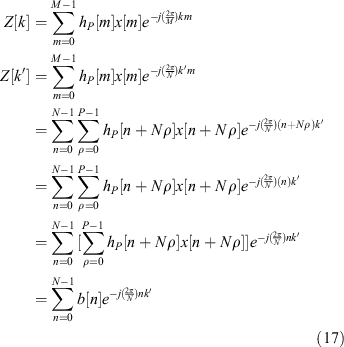
Thus the polyphase filterbank output  can be calculated using a DFT of length N that is applied to a polyphase structure b[n] defined by Equation 18. Both the polyphase structure and the subsequent Fourier transform are illustrated in Figure 3.


|
The spectral response of the filterbank output  is shown for P = 8 taps and a length N = 1024 DFT in Figure 4. A tap in this context refers to the number of phases P used in the polyphase structure. The filterbank response has a main lobe that is a much closer approximation to the ideal rectangular function response. Additionally, the sidelobes are much smaller than the approaches of the previous sections. This improvement has been achieved purely through the use of the additional signal samples, which results in a loss of resolution in the time-domain location of the spectral features. However, in radio astronomy this resolution is usually lost in accumulation processes that are used to increase the signal-to-noise ratio. Thus, in these situations, if the reduction of spectral leakage is required, the polyphase filterbank presented in this section is ideal.

|
In terms of computational cost, the polyphase filterbank as described has a computational complexity of  . This is a small increase over the approaches of the previous sections, which had a computational complexity of
  , but is still much less than the
  complexity that the larger length M DFT would have. These complexities assume an efficient FFT implementation of the DFT, and that the filters are precalculated.
It should also be noted that the polyphase structure is not dependant on the simple example filter presented in this work. The derivation of Equation 17 remain valid for more complex and optimal filters as well. Such filters can be used if the width of the frequency response is adjusted accordingly.
6 Serial Implementation
Having presented the mathematical framework for a polyphase filterbank, this section presents a polyphase filterbank implementation. The following implementation is a simple, serial design that only performs a single transform of the data, and bears little resemblance to the optimised code required for good performance on the parallel architectures described in the introduction. However, when designing such optimised parallel code a serial reference implementation is often useful, and for this reason it is included here.
The following pseudocode first declares arrays to hold data, and then generates the filter described by Equation 16. Note that the values of N, M, and P correspond to the variables of the previous section. After the signal has been acquired, the polyphase structure is applied as described by Equation 18. In this code the data is assumed to be real-valued, and a length N real-to-complex FFT is then called to produce N/2 + 1 output values. Optimised FFT libraries for architectures are typically available due to the widespread use of the FFT transform, and its implementation is outside the scope of this work. The output is then written as the final stage of the pseudocode implementation.
// declarations
filter[M]
signal[M]
b[N]
output[N/2+1]

// generate filter
FOR i in M
 // sinc function
 filter[i] = sinc((i-M/2)/N)
 // window
 filter[i] *= 0.5-0.5*cos(2*PI*i/M)
ENDFOR

// acquire signal
READ signal

// perform polyphase structure
FOR i in N
 b[i] = 0
 FOR j in P
  b[i] += filter[j*N+i]*signal[j*N+i]
 ENDFOR
ENDFOR

// perform FFT
CALL fft(b,output,N)

// write output
WRITE output
For complex-valued data, a complex-to-complex FFT would be required and the output would consist of N values. On some architectures, padding real-valued data and using a complex-to-complex FFT may result in better data alignment for subsequent processing stages. It should be possible to substitute more sophisticated filter designs, as long as the frequency response has been widened to account for the additional taps of the polyphase structure.
7 Conclusion
This work has condensed information from a number of sources to provide an explanation of the mathematics required to implement a polyphase filterbank. In particular, the focus of this explanation has been radio astronomy. The polyphase filterbank is shown to suppress the spectral leakage effect of the DFT in a manner superior to that of the standard FFT, or a windowed FFT, albeit with some minimal costs.
Such costs include a higher computational complexity and a reduced temporal resolution. However, the computational complexity of the polyphase filterbank is significantly less than that of the larger-length windowed FFT to which it is mathematically equivalent. Furthermore, for radio astronomy, the loss of temporal resolution is irrelevant given such information is typically lost in subsequent accumulation operations. It is these characteristics that are responsible for the widespread use of polyphase filterbanks in radio astronomy signal processing.
Acknowledgements
The authors thank Lister Staveley-Smith and Andreas Wicenec for their feedback in preparing this work, and also acknowledge support from the Western Australian Centre of Excellence for Radio Astronomy Science and Engineering.
References
Bunton, J., 2003, ALMA Memo, , 447Crochiere, R. E., Rabiner, L. R. 1983, Multirate Digital Signal Processing; Prentice-Hall
Fluke, C. J., Barnes, D. G., Barsdell, B. R. and Hassan, A. H., 2011, PASA, 28, 15
| Crossref | GoogleScholarGoogle Scholar |
Harris, C., Haines, K. and Staveley-Smith, L., 2008, Exp. Astron., 22, 129
| Crossref | GoogleScholarGoogle Scholar |
Kondo, H., Heien, E., Okita, M., Werthimer, D. & Hagihara, K., 2010, in ISPA, 594
Oppenheim, A. V., Willsky, A. S. & Young, I. T., 1983, Signals and Systems; Prentice-Hall
Oppenheim, A. V. & Schafer, R. W., 2009, Discrete-Time Signal Processing; 3rd Edition, Prentice-Hall
Wayth, R., Dale, K., Greenhill, L. J., Mitchell, D. A., Ord, S. and Pfister, H., , BAAS, 39, 744
Wayth, R. B., Greenhill, L. J. and Briggs, F. H., 2009, PASP, 121, 857
| Crossref | GoogleScholarGoogle Scholar |


 of
of