

Understanding and quantifying whole soil-profile organic carbon transfer using an environmental tracer
G. R. Hancock A *
A *
A
Abstract
Quantifying soil organic carbon (SOC) depth distribution and its vertical transport is needed for both improved understanding of soil properties and behaviour as well as enhanced organic carbon sequestration. This is a global issue, that if better understood, could result in both more agriculturally productive soils as well as enhanced environmental outcomes.
Quantify whole soil-profile SOC and down-profile movement at a series of sites in south-east Australia.
Soil is sampled at regular intervals using cores and assessed for SOC and environmental tracer (137Cs) concentration.
Soils that have a high clay content (Vertosols) and crack (i.e. self mulching) have the highest SOC content. In high clay content soils, 137Cs is present at depths well below that at which it would be present by diffusive processes.
Surface soil, labelled with 137Cs is moving down the soil profile by advective processes to depths well below that possible by diffusive processes alone. Using local erosion rates and carbon input, it is estimated that less than 1% of SOC is delivered to the cracking soils by erosional processes and that the majority of SOC must be produced in situ.
Given that 137Cs is a relatively new environmental tracer (1945 onwards), this suggests that surface labelled soil is reaching depths of up to 80 cm at decadal time scales. The methods and findings here have global applicability and provide insights into potential enhancement of carbon sequestration in both cropping and grazing landscapes.
Keywords: 137-Cs, carbon sequestration, cesium-137, climate variability, pedogenesis, soil depth, soil properties, vertosol.
Introduction
Soil organic carbon (SOC) is well understood to have a wide range of biogeochemical roles. In recent years, increasing SOC has been seen as a way to improve soil productivity as well as reducing atmospheric CO2 concentration (Minasny et al. 2017; Wang et al. 2022). Consequently there has been considerable effort into understanding the spatial and temporal distribution of SOC. However, there is considerable debate about the rate of change of SOC in terms of both increasing and decreasing concentration and different management practices for different soils (Cunningham et al. 2012; George et al. 2012; Davy and Koen 2013; Korkanç 2014; Baah-Acheamfour et al. 2015; Cardinael et al. 2015; Minasny et al. 2017; Dalal et al. 2021; Wang et al. 2022). There is also considerable debate regarding how SOC distribution changes spatially (Wang et al. 2022) and temporally down the soil profile (Lorenz and Lal 2005; Yoo et al. 2006; Luo et al. 2010; Mora et al. 2014; Murphy 2015; Olson and Al-Kaisi 2015; Dalal et al. 2021). Here we focus on SOC down the soil profile to bedrock.
Quantifying SOC and its spatial and temporal variability is complex as soil is heterogeneous in space and time (Murphy 2015). Soil is produced by a combination of intrinsic and extrinsic factors. Both organic and inorganic materials can be produced in situ, deposited from upslope and material lost downslope (erosion) (Willgoose 2018). Inorganic and organic material will also move down the soil profile by a variety of processes that can be diffuse (i.e. material moving along a wetting front, illuviation of clay) as well as more immediate (i.e. cracks allowing direct movement of surface material down the profile) (Wells et al. 2012, 2013; Wells and Hancock 2014).
Diffusive processes, where matter moves according to a gradient of chemical potential, activity or concentration are usually slow and controlled by soil texture in response to forcing factors such as soil moisture. Advection, or bulk movement, provides a more direct and potentially rapid transfer of material through soil cracks and fissures (Wells and Hancock 2014). Animal burrows and decaying tree roots may also provide a relatively rapid and concentrated (advective) transfer (Butler 1995, 2018). There is considerable theoretical knowledge regarding these processes; however, for the majority of soils the dominant processes are only qualitatively understood (Willgoose 2018). A quantitative understanding is yet to be fully developed. What is less well understood is the rate at which materials migrate vertically down the soil profile. This information is needed for improved soil management and increased agricultural productivity as well as the complementary goal of carbon sequestration.
Many studies have examined SOC both over short and longer time scales; however, the majority have focussed on the near surface (Jha et al. 2020). Quantifying whole-profile processes are non-trivial. While surface soil samples are relatively easy to obtain, collecting full soil profiles are much more labour intensive. Whole profile assessment is the focus of this work.
Environmental tracers offer one approach to better understand the spatial and temporal distribution of soil components. During 1945–1972, 137Cs (half-life of 30.2 years) was emitted globally into the atmosphere. It is an anthropogenically produced tracer and has been used extensively to determine erosion rates (Loughran 1994; Walling and He 1999, 2001; Walling et al. 2011). Upon arrival on the soil surface by both wet and dry deposition at the soil surface (Elliott et al. 1997), 137Cs becomes strongly bound to the clay component of soil. The 137Cs arrived via rainfall onto the soil surface and is known to migrate via diffusive processes (Wells et al. 2012, 2013). However, surface labelled soil can be eroded and transported both laterally and vertically. In particular, for Vertosols (a focus here) cracks develop as the soil dries, allowing surface soil materials to fall into the cracks (Wilding and Tessier 1988). Because 137Cs is unique in the environment, it provides a tool to identify soil movement down the soil profile. The non-exchangeability of the cation once it comes into contact with soil particles (VandenBygaart 2001) means that the soil is essentially labelled with 137Cs, which only changes through time as a result of natural decay and soil movement (Hao et al. 2001), thus making it a useful tracer. A downside of 137Cs is its relatively short half life (30.2 years), which means that it has now had nearly two half-lives of decay and is now unable to be detected in some areas in Australia.
Several hillslope and catchment-scale studies have suggested a link between SOC and sediment transport (Gregorich et al. 1998; Starr et al. 2000; VandenBygaart 2001; Ritchie and McCarty 2003; Page et al. 2004; Van Oost et al. 2005; Li et al. 2006, 2007; Yoo et al. 2006; Huang et al. 2007; Mabit et al. 2008; Kuhn et al. 2009; Quinton et al. 2010; Doetterl et al. 2012, 2015, 2016; Fissore et al. 2017). The above studies suggest that (1) 137Cs and SOC are moving along the same physical pathways, (2) 137Cs and SOC are moving by the same physical mechanisms and (3) 137Cs can be used to predict the spatial distribution of SOC. Therefore, the literature regarding the relationship between SOC and 137Cs appears to be well established, with similar conclusions reported at various study sites throughout the world. The presence of 137Cs in soil can therefore infer (1) depth of migration of surface material by both advective and diffusive processes and (2) a potential rate at which surface material migrates to that depth (Wells et al. 2012, 2013).
This study examines the issue of soil profile SOC distribution in a catchment in south-east Australia. The anthropogenic tracer 137Cs is used as a means to determine the migration of surface soils to depth. The presence of 137Cs further provides the ability to place an age constraint on the movement of surface materials down the soil profile. As 137Cs was released to the atmosphere during 1945–1972, then any material movement must have been labelled by fallout received on the soil surface from within this period of release (27 years). This provides a range of age constraints on transported material down the soil profile.
Here a range of soils in a large catchment in the Hunter Valley located in the south-east of Australia are examined to bedrock. The environmental tracer 137Cs is used to elucidate the movement of surface soil down the soil profile and hypothesise as to the rate of this soil movement and related SOC concentration. The methods here can be used elsewhere to better understand the movement of soil materials down the soil profile.
Site description
This study focusses on sites in the Krui River catchment in south-east Australia (Fig. 1) (Rüdiger et al. 2007). The catchment has been a major focus for understanding hydrology, sediment transport and SOC in south-east Australia (Martinez et al. 2010; Bissett, unpubl. BSc. Hons. thesis; Wells et al. 2012, 2013; Wells and Hancock 2014; Kunkel et al. 2016, 2019; Hancock et al. 2019). The Krui catchment extends over 31°49–32°13′S and 150°02–150°21′E, with elevations ranging from approximately 200 m in the south (Merriwa Plateau) to 1200 m in the north (Liverpool Range). The region is located in the temperate zone of eastern Australia. Average annual rainfall in the study area is 624 mm (the 139 year average recorded at the Cassilis monitoring station, www.bom.gov.au), with annual potential evaporation of approximately 1200 mm. The local landscape is open grassy woodland characterised by widely spaced eucalypt tress with very little shrub cover.
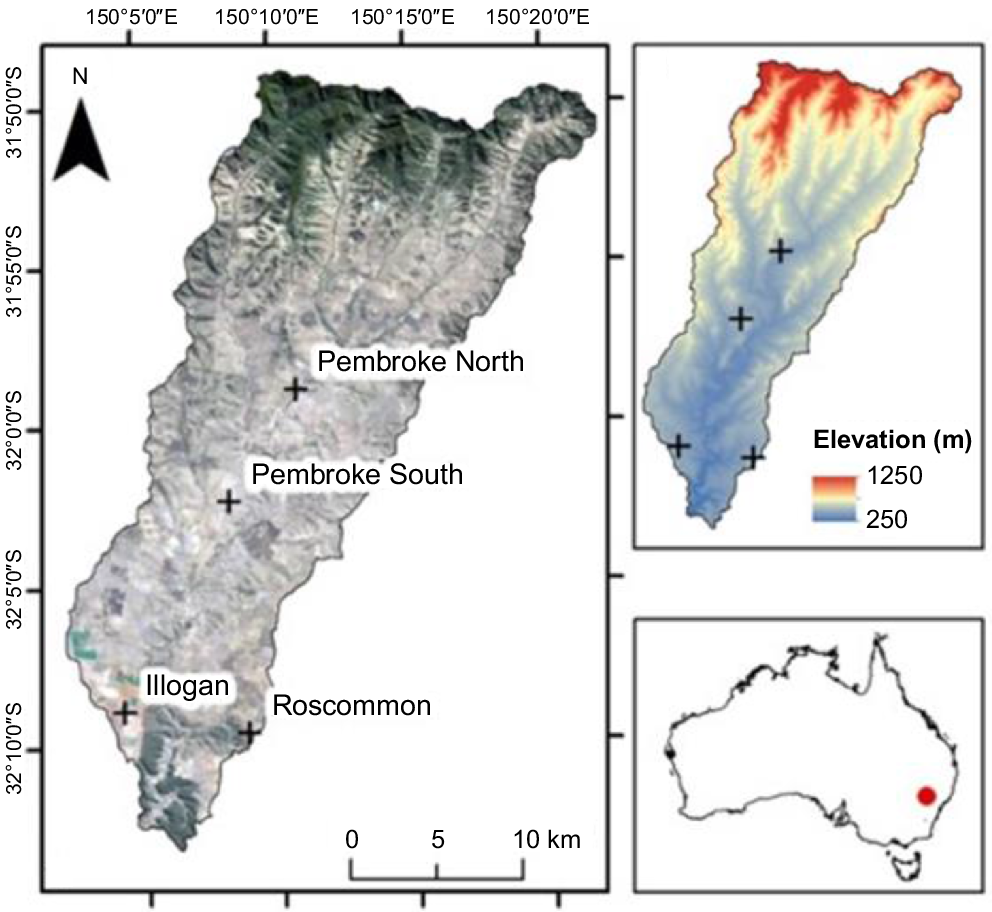
The study examines a range of soils at locations in the Krui catchment (Illogan, Roscommon and Pembroke properties) that are used for both grazing and cropping and all with the same approximate rainfall and climate (Fig. 1). Soil pits to bedrock were excavated at all sites. These sites are described below (Table 1, Fig. 2).
| Site | Landuse | Soil type | |
|---|---|---|---|
| Roscommon (K2) | Pasture | Solodic soil, sandy loam | |
| Illogan (Dog Paddock) | Cropping | Red basaltic clays (Euchrozems) | |
| Illogan (Shed Paddock) | Cropping | Black basaltic clay (Vertosol) | |
| Pembroke South cropped (K3) | Cropping | Black basaltic clay (Vertosol) | |
| Pembroke South pasture (K3) | Pasture | Black basaltic clay (Vertosol) | |
| Pembroke North pasture (K4) | Pasture | Black basaltic clay (Vertosol) |
For further site detail see Rüdiger et al. (2007).
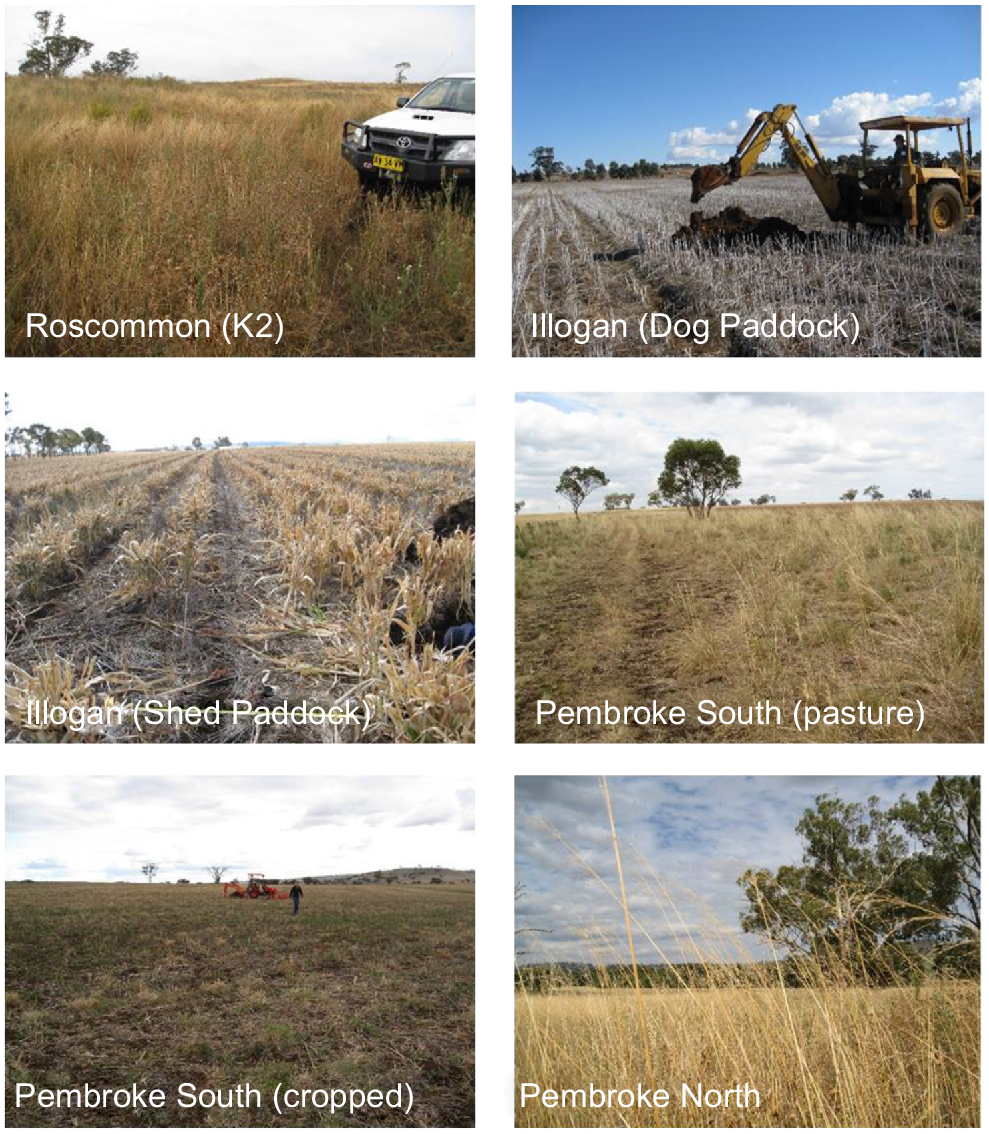
Photographs of the study sites and equipment used for the soil pits from which the soil samples were collected. The sites were a mix of both cropping and grazing land use. Further details can be found in Rüdiger et al. (2007) or https://www.eng.newcastle.edu.au/sasmas/SASMAS/sasdata.html.
Illogan
At the Illogan property, two sites were examined. First, a site with red basaltic clays (Euchrozems, upon which the ‘Dog Paddock’ site is located) and, second, a site with black earths (Vertosols, upon which the ‘Shed Paddock’ site is located) (Fig. 2). The slope (1%), aspect and elevation of each site were similar. The Dog Paddock pit was excavated 10 m to the east of a permanently mounted weather and soil moisture monitoring station (‘K1’, see Rüdiger et al. 2007). The Shed Paddock site was established ~1.5 km to the west of the Dog Paddock site. There was no evidence at either site of erosion/deposition or any disturbance other than that produced by cultivation practices associated with minimum tillage cereal and grain production. Cracking of the soil has been observed on many occasions at the Shed Paddock site during dry periods. No cracking has been observed in Dog Paddock. Further site details can be found in Wells et al. (2013).
Roscommon
The Roscommon site (K2) was located on sandy loam (Solodic) soil and comprised improved pasture and has been used for grazing (Fig. 2). There has been no cropping at the site. No soil cracking has been observed at this site. The property has been owned by the same family for over 50 years with a consistent grazing management programme.
Pembroke South
Pembroke South (K3) had Vertosol soil and had areas of both cropping and grazing (Fig. 2). Two sites were examined: one that had been cropped (Pembroke South Cropping) and an adjacent site in the same paddock (100 m to the north) adjacent to the K3 soil moisture monitoring site (Rüdiger et al. 2007) that had not been cropped and managed as pasture and grazing (Pembroke South Grazing). Large cracks have been observed at both sites here.
Pembroke North
Pembroke North (K4) had Vertosol soil and had been managed for pasture and never cropped (Fig. 2). Cracks have been observed at this site.
Site summary
All sites had low slope of 1–3% and approximately the same rainfall. All sites were well away from trees and any farm infrastructure. In summary, the sites were a mix of both pasture (grazing) and cropped sites. All sites were considered to have deep soils (depths over 1 m) and good fertility and agricultural productivity (Table 1). The Illogan site allowed an assessment of two different soils on the same property that were both managed for cropping in the same way. While K3 (Pembroke South), allowed an assessment of the same soil under both cropping and pasture.
A summary of the sites is provided in Table 1.
Methodology
Soil sampling
At all sites a backhoe was used to cut trenches down to bedrock. The pits were 3–4 m long and approximately 1 m wide to allow access. Soil samples were collected by inserting steel cores into the site wall of each trench in a continual sequence down the soil profile. Each vertical profile was sampled using 200 mm long by 65 mm or 200 mm by 100 mm internal diameter cores, which were hammered into the side wall of the trench at regular intervals in a vertical line from the soil surface down to bedrock. Less deep cores (i.e. 50 and 150 mm) were collected at the surface. For insertion a steel cap or dolly was placed on top of the core. No lubricants were used on the cores when inserted.
Laboratory analysis
After collection, soil samples were immediately bagged and transported to the University of Newcastle soils laboratory, where they were weighed and then dried at 40°C for 7–10 days. The dried samples were gently disaggregated with a mortar and pestle and passed through a 2 mm sieve and the coarse (>2 mm) fraction separated. The <2 mm fraction was further disaggregated with a mortar and pestle and weighed. The bulk density of each sample was calculated using the dried soil mass and volume of each core.
The <2 mm soil fraction was ground in a mill to a fine powder and the total carbon and nitrogen content measured using a LECO 2000 analyser (LECO method, www.leco.com). The SOC is reported here in units of mass (t ha−1) using the bulk density of the soil determined from the sample core and depth of the sample core. The hydrometer method outlined by Smith and Atkinson (1975) was employed to establish the particle size distribution of the <2 mm soil fraction. Bulk density of each sample was determined based on dry mass of each sample and core volume. The pH was determined using a 1:5 solution with distilled water using a Eutech pH instrument (Rayment and Higginson 1992).
137Cs analysis
Dried soil samples of approximately 1000 g (<2 mm fraction) were placed in Marinelli containers and gamma emissions were counted on a hyper-pure germanium spectrometer (GEM Series HPGe Coaxial Detector System) over a period of 24 h with counting errors of approximately ±10% or less achieved. The Loughran (1994) method was utilised to determine the concentration of 137Cs in the soil samples, which were then converted to areal activity (Loughran et al. 2002).
Statistical analysis
Assessments were conducted using linear regression and Student t-tests with KaleidaGraph software (www.synergy.com) and GraphPad Prism (https://www.graphpad.com). Significance was P < 0.05 unless stated otherwise, where P ≤ 0.05 means that the test hypothesis is false or should be rejected. All figures were created using the KaleidaGraph program.
Results
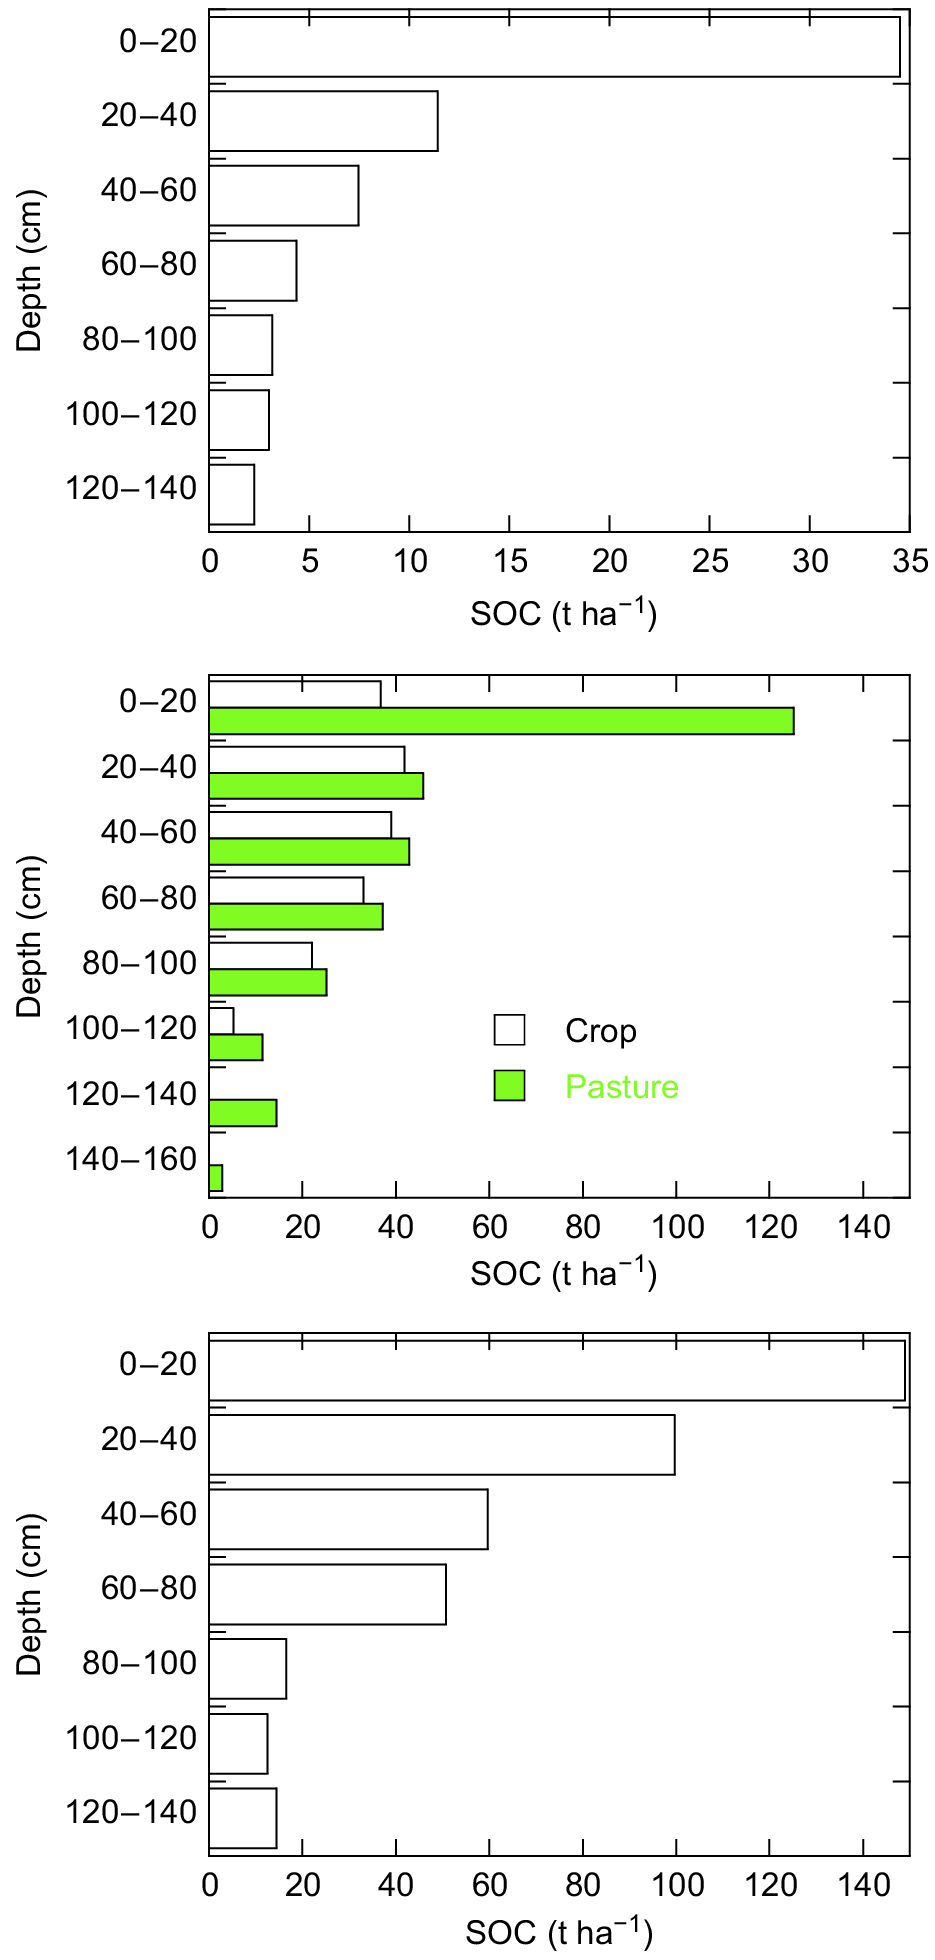
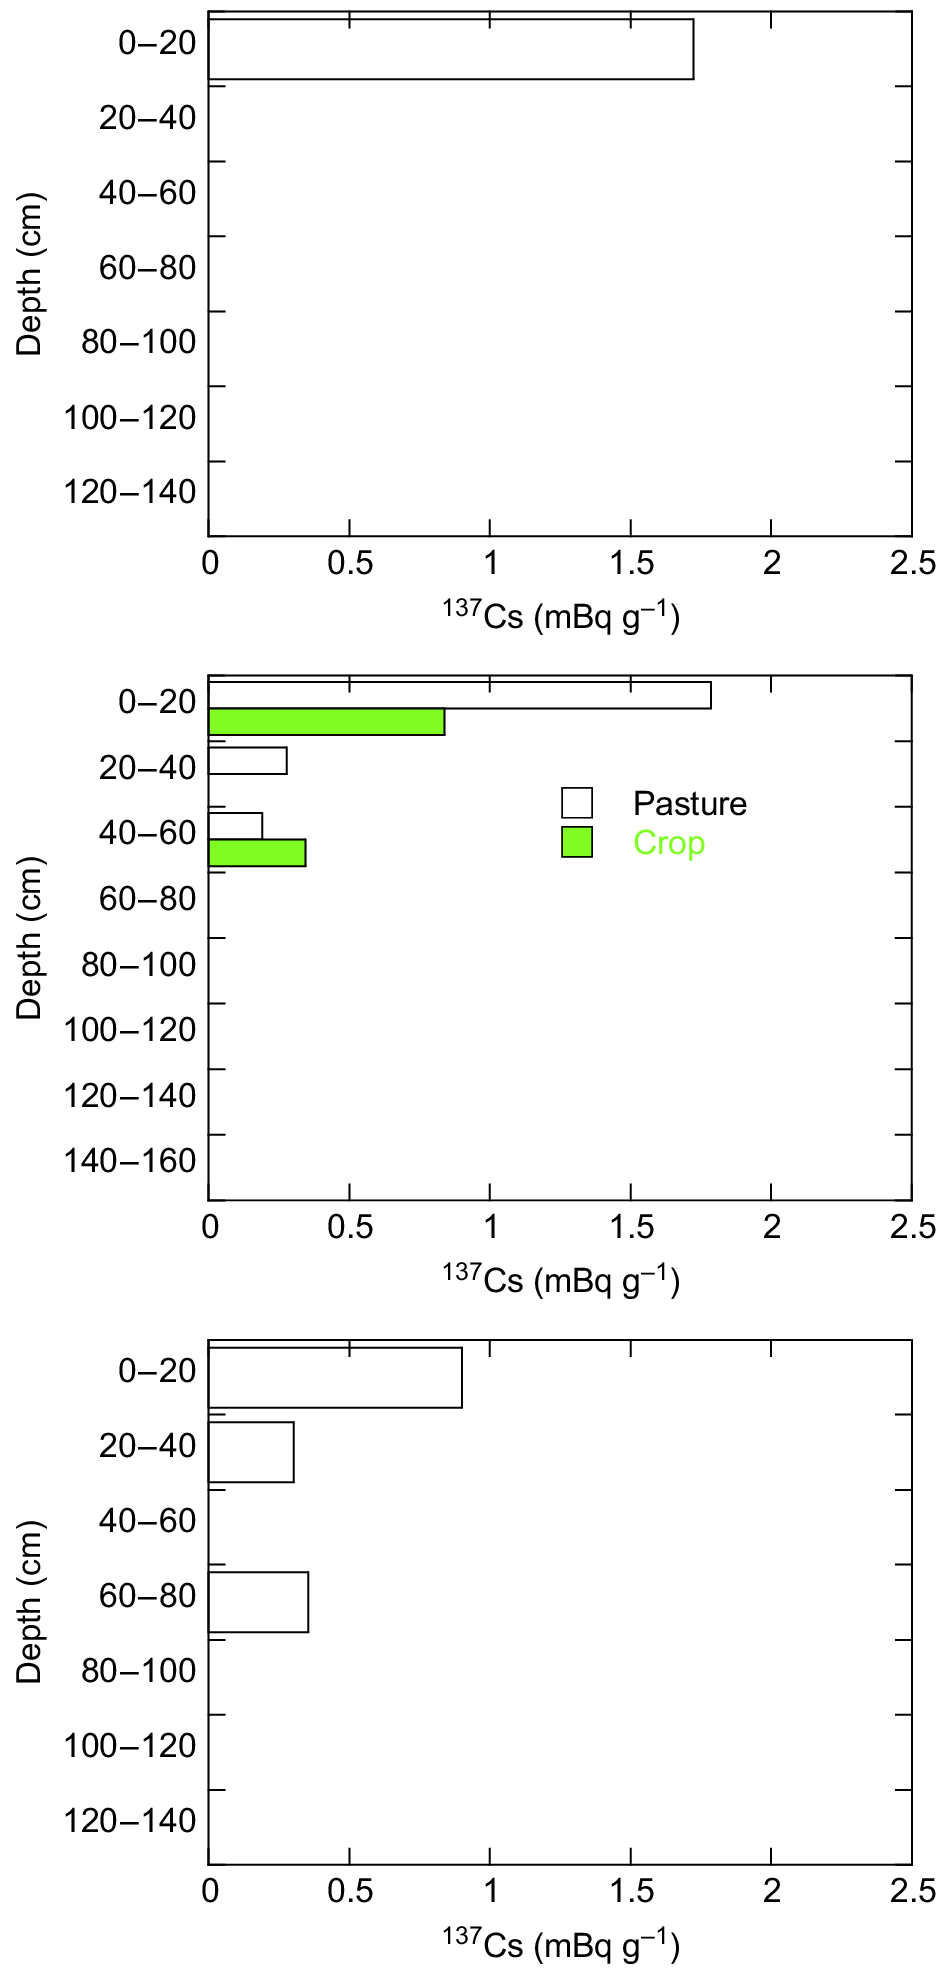
All trenches were dug to bedrock, with samples collected to the maximum depth practicable. All sites had soil depths exceeding 1 m (Table 2). The samples were collected from the Illogan site in 2010, while the other sites were collected in 2011. At time of sampling, cracks were visibly evident at Illogan (Shed Paddock) and Pembroke South and North. No cracks were evident at Illogan (Dog Paddock) or Roscommon. Slickensides were evident down the soil profile at Illogan (Shed Paddock), Pembroke North and South but not at the other sites.
| Site | Soil depth (cm) | SOC stock (t ha−1) | SOC (%) at surface | |
|---|---|---|---|---|
| Roscommon (K2) | 140 | 64.8 | 1.04 | |
| Illogan (Dog Paddock) | 118 (100–135)A | 86 (77–84)A | 2.23B | |
| Illogan (Shed Paddock) | 118 (100–135)C | 128 (94–166)C | 1.81D | |
| Pembroke South cropped (K3) | 140 | 178 | 1.05 | |
| Pembroke South pasture (K3) | 160 | 305 | 5.01 | |
| Pembroke North pasture (K4) | 140 | 402 | 7.35 |
At Illogan, soil depth for both Dog and Shed Paddocks was approximately 1.4 m (including ~0.1 m of weathered bedrock or saprolite at the base of the profile) (Table 1). Four individual vertical profiles were sampled from the walls of the Dog Paddock trench and three from the Shed Paddock trench.
Seven to eight core samples were taken for each vertical profile in the Dog Paddock trench (31 samples in total) and 8–10 cores for each Shed Paddock profile (27 samples in total).
At Roscommon and Pembroke North and South, a single set of samples was collected using steel cores inserted vertically down the sidewall of the trench to bedrock. These cores were 200 mm long with an internal diameter of 94 mm.
Soil properties
Observation of the trench wall of the Vertosol sites showed a small number of fine roots from the present and past cereal crops at depths greater than 1 m. However, the majority of roots were concentrated in the near surface. There were also well-defined vertical lines of darker material, suggestive of either decayed plant roots or organic rich surface material that had been transported down cracks. No texture difference (by hand) was found despite the darker colour.
The sites had different clay content based on soil type (Figs 3 and 4). For Illogan (Dog Paddock) (Fig. 3) and Roscommon sites (Fig. 4), the clay content was lower than that of the Vertosol sites. Roscommon had clay concentration of less than 10% for the top 60 cm, which increased after this depth. Illogan (Dog Paddock) had a clay content of less than 40% for the top 25 cm, which increased after this depth. The Vertosols of Illogan (Shed Paddock) and Pembroke South all had clay concentrations >50% down the profile. Pembroke North had clay content >50% for the top 1 m, which declined after this depth. All soil cores had pH less than 7 (range 5–7). There was a generally increasing trend in bulk density with depth for all sites.
Clay content depth concentration at Illogan: (top) Dog Paddock and (bottom) Shed Paddock. Dog Paddock had four soil profiles and Shed Paddock had three individual soil profiles samples in each trench, with each profile approximately 1 m apart to provide replicates.
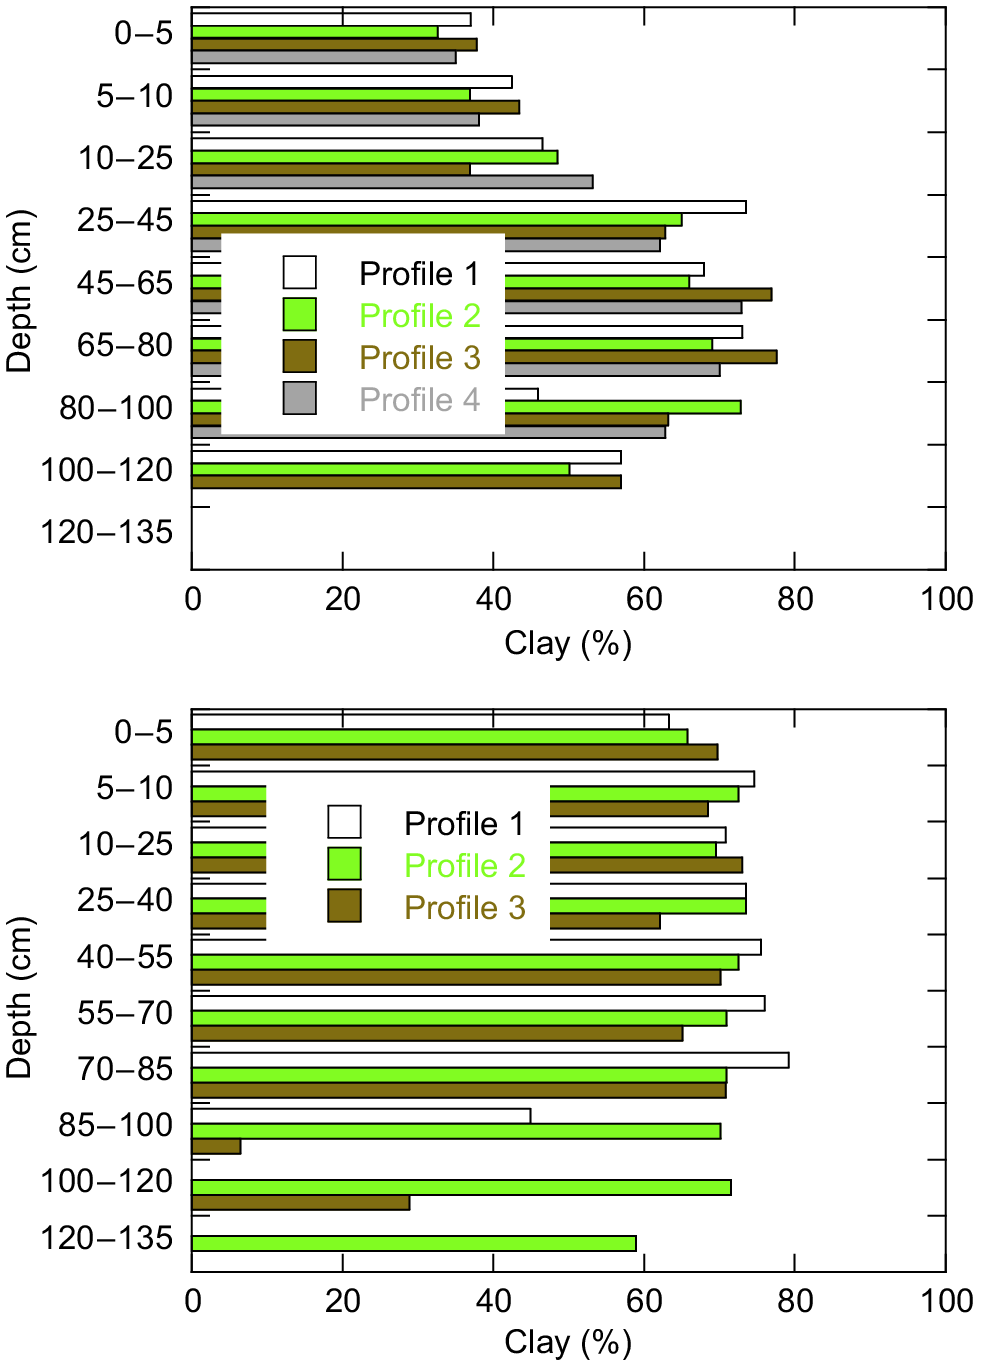
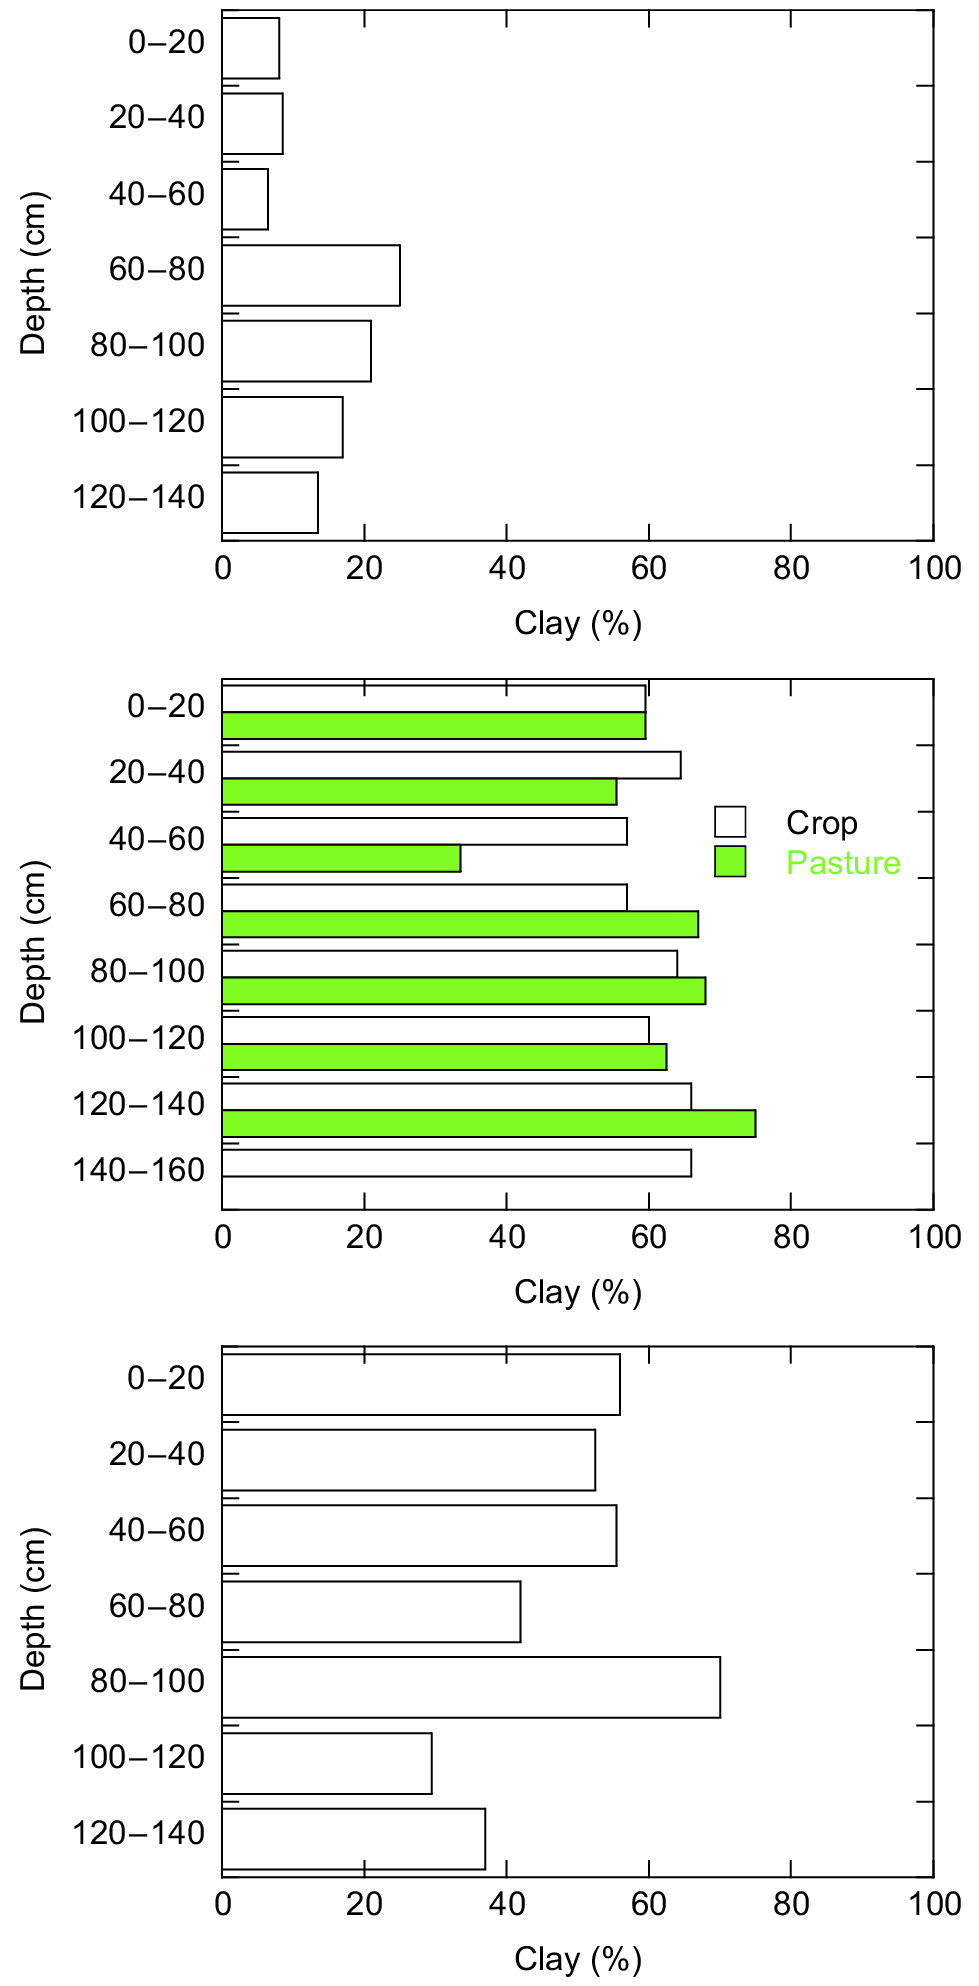
Clay content depth concentration for (top) Roscommon, (middle) Pembroke South cropped and pasture and (bottom) Pembroke North.
Total SOC varied considerably for each site (Table 2). Here SOC is expressed in terms of carbon stock. Roscommon had the lowest stock (~65 t ha−1) and Pembroke North the highest (402 t ha−1). For the Illogan sites, there was considerable variability at each trench. Stocks had range of 77–84 t ha−1 for Dog Paddock and 94–166 t ha−1 for Shed Paddock. In general, the lower clay sites (Roscommon and Dog Paddock) had the lowest SOC stocks, with the higher clay Vertosols having the largest stock.
All sites had unique SOC depth distribution profiles. For Illogan (Dog Paddock), SOC was concentrated at the 5–10 cm depth and for Shed Paddock, SOC was concentrated at greater depths (Figs 5 and 6). The lower clay Roscommon site had SOC concentrated in the top 20 cm, with a rapid decline at depth. For Pembroke North and South, SOC was highest at the surface and declined down the profile.

Environmental tracer
All sites had a unique 137Cs depth distribution (Figs 7 and 8). All sites displayed a decrease in 137Cs with depth, except for Roscommon where it was present in the top 20 cm only. In the non-Vertosols (Illogan Dog Paddock and Roscommon), the migration of 137Cs appeared limited to approximately 20–25 cm maximum depth. For Vertosols, 137Cs was detected to depths of 60–80 cm (Pembroke North). For the Vertosol sites, the 137Cs depth distribution inconsistently declined in concentration down the profile. However, for Pembroke North, there was an absence of 137Cs at 40–60 cm, with detectable concentrations at 60–80 cm. Similarly for Pembroke South (cropped), there was an absence of 137Cs at 20–40 cm, with detectable concentrations at 40–60 cm. While we do not have data on cracking depths, this increased concentration suggests that this was a maximum potential crack depth and was the maximum depth that material labelled with 137Cs was translocated.

Discussion
All sites were selected based on their representativeness of the local area, landuse and being typical of local soils. All sites had soil depths greater than 1 m. Climatically the sites were very similar, yet there was a considerable difference in SOC content both on the soil surface and down the soil profile. A major difference at each site was soil texture. The Vertosol sites had high clay contents that varied little down the profile. The non-Vertosol soils all had less clay, with Dog Paddock having increasing clay down the soil profile and Roscommon having relatively little clay compared to the other sites. In general, more clay equated to greater SOC stock at these sites.
Down-profile SOC movement and SOC stock
There are two methods of delivery of labelled soil to depth: local and non-local supply (Murphy 2015). The Vertosols examined here have shrink–swell properties, with cracks developing as soil dries and allowing surface soil materials to fall into the cracks (Wilding and Tessier 1988). This material is then incorporated into the subsoil (i.e. pedoturbation) (Yaalon and Kalmar 1978). This process is responsible for the peaks in 137Cs activity found at depth, as labelled soil is transported down into the subsoil via cracks. Southard and Graham (1992) found 137Cs present in Vertosols at depths up to 72 cm. Al-Masri (2006) found the vertical distribution of 137Cs to be related to soil type, allowing movement of material to depth. Curtis (1996) also suggested that surface cracks enable soil fines labelled with 137Cs to move down the soil profile. Several other studies have examined the depth distribution of 137Cs and SOC. The oldest sites sampled to depth in the local area were sampled to bedrock in 2006 (Stanley catchment, Martinez et al. 2010) with 137Cs being present to depth. This suggests that transport of material down the soil profile predates the time of later sampling here.
For untilled non-cracking soils, the 137Cs depth distribution profile is that of an exponential decline within the top ~20 cm, with little 137Cs below this. The authors have demonstrated this to be the case for sites within the Krui catchment and surrounds (Martinez et al. 2009; Hancock et al. 2015). The relatively shallow presence of 137Cs at the non-Vertosol sites (Dog Paddock and Roscommon) suggests that the movement of SOC and other soil components from the surface is via diffusive processes (Wells et al. 2012, 2013; Wells and Hancock 2014).
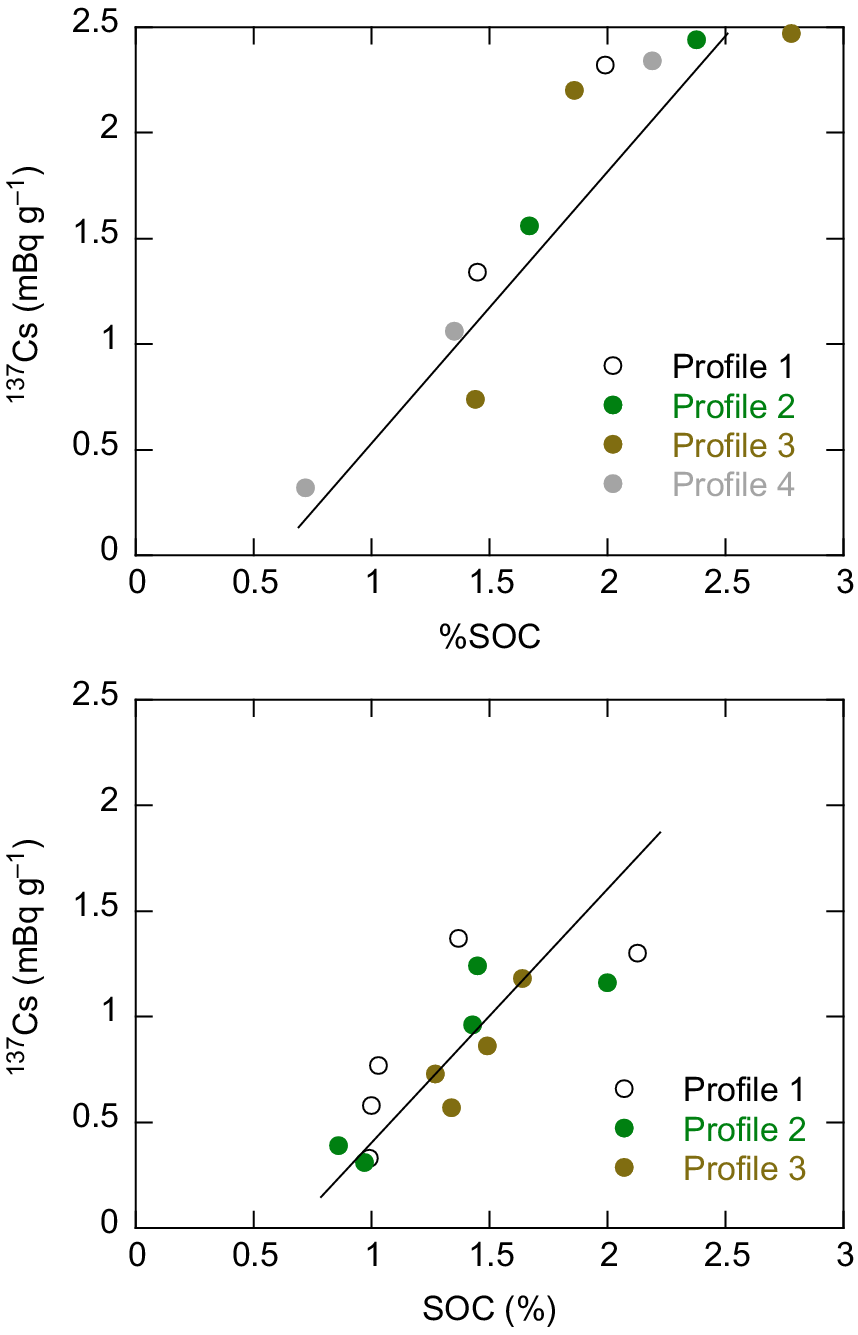
There were contrasting relationships with SOC and clay for the Vertosol and non-Vertosol sites. For the Dog Paddock, there was a significant result with SOC and clay (Fig. 9 top); however, there was no relationship at Shed Paddock (Fig. 9 bottom). This finding is a result of Dog Paddock having an increase in clay with depth (Fig. 3 top), with Shed Paddock having a constant clay content down the profile and no evident pattern (Fig. 3 bottom). Similar relationships were found for Pembroke South and North, with no significant relationship found with clay (not displayed for brevity). No relationship was found at Roscommon, likely due to the low SOC content and low clay (not shown for brevity).

There was a consistent and significant relationship with SOC and 137Cs for Dog and Shed Paddocks (r = 0.92, P < 0.001) (Fig. 10). Similar relationships were found for Pembroke South and North, but there was no relationship between SOC and clay or SOC and 137Cs for Roscommon. This suggests that clay is not the sole control on SOC movement at these sites (and likely other sites), and a portion of SOC associated with clay will move along pathways traced by 137Cs also fixed to clay.
Relationship between SOC and 137Cs for the Illogan: (top) Dog Paddock and (bottom) Shed Paddock. SOC and 137Cs were significantly correlated for both Dog Paddock (r = 0.92, P < 0.001) and Shed Paddock (r = 0.82, P < 0.002) when all profile data were combined.
The data here allow a means to determine an approximate age and rate of SOC movement down the profile. If we assume a maximum depth of 80 cm for the labelled material and that 137Cs arrived on the surface during 1945–1972, then this suggests that an age range of between 65 (2010 subtract 1945) and 38 years (2010 subtract 1972) of material using 2010 as an average date of sampling. Therefore, at the earliest, material has migrated to its maximum depth 65 years prior, with material assumed to be still migrating. At the other extreme, if labelled soil was only transported at the end of the fallout period in 1972, then the labelled material has a maximum age of approximately 40 years.
The age of 65 years can be considered a maximum age because there was no fallout prior to this. However, it is more likely that the labelled material is much younger than these ages and transported in less time. Soil would be continually migrating down the soil profile. The authors have observed cracks large enough to place an entire arm down in 2005 at Pembroke South. It is also likely that modern material is continuing to move down the profile. It is also recognised that the SOC quantified here may be much older than the 137Cs fallout period. However, dating (i.e. using carbon-14) of this SOC is beyond the scope of this project and using the approach here provides a first pass assessment of age and migration rate.
SOC contribution by erosion to depth and age
Murphy (2015) suggests that there are no definitive data to suggest a SOC content threshold for soil productivity. Smith et al. (2015) suggest that a SOC content of 2% is a threshold for soil erosion stability for Vertosols. Below 2%, soil aggregates slake, this being an inherent property of Vertosols. They found that that when SOC was greater than 3.5% in surface soil, aggregate stability was improved, suggesting an increase in SOC can reduce erosion. Here, there was a range of surface SOC concentration, with Illogan (Shed Paddock) having SOC of 1.81% while the Pembroke sites had range of 1.05–7.35% (Table 2). There was no visual evidence of soil structural decline or erosion at any of the sites.
There are no specific erosion rates for each site examined here. However, if we assume that the erosion rate is 5 t ha−1 year−1 (Martinez et al. 2009, 2010), and hillslope soils have an approximately 2–3% OC on the surface (assuming this is the most erosionally active or mobile layer), this provides 0.1–0.2 t ha−1 of eroded or potentially mobilised OC per year for the pasture sites. If all eroded sediment was captured by soil cracks then this would be a maximum of 0.2 t ha−1 year−1 (on average) of OC delivered down the soil profile. This is a likely gross overestimate and would be a maximum rate of delivery, as cracks will not always be present due to wetting up of the soil and closure of the cracks with eroded material and OC being transported over the cracks and downslope. Given that the SOC stock for the Vertosol sites exceeded 30 t ha−1 in the top 0.2 m (Figs 5 and 6), this suggests that only a small fraction of available SOC is provided by external delivery.
If we assume a maximum SOC age of approximately 40 years (based on the last atmospheric fallout in 1972) and that this material does not degrade once down in the profile, then this suggests a maximum of 4–8 t ha−1 of OC may be a result of external delivery. Therefore the majority of SOC is likely from in-situ production.
SOC and sequestration
There are several implications for carbon sequestration. The ability and extent to which SOC can be increased in the agricultural environment by adoption of different management and landuse is not well understood (Badgery et al. 2014; Murphy 2015; Hobley et al. 2016; Conrad et al. 2017). Some authors have concluded that the potential for increased SOC accumulation is limited in agricultural settings (Robertson and Nash 2013). Hoyle et al. (2013) suggest that the capacity to store more SOC in the surface is limited and that the subsoil has additional storage capacity.
The findings here demonstrated that SOC was highest for high clay sites and also suggests that organic carbon can be more readily translocated to depth in Vertosols than for other soils. In several soil pits (Illogan Shed Paddock and Pembroke South), the presence of 137Cs was not continuous down the profile, with an absence at one depth and detectable concentrations below. However, while having potential for rapid translocation, the exposure to oxygen and water provides an environment for breakdown of organic material. These feedbacks are likely to be complex, as the addition of organic matter at depth will change the soil shrink–swell properties and may either enhance or reduce OC breakdown (Murphy 2015). Long-term studies would provide insights into the capabilities of these soils to sequester OC.
There is potential for increasing SOC stocks at these sites. The similarity between the Shed Paddock and Pembroke South in terms of soil depth and clay content suggests that both sites have the potential to have similar SOC stock. However, Shed Paddock had considerably lower SOC stock than Pembroke South. The property is currently a well-run enterprise using no tillage for cropping and advanced management practices. How more biomass can be produced to increase SOC both at the surface and at depth while maintaining farm profitability is an open question.
Several authors have questioned how land management and vegetation can influence soil properties at depth (Pringle et al. 2011; Murphy 2015; Hobley et al. 2016; Conrad et al. 2017). Dalal et al. (2021) found that the introduction of a pasture phase in the cropping cycle may reduce SOC loss. Given that Roscommon and Pembroke North have never been cropped and, in recent decades, there have been no fertiliser inputs, how SOC can be increased is an important question, given that they are optimally economically managed (Badgery et al. 2014; Murphy 2015; Minasny et al. 2017).
Further issues and data needs
There are several possible explanations for the presence of 137Cs at depths greater than that driven by diffusive processes.
Soil disturbance or bulk mixing by mechanical means. Roscommon, Pembroke South (not cropped) and Pembroke North sites were selected due to the absence of any disturbance by tillage. At Illogan (both Dog and Shed Paddocks) tillage has occurred to a maximum depth of 30 cm, with no tillage since 1992 and minimum till practices employed since. The property owners reported that no tillage has occurred deeper than 30 cm since 1991. Therefore, bulk movement of material by mechanical means has not occurred at any of these sites.
Migration of soil along animal burrows (Butler 1995, 2018). Although rabbits are present in the area, they have not been present in large numbers. It could be that by chance we sampled sites where rabbits have been present but given the high clay soil and the difficulty of excavation (i.e. as observed by the author using a mechanical backhoe) it is unlikely that they have created deep burrows. Wombats are present in the area. However, the majority of their burrows are located in creek banks or sloping areas where the burrow commences laterally into the side of a slope. There were no wombat burrows anywhere near the sampling sites and no evidence of their former presence.
It is likely that soil has been, and continues to be, delivered to the cracks and moves down the profile via cracks – with cracking observed at Shed Paddock, Pembroke North and South sites. The process is likely to be episodic with drying periods opening up soil cracks and periods of rainfall that produce runoff delivering eroded surface soil to the cracks. We hypothesise that it is only large rainfall events that produce surface runoff in this environment to generate sufficient eroded material to be delivered to the cracks (Hancock et al. 2019).
Other tracers such as 7Be would provide storm-scale detail on the movement of surface materials (Zapata 2002; Walling et al. 2011). A pathway forward would be to sample down a soil profile with cracks immediately after a large storm and assess whether short-term tracers such as 7Be were detected. Dating of SOC (i.e. radiocarbon method) would provide information on longer ages. Carbon isotopes (i.e. δ13C) would also provide insights (i.e. Pringle et al. 2011) into plant-based carbon inputs as well as geochemical analysis (Lawrence et al. 2015). This is currently being investigated.
All soil samples were collected in a vertical line down the soil profile. There was no attempt to seek cracks or areas of darker soil suggestive of organic enrichment. Therefore, it is possible that considerably more labelled material has made its way further down the soil profile than that captured using the sampling method here of samples collected in a vertical line. More targeted sampling would provide further insights.
At Illogan, multiple profiles were collected for each trench and were sampled approximately 1 m from each other. Both sites demonstrated considerable variability in SOC even within the same trench (Table 2, Fig. 5). For carbon accounting this presents an issue not just for quantifying SOC on the surface but also evaluating SOC whole-profile stocks. This raises the question of how many soil profiles should be sampled such that a statistically defensible value can be obtained, given the variability observed here.
The findings highlight the need for more long-term field data (i.e. Conrad et al. 2017; Jha et al. 2020) and model development to provide enhanced understandings of whole soil profile SOC distribution and change (Luo et al. 2010) across a range of soil types and climates (Murphy 2015) as well agricultural management practices (Badgery et al. 2014). Innovation in surface and subsurface methodology for SOC quantification is needed to advance spatial and temporal distribution of SOC at the point and hillslope scale (Robertson and Nash 2013).
Conclusion
Whole soil-profile SOC and its depth distribution at sites with different soils and landuse but with similar rainfall and climate was assessed. All sites had relatively deep soil, providing potential for increased SOC sequestration. Results demonstrated that within short length-scales SOC stock varied considerably. The highest SOC stocks were in soils with the highest clay content, with less SOC in the more sandy soils. Using an environmental tracer (137Cs) demonstrated that SOC was reaching depths of up to 80 cm in soils with a high clay content over a maximum period of 65 years. The discontinuous distribution of 137Cs suggests an advective process of surface soil movement. The majority of this material was likely from in-situ production along cracks, with material delivered to depth during dry periods. In cracking soils, surface material can therefore be delivered relatively quickly down the profile.
Declaration of funding
This research was largely supported by Australian Research Council Discovery Grants (DP 0556941: ‘Carbon, nutrient and sediment dynamics in a semi-arid catchment’ and DP110101216: ‘A next generation spatially distributed model for soil profile dynamics and pedogenesis incorporating soil geochemistry and organic matter’).
Acknowledgements
The O’Brien, Goodear and Reynolds families are thanked for access to their properties and their support.
References
Al-Masri MS (2006) Vertical distribution and inventories of 137Cs in the Syrian soils of the eastern Mediterranean region. Journal of Environmental Radioactivity 86, 187-198.
| Crossref | Google Scholar | PubMed |
Baah-Acheamfour M, Chang SX, Carlyle CN, Bork EW (2015) Carbon pool size and stability are affected by trees and grassland cover types within agroforestry systems of western Canada. Agriculture, Ecosystems & Environment 213, 105-113.
| Crossref | Google Scholar |
Badgery WB, Simmons AT, Murphy BW, Rawson A, Andersson KO, Lonergan VE (2014) The influence of land use and management on soil carbon levels for crop-pasture systems in Central New South Wales, Australia. Agriculture, Ecosystems & Environment 196, 147-157.
| Crossref | Google Scholar |
Butler DR (2018) Zoogeomorphology in the Anthropocene. Geomorphology 303, 146-154.
| Crossref | Google Scholar |
Cardinael R, Chevallier T, Barthès BG, Saby NPA, Parent T, Dupraz C, Bernoux M, Chenu C (2015) Impact of alley cropping agroforestry on stocks, forms and spatial distribution of soil organic carbon – a case study in a Mediterranean context. Geoderma 259–260, 288-299.
| Crossref | Google Scholar |
Conrad KA, Dalal RC, Dalzell SA, Allen DE, Menzies NW (2017) The sequestration and turnover of soil organic carbon in subtropical leucaena-grass pastures. Agriculture, Ecosystems & Environment 248, 38-47.
| Crossref | Google Scholar |
Cunningham SC, Metzeling KJ, Nally RM, Thomson JR, Cavagnaro TR (2012) Changes in soil carbon of pastures after afforestation with mixed species: sampling, heterogeneity and surrogates. Agriculture, Ecosystems & Environment 158, 58-65.
| Crossref | Google Scholar |
Dalal RC, Thornton CM, Allen DE, Owens JS, Kopittke PM (2021) Long-term land use change in Australia from native forest decreases all fractions of soil organic carbon, including resistant organic carbon, for cropping but not sown pasture. Agriculture, Ecosystems & Environment 311, 107326.
| Crossref | Google Scholar |
Davy MC, Koen TB (2013) Variations in soil organic carbon for two soil types and six land uses in the Murray Catchment, New South Wales, Australia. Soil Research 51, 631-644.
| Crossref | Google Scholar |
Doetterl S, Six J, Van Wesemael B, Van Oost K (2012) Carbon cycling in eroding landscapes: geomorphic controls on soil organic C pool composition and C stabilization. Global Change Biology 18(7), 2218-2232.
| Crossref | Google Scholar |
Doetterl S, Stevens A, Six J, Merckx R, Van Oost K, Casanova Pinto M, Casanova-Katny A, Muñoz C, Boudin M, Zagal Venegas E, Boeckx P (2015) Soil carbon storage controlled by interactions between geochemistry and climate. Nature Geoscience 8(10), 780-783.
| Crossref | Google Scholar |
Doetterl S, Berhe AA, Nadeu E, Wang Z, Sommer M, Fiener P (2016) Erosion, deposition and soil carbon: a review of process-level controls, experimental tools and models to address C cycling in dynamic landscapes. Earth-Science Reviews 154, 102-122.
| Crossref | Google Scholar |
Elliott GL, Loughran RJ, Packer I, Maliszewski LT, Curtis SJ, Saynor MJ, Morris CD, Epis RB (1997) A national reconnaissance survey of soil erosion in Australia: New South Wales, A report prepared for the Australian National Landcare Program, Department of Primary Industries and Energy. Project Number 1989-90: No. 8. The University of Newcastle, NSW, Australia.
Fissore C, Dalzell BJ, Berhe AA, Voegtle M, Evans M, Wu A (2017) Influence of topography on soil organic carbon dynamics in a Southern California grassland. Catena 149, 140-149.
| Crossref | Google Scholar |
George SJ, Harper RJ, Hobbs RJ, Tibbett M (2012) A sustainable agricultural landscape for Australia: a review of interlacing carbon sequestration, biodiversity and salinity management in agroforestry systems. Agriculture, Ecosystems & Environment 163, 28-36.
| Crossref | Google Scholar |
Gregorich EG, Greer KJ, Anderson DW, Liang BC (1998) Carbon distribution and losses: erosion and deposition effects. Soil and Tillage Research 47, 291-302.
| Crossref | Google Scholar |
Hancock GR, Wells T, Martinez C, Dever C (2015) Soil erosion and tolerable soil loss: insights into erosion rates for a well-managed grassland catchment. Geoderma 237–238, 256-265.
| Crossref | Google Scholar |
Hancock GR, Kunkel V, Wells T, Martinez C (2019) Soil organic carbon and soil erosion – Understanding change at the large catchment scale. Geoderma 343, 60-71.
| Crossref | Google Scholar |
Hao Y, Lal R, Izaurralde RC, Ritchie JC, Owens LB, Hothem DL (2001) Historic assessment of agricultural impacts on soil and soil organic carbon erosion in an Ohio watershed. Soil Science 166(2), 116-126.
| Crossref | Google Scholar |
Hobley EU, Baldock J, Wilson B (2016) Environmental and human influences on organic carbon fractions down the soil profile. Agriculture, Ecosystems & Environment 223, 152-166.
| Crossref | Google Scholar |
Hoyle FC, D’Antuono M, Overheu T, Murphy DV (2013) Capacity for increasing soil organic carbon stocks in dryland agricultural systems. Soil Research 51, 657-667.
| Crossref | Google Scholar |
Huang X, Senthilkumar S, Kravchenko A, Thelen K, Qi J (2007) Total carbon mapping in glacial till soils using near-infrared spectroscopy, Landsat imagery and topographical information. Geoderma 141, 34-42.
| Crossref | Google Scholar |
Jha P, Hati KM, Dalal RC, Dang YP, Kopittke PM, Menzies NW (2020) Soil carbon and nitrogen dynamics in a Vertisol following 50 years of no-tillage, crop stubble retention and nitrogen fertilization. Geoderma 358, 113996.
| Crossref | Google Scholar |
Korkanç SY (2014) Effects of afforestation on soil organic carbon and other soil properties. Catena 123, 62-69.
| Crossref | Google Scholar |
Kuhn NJ, Hoffmann T, Schwanghart W, Dotterweich M (2009) Agricultural soil erosion and global carbon cycle: controversy over? Earth Surface Processes and Landforms 34, 1033-1038.
| Crossref | Google Scholar |
Kunkel V, Wells T, Hancock GR (2016) Soil temperature dynamics at the catchment scale. Geoderma 273, 32-44.
| Crossref | Google Scholar |
Kunkel V, Hancock GR, Wells T (2019) Large catchment-scale spatiotemporal distribution of soil organic carbon. Geoderma 334, 175-185.
| Crossref | Google Scholar |
Lawrence CR, Harden JW, Xu X, Schulz MS, Trumbore SE (2015) Long-term controls on soil organic carbon with depth and time: a case study from the Cowlitz River Chronosequence, WA USA. Geoderma 247–248, 73-87.
| Crossref | Google Scholar |
Li Y, Zhang QW, Reicosky DC, Bai LY, Lindstrom MJ, Li L (2006) Using 137Cs and 210Pbex for quantifying soil organic carbon redistribution affected by intensive tillage on steep slopes. Soil and Tillage Research 86, 176-184.
| Crossref | Google Scholar |
Li Y, Zhang QW, Reicosky DC, Lindstrom MJ, Bai LY, Li L (2007) Changes in soil organic carbon induced by tillage and water erosion on a steep cultivated hillslope in the Chinese Loess Plateau from 1898–1954 and 1954–1998. Journal of Geophysical Research 112, G01021.
| Crossref | Google Scholar |
Lorenz K, Lal R (2005) The depth distribution of soil organic carbon in relation to land use and management and the potential of carbon sequestration in subsoil horizons. Advances in Agronomy 88, 35-66.
| Crossref | Google Scholar |
Loughran RJ (1994) The use of the environmental isotope caesium-137 for soil erosion and sedimentation studies. Trends in Hydrology 1, 149-167.
| Google Scholar |
Luo Z, Wang E, Sun OJ (2010) Soil carbon change and its responses to agricultural practices in Australian agro-ecosystems: a review and synthesis. Geoderma 155, 211-223.
| Crossref | Google Scholar |
Mabit L, Bernard C, Makhlouf M, Laverdière MR (2008) Spatial variability of erosion and soil organic matter content estimated from 137Cs measurements and geostatistics. Geoderma 145, 245-251.
| Crossref | Google Scholar |
Martinez C, Hancock GR, Kalma JD (2009) Comparison of fallout radionuclide (caesium-137) and modelling approaches for the assessment of soil erosion rates for an uncultivated site in south-eastern Australia. Geoderma 151, 128-140.
| Crossref | Google Scholar |
Martinez C, Hancock GR, Kalma JD (2010) Relationships between 137Cs and soil organic carbon (SOC) in cultivated and never-cultivated soils: an Australian example. Geoderma 158, 137-147.
| Crossref | Google Scholar |
Minasny B, Malone BP, McBratney AB, Angers DA, Arrouays D, Chambers A, Chaplot V, Chen Z-S, Cheng K, Das BS, Field DJ, Gimona A, Hedley CB, Hong SY, Mandal B, Marchant BP, Martin M, McConkey BG, Mulder VL, O’Rourke S, Richer-de-Forges AC, Odeh I, Padarian J, Paustian K, Pan G, Poggio L, Savin I, Stolbovoy V, Stockmann U, Sulaeman Y, Tsui C-C, Vågen T-G, Van Wesemael B, Winowiecki L (2017) Soil carbon 4 per mille. Geoderma 292, 59-86.
| Crossref | Google Scholar |
Mora JL, Guerra JA, Armas-Herrera CM, Arbelo CD, Rodríguez-Rodríguez A (2014) Storage and depth distribution of organic carbon in volcanic soils as affected by environmental and pedological factors. Catena 123, 163-175.
| Crossref | Google Scholar |
Murphy BW (2015) Impact of soil organic matter on soil properties – a review with emphasis on Australian soils. Soil Research 53, 605-635.
| Crossref | Google Scholar |
Olson KR, Al-Kaisi MM (2015) The importance of soil sampling depth for accurate account of soil organic carbon sequestration, storage, retention and loss. Catena 125, 33-37.
| Crossref | Google Scholar |
Page M, Trustrum N, Brackley H, Baisden T (2004) Erosion-related soil carbon fluxes in a pastoral steepland catchment, New Zealand. Agriculture, Ecosystems & Environment 103(3), 561-579.
| Crossref | Google Scholar |
Pringle MJ, Allen DE, Dalal RC, Payne JE, Mayer DG, O’Reagain P, Marchant BP (2011) Soil carbon stock in the tropical rangelands of Australia: effects of soil type and grazing pressure, and determination of sampling requirement. Geoderma 167–168, 261-273.
| Crossref | Google Scholar |
Quinton JN, Govers G, Van Oost K, Bardgett RD (2010) The impact of agricultural soil erosion on biogeochemical cycling. Nature Geoscience 3, 311-314.
| Crossref | Google Scholar |
Ritchie JC, McCarty GW (2003) 137Cesium and soil carbon in a small agricultural watershed. Soil and Tillage Research 69, 45-51.
| Crossref | Google Scholar |
Robertson F, Nash D (2013) Limited potential for soil carbon accumulation using current cropping practices in Victoria, Australia. Agriculture, Ecosystems & Environment 165, 130-140.
| Crossref | Google Scholar |
Rüdiger C, Hancock G, Hemakumara HM, Jacobs B, Kalma JD, Martinez C, Thyer M, Walker JP, Wells T, Willgoose GR (2007) Goulburn River experimental catchment data set. Water Resources Research 43, W10403.
| Crossref | Google Scholar |
Smith R, Tongway D, Tighe M, Reid N (2015) When does organic carbon induce aggregate stability in vertosols? Agriculture, Ecosystems & Environment 201, 92-100.
| Crossref | Google Scholar |
Southard RJ, Graham RC (1992) Cesium-137 distribution in a California Pelloxerert: evidence of pedoturbation. Soil Science Society of America Journal 56, 202-207.
| Crossref | Google Scholar |
Starr GC, Lal R, Malone R, Hothem D, Owens L, Kimble J (2000) Modeling soil carbon transported by water erosion processes. Land Degradation & Development 11(1), 83-91.
| Crossref | Google Scholar |
VandenBygaart AJ (2001) Erosion and deposition history derived by depth-stratigraphy of 137Cs and soil organic carbon. Soil and Tillage Research 61, 187-192.
| Crossref | Google Scholar |
Van Oost K, Govers G, Quine TA, Heckrath G, Olesen JE, De Gryze S, Merckx R (2005) Landscape-scale modeling of carbon cycling under the impact of soil redistribution: the role of tillage erosion. Global Biogeochemical Cycles 19, GB4014.
| Crossref | Google Scholar |
Walling DE, He Q (1999) Improved models for estimating soil erosion rates from cesium-137 measurements. Journal of Environmental Quality 28(2), 611-622.
| Crossref | Google Scholar |
Walling DE, He Q (2001) Models for converting 137Cs measurements to estimates of soil redistribution rates on cultivated and uncultivated soils, and estimating bomb derived 137Cs reference inventories (including software for model implementation). A contribution to the IAEA Coordinated Research Programmes on Soil Erosion (D1.50.05) and Sedimentation (F3.10.01). University of Exeter. p. 32.
Walling DE, Zhang Y, He Q (2011) Models for deriving estimates of erosion and deposition rates from fallout radionuclide (caesium-137, excess lead-201, and beryllium-7) measurements and the development of user friendly software for model implementation. Impact of soil conservation measures on erosion control and soil quality. IAEA-TECDOC-1665. IAEA. pp. 11–33.
Wang B, Gray JM, Waters CM, Rajin Anwar M, Orgill SE, Cowie AL, Feng P, Li Liu D (2022) Modelling and mapping soil organic carbon stocks under future climate change in south-eastern Australia. Geoderma 405, 115442.
| Crossref | Google Scholar |
Wells T, Hancock G (2014) Comparison of vertical transport of 137Cs and organic carbon in agricultural cracking soils. Geoderma 214–215, 228-238.
| Crossref | Google Scholar |
Wells T, Hancock GR, Dever C, Murphy D (2012) Prediction of vertical soil organic carbon profiles using soil properties and environmental tracer data at an untilled site. Geoderma 170, 337-346.
| Crossref | Google Scholar |
Wells T, Hancock GR, Dever C, Martinez C (2013) Application of RothPC-1 to soil carbon profiles in cracking soils under minimal till cultivation. Geoderma 207–208(0), 144-153.
| Crossref | Google Scholar |
Willgoose G (2018) ‘Principles of soilscape and landscape evolution.’ (Cambridge University Press: Cambridge, UK) p. 356. 10.1017/9781139029339
Yaalon DH, Kalmar D (1978) Dynamics of cracking and swelling clay soils: displacement of skeletal grains, optimum depth of slickensides, and rate of intra-pedonic turbation. Earth Surface Processes 3, 31-42.
| Crossref | Google Scholar |
Yoo K, Amundson R, Heimsath AM, Dietrich WE (2006) Spatial patterns of soil organic carbon on hillslopes: integrating geomorphic processes and the biological C cycle. Geoderma 130, 47-65.
| Crossref | Google Scholar |