

Multi-decadal trends in large-bodied fish populations in the New South Wales Murray–Darling Basin, Australia
D. A. Crook A # * , H. T. Schilling A # * , D. M. Gilligan A C , M. Asmus A , C. A. Boys A , G. L. Butler A , L. M. Cameron A , D. Hohnberg A , L. E. Michie A , N. G. Miles A , T. S. Rayner A , W. A. Robinson B , M. L. Rourke A , J. R. Stocks A , J. D. Thiem A , A. Townsend A , D. E. van der Meulen A , I. Wooden A and K. J. M. Cheshire A
A NSW Department of Primary Industries, Buckingbong Road, Narrandera, NSW 2700, Australia.
B Gulbali Institute for Agriculture, Water and Environment, Charles Sturt University, PO Box 789, Albury, NSW 2640, Australia.
C Present address: Bush Heritage Australia, 395 Collins Street, Melbourne, Vic. 3000, Australia.
Handling Editor: Gerry Closs
Marine and Freshwater Research 74(11) 899-916 https://doi.org/10.1071/MF23046
Submitted: 7 March 2023 Accepted: 12 May 2023 Published: 5 June 2023
© 2023 The Author(s) (or their employer(s)). Published by CSIRO Publishing. This is an open access article distributed under the Creative Commons Attribution-NonCommercial-NoDerivatives 4.0 International License (CC BY-NC-ND)
Abstract
Context: Native fish populations in Australia’s Murray–Darling Basin (MDB) have experienced severe declines since European settlement. Information on their status is needed to guide management and recovery.
Aims: To quantify trends in MDB fish populations in New South Wales (NSW) from 1994 to 2022.
Methods: Relative abundance, biomass, and size structure were examined using generalised additive mixed models at NSW MDB and river catchment (valley) scales for five native species (Murray cod, Maccullochella peelii; golden perch, Macquaria ambigua; silver perch, Bidyanus bidyanus; Macquarie perch, Macquaria australasica; freshwater catfish, Tandanus tandanus) and one alien species (common carp, Cyprinus carpio).
Key results: There was strong inter-annual variation in relative abundance, biomass and population structure for all species. At the Basin scale, relative abundance of Murray cod, golden perch and common carp increased across the time series, with no clear trends for silver perch, Macquarie perch or freshwater catfish. Patterns in relative abundance, biomass, and population structure were variable among valleys for most species.
Conclusions and implications: Although native fish populations in the MDB remain degraded and face escalating threats, recent increases in the abundance of some native species are an encouraging sign that integrated restoration efforts can improve the outlook for native fish.
Keywords: biomonitoring, fish, fish biomass, fisheries, electrofishing, population trends, recruitment, relative abundance, river restoration.
Introduction
Freshwater fishes are highly vulnerable to anthropogenic disturbance and have experienced major declines in many regions of the world over the past century (Feio et al. 2023). In Australia’s Murray–Darling Basin (MDB), the continent’s largest river basin with an area of >1 × 10⁶ km2, native fish populations are widely considered to be in a highly degraded state (Kearney and Kildea 2004; Koehn et al. 2014a, 2020). During development of the Murray–Darling Basin Commission’s Native Fish Strategy, an expert panel estimated a decline in native fish abundance of ~90% since European settlement (Murray–Darling Basin Commission 2003). More recently, the expert technical panel advising the Native Fish Recovery Strategy of the Murray–Darling Basin Authority (2020) concluded that native fish populations have declined even further since the 2003 assessment. The decline of native fish in the MDB has been attributed to a wide range of human disturbances, including changes to the hydrological regime, habitat degradation, river regulation and infrastructure, over-fishing, and impacts from alien species (Koehn and Lintermans 2012; Lintermans 2013a). Climate change is predicted to amplify these impacts, with increasing water temperatures and decreasing rainfall leading to a loss of climatically suitable habitat for most native fish species over coming decades (CSIRO 2008; Galego de Oliveira et al. 2019).
Monitoring of temporal variation in the status of fish populations provides fundamental information for the development and prioritisation of policy and management initiatives to mitigate threats to native fish. Nonetheless, many monitoring programs lack long-term funding commitment and the rigorous design and sampling protocols for collection of data over a sufficiently long period to ensure sufficient statistical power to detect trends or changes in fish populations (Radinger et al. 2019). In the MDB, initial monitoring of fish populations was conducted for stock assessment of commercial fisheries by the collation of catch records (Reid et al. 1997). As commercial fisheries across the MDB were progressively closed, monitoring effort moved towards fishery-independent surveys (primarily using electrofishing), which have been routinely undertaken since the early 1990s (e.g. New South Wales, NSW, Rivers Survey, Harris and Gehrke 1997; Sustainable Rivers Audit, Davies et al. 2010; MDB Fish Survey, Murray–Darling Basin Authority 2014; Commonwealth Environmental Water Holder’s Long Term Intervention Monitoring, Stoffels et al. 2016; NSW Department of Planning, Industry and Environment 2020).
Outputs from these monitoring programs have mainly been used to report on spatial patterns in diversity or abundance (e.g. Gehrke and Harris 2000; Chessman 2013) and to generate report-card style indices that summarise the status of fish populations over specific reporting periods (e.g. ‘index of Biotic Integrity, Harris and Silveira 1999; ‘fish index’, Davies et al. 2010). Although such metrics provide easily communicated ‘snapshots’ of fish population status, their categorical and aggregative nature limits their utility for quantitative analyses of temporal variability. Direct analysis of standardised monitoring data at relevant spatial scales can provide important temporal context for policy and management by allowing contemporary population status to be considered as part of a long-term time series. The past three decades of fish monitoring in the MDB has generated data with considerable potential to provide this critical information.
In this study, we use existing monitoring data to examine multi-decadal trends (1994–2022) in the status of several large-bodied fish species in the NSW portion of the MDB (~57% of the area of the MDB). Using mixed models in a two-step process, we analyse trends in relative abundance, biomass, and size structure at NSW MDB and river catchment (valley) scales in NSW for five native species (Murray cod, Maccullochella peelii; golden perch, Macquaria ambigua; silver perch, Bidyanus bidyanus; Macquarie perch, Macquaria australasica; freshwater catfish, Tandanus tandanus) and one alien species (common carp, Cyprinus carpio). We discuss the importance of long-term data to contextualising the contemporary condition of fish populations and emphasise the need to monitor and manage species at appropriate spatial and temporal scales.
Methods
Data extraction and preparation
Data were extracted from the NSW Department of Primary Industries (NSW DPI) Fisheries Freshwater Ecosystem database encompassing data collected during 142 monitoring and research projects between 1994 and December 2022. This database includes catch (abundance of each species) and biological (length, weights, health assessments, etc.) data collected using a range of methods, including various forms of electrofishing, net samples, angling and eDNA surveys. At the time of writing, 14 110 sampling events (consisting of multiple samples) were recorded in the database across 4757 sites, with >2 million fish sampled from 219 taxa. The electrofishing data (boat and backpack methods) were collected using standardised techniques (see Robinson et al. 2019 for details). Although there is some variation in the number of samples taken at each site among projects, boat electrofishing surveys (i.e. sampling events) usually consisted of 10–12 ‘shots’ of 90-s power on time, whereas backpack electrofishing surveys usually consisted of 8–10 shots of 150-s power on time.
To generate a dataset suitable for analysis, all electrofishing data (boat and backpack methods) from the NSW MDB were extracted and then filtered to include only records including site latitude and longitude, and fishing effort (power on time). Research projects that targeted species for specific purposes (as opposed to representative fish-assemblage surveys) were identified and excluded from the analysis. Each record contained the catch for a single species in a single electrofishing shot (hereafter referred to as a ‘sample’; previous work has sometimes referred to this as an ‘operation’). This resulted in 58 253 samples suitable for analysis, although not all samples were used in all analyses as detailed below (Table 1, Fig. 1). During sampling, most fish that were collected had length in millimetres (total length, TL, for round-tailed species or fork length, FL, for fork-tailed species) recorded (at least the first 50 of a species in each sampling event). A subset of fish was also weighed to the nearest gram. To facilitate biomass estimates from the available length data, bias-corrected length–weight relationships for each species were derived by pooling all corresponding length and weight measurements across the dataset. Full details of the length–weight relationships are provided in Supplementary Table S1.
| Species | Boat electrofishing (%) | Backpack electrofishing (%) | Number of sites species sampled | Number of events the species was detected |
|---|---|---|---|---|
| Murray cod | 15 376 (96.2) | 612 (3.8) | 699 | 1411 |
| Golden perch | 13 946 (98.9) | 153 (1.1) | 808 | 1575 |
| Silver perch | 1113 (98.9) | 12 (1.1) | 209 | 421 |
| Macquarie perch | 191 (40.55) | 280 (59.45) | 51 | 111 |
| Freshwater catfish | 908 (58.0) | 657 (42.0) | 255 | 383 |
| Common carp | 129 473 (86.5) | 20 245 (13.5) | 1530 | 2247 |
Numbers show the total number of individuals collected by each method and the percentage of total collected by each method. The number of sites that each species was collected and the number of sampling events (days) that each species was collected are also shown.
Map of the 10 valleys (water-resource planning areas) included in the current study (NSW Murray–Darling Basin, MDB) in colour, with other parts of the MDB shown in grey. Major rivers and streams are shown in dark grey. The Barwon–Darling Watercourse includes only the main channel, so has been buffered to be visible on the map. Crosses mark the locations of electrofishing sites included in the current analysis (n = 2185). Abbreviations show the surrounding Australian states: NSW, New South Wales, SA, South Australia, Qld, Queensland; Vic., Victoria. The inset map shows the location of the study within Australia, highlighting the MDB.
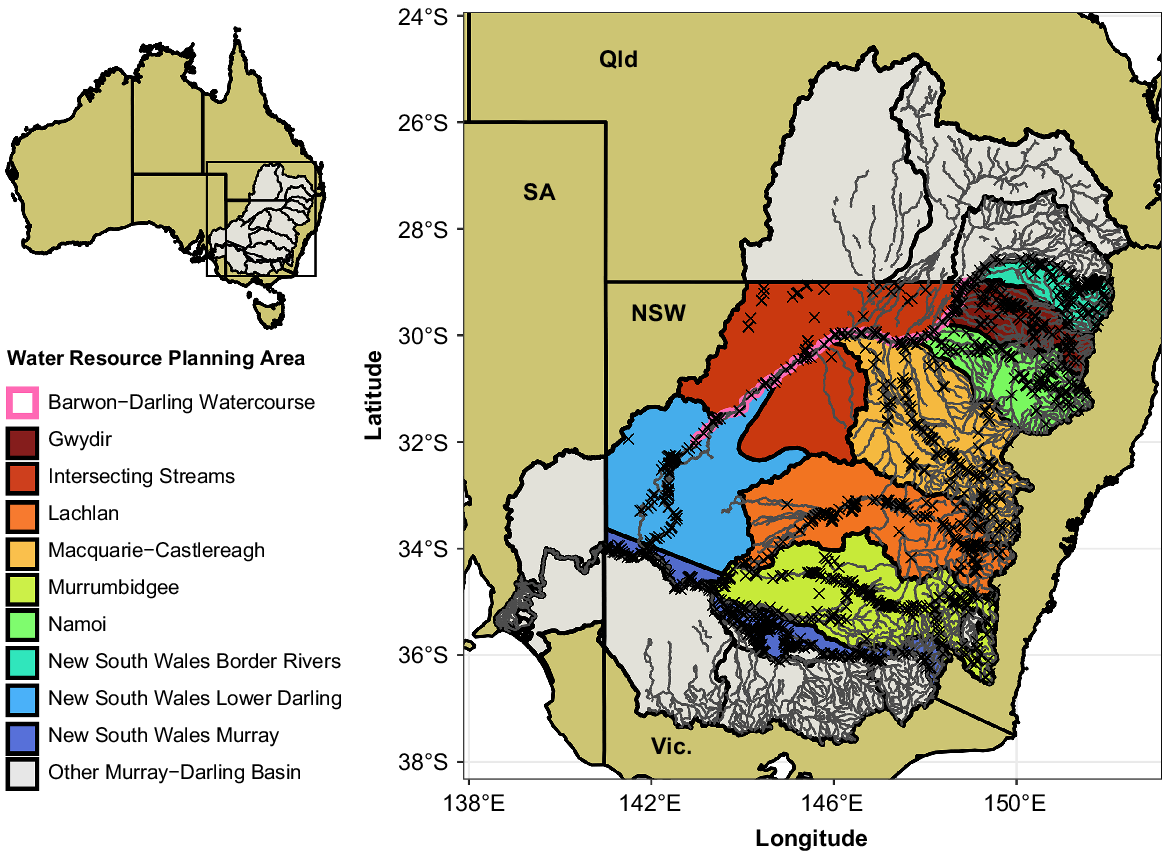
All data preparation and analysis after extraction was conducted using R (ver. 4.2.1, R Foundation for Statistical Computing: Vienna, Austria, see https://www.r-project.org/), and data manipulation and visualisation used the ‘tidyverse’ package (ver. 1.3.1, see https://cran.r-project.org/package=tidyverse; Wickham et al. 2019). Using latitude and longitude values, each sample was matched to a NSW Water Resource Planning Area (WRPA; Murray–Darling Basin Authority 2021), henceforth referred to as ‘valleys’. The ‘NSW Murray and Lower Darling’ WRPA was split into ‘NSW Murray’ and ‘NSW Lower Darling’ valleys, as we considered these distinct geographic regions for the purposes of our analyses. This resulted in 10 valleys across the NSW MDB (Fig. 1). To prepare a dataset suitable for analysis for each species, we included all data from sites that had at least one record of the species and excluded data from sites where the species was never recorded (Table 1). This approach allowed for assessment of changes in relative abundance within each species’ contemporary known geographic range.
The fish surveys that generated the data used in our analyses were conducted under permits approved by the NSW Fisheries Animal Care and Ethics Committee.
Relative abundance models
To examine trends in relative abundance at the NSW MDB scale, four generalised additive mixed models (GAMMs) were run for each species and the goodness of fit for each model was compared using simulated residuals to select the most appropriate model. All models contained the same structure and differed only in the error distribution. The four error distributions tested for each species included Poisson, negative binomial, zero-inflated Poisson and zero-inflated negative binomial. These were selected as possible appropriate distributions on the basis of the abundance data being positive integer count data with a large proportion of zeros. Owing to the complexity of the zero-inflated error distributions, all models were fit in a Bayesian framework by using default weakly informative priors, four chains, and 2000 or 5000 iterations for each chain depending on convergence (half as warm-up), implemented using the ‘brms’ R package (ver. 2.17.0, see https://cran.r-project.org/package=brms; Bürkner 2017, 2018). For species where a single electrofishing method accounted for 90% of the species catch (boat: Murray cod, golden perch, silver perch), we discarded the other method and used the following model:
where s(time) is a thin-plate regression spline where time is modelled as days since the first sampling event, (1|Site) is a random intercept effect for each unique site, and (1|fDate) is a random intercept for each date of sampling. These random effects account for the natural dependency structures within this dataset with repeated sampling at some sites and some sites being sampled on the same dates. The random effects also account for factors such as varying efficiency of electrofishing, depending on the environmental conditions (Lyon et al. 2014; Gwinn et al. 2019).
For species where both methods accounted for >10% of the total catch (freshwater catfish, Macquarie perch, common carp; Table 1), we incorporated the electrofishing method as a random slope effect with the following model:
The inclusion of Method as a fixed term in addition to the random slope allows the estimates for each method to have differing intercepts. Using the ‘DHARMa’ R package (ver. 0.4.5, F. Hartig, see https://CRAN.R-project.org/package=DHARMa), the most appropriate models for each species were selected on the basis of simulated model residuals as follows: Murray cod and silver perch, negative binomial; golden perch, zero-inflated negative binomial; freshwater catfish, Macquarie perch and common carp, negative binomial with Method random slope. To visualise the temporal trends in abundance, we generated prediction plots for each species on the basis of the expectation of the posterior predictive distribution, not including the random effects, by using the R package ‘tidybayes’ (ver. 3.0.2, see https://cran.r-project.org/package=tidybayes; Kay 2021).
Biomass models
To model biomass trends over time for each species at the NSW MDB scale, catch data were converted into biomass data by multiplying the abundance by the mean fitted weight of the catch on the basis of the observed lengths in each catch. We then ran models of similar structure to the abundance models by using only the boat electrofishing data. As biomass is a continuous positive variable with zeros, we used a ‘gamma hurdle’ error distribution, which combines a presence–absence style distribution with a gamma distribution, therefore allowing values of zero. The biomass models were also fitted within the Bayesian framework by using the same software as the relative abundance analysis, and had the following structure:
We initially tested the inclusion of backpack electrofishing data, but because of model convergence difficulties (specifically divergent transitions), we proceeded only with boat electrofishing data for the biomass modelling. It should be noted that, regardless of the suboptimal model fitting, when multiple methods were included, the resulting model outputs were similar in terms of temporal trends. To visualise the temporal trends in biomass, we generated prediction plots for each species on the basis of the expectation of the posterior predictive distribution, not including the random effects, by using the R package ‘tidybayes’ (Kay 2021).
Valley scale models
To understand variation in trends in both abundance and biomass, we ran a second series of GAMMs at the valley scale, incorporating a valley parameter. Similar model structures as described above were applied, except we incorporated a separate smooth over time for each valley. Only valleys where at least 30 individuals of a species and 40 relevant sampling events were recorded were included because initial analysis showed that error was too high for interpretation of the model outputs with lower sample sizes.
The valley-specific abundance model structures used the same error distributions as did the overall models. For species where boat electrofishing accounted for >90% of total catch (Murray cod, golden perch, silver perch):
And when both boat and backpack electrofishing accounted for >10% of the total catch (freshwater catfish, Macquarie perch, common carp):
The valley-specific biomass models also followed the structure of the overall biomass models described above, except for the inclusion of a valley-specific smooth over time, as follows:
To visualise the valley-specific temporal trends in abundance and biomass, we followed the same procedure as the overall Basin models and generated prediction plots for each species and valley combination on the basis of the expectation of the posterior predictive distribution, not including the random effects. Trends in relative biomass for each valley are provided in Supplementary Fig. S1, S3, S5, S7, S9 and S11.
Population size structure
For each species, all available length measurements during a year (July–June) were pooled and used to generate density plots, such that the area under each curve was equal (to control for differing sample sizes among years). Differences among years were then assessed visually. To generate valley and species plots, we followed the same method but filtered the data for each valley and species combination. Annual population-size structure graphs for each valley are provided in Supplementary Fig. S2, S4, S6, S8, S10 and S12.
Results
NSW Basin-scale temporal trends in abundance, biomass and size structure
There were complex temporal trends both within and among species at the NSW Basin-scale in relative abundance and biomass on the basis of GAMM analyses (Fig. 2). Murray cod relative abundance increased sharply from a low level in the mid-late 1990s and peaked c. 2008, before falling until 2012. Abundance then increased and remained relatively stable from 2015 to 2022 (Fig. 2a). The biomass of Murray cod also increased sharply from a low level in the late 1990s (Fig. 2b). However, biomass peaked c. 2003 and declined until 2008, which was coincident with a decrease in the median size of fish (Fig. 2b, c). Biomass and median size of Murray cod increased from 2008 to 2017, before declining again between 2018 and 2022.
Fitted trends in relative abundance (a, d, g, j, m, p), relative biomass (b, e, h, k, n, q) and length distributions (c, f, i, l, o, r) of each species across the period 1994–2022. Relative abundance and biomass trends are based on the GAMM analysis. Plots were generated using draws from the posterior predictions, excluding random effects for a sampling duration of 90 s of electrofishing. Length (cm) distributions are pooled by year (July–June) to give annual distributions. The length–density plots were adjusted such that the blue area under each curve was equal among years to control for differing annual sample sizes. The horizontal line in the length–density plots represents the median length. Note that the y-axes vary among plots and (r) appears compressed as there were a few large carp but too few for the densities to be visible. Rug plots (tick marks) on the x-axis show distribution of sampling events through time from 1994 to 2022.
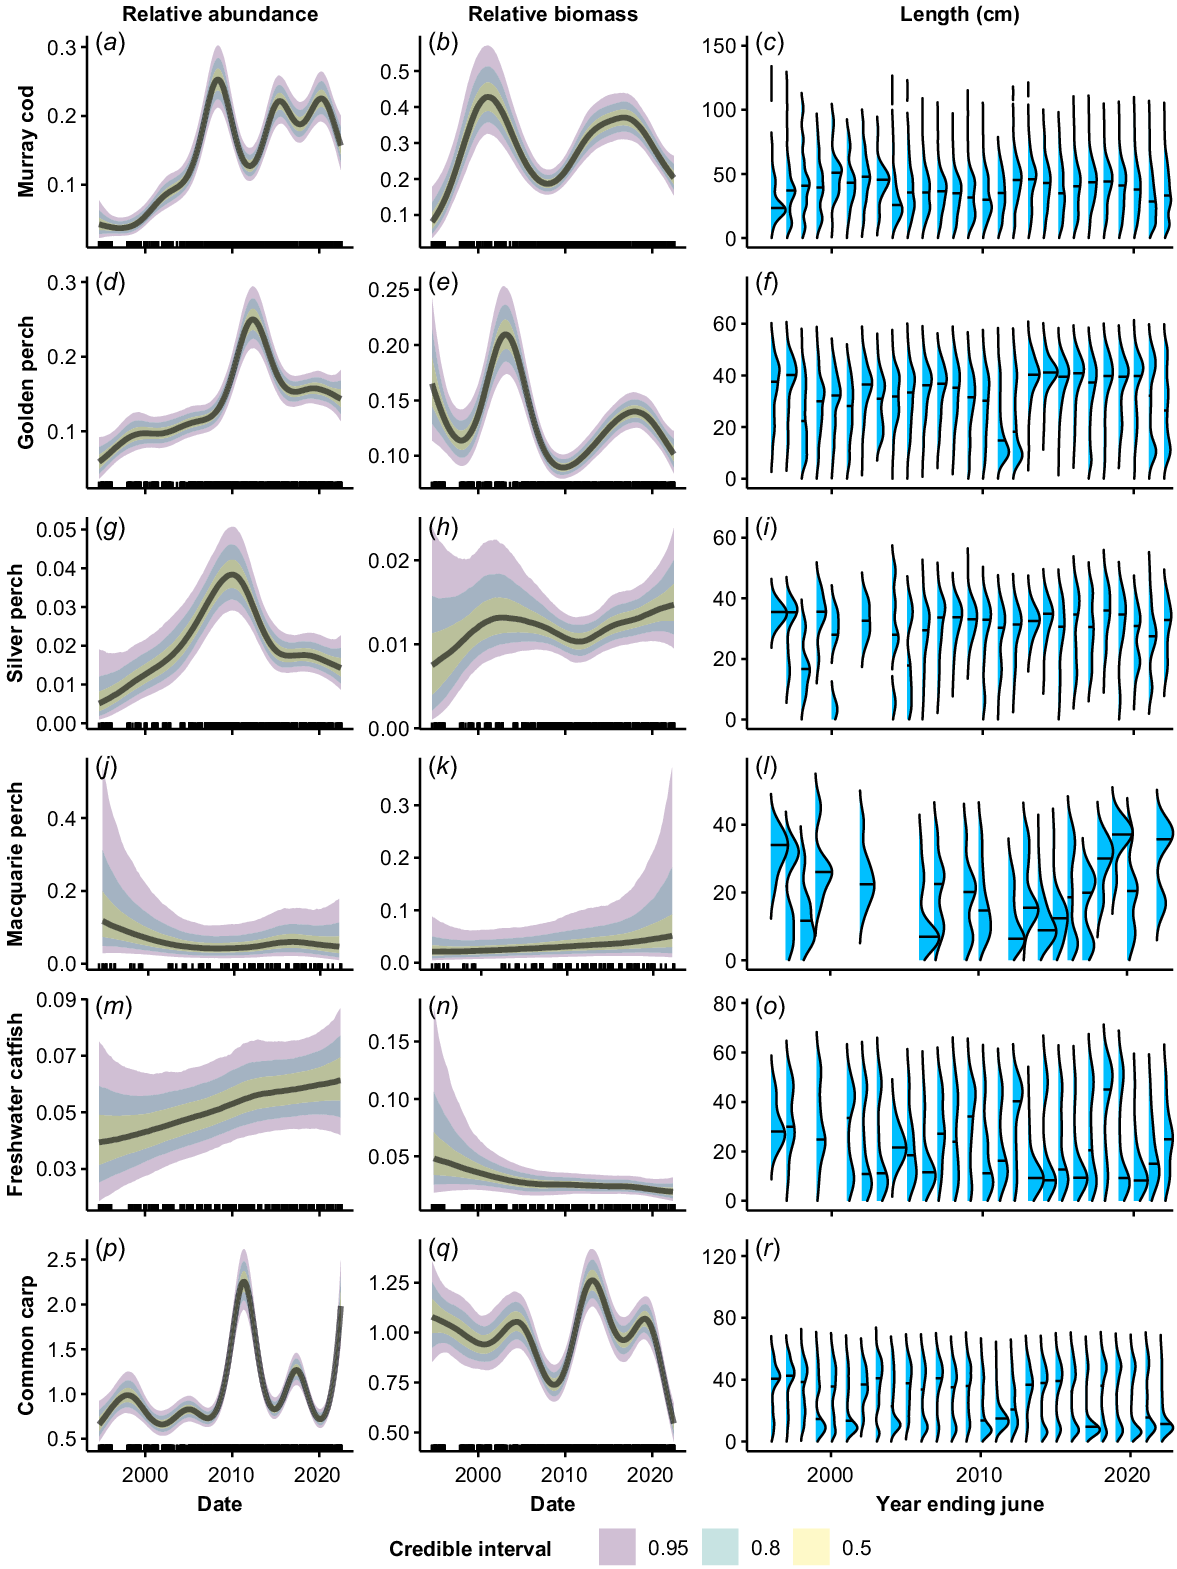
Golden perch relative abundance increased across the time series, interspersed by a peak in 2010–2012 (Fig. 2d). The peak in relative abundance coincided with dominant cohorts of small fish (<20 cm) in the catch in 2011 and 2012 (Fig. 2f). Biomass of golden perch fluctuated considerably across the time series, with peaks in 1994, 2003 and 2019, and troughs in 1998, 2010 and 2022 (Fig. 2e). The troughs in biomass occurred in years where the population had a relatively high proportion of small fish (Fig. 2f).
Silver perch relative abundance was low, with high variability, in the 1990s. Abundance rose to a peak c. 2010, before declining sharply until 2015. It then declined more gradually through to 2022 (Fig. 2g). Predicted biomass of silver perch was characterised by low confidence in the 1990s and remained relatively stable across the time series (Fig. 2h). There was evidence of occasional juvenile recruitment prior to 2000, but the population was dominated by larger fish after this time, with very few fish of <20 cm TL present.
The abundance and biomass of Macquarie perch showed no clear trend across the time series (Fig. 2i, j). There was strong variation in population structure among years and evidence of temporally patchy recruitment, with some years dominated by adults and other years dominated by small fish of <20 cm TL (Fig. 2k).
Relative abundance for freshwater catfish showed a slight increase across the time series; however, the 95% CIs overlapped for all time periods (Fig. 2l). There was evidence of a decreasing trend in biomass over time, although the error was very high in the 1990s (Fig. 2m). The population structure of freshwater catfish oscillated between periods dominated by adult fish (1994–2000, 2007–2015, 2017–2018) and small fish of <20 cm TL (2001–2006, 2016, 2019–2022) (Fig. 2n).
The relative abundance of alien common carp showed no clear general trend over the time series and was characterised by distinct peaks and troughs, with a major peak associated with a large recruitment event occurring in 2010–2012 (Fig. 2p, r). There was an overall declining trend in the biomass of common carp, punctuated by a sharp increase following a surge in the number of recruits in 2011–2013, followed by a sharp decline in biomass after 2019 (Fig. 2q). The population structure of common carp alternated between periods dominated by either adults or small fish of <20 cm TL (Fig. 2r). The proportion of large adult fish present declined in the most recent years of the time series, with small fish dominating from 2016 onward (Fig. 2r).
Valley-scale temporal trends in relative abundance and biomass
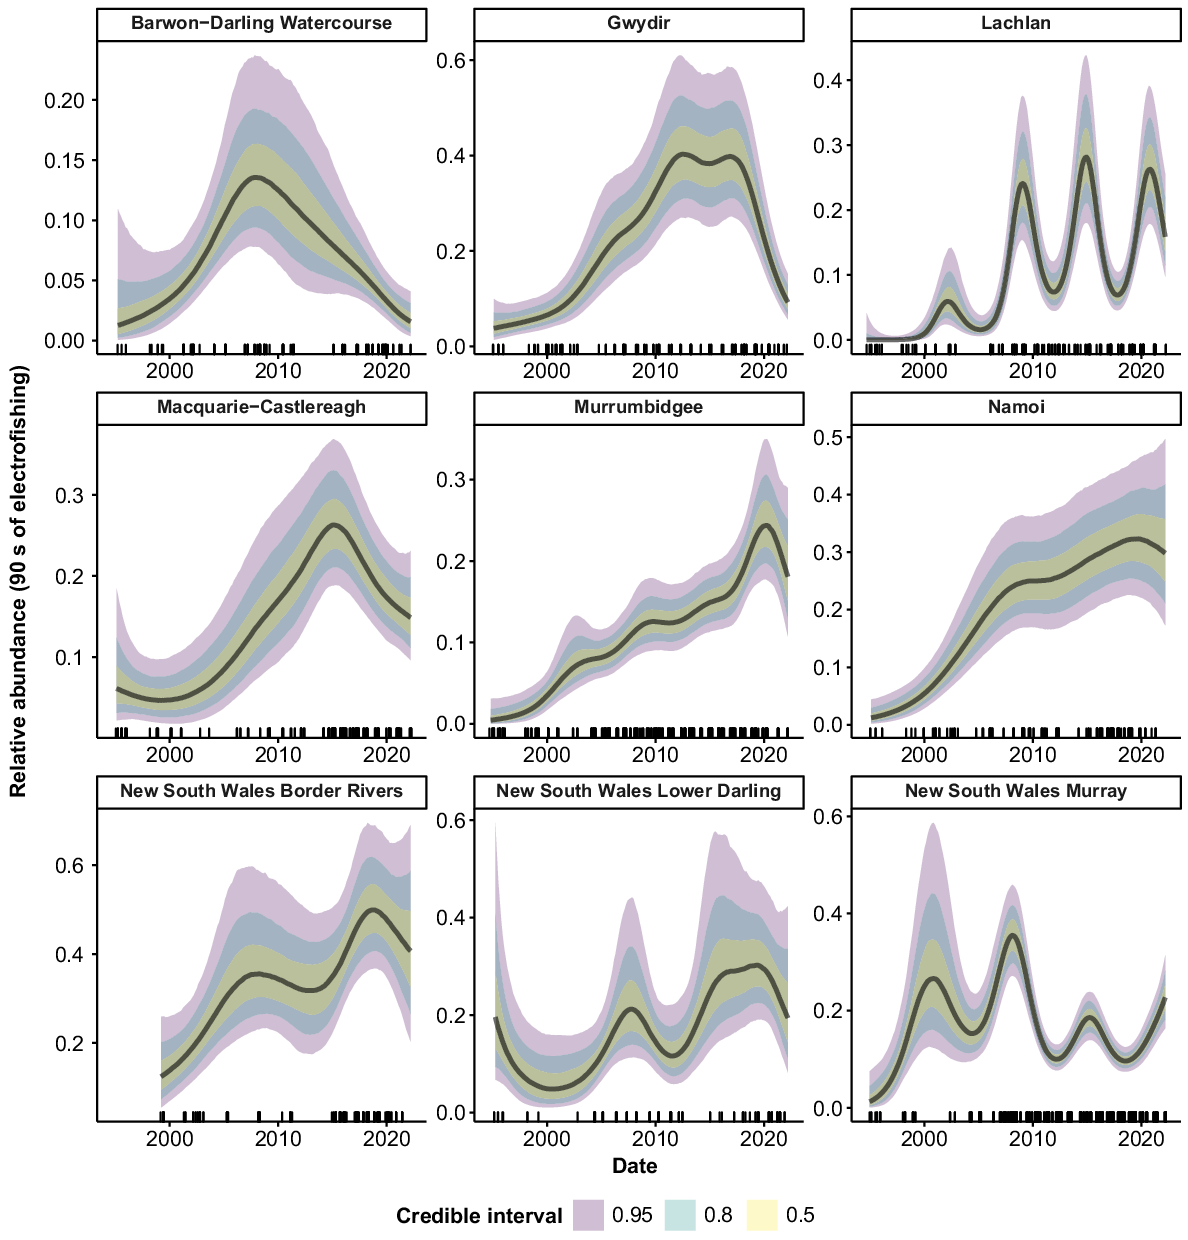
Murray cod were collected from all 10 valleys, but only 9 had sufficient data to allow analyses (no Murray cod were collected from the ‘Intersecting Streams’ valley using boat electrofishing). There were consistent increases in the relative abundance of Murray cod across the time series for the Murrumbidgee, Namoi and Border Rivers, with a greater than three-fold increase in recent years compared with the mid-1990s (Fig. 3). Murray cod abundance also increased in the early phases of the time series in the Barwon–Darling Watercourse, Gwydir and Macquarie–Castlereagh valleys. However, these three valleys subsequently experienced downward trends, with the Barwon–Darling Watercourse and the Gwydir declining back to 1990s levels after 2008 and 2016 respectively. Abundance in the Macquarie–Castlereagh increased between 2000 and 2016, before showing a gradual declining trend thereafter. There was an increase in abundance in the Lachlan and NSW Murray valleys in the mid–late 1990s, followed by a fluctuating pattern with no clear trend. There was no clear trend in the relative abundance of Murray cod in the NSW Lower Darling valley.
Fitted trends in relative abundance for Murray cod within valleys of the NSW Murray–Darling Basin on the basis of the GAMM analysis. Rug plots (tick marks) on the x-axis show distribution of sampling events through time from 1994 to 2022. There were insufficient data for analysis in 1 of the 10 valleys (Intersecting Streams).
Golden perch were collected from all 10 valleys. Peaks in relative abundance were observed in the Barwon–Darling Watercourse, Gwydir, Murray and Lower Darling valleys from 2010 to 2012, followed by declines back to previous abundance (Fig. 4). The Lachlan valley showed a reasonably steady increase in abundance over the time series, as did the Macquarie–Castlereagh after 2001. There was a sharp increase in abundance in the Murrumbidgee from 1994 to 2015, followed by a decline from 2016 to 2022. The Namoi showed no clear trend in abundance but there was some indication of an increase after 2007. There was some evidence of declines in the Intersecting Streams and Border Rivers, but substantial error for estimates in the early years of the time series limits inference for these valleys.
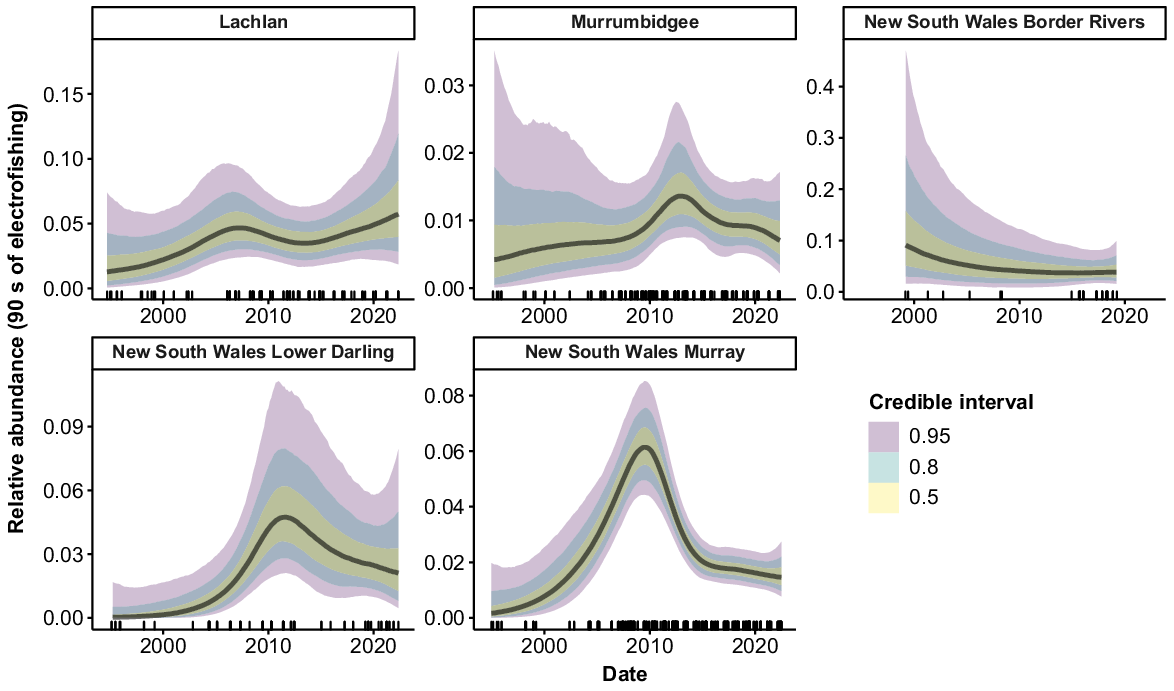
Silver perch were collected from 9 of the 10 valleys, but only five valleys contained large-enough samples sizes for analysis. The Lachlan, Murrumbidgee and Border Rivers showed no strong trends in abundance, with CIs overlapping across the time series (Fig. 5). Peaks in abundance were apparent in the Lower Darling c. 2011 and in the Murray c. 2009, with abundance declining in these valleys in more recent years.
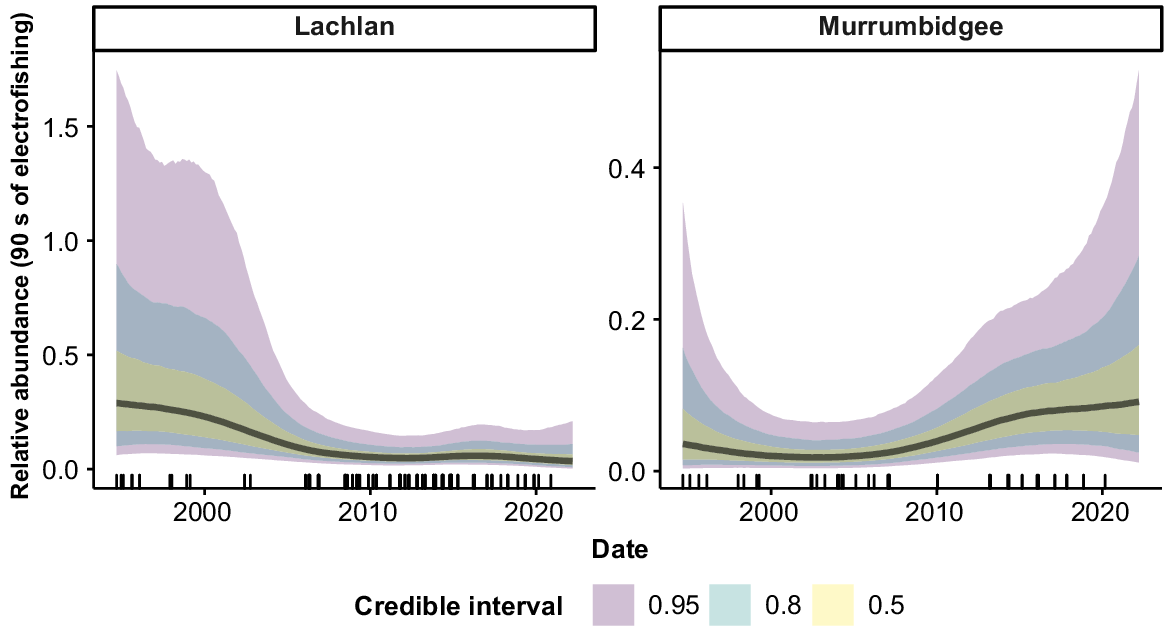
Macquarie perch were collected from four valleys, but only the Lachlan and Murrumbidgee valleys had sufficient samples for analyses (Fig. 6). There was some evidence of a slight decrease in abundance across the time series in the Lachlan and a slight increase in abundance in the Murrumbidgee. However, high variability in the estimates limits the inference that can be drawn regarding temporal trends in the relative abundance of Macquarie perch.
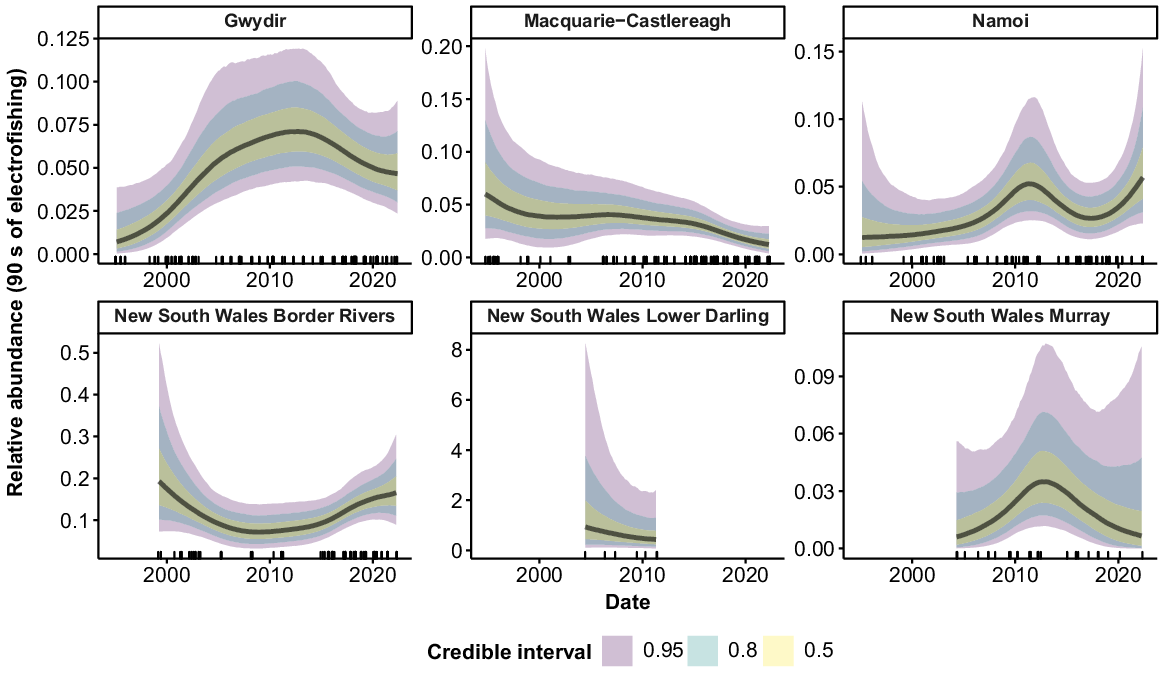
Freshwater catfish were collected from 9 of the 10 valleys (Fig. 7), but only six valleys had sufficient fish for analysis. There was evidence of a slight increase in abundance in the Gwydir between the mid-1990s and the mid-2000s, although error rates were high, with overlapping CIs across the time series. In the Macquarie–Castlereagh, there was evidence of a decline in abundance over the time series, although error rates were high in the early years of the time series and overlapped with CIs for the more recent years. There were no strong trends in abundance for the Namoi, Border Rivers, or NSW Murray across the time series.
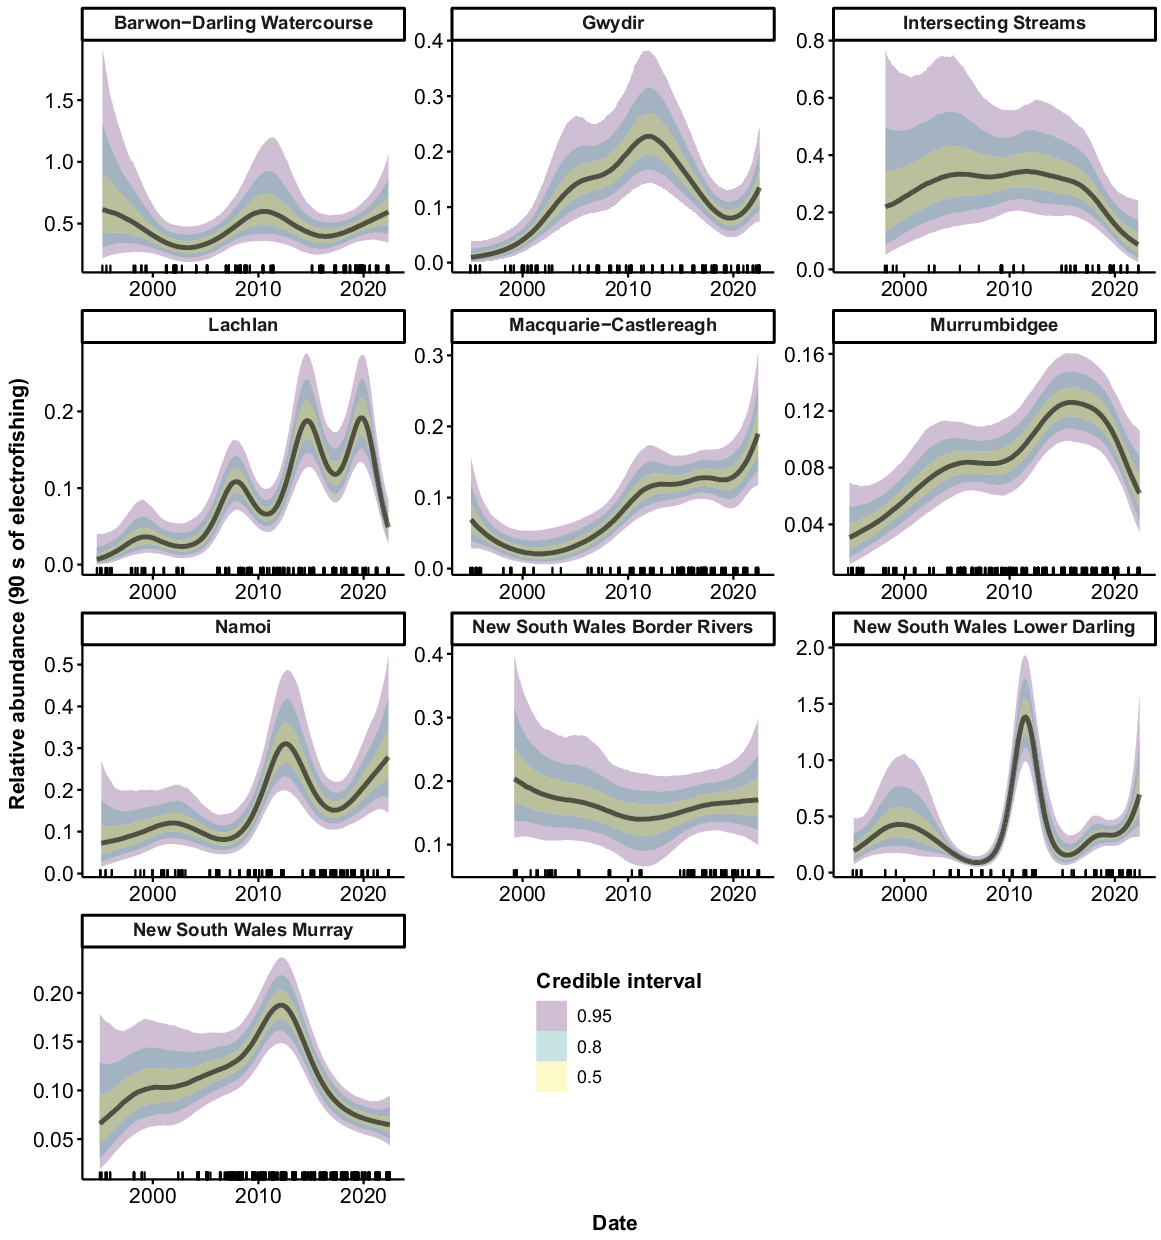
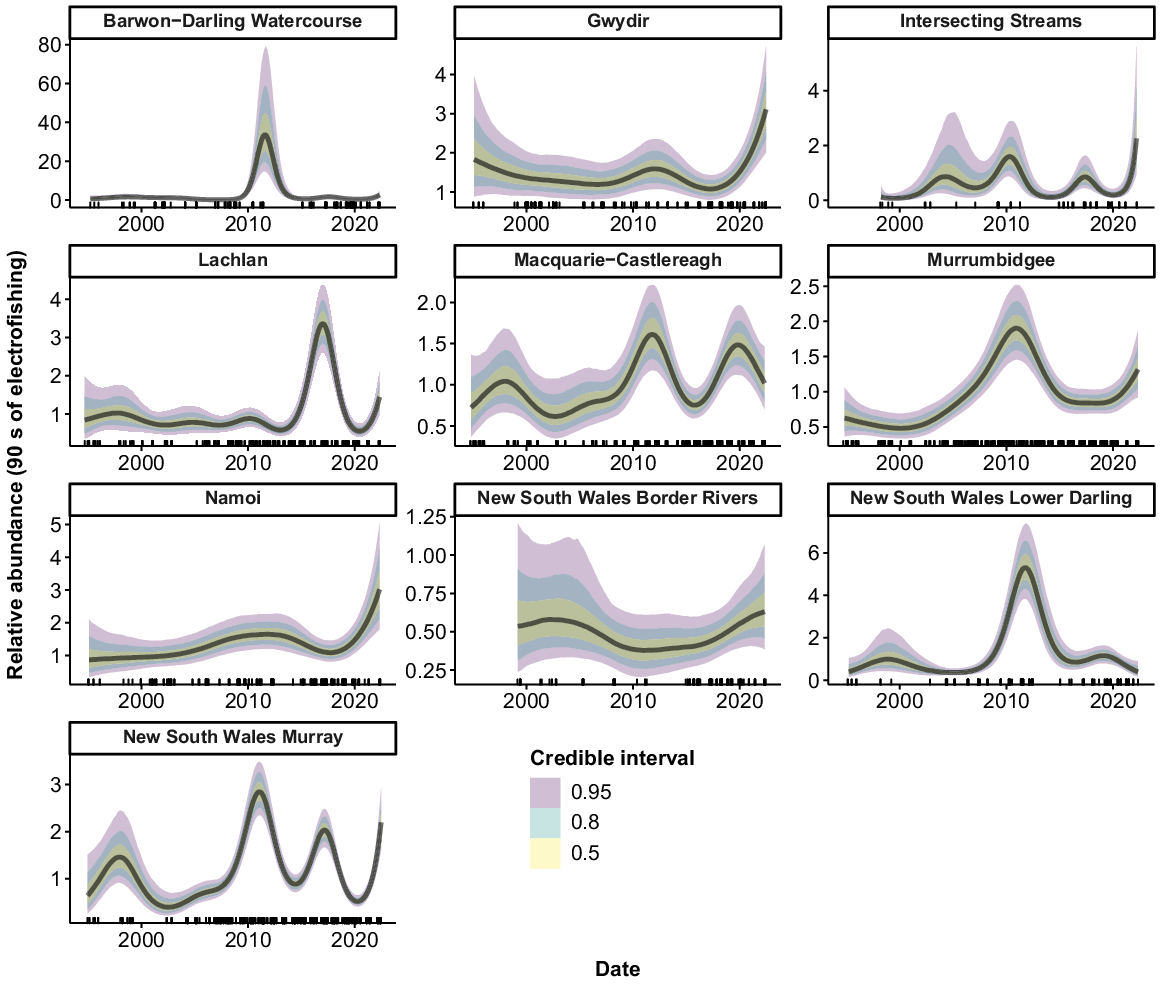
Common carp were collected from all 10 valleys (Fig. 8). Large peaks in abundance occurred c. 2010–2012 in the Barwon–Darling watercourse, Macquarie–Castlereagh, Murrumbidgee, Lower Darling and Murray. Additional peaks also occurred in the Macquarie–Castlereagh, Lower Darling and Murray in the late 1990s, and in the Lachlan, NSW Murray and Intersecting Streams in 2016–2017. There was an upward tick in relative abundance in the most recent years of the time series for all valleys except the Macquarie–Castlereagh and NSW Lower Darling.
Discussion
Species trends
The long-term fish-monitoring database maintained by NSW DPI spans nearly three decades and encompasses periods of extreme climate variability, with long-term average rainfall anomalies across the MDB ranging from +320 mm in 2010 to −263 mm in 2019 (Bureau of Meteorology 2023). We have shown variable temporal trends in the population status of six key large-bodied species at the NSW Basin and valley scales, highlighting the importance of collecting routine fish-monitoring data over the long-term to inform related research and management actions.
The relative abundance of two of the native species, Murray cod and golden perch, showed significant overall increases across the time series at the NSW MDB scale, similar to long-term trends identified in northern Victoria (Yen et al. 2021). However, the trends in abundance for these species were non-linear and characterised by strong interannual variation. Biomass also varied strongly from year to year for both species, with reasonably low biomass usually coinciding with a high proportion of new recruits. Murray cod showed evidence of regular recruitment, with juvenile fish present across all years. This reflects the ‘equilibrium’ life-history strategy of Murray cod, which is characterised by energetic investment in well-developed offspring and regular, stable recruitment (King et al. 2013; Tonkin et al. 2021). In contrast, golden perch recruitment was episodic, with particularly strong recruitment coinciding with major flooding across the MDB in 2010–2011 (Bureau of Meteorology 2022). This pattern of recruitment reflects the ‘periodic’ life history of golden perch, where large numbers of poorly developed, pelagic larvae are produced and recruitment varies strongly in response to the availability of suitable environmental conditions for larval survival, such as floods and within-channel flow pulses (Humphries et al. 1999; Mallen-Cooper and Stuart 2003; Sharpe 2011; Stuart and Sharpe 2020; Zampatti et al. 2022).
In addition to natural recruitment, stocking of hatchery-produced fish may have contributed to the increase in relative abundance of Murray cod and golden perch, as both species have been extensively stocked throughout the MDB since the early 1990s (Gilligan 2005). Previous assessments of Murray cod and golden perch stock enhancement have reported variable outcomes, with stocking tending to have a greater effect in fragmented systems with little natural recruitment than in connected systems where natural recruitment tends to be higher (Hunt et al. 2010; Crook et al. 2016; Forbes et al. 2016; Thiem et al. 2017; Shams et al. 2020). Following several years of experimental stocking in the highly fragmented Billabong Creek, Crook et al. (2016) found that there was an approximately four-fold increase in catch-per-unit effort (CPUE) and that 79–100% of golden perch were of hatchery origin. In the Edward and Murrumbidgee rivers, where connectivity between habitats is higher, 18–38% of fish were of hatchery origin and there was no discernible change in CPUE after experimental stocking (Crook et al. 2016).
A range of other conservation and recovery actions targeting Murray cod and golden perch has also been implemented in recent decades, which may have also contributed to the increased relative abundance of these species in regions of the MDB. These activities include the provision of environmental flows targeting the ecological requirements of both species, cessation of commercial fishing, recreational fishing regulation (minimum size and slot limits, closed seasons), construction of appropriately designed fishways, re-snagging and habitat restoration (Lintermans 2013a; Forbes et al. 2020; Murray–Darling Basin Authority 2020). Increases in the relative abundance of Murray cod and golden perch during the late 1990s and early 2000s occurred during the Millennium Drought (the strongest drought in post-European Australian history). Although it is difficult to distinguish the drivers of change in fish abundance, because the population trend itself may obscure environmental relationships (Yen et al. 2021), it is possible that drought conditions provide advantages to larger channel-dwelling species relative to floodplain-dependent species. Further research on the specific environmental drivers of recruitment and abundance among species is required to resolve these issues.
The alien species, common carp (hereafter ‘carp’), increased significantly in relative abundance between the beginning and end of the time series, driven primarily by a sharp increase in abundance after 2020. This was associated with a decline in biomass, a predominance of new recruits and reasonably low numbers of large fish. Like golden perch, carp showed a strong increase in relative abundance during the high-flow years of 2010–2012, which was likely to be due to conditions being conducive to successful recruitment (King et al. 2003; Stuart and Jones 2006; Rayner et al. 2015; Koehn et al. 2018; Stuart et al. 2021). Although relative abundance increased towards the end of the time series, there was a decline in relative biomass in recent years because of much lower numbers of large carp (although this decline in biomass was not consistent across regions). Reasons for the recent decline in large carp are unclear but may reflect poor years of recruitment during several years of severe drought from 2017 to 2019, where access to inundated floodplains for spawning and recruitment was largely unavailable (Vilizzi et al. 2014). Other possible influences include increased abundance of predatory native fish (Murray cod and golden perch) and carp control measures, such as screening of large carp from floodplain wetlands (Hillyard et al. 2010), and the trapping and removal of carp from fishways (Stuart and Conallin 2018).
Temporal variation in carp biomass is likely to have important consequences for riverine fish assemblages and food-web dynamics, because carp is an omnivore–detritivore that often comprises a dominant component of standing fish biomass in most rivers of the MDB (Harris and Gehrke 1997; Kopf et al. 2019). Reductions in carp biomass are likely to result in more energy being available to support native fish biomass, thereby increasing the portion of carrying capacity of waterways available for use by native fish (see Kopf et al. 2019). The strong temporal variation in biomass is also relevant to the interpretation and use of standing-biomass estimates for common carp (Todd et al. 2019; Stuart et al. 2021). Such variation influences the relative risks and benefits of implementing carp control measures, such as the carp herpes virus (Gillespie and Bennett 2022). At the time of writing, extensive flooding in the MDB has occurred in association with a La Niña climatic event from 2020 to 2023 (Bureau of Meteorology 2023). Fish surveys conducted during this period showed very high levels of recruitment by juvenile carp across the Basin in response to these climatic conditions. Continuation of monitoring over coming years will determine whether the recent floods result in a recovery of carp biomass, or if a persistent shift in the population structure of carp has occurred over recent years.
There were no consistent trends in relative abundance for freshwater catfish, silver perch and Macquarie perch across the time series, with high error around the model estimates resulting from the low sample sizes of these reasonably rare species. The peak in silver perch relative abundance in the NSW Murray c. 2009 was also reported in an otolith ageing study by Tonkin et al. (2019), who found that strong recruitment of this species occurs in years with low to average river discharge and high water temperatures during the spawning period (November–December), followed by extended high flows and widespread flooding (as occurred in 2010–2011). In more recent years, the relative abundance of silver perch declined and the populations were dominated by larger fish, with low levels of recruitment.
Macquarie perch was collected in sufficient numbers for analysis only in the Murrumbidgee and Lachlan valleys. The population structure of Macquarie perch over the time series oscillated between periods of domination by adult and juvenile fish, possibly reflecting previous observations of temporal and spatial patchiness in spawning and recruitment (Tonkin et al. 2016) and reliance on specific flow conditions for successful spawning and recruitment (Koster et al. 2013; Lintermans 2013b; Tonkin et al. 2017). Freshwater catfish were collected in sufficient numbers for analysis in six valleys and, like Macquarie perch, showed strong inter-annual variation in population-size structure. Although freshwater catfish may exhibit movement responses to flow events (Marshall et al. 2016; Carpenter-Bundhoo et al. 2021) and their spawning behaviour has been well described (Merrick and Midgley 1981; Carpenter-Bundhoo et al. 2021), relatively little is currently known of the environmental drivers of recruitment and population structure in this species.
Spatial and temporal scales of variation
Analysis at the Basin and valley scales showed that temporal trends in relative abundance (and biomass and size structure, see Supplementary material) were highly variable among valleys for most species. This spatial variation demonstrated the important influence of local-scale (within valley) factors in driving fish population status. Such factors might include variation in the extent of river regulation, the provision of environmental flows, local rainfall and river flow, fishing pressure, stocking, habitat condition and related rehabilitation actions including fish passage, and invasive species abundance (Koehn et al. 2020). The Basin and valley analyses emphasised the need to consider the status of fish populations at appropriate spatial scales to account for large-scale and localised environmental and ecological drivers of population processes, as well as potential metapopulation connectivity both within and across valleys (Stuart and Sharpe 2020; Thiem et al. 2022; Zampatti et al. 2021, 2022).
In a comparable study of the Lower Darling–Baaka and Murray rivers, Gilligan (2005) used linear regression analysis of effort-adjusted commercial fishing and electrofishing data (same electrofishing data used in the current study) to examine trends in fish abundance between 1984 and 2005. Commercial catch data showed a significant increase in Murray cod catch rates in the Murray River and no trend in the Darling–Baaka River between 1984 and 2001 (the commercial fishery closed in 2001). For golden perch, commercial catch rates increased significantly in both rivers between 1984 and 2001. The electrofishing data showed no significant trends in Murray cod or golden perch abundance between 1994 and 2005. On the basis of these findings, Gilligan (2005) concluded that Murray cod and golden perch abundance in the Lower Darling–Baaka and Murray region increased between 1984 and 1994, but then stabilised between 1994 and 2005. Our results are consistent with this interpretation of trends in this region, with the GAMM analyses for the NSW Lower Darling (Murray cod and golden perch) showing no clear trends between 1994 and 2005. However, our analyses showed that Murray cod abundance increased after 2020 in the NSW Murray and there were large peaks in golden perch abundance ca 2010–2012, followed by sharp declines in both the Lower Darling and Murray valleys.
Although our study and that of Gilligan (2005) were limited to examination of trends over recent decades, some inference can be made regarding temporal trends in native fish abundance before this time (Kearney and Kildea 2004). Prior to European settlement, abundant native fish populations provided a critical food supply and were (and continue to be) of enormous cultural significance to First Nations peoples across the MDB (Rowland 2004; Humphries 2007; Weir 2009). Written accounts by explorers in the early years post-European settlement describe extremely plentiful fish populations in the MDB (Rowland 2004; Scott 2005; Humphries and Winemiller 2009; Trueman 2011). Large-scale commercial fisheries based on the harvest of native fishes commenced in the mid-1850s but catches had declined substantially by the start of the 20th century (Anderson 1915; Cadwallader 1977; Rowland 1989; Reid et al. 1997; Kearney and Kildea 2004). Monitoring of fish moving through the Euston fishway on the Murray River in 1940–1945 and 1987–1992 also showed declines in native fish assemblages, with Murray cod and silver perch numbers declining by ~95%, Macquarie perch disappearing altogether, and common carp becoming a dominant component of the catch between the two monitoring periods (Murray–Darling Basin Authority 2020). Our more contemporary estimates of native fish abundance and biomass clearly do not accord with the reported ‘superabundance’ of fish in the early years after European settlement (Humphries and Winemiller 2009). This demonstrates the need for natural resource managers to consider the extent to which native fish stocks are currently depleted and the risks associated with shifting baselines of knowledge regarding the condition of fish populations (Humphries and Winemiller 2009).
Analytical considerations
The use of relative abundance and biomass metrics and the inclusion of different sites for each species limits interspecies comparisons but resolves temporal intraspecies trends. Electrofishing efficiency is well-known to vary among species, within species by size classes, and with environmental factors (such as water conductivity, water depth and turbidity; Lyon et al. 2014). It is therefore necessary to perform detailed calibration experiments to determine detection probabilities and correction factors to achieve accurate estimates of absolute abundance or density from electrofishing data (Lyon et al. 2014; Gwinn et al. 2016; Glover et al. 2019). Because the primary aim of our study was to examine temporal trends in species status, we did not attempt to estimate absolute abundance or density, and thus did not undertake calibration experiments or adjust the raw data to account for variability in detection probability. Instead, we used random effects within the statistical analyses to control for varying detection probabilities and estimate relative abundance and biomass.
Because changes in detection probabilities among sampling events (either in time or space) are most likely to be driven by varying environmental conditions (Lyon et al. 2014), we specified both random intercept effects of both individual sites and sampling dates. The site-level random effect controls for the dependency structure where sites were sampled multiple times and, therefore, are likely to have similar fish assemblages and habitat structure during each sampling event. The date-level random effect controls for variation among sampling events, of which the most prominent would be changes in environmental conditions such as freshwater flow, turbidity and conductivity (Gwinn et al. 2016) but may also include potential differences in efficiency among sampling teams (Hardin and Connor 1992; Glover et al. 2019). When both the site and date random effects are considered together, our model standardises the abundance and biomass estimates for both repeated sampling at some sites and varying environmental conditions. Owing to the large number of levels in the random effects, the Central Limit Theorem allows the global model to effectively estimate the mean relative abundance or biomass over time, despite potential large variations in environmental conditions (Harrison et al 2018; Warton 2022). To estimate absolute abundance or quantify the effects of environmental variation, it would be necessary to explicitly model individual effects such as conductivity, water depth or river discharge (Lyon et al. 2014).
Within our analysis, there were many sites that were sampled only once (for example, 296 of 808 golden perch boat electrofishing sites were sampled only once). These sites do not provide the same level of inference on temporal change as do sites with repeated sampling. The confidence bounds of the model outputs and hindcast estimates could be improved in future by prioritising the resampling of sites with a previous sampling history, because natural variance can be better partitioned into inter-site and temporal variation through the random-effect structure (Harrison et al. 2018). A further consideration related to site inclusion is the initial probability of a site being sampled, either through the probability of being selected (several of the large monitoring projects used a stratified random sampling design to choose sites) or when environmental conditions limit site-selection options (as discussed below for drought-affected sampling). We did not include any weighting in the modelling by sites and there is potential for some bias if particular sites or regions were preferentially sampled over sites with differing abundances of fish. However, the risk of such bias is moderated when there are large numbers of sites spread over a wide spatial extent (as in our analysis), and we therefore consider our analysis of overall trends to be robust, particularly because sampling area and effort were consistent at the site level. Nonetheless, the trends presented here should be viewed with appropriate consideration of their representativeness and the influence of local-scale heterogeneity, particularly at the valley scale.
Although our modelling approach aims to make the best use of the available data, it does not account for situations where there are no data, nor does it differentiate the mechanisms controlling the relative abundance of fish. The most obvious example of this is during intense drought periods where some sites are unable to be sampled because of habitat desiccation. This could potentially bias the relative abundance estimates if there are true zeros missing from the data during dry periods. Within a subset of our data covering a particularly dry period (2015–2020; dry sites were not recorded before this), dry sites were present, but rare (three boat electrofishing sites that had previously recorded Murray cod were attempted to be sampled but were dry). Exclusion of dry sites could result in model troughs in the time-series not being as low as reality. However, the very low numbers of dry sites across the data set are unlikely to affect the overall long-term trends for each species. Similarly, as water levels decline, it is possible that fish become concentrated in the remaining waterholes and deeper patches, and that this results in a form of hyperstability where the CPUE is stable or elevated (Dassow et al. 2020; Simonson et al. 2022). This effect would potentially obscure trends in CPUE and is equally a concern when floods may distribute fish over a large, inundated floodplain.
The random effect structure described above will account for some of this variation and provide robust estimates of long-term trends; however, the predictions for periods of extreme high (e.g. 2010–2011) and low water levels (e.g. 2017–2019) should be viewed with some caution because they may not fully represent the actual patterns of abundance and biomass and may be influenced by environmentally driven changes in catchability. These potentially confounding factors should be considered when interpreting the biological significance of the peaks and troughs that are present across the time series. Another potential confounding mechanism influencing the observed abundances of fish is increasing sampling efficiency through time, such as that produced by upgrading sampling equipment (such as technology creep in commercial fisheries; Eigaard et al. 2014). We are confident that technological improvements in efficiency are not a major concern for interpretation of our analyses because standardised sampling protocols using comparable electrofishing equipment were closely adhered to by NSW DPI staff throughout the study period, specifically to facilitate comparisons over time.
Conclusions
There is overwhelming evidence that native fish populations are currently degraded compared with their pre-European condition (Humphries and Winemiller 2009) and more recent history (e.g. the mid-20th century, Cadwallader 1977); however, the lack of standardised survey data prevents quantitative analysis of trends in population status prior to the 1990s. Consequently, the expert opinion-based evaluation of an ~90% reduction in native fish population condition still represents the best available estimate of the extent of decline since European settlement (Murray–Darling Basin Commission 2003). Kopf et al. (2019) estimated a 58% decline in native fish biomass on the basis of modelled associations with carp and altered river hydrology, but their estimate did not incorporate the effects of other important changes to river systems, such as habitat alteration, land clearing, overfishing, or barriers, and therefore should be considered conservative. Our analysis of trends since 1994 allowed us to evaluate the suggestion that native fish populations have declined even further since 2003 (Murray–Darling Basin Authority 2020). At the NSW MDB scale, our analyses suggested that, rather than declining, there has been an increase in the relative abundance of Murray cod and golden perch over the past three decades. We also did not find evidence of population declines at the NSW Basin scale for silver perch, Macquarie perch or freshwater catfish, although there was large error around the model estimates, which limits inference for these species.
These findings provide some cause for optimism, although it must be recognised that our study was limited to a small number of large-bodied species that are reasonably well-represented in standardised electrofishing surveys. The suggestion of further declines in native fish populations in recent years refers to a much wider range of species than considered here, including many small-bodied species whose declines have been clearly demonstrated in other studies (Saddlier et al. 2013; Lintermans et al. 2020; Murray–Darling Basin Authority 2020). It should also be emphasised that recovery of native fish was not consistent across all valleys, with recent, localised depletions occurring in various regions of the MDB (e.g. large-scale fish kills in the parts of the Lower Darling–Baaka River in 2018–2020; Ellis et al. 2022; Stocks et al. 2022). Thus, although our study provided evidence that the overall status of some native fish species has improved at the NSW Basin scale over recent decades, the conclusion that native fish populations in the MDB face ongoing decline remains valid and is not contradicted by the findings of our study.
Our analyses showed strong inter-annual variation in relative abundance, biomass and population structure across the time series for all species examined. This demonstrated that comparisons of population status between specific points in time (e.g. five-yearly reporting cycles) are potentially misleading if considered in isolation. Understanding the significance of a change in population status is possible only if the current condition is considered in the context of the overall time series. This is particularly relevant for objective setting and evaluation in fisheries and water management, including related legislation and policy, because achievement of specific objectives for native fish (e.g. percentage increases in fish population metrics) is heavily dependent on the specific comparisons made. For example, a comparison of golden perch relative abundance between 2012 and 2020 would suggest a severe decline, whereas a comparison between 2015 and 2020 would suggest no change. Contrastingly, across the entire time series (i.e. since 1994), our analyses suggested a substantial increase in golden perch relative abundance at the NSW Basin scale (Fig. 2).
The increases in abundance of some native species in regions of the MDB is an encouraging sign for the future of native fish populations, despite the ongoing challenges presented by climate change, extreme events such as floods, fire, and aridification of the MDB. Overarching frameworks that have facilitated coordination and prioritisation of recovery actions for native fish, including the Native Fish Strategy (Murray–Darling Basin Commission 2003), the Native Fish Recovery Strategy (Murray–Darling Basin Authority 2020) and various State-administered initiatives, have almost certainly played an important role in limiting further declines of native fish (Boys et al. 2014; Koehn 2015). The provision of environmental flows to meet the ecological requirements of fish by water-management frameworks (e.g. Water Sharing Plans, Long Term Water Plans, Annual Watering Plans), is similarly essential to the future conservation of native fish in the MDB (King et al. 2009, 2010; Koehn et al. 2014b). Appropriate investment in implementing and monitoring these recovery initiatives, along with related complementary measures such as habitat rehabilitation and provision of fish passage, remains critical for the future conservation of native fish in the MDB. This is especially the case for small-bodied and non-angling species that have historically received less attention than have large-bodied fishes (Saddlier et al. 2013; Boys et al. 2021).
Whereas the current study concentrated on providing quantitative information on the status of fish populations through time, future research should continue to focus on developing an understanding of causation between long-term trends in fish population status and environmental conditions, including large-scale climate and river hydrology (Gido et al. 2013; Lear et al. 2023). This information would provide an improved capacity to link recovery activities (e.g. environmental flows) to ecological outcomes, strengthening the knowledge base required to inform and support adaptive management of native fish populations.
Data availability
Data used in the analyses presented here are available from the NSW Department of Primary Industries upon reasonable request by a data licencing agreement. Code used in this analysis is available at https://github.com/HaydenSchilling/NSW-MDB-Trends.
Acknowledgements
The dataset used in this paper was generated by NSW DPI Fisheries from 1994 to 2022 and sourced from multiple internally and externally funded projects. The authors acknowledge past and present DPI Fisheries scientists, technicians and managers that contributed to its collection as well as the ongoing support of external collaborators and funding agencies (in particular, the Murray–Darling Basin Authority, the Commonwealth Environmental Water Office, and the NSW Freshwater Recreational Fishing Trust). We are thankful for the ongoing site access granted by private landowners across NSW and acknowledge that we work on Country that always was and always will be Aboriginal land.
References
Anderson HK (1915) Rescue operations on the Murrumbidgee River. Royal Zoological Society of New South Wales 1, 157-160.
| Google Scholar |
Boys CA, Lyon J, Zampatti B, Norris A, Butcher A, Robinson W, Jackson P (2014) Demonstration reaches: looking back whilst moving forward with river rehabilitation under the Native Fish Strategy. Ecological Management & Restoration 15, 67-74.
| Crossref | Google Scholar |
Boys CA, Rayner TS, Baumgartner LJ, Doyle KE (2021) Native fish losses due to water extraction in Australian rivers: evidence, impacts and a solution in modern fish- and farm-friendly screens. Ecological Management & Restoration 22, 134-144.
| Crossref | Google Scholar |
Bureau of Meteorology (2022) Murray–Darling Basin water overview significant water events. Available at http://www.bom.gov.au/water/nwa/2012/mdb/contextual/wateroverview.shtml [Verified 20 September 2022]
Bureau of Meteorology (2023) Rainfall anomaly data for Murray–Darling Basin. Available at www.bom.gov.au/web01/ncc/www/cli_chg/timeseries/rranom/0112/mdb/latest.txt [Verified 9 January 2023]
Bürkner P-C (2017) brms: an R package for Bayesian multilevel models using Stan. Journal of Statistical Software 80, 1-28.
| Crossref | Google Scholar |
Bürkner P-C (2018) Advanced Bayesian multilevel modeling with the R Package brms. The R Journal 10, 395-411.
| Crossref | Google Scholar |
Carpenter-Bundhoo L, Butler GL, Bond NR, Bunn SE, Kennard MJ (2021) Long-term acoustic telemetry reveals limited movement of fish in an unregulated, perennial river. Marine and Freshwater Research 72, 1474-1483.
| Crossref | Google Scholar |
Chessman BC (2013) Do protected areas benefit freshwater species? A broad-scale assessment for fish in Australia’s Murray–Darling Basin. Journal of Applied Ecology 50, 969-976.
| Crossref | Google Scholar |
Crook DA, O’Mahony DJ, Gillanders BM, Munro AR, Sanger AC, Thurstan S, Baumgartner LJ (2016) Contribution of stocked fish to riverine populations of golden perch (Macquaria ambigua) in the Murray–Darling Basin, Australia. Marine and Freshwater Research 67, 1401-1409.
| Crossref | Google Scholar |
Dassow CJ, Ross AJ, Jensen OP, Sass GG, van Poorten BT, Solomon CT, Jones SE (2020) Experimental demonstration of catch hyperstability from habitat aggregation, not effort sorting, in a recreational fishery. Canadian Journal of Fisheries and Aquatic Sciences 77, 762-769.
| Crossref | Google Scholar |
Davies PE, Harris JH, Hillman TJ, Walker KF (2010) The sustainable rivers audit: assessing river ecosystem health in the Murray–Darling Basin, Australia. Marine and Freshwater Research 61, 764-777.
| Crossref | Google Scholar |
Eigaard OR, Marchal P, Gislason H, Rijnsdorp AD (2014) Technological development and fisheries management. Reviews in Fisheries Science & Aquaculture 22, 156-174.
| Crossref | Google Scholar |
Ellis I, Bates WB, Martin S, McCrabb G, Koehn J, Heath P, Hardman D (2022) How fish kills affected traditional (Baakandji) and non-traditional communities on the Lower Darling–Baaka River. Marine and Freshwater Research 73, 259-268.
| Crossref | Google Scholar |
Feio MJ, Hughes RM, Serra SRQ, Nichols SJ, Kefford BJ, Lintermans M, et al. (2023) Fish and macroinvertebrate assemblages reveal extensive degradation of the world’s rivers. Global Change Biology 29, 355-374.
| Crossref | Google Scholar |
Forbes J, Watts RJ, Robinson WA, Baumgartner LJ, McGuffie P, Cameron LM, Crook DA (2016) Assessment of stocking effectiveness for Murray cod (Maccullochella peelii) and golden perch (Macquaria ambigua) in rivers and impoundments of south-eastern Australia. Marine and Freshwater Research 67, 1410-1419.
| Crossref | Google Scholar |
Forbes J, Steffe A, Watts RJ, Baumgartner LJ, Brown P, Thiem J, Miles NG (2020) Implementation of a harvest slot for Murray cod: initial impacts on the recreational harvest in a manmade reservoir and comparison to riverine fisheries. Journal & Proceedings of the Royal Society of New South Wales 153, 138-155.
| Google Scholar |
Galego de Oliveira A, Bailly D, Cassemiro FAS, Couto EVd, Bond N, Gilligan D, Rangel TF, Agostinho AA, Kennard MJ (2019) Coupling environment and physiology to predict effects of climate change on the taxonomic and functional diversity of fish assemblages in the Murray–Darling Basin, Australia. PLoS ONE 14, e0225128.
| Crossref | Google Scholar |
Gehrke PC, Harris JH (2000) Large-scale patterns in species richness and composition of temperate riverine fish communities, south-eastern Australia. Marine and Freshwater Research 51, 165-182.
| Crossref | Google Scholar |
Gido KB, Propst DL, Olden JD, Bestgen KR (2013) Multidecadal responses of native and introduced fishes to natural and altered flow regimes in the American Southwest. Canadian Journal of Fisheries and Aquatic Sciences 70, 554-564.
| Crossref | Google Scholar |
Gillespie R, Bennett J (2022) Valuing uncertain environmental outcomes from herpes virus control of the European Carp. Australasian Journal of Environmental Management 29, 81-96.
| Crossref | Google Scholar |
Glover RS, Fryer RJ, Soulsby C, Malcolm IA (2019) These are not the trends you are looking for: poorly calibrated single-pass electrofishing data can bias estimates of trends in fish abundance. Journal of Fish Biology 95, 1223-1235.
| Crossref | Google Scholar |
Gwinn DC, Beesley LS, Close P, Gawne B, Davies PM (2016) Imperfect detection and the determination of environmental flows for fish: challenges, implications and solutions. Freshwater Biology 61, 172-180.
| Crossref | Google Scholar |
Gwinn DC, Butler G, Ingram B, Raymond S, Lintermans M, Ye Q (2019) Borrowing external information to estimate angler size selectivity: model development and application to Murray cod. Canadian Journal of Fisheries and Aquatic Sciences 77, 425-437.
| Crossref | Google Scholar |
Hardin S, Connor LL (1992) Variability of electrofishing crew efficiency, and sampling requirements for estimating reliable catch rates. North American Journal of Fisheries Management 12, 612-617.
| Crossref | Google Scholar |
Harris JH, Silveira R (1999) Large-scale assessments of river health using an Index of Biotic Integrity with low-diversity fish communities. Freshwater Biology 41, 235-252.
| Crossref | Google Scholar |
Harrison XA, Donaldson L, Correa-Cano ME, Evans J, Fisher DN, Goodwin CED, Robinson BS, Hodgson DJ, Inger R (2018) A brief introduction to mixed effects modelling and multi-model inference in ecology. PeerJ 6, e4794.
| Crossref | Google Scholar |
Hillyard KA, Smith BB, Conallin AJ, Gillanders BM (2010) Optimising exclusion screens to control exotic carp in an Australian lowland river. Marine and Freshwater Research 61, 418-429.
| Crossref | Google Scholar |
Humphries P (2007) Historical Indigenous use of aquatic resources in Australia’s Murray–Darling Basin, and its implications for river management. Ecological Management & Restoration 8, 106-113.
| Crossref | Google Scholar |
Humphries P, Winemiller KO (2009) Historical impacts on river fauna, shifting baselines, and challenges for restoration. BioScience 59, 673-684.
| Crossref | Google Scholar |
Humphries P, King AJ, Koehn JD (1999) Fish, flows and flood plains: links between freshwater fishes and their environment in the Murray–Darling River system, Australia. Environmental Biology of Fishes 56, 129-151.
| Crossref | Google Scholar |
Hunt TL, Allen MS, Douglas J, Gason A (2010) Evaluation of a sport fish stocking program in lakes of the southern Murray–Darling Basin, Australia. North American Journal of Fisheries Management 30, 805-811.
| Crossref | Google Scholar |
Kay M (2021) tidybayes: Bayesian analysis + tidy data + geoms. Available at http://mjskay.github.io/tidybayes/
Kearney RE, Kildea MA (2004) The management of Murray cod in the Murray–Darling basin. Australasian Journal of Environmental Management 11, 42-54.
| Crossref | Google Scholar |
King AJ, Humphries P, Lake PS (2003) Fish recruitment on floodplains: the roles of patterns of flooding and life history characteristics. Canadian Journal of Fisheries and Aquatic Sciences 60, 773-786.
| Crossref | Google Scholar |
King AJ, Tonkin Z, Mahoney J (2009) Environmental flow enhances native fish spawning and recruitment in the Murray River, Australia. River Research and Applications 25, 1205-1218.
| Crossref | Google Scholar |
King AJ, Ward KA, O’Connor P, Green D, Tonkin Z, Mahoney J (2010) Adaptive management of an environmental watering event to enhance native fish spawning and recruitment. Freshwater Biology 55, 17-31.
| Crossref | Google Scholar |
Koehn JD (2015) Managing people, water, food and fish in the Murray–Darling Basin, south-eastern Australia. Fisheries Management and Ecology 22, 25-32.
| Crossref | Google Scholar |
Koehn JD, Lintermans M (2012) A strategy to rehabilitate fishes of the Murray–Darling Basin, south-eastern Australia. Endangered Species Research 16, 165-181.
| Crossref | Google Scholar |
Koehn JD, Copeland C, Stamation K (2014a) The future for managing fishes in the Murray–Darling Basin, south-eastern Australia. Ecological Management & Restoration 15, 1-2.
| Crossref | Google Scholar |
Koehn JD, King AJ, Beesley L, Copeland C, Zampatti BP, Mallen-Cooper M (2014b) Flows for native fish in the Murray–Darling Basin: lessons and considerations for future management. Ecological Management & Restoration 15, 40-50.
| Crossref | Google Scholar |
Koehn JD, Todd CR, Zampatti BP, Stuart IG, Conallin A, Thwaites L, Ye Q (2018) Using a population model to inform the management of river flows and invasive carp (Cyprinus carpio). Environmental Management 61, 432-442.
| Crossref | Google Scholar |
Koehn JD, Raymond SM, Stuart I, Todd CR, Balcombe SR, Zampatti BP, et al. (2020) A compendium of ecological knowledge for restoration of freshwater fishes in Australia’s Murray–Darling Basin. Marine and Freshwater Research 71, 1391-1463.
| Crossref | Google Scholar |
Kopf RK, Humphries P, Bond NR, Sims NC, Watts RJ, Thompson RM, Hladyz S, Koehn JD, King AJ, McCasker N, McDonald S (2019) Macroecology of fish community biomass–size structure: effects of invasive species and river regulation. Canadian Journal of Fisheries and Aquatic Sciences 76, 109-122.
| Crossref | Google Scholar |
Koster WM, Dawson DR, Morrongiello JR, Crook DA (2013) Spawning season movements of Macquarie perch (Macquaria australasica) in the Yarra River, Victoria. Australian Journal of Zoology 61, 386-394.
| Crossref | Google Scholar |
Lear KO, Ebner BC, Fazeldean T, Whitty J, Morgan DL (2023) Inter-decadal variation in diadromous and potamodromous fish assemblages in a near pristine tropical dryland river. Ecology of Freshwater Fish 32, 444-463.
| Crossref | Google Scholar |
Lintermans M (2013b) The rise and fall of a translocated population of the endangered Macquarie perch, Macquaria australasica, in south-eastern Australia. Marine and Freshwater Research 64, 838-850.
| Crossref | Google Scholar |
Lintermans M, Geyle HM, Beatty S, Brown C, Ebner BC, Freeman R, Hammer MP, Humphreys WF, Kennard MJ, Kern P, Martin K, Morgan DL, Raadik TA, Unmack PJ, Wager R, Woinarski JCZ, Garnett ST (2020) Big trouble for little fish: identifying Australian freshwater fishes in imminent risk of extinction. Pacific Conservation Biology 26, 365-377.
| Crossref | Google Scholar |
Lyon JP, Bird T, Nicol S, Kearns J, O’Mahony J, Todd CR, Cowx IG, Bradshaw CJA (2014) Efficiency of electrofishing in turbid lowland rivers: implications for measuring temporal change in fish populations. Canadian Journal of Fisheries and Aquatic Sciences 71, 878-886.
| Crossref | Google Scholar |
Mallen-Cooper M, Stuart IG (2003) Age, growth and non-flood recruitment of two potamodromous fishes in a large semi-arid/temperate river system. River Research and Applications 19, 697-719.
| Crossref | Google Scholar |
Marshall JC, Menke N, Crook DA, Lobegeiger JS, Balcombe SR, Huey JA, Fawcett JH, Bond NR, Starkey AH, Sternberg D, Linke S, Arthington AH (2016) Go with the flow: the movement behaviour of fish from isolated waterhole refugia during connecting flow events in an intermittent dryland river. Freshwater Biology 61, 1242-1258.
| Crossref | Google Scholar |
Murray–Darling Basin Authority (2021) Murray–Darling Basin water resource plan areas – surface water [Dataset]. (MDBA: Canberra, ACT, Australia) Available at https://data.gov.au/data/dataset/7b0c274f-7f12-4062-9e54-5b8227ca20c4
Merrick JR, Midgley SH (1981) Spawning behaviour of the freshwater catfish Tandanus tandanus (Plotosidae). Marine and Freshwater Research 32, 1003-1006.
| Crossref | Google Scholar |
Radinger J, Britton JR, Carlson SM, Magurran AE, Alcaraz-Hernández JD, Almodóvar A, et al. (2019) Effective monitoring of freshwater fish. Fish and Fisheries 20, 729-747.
| Crossref | Google Scholar |
Rayner TS, Kingsford RT, Suthers IM, Cruz DO (2015) Regulated recruitment: native and alien fish responses to widespread floodplain inundation in the Macquarie Marshes, arid Australia. Ecohydrology 8, 148-159.
| Crossref | Google Scholar |
Robinson WA, Lintermans M, Harris JH, Guarino F (2019) A landscape-scale electrofishing monitoring program can evaluate fish responses to climatic conditions in the Murray–Darling River System, Australia. American Fisheries Society Symposium 90, 179-201.
| Crossref | Google Scholar |
Rowland SJ (1989) Aspects of the history and fishery of the Murray cod, Maccullochella peeli (Mitchell) (Percichthyidae). Proceedings of the Linnean Society of New South Wales 111, 201-213.
| Google Scholar |
Saddlier S, Koehn JD, Hammer MP (2013) Let’s not forget the small fishes–conservation of two threatened species of pygmy perch in south-eastern Australia. Marine and Freshwater Research 64, 874-886.
| Crossref | Google Scholar |
Shams F, Dyer F, Thompson R, Duncan RP, Thiem JD, Enge TG, Ezaz T (2020) Multiple lines of evidence indicate limited natural recruitment of golden perch (Macquaria ambigua) in the highly regulated Lachlan River. Water 12, 1636.
| Crossref | Google Scholar |
Simonson MA, Weber MJ, McCombs A (2022) Hyperstability in electrofishing catch rates of common carp and bigmouth buffalo. North American Journal of Fisheries Management 42, 425-437.
| Crossref | Google Scholar |
Stocks JR, Ellis IM, van der Meulen DE, Doyle JI, Cheshire KJM (2022) Kills in the Darling: assessing the impact of the 2018–20 mass fish kills on the fish communities of the Lower Darling–Baaka River, a large lowland river of south-eastern Australia. Marine and Freshwater Research 73, 159-177.
| Crossref | Google Scholar |
Stoffels R, Bond N, Pollino C, Broadhurst B, Butler G, Kopf RK, Koster W, McCasker N, Thiem J, Zampatti B, Ye Q (2016) Long term intervention monitoring basin matter – fish foundation report. Final Report prepared for the Commonwealth Environmental Water Office, MDFRC Publication 65/2015, Murray–Darling Freshwater Research Centre, Wodonga, Vic., Australia.
Stuart IG, Conallin AJ (2018) Control of globally invasive common carp: an 11-year commercial trial of the Williams’ cage. North American Journal of Fisheries Management 38, 1160-1169.
| Crossref | Google Scholar |
Stuart IG, Jones M (2006) Large, regulated forest floodplain is an ideal recruitment zone for non-native common carp (Cyprinus carpio L.). Marine and Freshwater Research 57, 333-347.
| Crossref | Google Scholar |
Stuart IG, Sharpe CP (2020) Riverine spawning, long distance larval drift, and floodplain recruitment of a pelagophilic fish: a case study of golden perch (Macquaria ambigua) in the arid Darling River, Australia. Aquatic Conservation: Marine and Freshwater Ecosystems 30, 675-690.
| Crossref | Google Scholar |
Stuart IG, Fanson BG, Lyon JP, Stocks J, Brooks S, Norris A, Thwaites L, Beitzel M, Hutchison M, Ye Q, Koehn JD, Bennett AF (2021) Continental threat: how many common carp (Cyprinus carpio) are there in Australia? Biological Conservation 254, 108942.
| Crossref | Google Scholar |
Thiem JD, Wooden IJ, Baumgartner LJ, Butler GL, Forbes JP, Conallin J (2017) Recovery from a fish kill in a semi-arid Australian river: can stocking augment natural recruitment processes? Austral Ecology 42, 218-226.
| Crossref | Google Scholar |
Thiem JD, Baumgartner LJ, Fanson B, Sadekov A, Tonkin Z, Zampatti BP (2022) Contrasting natal origin and movement history informs recovery pathways for three lowland river species following a mass fish kill. Marine and Freshwater Research 73, 237-246.
| Crossref | Google Scholar |
Todd CR, Koehn JD, Brown TR, Fanson B, Brooks S, Stuart I (2019) Modelling carp biomass: estimates for the year 2023. Unpublished client report for Fisheries Research and Development Corporation. Arthur Rylah Institute for Environmental Research, Department of Environment, Land, Water and Planning, Melbourne, Vic., Australia.
Tonkin Z, Kearns J, O’Mahony J, Mahoney J (2016) Spatio-temporal spawning patterns of two riverine populations of the threatened Macquarie perch (Macquaria australasica). Marine and Freshwater Research 67, 1762-1770.
| Crossref | Google Scholar |
Tonkin Z, Kearns J, Lyon J, Balcombe SR, King AJ, Bond NR (2017) Regional-scale extremes in river discharge and localised spawning stock abundance influence recruitment dynamics of a threatened freshwater fish. Ecohydrology 10, e1842.
| Crossref | Google Scholar |
Tonkin Z, Stuart I, Kitchingman A, Thiem JD, Zampatti B, Hackett G, Koster W, Koehn J, Morrongiello J, Mallen-Cooper M, Lyon J (2019) Hydrology and water temperature influence recruitment dynamics of the threatened silver perch Bidyanus bidyanus in a regulated lowland river. Marine and Freshwater Research 70, 1333-1344.
| Crossref | Google Scholar |
Tonkin Z, Yen J, Lyon J, Kitchingman A, Koehn JD, Koster WM, Lieschke J, Raymond S, Sharley J, Stuart I, Todd C (2021) Linking flow attributes to recruitment to inform water management for an Australian freshwater fish with an equilibrium life-history strategy. Science of The Total Environment 752, 141863.
| Crossref | Google Scholar |
Vilizzi L, Thwaites LA, Smith BB (2014) Exploitation by common carp (Cyprinus carpio) of a floodplain wetland of the lower River Murray under drought and flooding conditions. Transactions of the Royal Society of South Australia 138, 113-123.
| Crossref | Google Scholar |
Wickham H, Averick M, Bryan J, Chang W, McGowan LD, François R, Grolemund G, Hayes A, Henry L, Hester J, Kuhn M, Pedersen TL, Miller E, Bache SM, Müller K, Ooms J, Robinson D, Seidel DP, Spinu V, Takahashi K, Vaughan D, Wilke C, Woo K, Yutani H (2019) Welcome to the tidyverse. Journal of Open Source Software 4, 1686.
| Crossref | Google Scholar |
Yen JDL, Thomson JR, Lyon JP, Koster WM, Kitchingman A, Raymond S, Stamation K, Tonkin Z (2021) Underlying trends confound estimates of fish population responses to river discharge. Freshwater Biology 66, 1799-1812.
| Crossref | Google Scholar |
Zampatti BP, Leigh SJ, Wilson PJ, Crook DA, Gillanders BM, Maas R, Macdonald JI, Woodhead J (2021) Otolith chemistry delineates the influence of natal origin, dispersal and flow on the population dynamics of golden perch (Macquaria ambigua) in a regulated river. Marine and Freshwater Research 72, 1484-1495.
| Crossref | Google Scholar |
Zampatti BP, Fanson BG, Baumgartner LJ, Butler GL, Brooks SG, Crook DA, Doyle K, King AJ, Koster WM, Maas R, Sadekov A, Scott P, Strawbridge A, Thiem JD, Tonkin Z, Wilson PJ, Woodhead J, Woods R (2022) Population demographics of golden perch (Macquaria ambigua) in the Darling River prior to a major fish kill: a guide for rehabilitation. Marine and Freshwater Research 73, 223-236.
| Crossref | Google Scholar |