

Investigating microplastic contamination and biomagnification in a remote area of South Australia
Solomon O. Ogunola A * , Patrick Reis-Santos A , Nina Wootton A and Bronwyn M. Gillanders A
A Southern Seas Ecology Laboratories, School of Biological Sciences and Environment Institute, The University of Adelaide, Adelaide, SA 5005, Australia.
Marine and Freshwater Research 74(11) 917-927 https://doi.org/10.1071/MF22236
Submitted: 2 November 2022 Accepted: 2 May 2023 Published: 8 June 2023
© 2023 The Author(s) (or their employer(s)). Published by CSIRO Publishing. This is an open access article distributed under the Creative Commons Attribution-NonCommercial-NoDerivatives 4.0 International License (CC BY-NC-ND)
Abstract
Context: Microplastics are widespread in aquatic ecosystems and are commonly recorded in water, sediment and a broad spectrum of marine biota. Yet, the extent to which organisms ingest microplastics directly or indirectly by trophic transfer is largely unknown.
Aims: This study characterises microplastic abundance across intertidal water, sediment, and marine biota species of different trophic levels, and investigates whether biomagnification occurs.
Methods: Water, sediment, molluscs, crustaceans and fish were sampled from a single area in southern Australia.
Key results: Microplastics were recorded in 35% of water, 45% of sediment and 39% of biota samples. Plastic load was 0.36 ± 0.08 microplastics g−1 DW for sediment, 0.50 ± 0.17 microplastics L−1 for water, and 0.70 ± 0.25 microplastics individual−1 for biota. Biomagnification was not found, although similarities in plastic characteristics across biota may imply trophic transfer. Most of the microplastics were fibres (97.5%) of blue, black and transparent colour. Spectral analysis (μ-FTIR) indicated that polyester (50%) and polyethylene (42.3%) dominated the polymer compositions.
Conclusions: There were no significant differences in microplastic contamination among biota species, with no biomagnification identified.
Implications: We provide information on biomagnification of microplastics alongside a still uncommon characterisation of contamination in water, sediment and biota.
Keywords: biomagnification, biota, contamination, marine debris, microplastic, plastic pollution, southern hemisphere, trophic transfer.
Introduction
Plastic pollution has become a pressing global issue in recent decades, with the United Nations labelling it as one of our most significant environmental challenges (United Nations Environment Programme 2014, 2021). Plastics have become an integral part of the modern world because of their durability, persistence, low cost and versatility (Hamilton et al. 2021). Over time, if not properly managed, plastic waste can be transported to the marine environment where it breaks down into different-sized plastics from macro-, meso- to micro- (<5 mm in size) and even nanoplastics, under the influence of ultra-violet radiation, photo-oxidative reactions and mechanical forces (Worm et al. 2017). Microplastics of different size, shape and density have been identified in biota of all trophic levels, from filter feeders to deposit feeders, and from small primary consumers to top predators (Cole et al. 2013; Lusher 2015; Nelms et al. 2018; Miller et al. 2020; Sarker et al. 2022). Once ingested, microplastics may induce ecotoxicological risks and physical damage, as well as potentially desorbing a cocktail of associated chemicals to biological tissues (Wright et al. 2013; Huang et al. 2021). Despite this, knowledge of the risks that microplastics pose to biota is still limited.
Many studies focus on the ingestion and abundance of microplastics in individual species (Soo et al. 2021) or relative to the environment (e.g. bioconcentration). However, microplastics can also be ingested indirectly as a result of trophic transfer and biomagnification, whereby contaminated prey items are consumed by predators, and contamination is higher than that of the prey (Farrell and Nelson 2013). Few studies have evaluated the occurrence of biomagnification of microplastics across broad food webs and trophic levels in the wild (but see e.g. Covernton et al. 2022), with most undertaken in experimental laboratory conditions (Farrell and Nelson 2013; Nelms et al. 2018; Costa et al. 2020). These studies have shown mixed results of trophic transfer and biomagnification, likely because exposure conditions can be unrealistic compared with what occurs naturally in the wild, research questions vary, and few studies quantify multiple trophic levels and organisms (Miller et al. 2020). Furthermore, the extent of microplastic biomagnification in predators from ingested prey is unresolved because of unknown ingestion, retention, egestion or depuration rates (Chagnon et al. 2018; Wang et al. 2021; Covernton et al. 2022). Ingestion is a major pathway of microplastic uptake in aquatic biota; therefore, a broad understanding of the contamination of the surrounding environment (e.g. water, sediment), together with information across food webs, will be key to determining whether feeding habits, species-specific traits, or trophic levels pose different microplastic exposure risks. There is still a lack of understanding as to the fate and cycling of microplastics within complex and interconnected food webs and ecosystems (Nelms et al. 2018).
Microplastic ingestion has been reported globally, including in wild bivalve molluscs collected along South Australia’s coastline (Klein et al. 2022), and in South Australian seafood species sold for human consumption (Wootton et al. 2021a; Ogunola et al. 2022). However, there is still limited research worldwide characterising multiple marine matrices (e.g. water, sediment and biota) within the same location (but e.g. Kazour et al. 2019; Miller et al. 2023). In addition, there are no microplastic data recorded for the coastal marine areas of the Yorke Peninsula region and the western area of Gulf Saint Vincent (South Australia). We aimed, first, to analyse microplastic contamination across water, sediment and marine biota from different trophic levels, and, second, to investigate whether biomagnification of microplastics (using trophic magnification factors) was occurring in these coastal environments. Namely, we sampled invertebrates such as gastropods, bivalves and decapod crustaceans, as well as fish. Overall, we characterised microplastic contamination in three environmental matrices, in an important, yet understudied, region of the southern hemisphere, and increased our knowledge of biomagnification potential in wild conditions, across a wide number of species and trophic levels.
Materials and methods
Study area
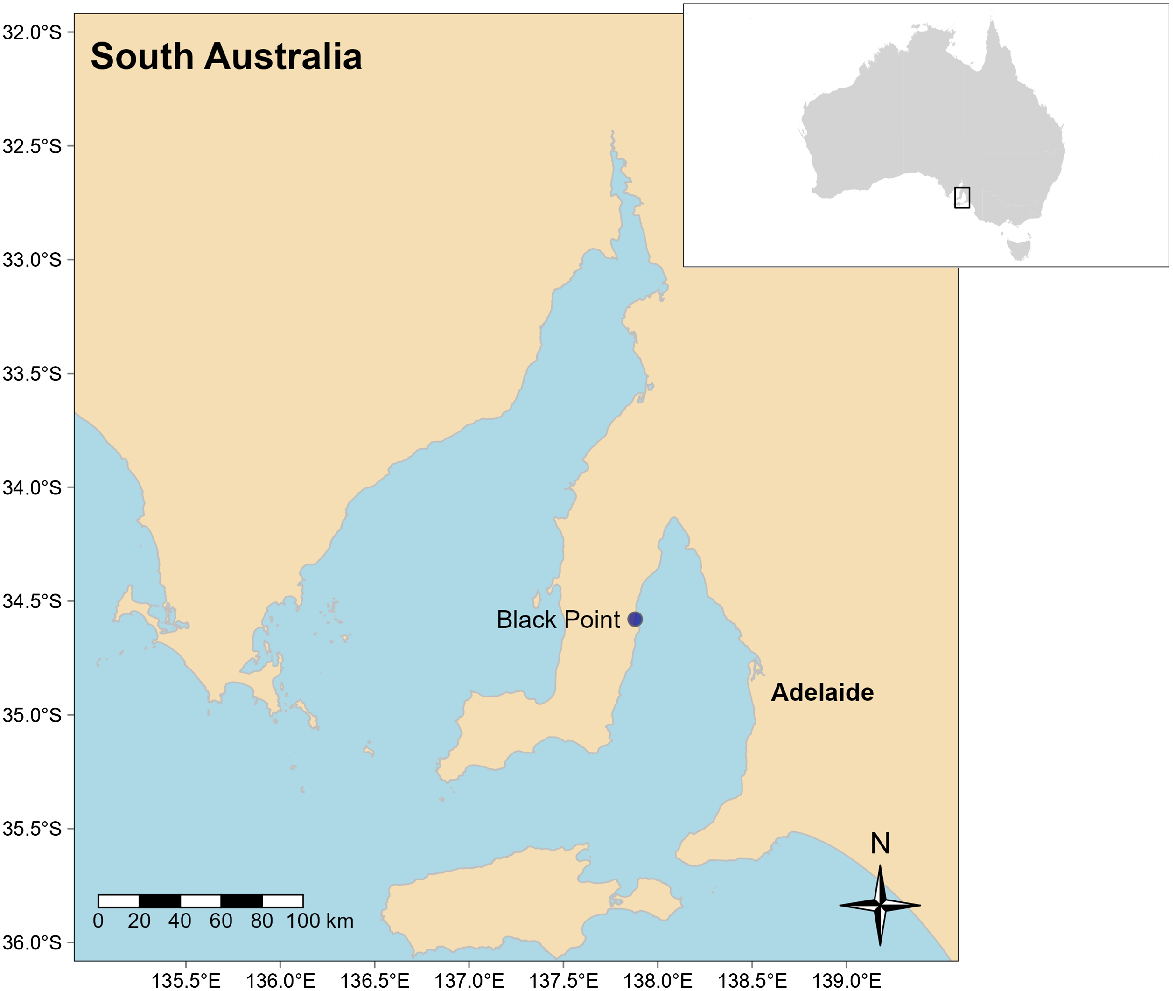
The study was conducted at Black Point, a coastal site on the Yorke Peninsula, (Fig. 1) located in the south-east of South Australia. Black Point is in a remote, rural area, 175 km from the state capital city of Adelaide, and is characterised by a protected bay and long sandy beach with a low human population (<100 inhabitants, in 2016 Australian census), although population numbers increase during the summer months.
Sample collection
In March 2022, surface-water samples (n = 20) were collected from the intertidal zone by using 1 L of pre-washed polypropylene plastic containers. Surface sediment (n = 40) was collected from the top layer (~5 cm) of the benthic intertidal environment at a water depth of <20 cm, into 70-mL polypropylene sampling containers (i.e. the top layer of the sediment was displaced towards the container with added caution). Water and sediment samples were collected randomly in the intertidal environment (>50 m from the high tide line) across a 100-m radius. All samples were transported on ice and stored frozen (−5°C) until further analysis.
At the same time and location where the sediment and water were collected, a total of 145 marine macro-benthic invertebrate and vertebrate biota was sampled. Yellowfin whiting (Sillago schomburgkii, n = 18) and blue swimmer crab (Portunus armatus, n = 18) were collected with seine net and rod and line. Other fauna, including razorfish (Pinna bicolor, n = 49), mussel (Brachidontes spp., n = 51) and black nerite snail (Nerita atramentosa, n = 9) were collected by hand. Fish were euthanased using the Ike Jime method (ethics approval, S-2020-090 from The University of Adelaide and Ministerial exemption ME9903203) and all biota were individually wrapped in foil and placed immediately on ice. In the laboratory, total weight and total length (including shell or carapace) were measured and recorded (Table 1). All biota samples were then rinsed with ultrapure water (Milli-Q Advantage A10, filter 22 μm). Whole soft tissue contents of nerite snail, mussel and razorfish and gastro-intestinal tracts of blue swimmer crab and yellowfin whiting were dissected and extracted with forceps, weighed, wrapped with aluminium foil and stored frozen (20°C) for subsequent microplastic analyses (Karlsson et al. 2017).
| Species | Animal type | Trophic level, trophic position | Sample size (n) | Body weight (g) | Shell, carapace or body length (cm) | Tissue or gut weight (g) | MP items (individual−1) | MP items (g−1 WW) |
|---|---|---|---|---|---|---|---|---|
| Nerite snail | Gastropod | 2, primary consumerA | 9 | 29.91 ± 15.02 | 3.83 ± 0.88 | 5.49 ± 2.75 | 1.33 ± 0.58 | 0.48 ± 0.31 |
| Mussel | Bivalve mollusc | 2, primary consumerB,C | 51 | 0.78 ± 0.43 | 1.53 ± 0.08 | 0.13 ± 0.02 | 0.39 ± 0.12 | 3.71 ± 1.22 |
| Razorfish | Bivalve mollusc | 2, primary consumerB,C | 49 | 132.55 ± 5.72 | 21.16 ± 0.38 | 19.18 ± 0.92 | 0.57 ± 0.11 | 0.03 ± 0.01 |
| Blue swimmer crab | Decapod crustacean | 2.97, secondary consumerB,D | 18 | 195.59 ± 11.84 | 6.66 ± 0.07 | 14.50 ± 1.03 | 0.56 ± 0.20 | 0.04 ± 0.02 |
| Yellowfin whiting | Fish | 3.2, tertiary consumerE | 18 | 181.22 ± 9.89 | 35.51 ± 0.58 | 15.24 ± 1.42 | 0.67 ± 0.25 | 0.05 ± 0.02 |
Morphometrics and microplastic loads are means ± s.e. MP, microplastic. Trophic level was obtained from the literature.
EFishBase, R. Froese, and D. Pauly, see http://www.fishbase.org.
Microplastic extraction
Each replicate water sample was filtered onto 25-μm stainless steel Hollander woven mesh filters in a filtration connected to a vacuum pump (Williams et al. 2020; Cutroneo et al. 2021). All filters were transferred to pre-cleaned glass jars to dry at room temperature (~21°C) and were examined under a dissecting stereo-microscope (Leica M80 with integrated IC90E camera, magnification 7.5× to 60×).
A subsample of 2 g was weighed from each replicate sediment sample and freeze-dried in glass centrifuge tubes. To remove organic matter, Fenton’s reagent (10 parts ferrous heptahydrate, FeSO4⋅7H2O; 10 parts 30% hydrogen peroxide, H2O2; and 1 part hydrochloric acid, HCl) was added to the dried sediment samples. The samples were left overnight (12 h), and then 10 mL of zinc chloride (ZnCl2) was added to each sample to stop the reaction. Reacted sediment samples were centrifuged for 20 min (15°C, 500g) and filtered (as per water samples). The 25-μm stainless steel Hollander woven mesh filters were similarly pretreated and examined under the dissecting microscope (Williams et al. 2020; Cutroneo et al. 2021; Reineccius et al. 2021).
For biota samples, soft tissue (razorfish, mussels, nerite snails), or gastro-intestinal tract (blue-swimmer crabs, yellowfin whiting) of each individual was transferred to a large glass beaker and digested with 10% potassium hydroxide solution (KOH) (Rochman et al. 2015). The added solution was at least three times the volume of biological material, and the glass beakers were covered with aluminium foil to prevent any air contamination. Aluminium foil never came in contact with KOH or digested solution. The samples were heated for 8–12 h at 60°C in the oven, as recommended by Dehaut et al. (2016) and Lusher et al. (2017a). The use of 10% KOH at 60°C is an efficient and effective method to digest biota for microplastic analysis (Dehaut et al. 2016). The recovery rate of using KOH at this temperature is suitable when using short digestion times (Karami et al. 2017; Prata et al. 2019), with the added benefit of facilitating global comparisons to studies that use this methodological approach (Lusher et al. 2017a; Hartmann et al. 2019). The resultant solution was filtered through stainless steel sieves of 1 mm and 38 μm. Microplastics retained on each of the sieves were examined under the dissecting stereo-microscope (Ogunola et al. 2022). Overall, for all sample types, microplastics in the filters or sieves were visually examined, manually scanning the whole sample, with potential microplastics identified, counted and information on shape (fibre, film or fragment) and colour was recorded, following methods and criteria in Hidalgo-Ruz et al. (2012).
Spectroscopic analyses and identification
Polymer identification was conducted with attenuated total reflectance Fourier transform infrared spectroscopy (μ-FTIR; Bruker Hyperion). A subset of 20% of the suspected microplastics (including 20% of the portion of microplastics from each of the sediment, water and biota samples) was randomly selected for μ-FTIR analysis following the recommendations for spectral analysis (Lusher et al. 2017b; Wootton et al. 2021a). This step was undertaken primarily to confirm and validate that samples collected as putative microplastics were plastic. The FTIR spectrum of each potential microplastic piece was recorded using an average of 64 scans in the range of 3900–650 cm−1 with the atmospheric water CO2 region between 2500 and 1900 cm−1 excluded when compared with the BRUKER Hyperion ATR spectral library for polymers. A threshold score of at least 70% (hit quality) was used to ensure the reliability of the identification of microplastics (Wootton et al. 2022; Zhang et al. 2022).
Quality control and assurance
Quality control procedures were undertaken to limit the risk of external contamination during field sampling and laboratory analysis. All sampling and storage containers were cleaned, triple rinsed with ultrapure water and dried in a laminar flow before use. During field sampling, containers were fully submerged beneath the surface prior to being opened, so as to limit their exposure to open air. In the laboratory, all dissecting tools and bench surfaces were wiped with 70% ethanol and lint-free wipes (Kimtech Science Kimwipes) between sessions. Dissection tools were triple rinsed with ultrapure water and dried in a laminar flow and covered with aluminium foil before use, as was all glassware, such as beakers. All chemicals and solvents were filtered before use with 25-μm Stainless steel Hollander mesh filter. Sample processing was conducted in a laminar flow to exclude external contamination. Field and laboratory procedural blanks and airborne contamination controls (i.e. open vials with water and no tissue) were used to check for any background contamination and were processed, sieved and examined under the microscope in the same manner as other samples (Wootton et al. 2021a). Although polypropylene containers were used to collect sediment and water samples, they were thoroughly cleaned and rinsed prior to use (see above), and blank controls were run to check for contamination. Additionally, polypropylene was found only in biota samples, where no polypropylene was utilised. Throughout the sample preparation, natural clothing and bright pink polyester laboratory coats were worn, as well as blue nitrile gloves, to control for potential cross contamination from the operator’s garments. No contamination occurred in any of the dissection, digestion, or microscopy control samples.
Data analysis
Microplastic load is reported in water as the number of microplastic items per litre of water filtered and in sediments as microplastic items per gram of dry sediment (MPs g−1 DW). The frequency of occurrence of microplastic was also estimated (i.e. percentage of samples with at least one piece of plastic). In biota, data are presented as the frequency of occurrence of microplastic, and as the average number of microplastic items both per individual and per gram wet weight (MPs g−1 WW) to facilitate comparisons across the literature. Single-factor permutational multivariate analysis of variance (PERMANOVA) was used to compare plastic loads in biota.
The biomagnification potential of microplastics was determined using trophic magnification factors (TMF) testing the relationship between trophic levels (TL) and microplastic abundance (MP). TMF evaluates the change in contaminant concentrations per trophic level, assuming that the diet is a major route of exposure to microplastics, and trophic level a main driver of the accumulation of microplastics in organisms and food webs. Trophic magnification factor (TMF) was calculated using an approach similar to that used in previous studies (Borgå et al. 2012; Diepens and Koelmans 2018; Alava 2020). For broader comparison purposes, we use microplastics per organism and microplastics per weight approaches, with the latter being better suited for comparisons among differently sized organisms. First, a linear regression of microplastic abundance and species trophic levels was expressed by the following equation:
where TL represents the trophic level of the organisms and the intercept (a) represents the baseline of microplastic abundance in the environment. The trophic magnification factor (TMF) along the food web, was then estimated as the antilog of the slope (b) as follows:
whereby a positive slope results in a TMF value of >1 and indicates that microplastics are biomagnifying, whereas a zero or a negative slope indicates that microplastics are not biomagnifying (Borgå et al. 2012).
Species trophic levels were derived from values obtained from FishBase (see http://www.fishbase.org) and previous studies using stable nitrogen or carbon isotope ratios of diet/tissue analysis (Borgå et al. 2012; Zhang et al. 2022). Data analysis was performed in R (ver. 4.1.1, R Foundation for Statistical Computing, Vienna, Austria, see https://www.r-project.org/) with ‘car’ (ver. 3.1-2, see https://CRAN.R-project.org/package=car; Fox and Weisberg 2019), ‘Rmisc’ (ver. 1.5.1, R. M. Hope, see https://cran.r-project.org/package=Rmisc), ‘ggplot2’ (ver. 3.4.2, see https://CRAN.R-project.org/package=ggplot2; Wickham 2016), ‘ggpubr’ (ver. 0.1, A. Kassambara and M. A. Kassambara, see https://cran.r-project.org/package=ggpubr), ‘dplyr’ (ver. 1.1.2, H. Wickham, see https://github.com/tidyverse/dplyr), ‘tidyverse’ (ver. 2.0.0, see https://cran.r-project.org/package=tidyverse; Wickham et al. 2019), ‘raster’ (ver. 3.6-20, R. J. Hijmans, J. Van Etten, J. Cheng, M. Mattiuzzi, M. Sumner, J. A. Greenberg, O. P. Lamigueiro, A. Bevan, E. B. Racine and A. Shortridge, see https://cran.r-project.org/package=raster) and ‘sf’ (ver. 1.0-12, see https://cran.r-project.org/package=sf; Pebesma 2018) packages. PERMANOVA analyses were calculated using PRIMER software (ver. 7, see https://www.primer-e.com/).
Results
Microplastics in water and sediment
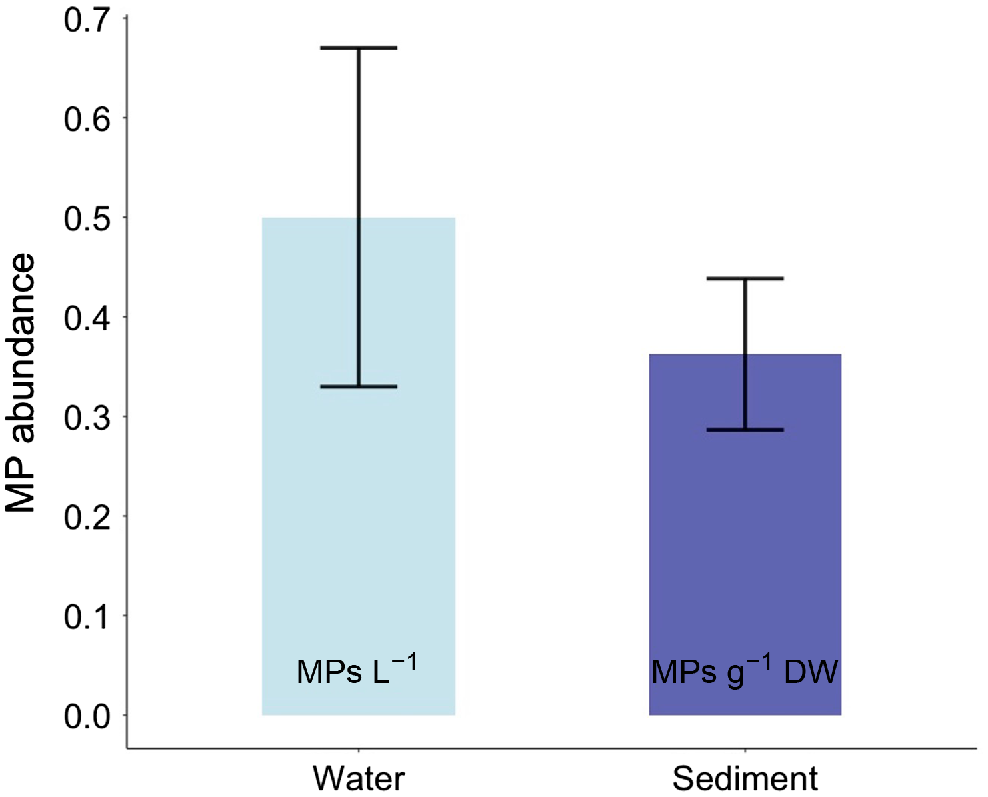
Microplastics in surface water and sediment at Black Point averaged 0.50 ± 0.17 microplastics L−1 of water and 0.36 ± 0.08 microplastics g−1 DW of sediment (mean ± s.e.) (Fig. 2). It total, 45% of the sediment samples (18 of 40 samples) had microplastics present, whereas only 35% of the water samples (7 of 20) were contaminated.
Microplastics in biota
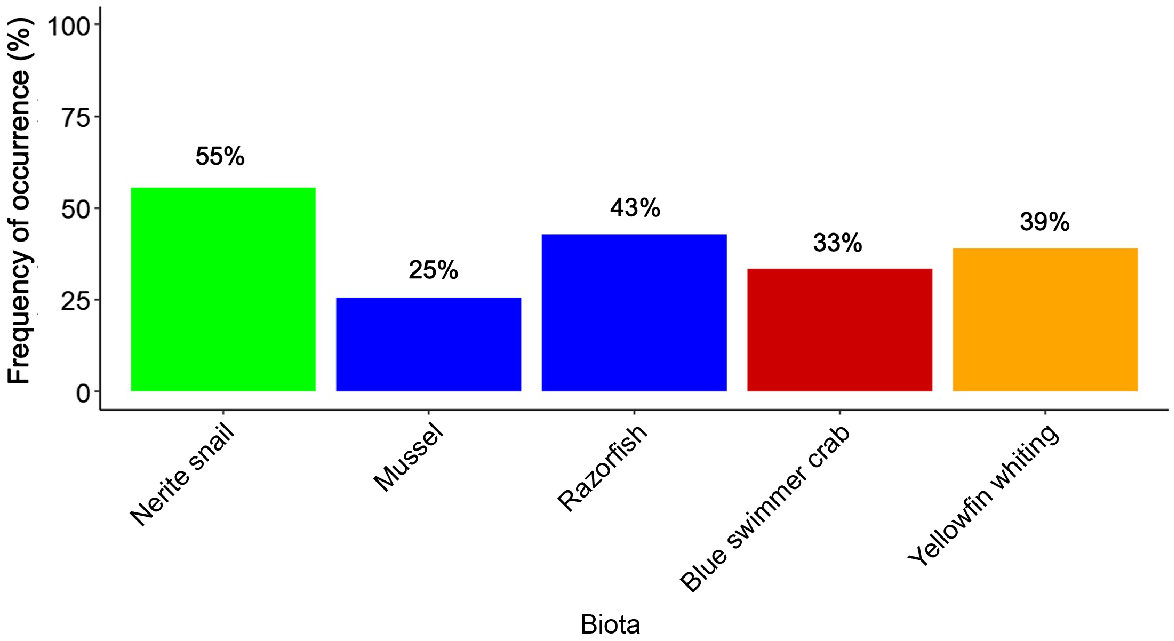
Microplastics were found in all biota species. The frequency of occurrence was 35.8% (52 of 145 samples) across all species, although there were variations among species. Nerite snails (55%) and mussels (25%) had the highest and lowest frequency of occurrence of microplastics respectively. The frequencies of razorfish, yellowfin whiting, and blue swimmer crab varied between 33 and 43% (Fig. 3). Similarly, the average number of items of microplastic per individual was highest in nerite snail (1.33 microplastics, range 0–5), which was more than double the amount found in yellowfin whiting, blue swimmer crab, and razorfish, with 0.67 (range, 0–4), 0.57 (range, 0–2) and 0.56 (range, 0–3) microplastics per individual respectively. Mussels had the lowest microplastic abundance, with 0.39 (range 0–5) microplastics per individual (Table 1, Supplementary Fig. S1). No significant differences were observed between species for microplastic abundance (PERMANOVA, F4,140 = 1.97, P = 0.08, Supplementary Table S1). Consequently, no biomagnification was evident for microplastic abundance per individual (slope = 0.01, R2 < 0.01, TMF = 1.0).
Frequency of occurrence of microplastic ingestion for biota species:gastropods (green); bivalve mollusc (blue); decapod crustacean (red); fish (orange).
When weight was considered, mussels had the highest average level of microplastic (3.71 microplastics g−1 WW), followed by nerite snails (0.48 microplastics g−1 WW). This is likely driven by the low bodyweight of the mussels and the few specimens that had up to five microplastic pieces per individual (Table 1, Fig. S1). Significant differences were recorded among species (PERMANOVA, F4,140 = 4.04, P = 0.01, Table S1). Although mussels had the highest average level of microplastics per gram wet weight, they were only significantly higher than razorfish (Table 1). This high contamination per wet weight was driven by a few individuals having concentrations of up to five microplastics per specimen as well as low individual size or weight (Fig. S1). Additionally, nerite snail had significantly higher numbers of microplastics per gram wet weight than did razorfish, blue swimmer crab and yellowfin whiting (Table S1). When considering all species, the slope was negative and thus the TMF suggested dilution (slope = −0.12, R2 = 0.02, TMF = 0.76). However, this value was strongly driven by mussels, and in particular the few individual mussels that had high values (Fig. S1b). When mussels were removed, the TMF value was close to one (slope = −0.01, R2 = 0.01, TMF = 0.98), suggesting no biomagnification or dilution occurred.
Characteristics of microplastics across environmental and biota samples
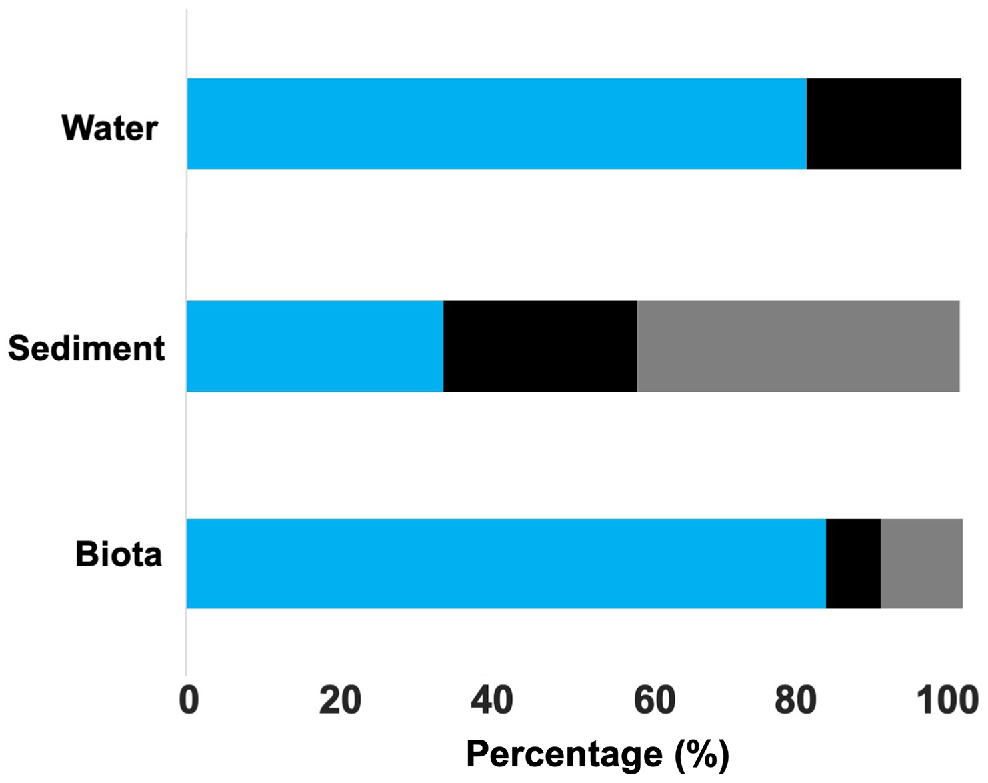
The shapes of the microplastics in this study were dominated by fibres (97.5%), with the remaining pieces being fragments, with the latter found only in higher trophic-level organisms (two fragments in yellowfin whiting and one fragment in a blue swimmer crab). There were three colours of microplastic fibres, namely, blue, black and transparent. There were differences in the colour of microplastics found in the different environmental matrices. Microplastics in water and biota were mostly blue (80 and 82.4% respectively), whereas in sediments 41.7% of pieces were transparent, followed by 33.3% blue and 25% black (Fig. 4). Comparing across individual species, blue microplastics dominated with ratios (75–90%) closely matching those of blue microplastics in the water (Fig. S2). We found transparent microplastics (fibres), matching those found in the sediment, only in three species (i.e. nerite snails 8.3%, razorfish 10.7% and yellowfin whiting 16.7%). Microplastic pieces were all >300 μm, with only five pieces (i.e. 4% of total) larger than 1 mm and found in water and biota samples (mussel, nerite snail and razorfish).
Percentage of the microplastic colours found in water, sediment and biota (n = 7, 18 and 52 respectively). The colours shown in the figure represent the colours of the microplastic (blue, black and transparent).
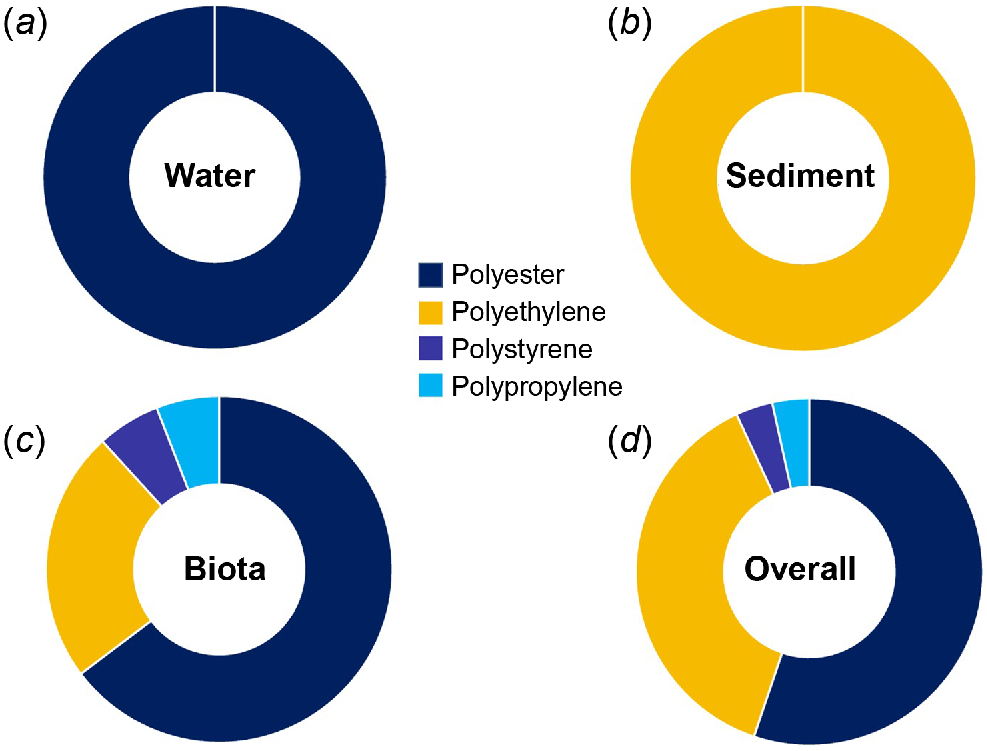
When further identifying the microplastics under the μ-FTIR, four polymer types were identified, with clear differences among environmental matrices. All microplastics tested were verified as plastic. All the microplastics tested from water were identified as polyester, whereas the pieces tested from sediment were all polyethylene (Fig. 5). Biota had a large portion of polyester (64.7%), followed by polyethylene (23.5%). One piece of polypropylene and one of polystyrene were found in blue swimmer crabs and yellowfin whiting respectively, with polyester being dominant across species (Fig. 5, S3).
Discussion
This study has reported the occurrence of microplastics in surface water, sediment, and biota from three different trophic levels in an area with limited urban impact. The results showed that contamination was generally low, and although fibres dominated, polyester was most prevalent in water, polyethylene in sediment, and biota had a mix of polymers mostly reflective of their immediate environment. The shape of microplastic pieces across biota was dominated by fibres, also matching findings in both the sediment and water. The same three colours were found across biota, water and sediment, but blue dominated in water and biota, implying a likely route for uptake. Microplastics were found in all the sampled species, including gastropods, bivalve molluscs and fish, spread across different trophic levels and feeding strategies. Although there were variations in the frequencies of occurrence and abundances of microplastics, we found no indication of trophic magnification of microplastics across this food web. Species from the lower trophic level had both the highest and lowest microplastic loads per individual, namely, the nerite snail and mussels respectively. Yet, both nerite snails and mussels had microplastic loads (microplastics g−1 WW) several times higher than in the other sampled species, with size, ecological and species-specific traits likely playing a role (Miller et al. 2020; Covernton et al. 2022).
Microplastic abundance in the water at Black Point (0.50 microplastics L−1) was lower than contamination found in intertidal water across other coastal regions of South Australia, and which ranged from 2.9 to 16.3 microplastics L−1 (Klein et al. 2022). However, levels of microplastic in sediment (average 0.36 microplastics g−1 DW) were higher than in coastal areas on the eastern coast of Australia, where microplastics ranged from 0.08 to 0.35 microplastics g−1 DW (Jahan et al. 2019). The only other study sampling South Australian marine sediments with comparable sampling approaches and units to our study focused on deep offshore oceanic sediment where between 0 and 13.6 microplastics g−1 DW were recorded (Barrett et al. 2020). When comparing the contamination of biota from Black Point to other regions, the frequency of occurrence was expectedly low and matched values observed both in Australia and worldwide, namely in regions with lower human presence. For example, 35.5% of fish (Wootton et al. 2021a) and 48% of crustaceans (Ogunola et al. 2022) across Australian marine waters had microplastic present; however, up to 92% of mussels (Klein et al. 2022) and 100% of oysters (Jahan et al. 2019) sampled from coastal urban areas contained microplastic. Likewise, these trends match global microplastic contamination, where frequency of occurrence and plastic load is generally higher in more populated and urban regions than in isolated areas (Jang et al. 2014; Gola et al. 2021). In addition to human activity, other factors such as currents, winds and hydrodynamics will also contribute to the spatial variations across regional areas in South Australia (Reisser et al. 2013; Klein et al. 2022; Ogunola et al. 2022; Leterme et al. 2023). Nonetheless, accurate comparison of microplastic loads across studies is still difficult because of a wide variety of sampling, laboratory, and quality-control methods (Provencher et al. 2020a; Wootton et al. 2021b). Multiple factors including variations in collection methods, sieve size, sample size, use of chemical digestion, units of measurement, contamination control and validation of polymer identification hamper robust comparisons (Provencher et al. 2020a; Omeyer et al. 2022). This is a major issue across microplastic research. It is important to work towards harmonised and reproducible approaches for sampling and analysis of microplastics to increase repeatable and comparable data.
The majority of the microplastics observed were fibres (98.8%), which is consistent with the prevalence of fibres in coastal and marine environments globally (Barrows et al. 2018; Ferreira et al. 2020; Hamilton et al. 2021). Laundry of textile clothes or fabrics in washing machines has been recognised as a major source of contamination of fibres (e.g. polyester) to aquatic environments in effluent or wastewater (Napper and Thompson 2016; Hernandez et al. 2017; De Falco et al. 2019). Although the level per litre of contamination of treated wastewater is generally low (e.g. ~1 microplastics L−1) (Browne et al. 2011; Ziajahromi et al. 2021), because of the large volumes of discharge, wastewater plants can be an important pathway to environmental contamination. Estimates of effluent loads from treated wastewater in Australia can reach up to 133 million microplastics (>25 μm in size) per day (Ziajahromi et al. 2021). Despite the low values of microplastic found in this study, communities such as Black Point have seasonal increases in human population over the summer months, and it is worth investigating whether these fluctuations in population density are reflected in the local environment (Klein et al. 2022), together with a potential increase in recreational fishing, considering fishing gear may also be a source of microplastic fibres such as polyethylene (Andrady 2011; Silva-Cavalcanti et al. 2017).
All individuals were collected from Black Point and were likely to have been exposed to similar environmental conditions. Although there were variations in microplastic load (per individual or per gram WW) and uptake among species, there was no evidence for biomagnification. Similarities in microplastic shape and colour across biota species indicated that trophic transfer could potentially still be occurring, but not being magnified up trophic levels. Likewise, regarding polymers, although noting that we tested only a portion of all microplastics for polymer type. Evaluations of trophic transfer and biomagnification of microplastics across food webs and marine ecosystems are limited and results remain inconsistent, with magnification not demonstrated (Akhbarizadeh et al. 2019; Covernton et al. 2022; Miller et al. 2023). Overall, meta-analyses have not supported biomagnification across marine food webs in wild settings (Miller et al. 2020), although there are reports implying trophic transfer among different groups of species (Sarker et al. 2022; Miller et al. 2023) or within a group of species (e.g. fish; Zhang et al. 2022). Whereas variations are likely to be due to regional factors, different microplastic contamination, as well as species ecological traits and interconnections within a food web, other key points to consider are differences in organisms’ egestion rates and plastic sizes in the environment (Ward et al. 2019; Xiong et al. 2019). Modelling approaches (Alava 2020) and links between microplastic contamination and stomach fullness suggest egestion rates play a major role, at least for larger microplastics (Covernton et al. 2022), with laboratory studies also showing that trophic dilution occurs, including at high contamination loads (Kim et al. 2018; Elizalde-Velázquez et al. 2020). To further resolve these inconsistencies regarding biomagnification, we are likely to need a combination of laboratory or mesocosm-based studies with realistic levels of microplastic contamination. Replicating assessments on the same or similar species across regions with different environmental contamination loads may also be beneficial (including across an intertidal–subtidal gradient).
Differences in polymer type across matrices are likely to be a result of the density and fate of different plastic types, with higher-density plastics often sinking and low-density plastics staying afloat. Here, the most abundant types of polymers were polyester (density ~1.38 g cm−3) in the water column and polyethylene (density ~1.0 g cm−3) in the sediment. Biofouling and weathering (such as in the case of polyethylene), together with site- and environment-specific conditions (e.g. wave action and water turbidity, in the case of polyester) are likely to contribute to these findings. Similar results have been found in South Australia’s coastline, with high prevalence and numbers of polyester fibres in water samples (Leterme et al. 2023), and polyethylene in sediment (Hayes et al. 2021). Although we acknowledge that we analysed only a limited number of samples, polymer characteristics reflect the connectivity between biota and the environmental matrix, with more polyethylene being found in mussels, and polyester in razorfish and yellow-fin whiting, implying that organisms that forage in intertidal and subtidal areas of Black Point are susceptible to microplastics from the sediment and water column respectively. Nonetheless, we also found polystyrene in fish but not in the local environment at this sampling time, which could be linked to variations in environmental contaminations or broader habitat use of these organisms. Moreover, the prevalence of blue fibres in biota was similar across species (trophic levels) and is likely to confirm ingestion from the water, where blue fibres dominated, but results also reflect uptake from sediment by the uptake of transparent microplastics. Overall, the occurrence of blue, black and transparent fibres is common (Ogunola et al. 2022) and is likely to result from both intentional or unintentional ingestion (Roch et al. 2020; Li et al. 2021).
Microplastic ingestion is pervasive in marine biota across all trophic levels and feeding strategies including gastropods, bivalve molluscs, decapod crustaceans and fish, which are important fishery resources (Karlsson et al. 2017; Hamilton et al. 2021; Zaki et al. 2021). Yet, we still need to further understand the risk of harm, and physical and chemical effects of different levels and types of microplastics in biota (Lusher et al. 2017b; Provencher et al. 2020b). Our study is one of few studies to sample across three environmental matrices (water, sediment and biota), and different trophic levels, providing evidence of low levels of microplastic contamination (but see e.g. Kazour et al. 2019; Miller et al. 2023). Overall, characterising microplastic contamination across environmental matrices is critical for a comprehensive understanding of the occurrence (i.e. how much and where) and the potential fate of microplastics in coastal ecosystems. Although low environmental contamination may restrict trophic magnification, results are in line with previous findings. It is recommended that future studies select more species, and replicate assessments across regions with different environmental contamination to help unfold how species-specific traits and environmental factors may influence vulnerability to microplastics in coastal environments. Ultimately, understanding the fate of plastic pollution in marine food webs, particularly the uptake, transport through diverse trophic level species, and retention time, would further help unravel the effects of microplastics at individual, population and ecosystem levels.
Data availability
The data that support this study are available in FigShare (doi:10.6084/m9.figshare.23071187).
Acknowledgements
Many thanks go to Rhiannon Van Eck and Jonathan Sims for assisting with sample collections. We are grateful to Aoife McFadden, and acknowledge the instruments and expertise of Microscopy Australia at Adelaide Microscopy, The University of Adelaide, enabled by NCRIS, university, and state government support.
References
Akhbarizadeh R, Moore F, Keshavarzi B (2019) Investigating microplastics bioaccumulation and biomagnification in seafood from the Persian Gulf: a threat to human health? Food Additives & Contaminants – A 36(11), 1696-1708.
| Crossref | Google Scholar |
Alava JJ (2020) Modeling the bioaccumulation and biomagnification potential of microplastics in a cetacean foodweb of the northeastern pacific: a prospective tool to assess the risk exposure to plastic particles. Frontiers in Marine Science 7, 566101.
| Crossref | Google Scholar |
Andrady AL (2011) Microplastics in the marine environment. Marine Pollution Bulletin 62(8), 1596-1605.
| Crossref | Google Scholar |
Barrett J, Chase Z, Zhang J, Holl MMB, Willis K, Williams A, Hardesty BD, Wilcox C (2020) Microplastic pollution in deep-sea sediments from the Great Australian Bight. Frontiers in Marine Science 7, 576170.
| Crossref | Google Scholar |
Barrows APW, Cathey SE, Petersen CW (2018) Marine environment microfiber contamination: global patterns and the diversity of microparticle origins. Environmental Pollution 237, 275-284.
| Crossref | Google Scholar |
Borgå K, Kidd KA, Muir DCG, Berglund O, Conder JM, Gobas FAPC, Kucklick J, Malm O, Powell DE (2012) Trophic magnification factors: considerations of ecology, ecosystems, and study design. Integrated Environmental Assessment and Management 8(1), 64-84.
| Crossref | Google Scholar |
Browne MA, Crump P, Niven SJ, Teuten E, Tonkin A, Galloway T, Thompson R (2011) Accumulation of microplastic on shorelines worldwide: sources and sinks. Environmental Science & Technology 45(21), 9175-9179.
| Crossref | Google Scholar |
Chagnon C, Thiel M, Antunes J, Ferreira JL, Sobral P, Ory NC (2018) Plastic ingestion and trophic transfer between Easter Island flying fish (Cheilopogon rapanouiensis) and yellowfin tuna (Thunnus albacares) from Rapa Nui (Easter Island). Environmental Pollution 243, 127-133.
| Crossref | Google Scholar |
Cole M, Lindeque P, Fileman E, Halsband C, Goodhead R, Moger J, Galloway TS (2013) Microplastic ingestion by zooplankton. Environmental Science & Technology 47(12), 6646-6655.
| Crossref | Google Scholar |
Costa E, Piazza V, Lavorano S, Faimali M, Garaventa F, Gambardella C (2020) Trophic transfer of microplastics from copepods to jellyfish in the marine environment. Frontiers in Environmental Science 8, 571732.
| Crossref | Google Scholar |
Covernton GA, Cox KD, Fleming WL, Buirs BM, Davies HL, Juanes F, Dudas SE, Dower JF (2022) Large size (>100-μm) microplastics are not biomagnifying in coastal marine food webs of British Columbia, Canada. Ecological Applications 32, e2654.
| Crossref | Google Scholar |
Cutroneo L, Reboa A, Geneselli I, Capello M (2021) Considerations on salts used for density separation in the extraction of microplastics from sediments. Marine Pollution Bulletin 166, 112216.
| Crossref | Google Scholar |
De Falco F, Di Pace E, Cocca M, Avella M (2019) The contribution of washing processes of synthetic clothes to microplastic pollution. Scientific Reports 9(1), 6633.
| Crossref | Google Scholar |
Dehaut A, Cassone A-L, Frère L, Hermabessiere L, Himber C, Rinnert E, Rivière G, Lambert C, Soudant P, Huvet A, Duflos G, Paul-Pont I (2016) Microplastics in seafood: benchmark protocol for their extraction and characterization. Environmental Pollution 215, 223-233.
| Crossref | Google Scholar |
Diepens NJ, Koelmans AA (2018) Accumulation of plastic debris and associated contaminants in aquatic food webs. Environmental Science & Technology 52(15), 8510-8520.
| Crossref | Google Scholar |
Duarte CM, Holmer M, Olsen Y, Soto D, Marbà N, Guiu J, Black KD, Karakassis I (2009) Will the oceans help feed humanity? BioScience 59, 967-976.
| Crossref | Google Scholar |
Elizalde-Velázquez A, Carcano AM, Crago J, Green MJ, Shah SA, Cañas-Carrell JE (2020) Translocation, trophic transfer, accumulation and depuration of polystyrene microplastics in Daphnia magna and Pimephales promelas. Environmental Pollution 259, 113937.
| Crossref | Google Scholar |
Farrell P, Nelson K (2013) Trophic level transfer of microplastic: Mytilus edulis (L.) to Carcinus maenas (L.). Environmental Pollution 177, 1-3.
| Crossref | Google Scholar |
Ferreira M, Thompson J, Paris A, Rohindra D, Rico C (2020) Presence of microplastics in water, sediments and fish species in an urban coastal environment of Fiji, a Pacific small island developing state. Marine Pollution Bulletin 153, 110991.
| Crossref | Google Scholar |
Gola D, Kumar Tyagi P, Arya A, Chauhan N, Agarwal M, Singh SK, Gola S (2021) The impact of microplastics on marine environment: a review. Environmental Nanotechnology, Monitoring & Management 16, 100552.
| Crossref | Google Scholar |
Goldsworthy SD, Loo M, Fowler A, Steer M, Noel C (2017) A trophic model for Gulf St Vincent: balancing exploration of three fisheries in an Ecosystem Based Fisheries Management framework. FRDC Report 2013-031. (South Australia Research and Development Institute Aquatic Sciences: Adelaide, SA, Australia) Available at https://www.frdc.com.au/project/2013-031
Hamilton BM, Rochman CM, Hoellein TJ, Robison BH, Van Houtan KS, Choy CA (2021) Prevalence of microplastics and anthropogenic debris within a deep-sea food web. Marine Ecology Progress Series 675, 23-33.
| Crossref | Google Scholar |
Hartmann NB, Hüffer T, Thompson RC, Hassellöv M, Verschoor A, Daugaard AE, Rist S, Karlsson T, Brennholt N, Cole M, Herrling MP, Hess MC, Ivleva NP, Lusher AL, Wagner M (2019) Are we speaking the same language? Recommendations for a definition and categorization framework for plastic debris. Environmental Science & Technology 53(3), 1039-1047.
| Crossref | Google Scholar |
Hayes A, Kirkbride KP, Leterme SC (2021) Variation in polymer types and abundance of microplastics from two rivers and beaches in Adelaide, South Australia. Marine Pollution Bulletin 172, 112842.
| Crossref | Google Scholar |
Hernandez E, Nowack B, Mitrano DM (2017) Polyester textiles as a source of microplastics from households: a mechanistic study to understand microfiber release during washing. Environmental Science & Technology 51(12), 7036-7046.
| Crossref | Google Scholar |
Hidalgo-Ruz V, Gutow L, Thompson RC, Thiel M (2012) Microplastics in the marine environment: a review of the methods used for identification and quantification. Environmental Science & Technology 46(6), 3060-3075.
| Crossref | Google Scholar |
Huang W, Song B, Liang J, Niu Q, Zeng G, Shen M, Deng J, Luo Y, Wen X, Zhang Y (2021) Microplastics and associated contaminants in the aquatic environment: a review on their ecotoxicological effects, trophic transfer, and potential impacts to human health. Journal of Hazardous Materials 405, 124187.
| Crossref | Google Scholar |
Jahan S, Strezov V, Weldekidan H, Kumar R, Kan T, Sarkodie SA, He J, Dastjerdi B, Wilson SP (2019) Interrelationship of microplastic pollution in sediments and oysters in a seaport environment of the eastern coast of Australia. Science of The Total Environment 695, 133924.
| Crossref | Google Scholar |
Jang YC, Lee J, Hong S, Lee JS, Shim WJ, Song YK (2014) Sources of plastic marine debris on beaches of Korea: more from the ocean than the land. Ocean Science Journal 49(2), 151-162.
| Crossref | Google Scholar |
Karami A, Golieskardi A, Choo CK, Romano N, Ho YB, Salamatinia B (2017) A high performance protocol for extraction of microplastics in fish. Science of The Total Environment 578, 485-494.
| Crossref | Google Scholar |
Karlsson TM, Vethaak AD, Almroth BC, Ariese F, van Velzen M, Hassellöv M, Leslie HA (2017) Screening for microplastics in sediment, water, marine invertebrates and fish: method development and microplastic accumulation. Marine Pollution Bulletin 122(1–2), 403-408.
| Crossref | Google Scholar |
Kazour M, Jemaa S, Issa C, Khalaf G, Amara R (2019) Microplastics pollution along the Lebanese coast (Eastern Mediterranean Basin): occurrence in surface water, sediments and biota samples. Science of The Total Environment 696, 133933.
| Crossref | Google Scholar |
Kim SW, Kim D, Chae Y, An Y-J (2018) Dietary uptake, biodistribution, and depuration of microplastics in the freshwater diving beetle Cybister japonicus: effects on predacious behavior. Environmental Pollution 242(Part A), 839-844.
| Crossref | Google Scholar |
Klein JR, Beaman J, Kirkbride KP, Patten C, Burke da Silva K (2022) Microplastics in intertidal water of South Australia and the mussel Mytilus spp.; the contrasting effect of population on concentration. Science of The Total Environment 831, 154875.
| Crossref | Google Scholar |
Leterme SC, Tuuri EM, Drummond WJ, Jones R, Gascooke JR (2023) Microplastics in urban freshwater streams in Adelaide, Australia: a source of plastic pollution in the Gulf St Vincent. Science of The Total Environment 856, 158672.
| Crossref | Google Scholar |
Li B, Liang W, Liu Q-X, Fu S, Ma C, Chen Q, Su L, Craig NJ, Shi H (2021) Fish ingest microplastics unintentionally. Environmental Science & Technology 55(15), 10471-10479.
| Crossref | Google Scholar |
Lusher AL, Welden NA, Sobral P, Cole M (2017a) Sampling, isolating and identifying microplastics ingested by fish and invertebrates. Analytical Methods 9, 1346-1360.
| Crossref | Google Scholar |
Miller ME, Hamann M, Kroon FJ (2020) Bioaccumulation and biomagnification of microplastics in marine organisms: a review and meta-analysis of current data. PLoS ONE 15(10), e0240792.
| Crossref | Google Scholar |
Miller ME, Motti CA, Hamann M, Kroon FJ (2023) Assessment of microplastic bioconcentration, bioaccumulation and biomagnification in a simple coral reef food web. Science of The Total Environment 858, 159615.
| Crossref | Google Scholar |
Napper IE, Thompson RC (2016) Release of synthetic microplastic plastic fibres from domestic washing machines: effects of fabric type and washing conditions. Marine Pollution Bulletin 112(1–2), 39-45.
| Crossref | Google Scholar |
Nelms SE, Galloway TS, Godley BJ, Jarvis DS, Lindeque PK (2018) Investigating microplastic trophic transfer in marine top predators. Environmental Pollution 238, 999-1007.
| Crossref | Google Scholar |
Ogunola SO, Reis-Santos P, Wootton N, Gillanders BM (2022) Microplastics in decapod crustaceans sourced from Australian seafood markets. Marine Pollution Bulletin 179, 113706.
| Crossref | Google Scholar |
Omeyer LCM, Duncan EM, Aiemsomboon K, Beaumont N, Bureekul S, Cao B, Carrasco LR, Chavanich S, Clark JR, Cordova MR, Couceiro F, Cragg SM, Dickson N, Failler P, Ferraro G, Fletcher S, Fong J, Ford AT, Gutierrez T, Shahul Hamid F, Hiddink JG, Hoa PT, Holland SI, Jones L, Jones NH, Koldewey H, Lauro FM, Lee C, Lewis M, Marks D, Matallana-Surget S, Mayorga-Adame CG, McGeehan J, Messer LF, Michie L, Miller MA, Mohamad ZF, Nor NHM, Muller M, Neill SP, Nelms SE, Onda DFL, Ong JJL, Pariatamby A, Phang SC, Quilliam R, Robins PE, Salta M, Sartimbul A, Shakuto S, Skov MW, Taboada EB, Todd PA, Toh TC, Valiyaveettil S, Viyakarn V, Wonnapinij P, Wood LE, Yong CLX, Godley BJ (2022) Priorities to inform research on marine plastic pollution in Southeast Asia. Science of The Total Environment 841, 156704.
| Crossref | Google Scholar |
Pebesma E (2018) Simple features for R: standardized support for spatial vector data. The R Journal 10, 439-446.
| Crossref | Google Scholar |
Prata JC, da Costa JP, Girão AV, Lopes I, Duarte AC, Rocha-Santos T (2019) Identifying a quick and efficient method of removing organic matter without damaging microplastic samples. Science of The Total Environment 686, 131-139.
| Crossref | Google Scholar |
Provencher JF, Covernton GA, Moore RC, Horn DA, Conkle JL, Lusher AL (2020a) Proceed with caution: the need to raise the publication bar for microplastics research. Science of The Total Environment 748, 141426.
| Crossref | Google Scholar |
Provencher JF, Liboiron M, Borrelle SB, Bond AL, Rochman C, Lavers JL, Avery-Gomm S, Yamashita R, Ryan PG, Lusher AL, Hammer S, Bradshaw H, Khan J, Mallory ML (2020b) A horizon scan of research priorities to inform policies aimed at reducing the harm of plastic pollution to biota. Science of The Total Environment 733, 139381.
| Crossref | Google Scholar |
Reineccius J, Bresien J, Waniek JJ (2021) Separation of microplastics from mass-limited samples by an effective adsorption technique. Science of The Total Environment 788, 147881.
| Crossref | Google Scholar |
Reisser J, Shaw J, Wilcox C, Hardesty BD, Proietti M, Thums M, Pattiaratchi C (2013) Marine plastic pollution in waters around Australia: characteristics, concentrations, and pathways. PLoS ONE 8(11), e80466.
| Crossref | Google Scholar |
Roch S, Friedrich C, Brinker A (2020) Uptake routes of microplastics in fishes: practical and theoretical approaches to test existing theories. Scientific Reports 10(1), 3896.
| Crossref | Google Scholar |
Rochman CM, Tahir A, Williams SL, Baxa DV, Lam R, Miller JT, Teh F-C, Werorilangi S, Teh SJ (2015) Anthropogenic debris in seafood: plastic debris and fibers from textiles in fish and bivalves sold for human consumption. Scientific Reports 5, 14340.
| Crossref | Google Scholar |
Sarker S, Huda ANMS, Niloy MNH, Chowdhury GW (2022) Trophic transfer of microplastics in the aquatic ecosystem of Sundarbans mangrove forest, Bangladesh. Science of The Total Environment 838, 155896.
| Crossref | Google Scholar |
Silva-Cavalcanti JS, Silva JDB, França EJ, Araújo MCB, Gusmão F (2017) Microplastics ingestion by a common tropical freshwater fishing resource. Environmental Pollution 221, 218-226.
| Crossref | Google Scholar |
Soo CL, Sabana S, Chen CA, Hii YS (2021) Understanding microplastics in aquatic ecosystems – a mini review. Borneo Journal of Marine Science and Aquaculture 5(2), 63-69.
| Crossref | Google Scholar |
Wang Z, Fan L, Wang J, Xie S, Zhang C, Zhou J, Zhang L, Xu G, Zou J (2021) Insight into the immune and microbial response of the white-leg shrimp Litopenaeus vannamei to microplastics. Marine Environmental Research 169, 105377.
| Crossref | Google Scholar |
Ward JE, Zhao S, Holohan BA, Mladinich KM, Griffin TW, Wozniak J, Shumway SE (2019) Selective ingestion and egestion of plastic particles by the blue mussel (Mytilus edulis) and eastern oyster (Crassostrea virginica): implications for using bivalves as bioindicators of microplastic pollution. Environmental Science & Technology 53(15), 8776-8784.
| Crossref | Google Scholar |
Wickham H, Averick M, Bryan J, Chang W, D’Agostino McGowan L, Francois R, Grolemund G, Hayes A, Henry L, Hester J, Kuhn M, Pedersen TL, Miller E, Milton Bache S, Müller K, Ooms J, Robinson D, Seidel PD, Spinu V, Takahashi K, Vaughan D, Wilke C, Woo K, Yutani H (2019) Welcome to the tidyverse. The Journal of Open Source Software 4, 1686.
| Crossref | Google Scholar |
Wijsman JWM, Troost K, Fang J, Roncarati A (2019) Global production of marine bivalves. Trends and challenges. In ‘Goods and Services of Marine Bivalves’. (Eds A Smaal, J Ferreira, J Grant, J Petersen, Ø Strand) (Springer: Cham, Switzerland) doi:10.1007/978-3-319-96776-9_2
Williams M, Pham K, Mulder R, Pring N, Hickey M, Mardel J (2020) Microplastic quantification in wastewater: wastewater influent and effluent trends over a 10 month period. (CSIRO) Available at https://www.epa.nsw.gov.au/-/media/epa/corporate-site/resources/waste/csiro-report-microplastic-quantification-in-wastewater.pdf?la=en&hash=CE61D4515119FCE2BFED31F6B27A87CCEFEAB6E9
Wootton N, Reis-Santos P, Dowsett N, Turnbull A, Gillanders BM (2021a) Low abundance of microplastics in commercially caught fish across southern Australia. Environmental Pollution 290, 118030.
| Crossref | Google Scholar |
Wootton N, Reis-Santos P, Gillanders BM (2021b) Microplastic in fish – a global synthesis. Reviews in Fish Biology and Fisheries 31(4), 753-771.
| Crossref | Google Scholar |
Wootton N, Sarakinis K, Varea R, Reis-Santos P, Gillanders BM (2022) Microplastic in oysters: a review of global trends and comparison to southern Australia. Chemosphere 307, 136065.
| Crossref | Google Scholar |
Worm B, Lotze HK, Jubinville I, Wilcox C, Jambeck J (2017) Plastic as a persistent marine pollutant. Annual Review of Environment and Resources 42(1), 1-26.
| Crossref | Google Scholar |
Wright SL, Thompson RC, Galloway TS (2013) The physical impacts of microplastics on marine organisms: a review. Environmental Pollution 178, 483-492.
| Crossref | Google Scholar |
Xiong X, Tu Y, Chen X, Jiang X, Shi H, Wu C, Elser JJ (2019) Ingestion and egestion of polyethylene microplastics by goldfish (Carassius auratus): influence of color and morphological features. Heliyon 5(12), e03063.
| Crossref | Google Scholar |
Zaki MRM, Zaid SHM, Zainuddin AH, Aris AZ (2021) Microplastic pollution in tropical estuary gastropods: abundance, distribution and potential sources of Klang River estuary, Malaysia. Marine Pollution Bulletin 162, 111866.
| Crossref | Google Scholar |
Zhang H, Teng Y, Doan TTT, Yat YW, Chan SH, Kelly BC (2017) Stable nitrogen and carbon isotopes in sediments and biota from three tropical marine food webs: application to chemical bioaccumulation assessment. Environmental Toxicology and Chemistry 36(9), 2521-2532.
| Crossref | Google Scholar |
Zhang S, Wang N, Gong S, Gao S (2022) The patterns of trophic transfer of microplastic ingestion by fish in the artificial reef area and adjacent waters of Haizhou Bay. Marine Pollution Bulletin 177, 113565.
| Crossref | Google Scholar |
Ziajahromi S, Neale PA, Telles Silveira I, Chua A, Leusch FDL (2021) An audit of microplastic abundance throughout three Australian wastewater treatment plants. Chemosphere 263, 128294.
| Crossref | Google Scholar |