

Age, growth and maturity of oceanic whitetip shark (Carcharhinus longimanus) from Papua New Guinea
Brooke M. D’Alberto A E , Andrew Chin A , Jonathan J. Smart A , Leontine Baje A B , William T. White C D and Colin A. Simpfendorfer AA Centre for Sustainable Tropical Fisheries and Aquaculture & College of Science and Engineering, James Cook University, 1 James Cook Drive, Townsville, Qld 4811, Australia.
B National Fisheries Authority, Deloitte Tower, Douglas Street, Port Moresby, National Capital District, Papua New Guinea.
C CSIRO Oceans and Atmosphere, 3–4 Castray Esplanade, Hobart, Tas. 7004, Australia.
D Australian National Fish Collection, CSIRO National Research Collections Australia, Hobart, Tas. 7004, Australia.
E Corresponding author. Email: brooke.dalberto@my.jcu.edu.au
Marine and Freshwater Research 68(6) 1118-1129 https://doi.org/10.1071/MF16165
Submitted: 3 May 2016 Accepted: 3 August 2016 Published: 14 September 2016
Journal Compilation © CSIRO Publishing 2017 Open Access CC BY-NC-ND
Abstract
Oceanic whitetip sharks (Carcharhinus longimanus) in the Western Central Pacific have been overfished and require improved assessment and management to enable planning of recovery actions. Samples from 103 individuals (70 males and 33 females; 76.0–240- and 128–235-cm total length (TL) respectively) were used to estimate age, growth and maturity parameters from sharks retained by longline fisheries in Papua New Guinea. Back-calculation was used because of the low number of juveniles and a multimodel framework with Akaike’s information criterion corrected for small sample size (AICc) estimated growth parameters. The von Bertalanffy growth model provided the best fitting growth model for both sexes. Parameter estimates for males were: asymptotic length (L∞) = 315.6 cm TL; growth coefficient (k) = 0.059 year–1; and length at birth (L0) = 75.1 cm TL. For females, the parameter estimates were: L∞ = 316.7 cm TL; k = 0.057 year–1; and L0 = 74.7 cm TL. Maximum age was estimated to be 18 years for males and 17 years for females, with a calculated longevity of 24.6 and 24.9 years respectively. Males matured at 10.0 years and 193 cm TL, whereas females matured at 15.8 years and 224 cm TL. C. longimanus is a slow-growing, late-maturity species, with regional variation in life history parameters, highlighting increased vulnerability to fishing pressure in this region.
Additional keywords: pelagic shark fisheries, vertebral analysis, Western Central Pacific Ocean.
Introduction
Accurately describing the life history characteristics (e.g. age, growth and reproduction) of species is the foundation for an understanding of the species biology, population dynamics and status (Hoenig and Gruber 1990). Characterising these traits is crucial for fisheries stock assessment, management and conservation, especially for long-lived, slow-growing, late-maturing and less-fecund species, such as sharks and rays (Cortés 2000). The life history characteristics of many sharks and rays results in a lower productivity compared with teleost fish, increasing their vulnerability to human pressures (e.g. sustained direct or incidental fishing pressure) and prolonging recovery times from population declines (Compagno 1990; Dulvy et al. 2014). Life history traits of sharks and rays can vary considerably between species, as well as between conspecific populations (García et al. 2008; Kyne and Simpfendorfer 2010; Rigby and Simpfendorfer 2013). Regional differences in life history characteristics may reflect regional selection pressures and alternative population dynamics, and can also affect the capacity for each population to withstand exploitation and so affect fisheries assessment and management (Cortés 2008; Francis et al. 2008). As such, life history studies from local populations are critical to providing more accurate and robust assessment of current fisheries sustainability and an understanding of the status of shark populations (Lombardi-Carlson et al. 2003; Cailliet and Goldman 2004; Goldman et al. 2012; Smart et al. 2015).
There is global concern over rapidly declining populations of oceanic sharks, with many species being caught in large numbers in longline, purse seine and gill net fisheries on the high seas (Dulvy et al. 2008, 2014). Oceanic pelagic sharks are widely distributed and highly mobile species that primarily inhibit open ocean habitats. Although the declines of pelagic sharks highlight the need for improved management and conservation, their inaccessibility and the historically low management priority have hampered management efforts and resulted in limited and ambiguous data (Cortés et al. 2010). Thus, in order to manage data-poor pelagic shark species for sustainable outcomes, an understanding of the basic life history information and population trajectory of a species is required.
The oceanic whitetip shark (Carcharhinus longimanus; family Carcharhinidae) is a highly migratory, large-bodied whaler shark (maximum size 350–395-cm total length (TL)) with a circumglobal distribution in tropical and subtropical seas (Bigelow and Schroeder 1948; Lessa et al. 1999). It is a strictly oceanic species, primarily occupying the epipelagic water column (0–150 m; Musyl et al. 2011; Howey-Jordan et al. 2013). C. longimanus is currently listed by the International Union for Conservation of Nature’s (IUCN) Red List of Threatened Species as globally ‘Vulnerable’ and ‘Critically Endangered’ in the North-west and Western Central Atlantic Ocean due to extensive population declines across its distribution (Baum et al. 2015). Despite its global distribution and relatively high interaction with fisheries, there is limited life history information for C. longimanus. Currently, the main information regarding the age, growth and reproductive biology of this species is limited to three studies, one in the North Pacific Ocean (Seki et al. 1998), one in the North-west Pacific Ocean (Joung et al. 2016) and one in the South-west Atlantic Ocean (Lessa et al. 1999). Individuals in the North-west Pacific Ocean are reported to have slower growth (von Bertalanffy growth coefficient (k) = 0.085 year–1; Joung et al. 2016) than individuals from the North Pacific Ocean and South-west Atlantic Ocean (k = 0.099–0.103 year–1; Seki et al. 1998; Lessa et al. 1999), but sexual maturity (5–9 years and 175–194 cm TL) and size at birth (63.0–77.0 cm TL) of C. longimanus does not appear to differ between sexes and regions (Seki et al. 1998; Lessa et al. 1999; Joung et al. 2016). The longevity of this species was estimated to be 35–36 years (Seki et al. 1998). Life history information is lacking for C. longimanus in the Western Central Pacific Ocean (WCPO), particularly in Papua New Guinea (PNG) waters.
C. longimanus was one of the five key species taken in the PNG shark longline fishery in the WCPO (Kumoru 2003). The fishery operated primarily in oceanic habitats and targeted sharks until the fishery closed in mid-2014 because of a ban on silky shark retention (Western and Central Pacific Fisheries Commission 2013; conservation and management measure, CMM, 2013–08). C. longimanus is now caught as bycatch in the tuna longline and purse seine fisheries in PNG and throughout the wider region. Prior to 2002, C. longimanus accounted for ~9.1% of the annual catch for the fishery (Kumoru 2003). However, the catch rate estimates and catch per unit effort (CPUE) have experienced steep and consistent declines (~70%) over the past decade in the WCPO and the stock is currently considered overfished (Rice and Harley 2012). The Western Central Pacific Fishery Commission (WCPFC) has prohibited the retention, selling or storing of the carcass or any part of C. longimanus, following the other tuna-focused Regional Fisheries Management Organisations (RFMOs; Inter-American Tropical Tuna Commission Recommendation C-11-10, see https://www.iattc.org/PDFFiles2/Resolutions/C-11-10-Conservation-of-oceanic-whitetip-sharks.pdf, accessed 17 August 2016; Indian Ocean Tuna Commission Resolution 13/06, see http://www.iotc.org/cmm/resolution-1306-scientific-and-management-frameworkconservation-sharks-species-caught; International Commission for the Conservation of Atlantic Tuna Recommendation 10-07, see https://www.iccat.int/Documents/Recs/ACT_COMP_2015_ENG.pdf, all accessed 17 August 2016). Although the no-retention policies have been implemented for C. longimanus for the tuna longline fisheries globally, this species is highly susceptible to longline fishing practices (e.g. depth of longline hooks; Tolotti et al. 2015) and is a key bycatch species in tuna fisheries that deploy fish aggregating devices (FADs; Dagorn et al. 2013). The ongoing management of C. longimanus in PNG and regional tuna fisheries requires accurate, regionally appropriate, biological information. With that in mind, the present study investigated the life history of C. longimanus caught in the WCPO in the seas around PNG. The information can be used to provide regional specific life history information, which will assist in further understanding the status of this species in the WCPO and help refine future assessments and management strategies.
Materials and methods
Sample collection
Samples were collected between May and July 2014 by PNG National Fisheries Authority (NFA) fisheries observers on board seven commercial longline vessels operating under the Shark Management Plan. Sharks were targeted by setting a maximum of 1200 hooks at an average depth of 72.3 m (depth range 35–108 m; Kumoru 2003), with a soak time of 8–10 h. Biological information was recorded for each individual, including sex, TL (measured from the snout to the tip of the caudal fin in a straight line; Francis 2006) and maturity. A section of the thoracic vertebrae was taken from below the anterior margin of the first dorsal fin and was stored frozen until processed. Although C. longimanus is a distinctive, easily identifiable species, the accuracy of species identification was verified using photographs taken by observers using digital cameras (Smart et al. 2016).
Vertebral processing and sectioning
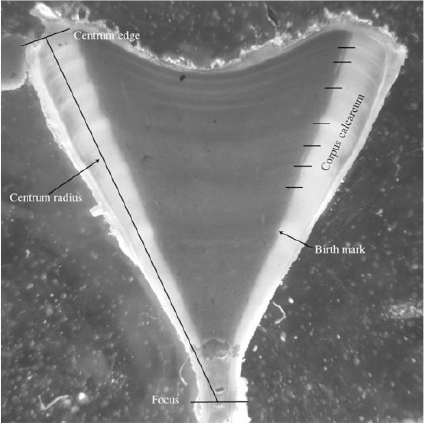
Vertebral processing followed the standard protocols described in Cailliet and Goldman (2004). Vertebrae were defrosted and the haemal arch, neural arch and extraneous tissues were removed using a scalpel. Individual vertebral centra were separated and soaked in 5% sodium hypochlorite for 30 min to remove residual soft tissue. Centra were then thoroughly rinsed under tap water and dried in an oven for 24 h at 60°C. Longitudinal sections of the centra (~400 μm) were made through the focus of the vertebra with a low-speed rotary saw with twin diamond-tipped saw blades (Beuhler). Sections were mounted on microscope slides for storage and analysis using Crystal Bond adhesive (SPI Supplies).
Age determination
Sectioned vertebrae were examined using a dissecting microscope under transmitted light. Individual ages were estimated by counting the pairs of opaque and translucent growth bands present in the corpus calcareum after the birth mark (Goldman 2004). The birth mark was identified as the change in angle of the corpus calcareum and represented an age of zero (Goldman 2004; Fig. 1). Each subsequent growth band pair was assumed to represent 1 year of growth. Validation of annual growth band pair deposition could not be conducted during the present study because of the low sample size. Marginal increment analysis (MIA) could not be performed because the data only sampled during 3 months of the year. Previous studies by Seki et al. (1998), Lessa et al. (1999) and Joung et al. (2016) have verified annual growth band pair deposition for C. longimanus through MIA in the North Pacific Ocean, south-western Atlantic Ocean and north-west Pacific Ocean respectively, thus annual band pair deposition was also assumed in the present study.
|
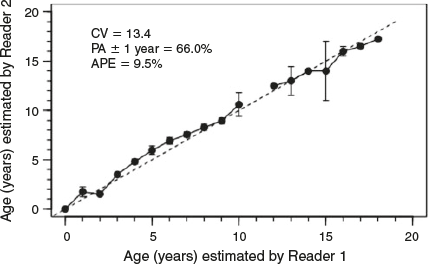
Age estimation was conducted independently by two readers in order to reduce age estimate bias. Vertebral samples were selected at random and neither reader had prior knowledge of the sex or TL of the specimen (Cailliet and Goldman 2004). The age estimates from the two readers were then compared. Where counts differed between readers, the vertebra was re-examined collaboratively by both readers and a consensus age was decided. If no consensus age could be agreed, those centra were omitted from analysis. Precision and bias between readers before consensus reads and across the sample range were calculated using several methods, as recommended by Cailliet et al. (2006): percentage agreement (PA ± 1 year), average percentage error (APE), Bowker’s test of symmetry and Chang’s CV (Campana et al. 1995; Cailliet et al. 2006). The PA ± 1 year and APE were calculated with individuals grouped by 25 cm TL classes. For long-lived species, PA can be variable across age classes because of difficulty ageing older individuals. Thus, the variability in calculating PA across ages was accounted for because length is an empirical measurement, whereas age is an estimate (Goldman and Musick 2006). Statistics were calculated using the FSA package (D. H. Ogle, see https://fishr.wordpress.com/fsa/, accessed September 2015) in the R program environment (R Foundation for Statistical Computing).
Back-calculation techniques
Back-calculation was used to compensate for the small number of juveniles (immature individuals) in the sample and limited sample sizes (Cailliet and Goldman 2004; Smart et al. 2013). Individual centra were photographed using a compound video microscope and the distances between growth band pairs were measured using an image analysis program (Image Pro Plus version 6.2 for Windows; Media Cybernetics). The centrum radius (CR) was measured in a straight line from the focus to the edge of the vertebra (Fig. 1). Along this straight line, the distance from the focus to each opaque growth band and the birth mark was measured. All distances were measured to the nearest 0.001 mm. A Dahl Lea direct-proportions back-calculation technique (Carlander 1969) was applied to the data using the following equation:
where Li is the length at growth band pair i, LC is the length at capture (cm TL), CRC is the centrum radius at capture and CRi is the centrum radius at growth band pair i. For comparison with the Dahl Lea method, a length-at-birth modified Fraser Lee back-calculation technique (Campana 1990) was applied to the data using the following equation:
where Lbirth is the length at birth and CRbirth is the centrum radius at the birth mark. Lbirth was set to 76.0 cm, the known length at birth from the present study. Upon visual inspection, it was determined that the Dahl Lea direct-proportions method presented more reasonable estimates of length compared with the observed length-at-age data available for the older age classes (Smart et al. 2013). The Dahl Lea direct-proportion method provided estimates of length at birth, rather than a fixed length used in the Fraser Lee method, and was therefore used in all further analyses.
Growth models and analysis
An information–theoretic multimodel inference (MMI) approach, incorporating Akaike’s information criterion (AIC), was used to model the growth of C. longimanus. A set of three candidate models commonly used in elasmobranch growth studies was selected a priori (Thorson and Simpfendorfer 2009): von Bertalanffy growth function (VBGF), logistic function and Gompertz function (Table 1). This approach was taken because the use of a single model, such as the VBGF, can bias growth estimations if it is an inappropriate model; using a multimodel framework removes this bias and generates the most robust growth estimate (Katsanevakis 2006; Katsanevakis and Maravelias 2008; Smart et al. 2016). Models were fitted using the biologically relevant length-at-birth parameter (L0), instead of a time at size zero parameter (t0; Cailliet et al. 2006). The models were fit to the length-at-age data in the R statistical environment (R Foundation for Statistical Computing). Parameter estimates for each growth function were estimated using non-linear least-squares regression methods in R. The standard errors for the parameters were calculated for parameter estimates using a bootstrapping method with the ‘nlstools’ package (F. Baty and M. L. Delignette-Muller, see http://cran.r-project.org/web/packages/nlstools, accessed 16 September 2015) in R program environment (R Foundation for Statistical Computing).

|
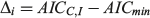
The performance of the models relative to each other was evaluated and selected using AIC with a small sample size bias correction algorithm (AICC, Akaike 1973; Burnham and Anderson 2002; D. H. Ogle, see https://fishr.wordpress.com/fsa/). Compared with the standard AIC, the AICC has been demonstrated to perform better when the sample size is below 200 (Zhu et al. 2009). The AICC provided a measure of model fit and complexity, allowing for the simultaneous comparison of the growth models (Natanson et al. 2014). The AICC was calculated as follows:
where AIC = nlog(σ2) + 2k, k is the total number of parameters + 1 for variance (σ2) and n is the sample size. The model that had the lowest AICC value (AICmin) was considered the most appropriate. The AIC difference (Δ) was calculated for each model (i = 1–3) and used to rank the remaining models as follows:
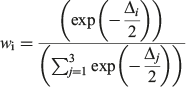
Models with Δ values from 0 to 2 had the highest support, whereas models in which Δ = 2–10 had considerably less support, and models with little or no support had Δ values >10 (Burnham and Anderson 2002). The probability of choosing the correct model was calculated using Akaike weights (wi) from the AICC differences for each model (Burnham and Anderson 2002). The weights were calculated as follows:
A likelihood ratio test was conducted to determine whether sexes should be modelled separately or combined (Kimura 1980). This was performed for the best fitting model, determined by the AICc analysis for both observed and back-calculated data, using the method described by Haddon (2001), which was modified for the R program environment (R Foundation for Statistical Computing). If a significant difference between male and female growth curves was detected for either dataset, then separate growth curves were produced.
Where the VBGF was the best fitting growth model, estimates of longevity were calculated as follows:
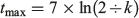
where tmax is the longevity in years (Mollet et al. 2002).
Maturity estimation
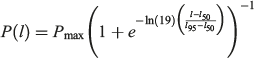
The maturity of each individual was staged using an index modified from Walker (2005; Table 2). The maturity stage of males was based on clasper condition (C = 1–3), whereas the stage of female maturity was based on uterus condition (U = 1–5; Table 2). Maturity stage data were converted to a binary maturity category (immature = 0, mature = 1) for statistical analysis. Population estimates of length at maturity were produced for males and females using a logistic regression equation (Walker 2005):

|
where P(l) is the proportion of the population mature at TL, l and Pmax is the maximum proportion of mature individuals. The lengths at which 50 and 95% of the population were mature (l50 and l95) were estimated using a generalised linear model (GLM) with a binomial error structure and a logit link function in the R program environment (R Foundation for Statistical Computing). Population estimates of age at maturity (A50 and A95) were estimated using the same methods; l50 and A50 were used as metrics to describe the approximate length and age at maturity for the population.
Comparisons of regional life history characteristics
In order to compare the life history characteristics of C. longimanus between regions, the VBGF fits for the other populations were reproduced (Smart et al. 2015). Parameter estimates were used from previously published length-at-age studies from populations in the North Pacific Ocean (Seki et al. 1998), North-west Pacific Ocean (Joung et al. 2016) and South-west Atlantic Ocean (Lessa et al. 1999). Length was converted from precadual length (PCL) to TL using the following formula (Seki et al. 1998):

In instances where a range of values was reported, the mid-point was used in the calculations. The theoretical longevity was calculated using the VBGF parameters for the other populations.
Results
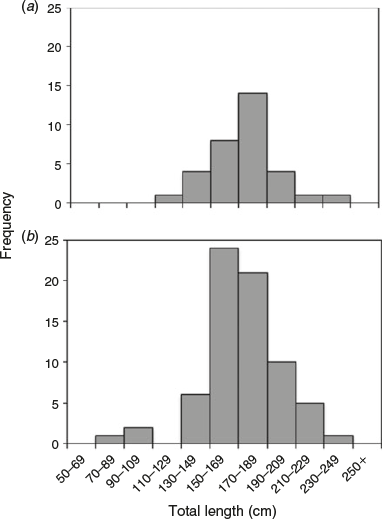
Vertebrae samples were collected from 103 C. longimanus, consisting of 70 males (76.0–240 cm TL) and 33 females (128–235 cm TL; Fig. 2). The age range for males and females was 0–18 and 4–17 years respectively. Vertebrae were moderately easy to interpret. The PA ± 1 year and APE ± 1 year across 25-cm TL classes between the two readers were 66.0 and 9.5% respectively. The age bias plot showed minimal variation around the 1 : 1 line. There was a slight bias for ages 4–7 (Fig. 3). However, no systematic bias across the entire age range was detected between the readers (Bowker’s test of symmetry, d.f. = 27, χ2 = 47.39, P = 8.973). The CV was 13.4%. Although values of APE and CV are considered high for teleost fish ageing studies, values in the present study are comparable to chondrichthyan age and growth studies, because long-lived species have a greater number of growth band pairs to read (Campana 2001; Cailliet et al. 2006).
|
|
Vertebral growth analysis
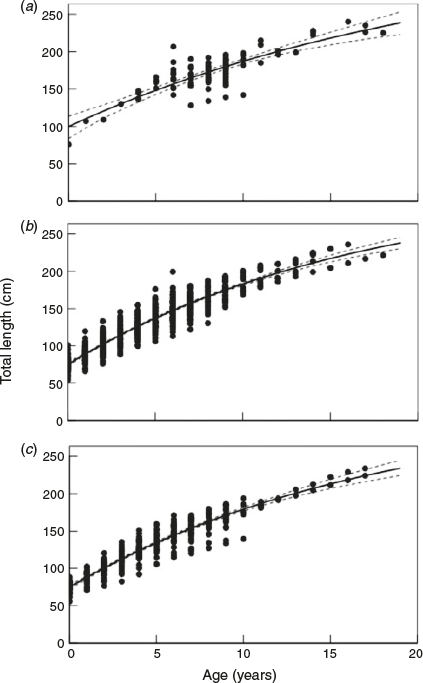
The VBGF provided the best fit for the observed and back-calculated data, and the logistic and Gompertz models provided little support for both datasets (Table 3). A combined growth curve for males and females was produced for the observed length-at-age data (Fig. 4a), because growth did not differ significantly between the sexes for the observed length-at-age data (likelihood ratio test; VBGF, d.f. = 3, χ2 = 5.70, P = 0.127). The observed data models lacked clear biological realism, with an unrealistically large L0 estimate of 99.0 cm TL compared with the empirical length-at-birth estimates of 63.0–77.0 cm TL (Seki et al. 1998). Therefore, the missing size classes were accounted for using back-calculation techniques, which increased the number of length-at-age data points from 103 to 945 through the addition of interpolated data (Table 3).

|
|
The back-calculated dataset provided far more reasonable estimates of L0 and L∞ than estimates produced using the observed data (Table 3). Separate growth curves were produced for males and females for the back-calculated data (Fig. 4b, c) because growth differed significantly between sexes for the back-calculated dataset (likelihood ratio test; VBGF, d.f. = 3, χ2 = 9.64, P = 0.02). There was considerable variation in the estimates for the back-calculated length-at-birth for both sexes (Fig. 4b, c). However, the VBGF L0 estimates for male and females were within the known length-at-birth range (Seki et al. 1998). Estimates of L∞ for males and females were smaller than those from the observed data (Table 3), whereas k was higher than the observed length-at-age data, and males had a slightly higher k than females (Table 3). A pronounced asymptote was not observed in growth curves from either sex, and the asymptotic lengths were greater than the largest individual observed (Table 3; Fig. 4). The estimates of longevity were similar for males and females, and were calculated to be 24.6 and 24.9 years respectively.
Maturity analysis
Female and male C. longimanus mature at different lengths and ages. There were two mature females and 15 mature males in the sample. The youngest mature female was estimated to be 12 years old at 196 cm TL. The oldest immature female (Stage 2) was 17 years old at 226 cm TL. The mean (±s.e.) maximum likelihood estimates of l50 and l95 for females were 224 ± 15 and 258 ± 29 cm TL respectively (Fig. 5a). The female age at maturity of A50 and A95 was estimated to be 15.8 ± 2.3 and 21.3 ± 4.3 years respectively (Fig. 5c). The youngest mature male was 7 years old at 190 cm TL, whereas the oldest immature male was 10 years old at 195 cm TL. The mean (±s.e.) maximum likelihood estimates of l50 and l95 for males were 193 ± 3 and 212 ± 8 cm TL respectively (Fig. 5b). The A50 and A95 for males were predicted as 10.0 ± 0.5 and 12.5 ± 1.2 years respectively (Fig. 5d). Therefore, female C. longimanus mature at an older age and greater length than males.

|
Comparison of regional life history characteristics
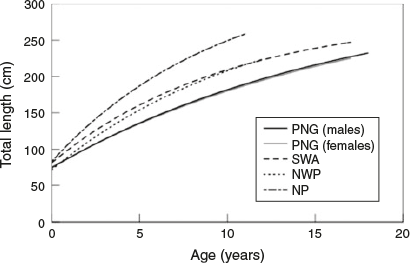
There was a considerable difference in the growth of C. longimanus from PNG (WCPO) compared with other populations (Table 4; Fig. 6). For example, k for male and female C. longimanus from PNG (WCPO) was approximately half that of k values for the North Pacific Ocean (Seki et al. 1998) and the south-west Atlantic Ocean (Lessa et al. 1999) populations (Table 4; Fig. 6). Furthermore, individuals from the north-west Pacific Ocean grow at a slower rate than those from the North Pacific and south-west Atlantic, but faster than individuals from PNG (Table 4; Fig. 6). In addition, L∞ varied between populations (Table 4; Fig. 6). However, L0 for C. longimanus was similar between the four regions (Table 4). The PNG population had the highest maximum observed age for males and the highest theoretical longevity (Table 4). Females and males from PNG mature at a later age than other conspecifics (Table 4). Males from all four regions mature at similar lengths, but males from PNG mature at a later age. Female C. longimanus from PNG mature a considerably greater length than other conspecifics (Table 4). The maximum observed age and theoretical longevity for North Pacific C. longimanus were younger than those for C. longimanus from PNG, despite the former attaining a larger Lmax (Table 4).

|
|
Discussion
Conducting regional life history studies is imperative to understanding the biology of a species and to provide the most accurate parameter estimates. Life history traits of shark species can differ between conspecific populations, reflecting varying population dynamics and resilience to exploitation (Dulvy et al. 2008; Rigby and Simpfendorfer 2013). Life history parameters of C. longimanus from the PNG (WCPO) population revealed a substantial regional variation compared with populations in the North Pacific Ocean (Seki et al. 1998), North-west Pacific Ocean (Joung et al. 2016) and South-west Atlantic Ocean (Lessa et al. 1999). Male and female C. longimanus from PNG (WCPO) have considerably slower growth than populations from the North Pacific Ocean (Seki et al. 1998) and South-west Atlantic Ocean (Lessa et al. 1999). Both sexes of C. longimanus from PNG (WCPO) mature at an older age, and females mature at an larger size, than conspecifics from the other regions. Size at birth was similar among all four populations (Seki et al. 1998; Lessa et al. 1999; Joung et al. 2016). These regional differences in life history traits may reflect different population dynamics and resilience to fishing pressure (Chin et al. 2013; Smart et al. 2015). Therefore, these results provide more representative life history estimates towards local population assessments, avoiding the use of potentially inaccurate surrogate information from other regions.
Regional variations may reduce the accuracy of population assessment when proxy data are used from conspecifics from other regions (Chin et al. 2013; Smart et al. 2015). Similar levels of regional variation have been well documented for a number shark species, such as bonnethead sharks (Sphyrna tiburo; Lombardi-Carlson et al. 2003), blacknose shark (Carcharhinus acronotus; Driggers et al. 2004), blacktip reef shark (Carcharhinus melanopterus; Chin et al. 2013), Australian blacktip sharks (Carcharhinus tilstoni; Harry et al. 2013) and common blacktip sharks (Carcharhinus limbatus; Smart et al. 2015). The most recent stock assessment for C. longimanus from the WCPO was conducted using proxy data from the conspecifics from North Pacific Ocean (Seki et al. 1998) and south-west Atlantic Ocean (Lessa et al. 1999). The life history characteristics of C. longimanus from PNG (WCPO) suggest that this region is more susceptible to population declines and that the population in this area has a slower ability to recover. However, the causes of observed regional variation in C. longimanus are unknown and may be related to several factors, including varying environmental conditions between regions, regional genetic adaptation and limited samples (Tanaka et al. 1990; Carlson et al. 2006; Jolly et al. 2013). Thus, using the regional life history parameters of C. longimanus from the PNG in the present study can significantly improve demographic analysis and stock assessments for this population, thereby improving PNG and WCPO fisheries management and conservation.
C. longimanus were aged to a maximum of 18 years for females and 17 years for males through vertebral band counts, providing the oldest age estimation to date. However, the age estimates reported in the present study are likely to be an underestimation. Age underestimation can arise when interpreting terminal band pairs in large individuals because band compression can occur (where the most recent band pair is deposited close together and is poorly defined) or growth band formation can cease past a certain age when the animal stops growing (Cailliet et al. 2006; Chin et al. 2013; Natanson et al. 2014). This can be problematic, because several species have been documented to live twice as long as the vertebral band pair counts estimated, such as the porbeagle Lamna nasus (Francis et al. 2007) and school shark Galeorhinus galeus (Kalish and Johnston 2001). Comprehensive age validation studies (e.g. mark and recapture using tetracycline injection or bomb radiocarbon dating) are difficult to conduct for pelagic sharks because these species are typically highly migratory, attain large sizes and are difficult to sample regularly throughout the year (Natanson et al. 2002; Cailliet et al. 2006). In the present study, theoretical longevity estimates were calculated for C. longimanus using parameters from the VBGF. These estimates (24.5 and 24.9 years for males and females respectively) were considerably lower than previous estimates (36 years for males and females; Rice and Harley 2012) based on the theoretical maximum length from the North Pacific Ocean population (Seki et al. 1998). This estimate was considered unreliable by Clarke et al. (2015, pp. 12–13) and, for comparison, theoretical longevity estimates using the parameters from respective VBGFs were also calculated for the North Pacific Ocean population (combined sexes, 20.7 years), north-west Pacific Ocean (combined sexes, 22.1 years) and south-west Atlantic Ocean population (combined sexes, 21.0 years). The theoretical longevity estimates for the conspecific populations suggest C. longimanus may have a shorter life span than previously estimated. Although no individual from either population has been caught and aged beyond 18 years, the longevity estimates derived from growth models are more reasonable and conservative than the vertebral counts, and should be used in assessment when validation studies have not been conducted.
Fitting a VBGF to the back-calculated data provided the most appropriate growth estimates for both sexes. The observed data for C. longimanus lacked juveniles (between 76.0 and 175 cm TL) and larger individuals (>200 cm TL), which resulted in overestimation of length at birth (L0) and underestimation of asymptotic length (L∞) in the three candidate growth models. Growth models are sensitive to incomplete datasets (e.g. missing smallest and largest individuals in the sample) and can produce biased growth parameters in these cases (Haddon 2001; Pilling et al. 2002; Smart et al. 2015). The use of back-calculation techniques allowed for more biologically reasonable growth estimates, within the known ranges for birth size (63.0–77.0 cm TL), and realistic larger asymptotic length. There was a significant difference between male and female growth curves using the back-calculated data, whereas there was no difference between the growth curves using the combined data. This disparity between the male and female back-calculated growth may be a function of the greater sample size in the back-calculated data. The absence of young juveniles (<4 years old; between 76.0 and 175 cm TL) in the present study suggests longline gear selectivity occurs for C. longimanus. Longline fisheries are inherently length selective, with the tendency to capture larger C. longimanus (White et al. 2008). Juveniles have been reported to inhabit deep reef areas along the continental shelf (Seki et al. 1998), which may be out of the depth range (35–108 m) of the longlines used in the WCPO fishery (Kumoru 2003). The smaller, younger individuals are more likely to be caught using purse seine nets (Clarke et al. 2011a, 2011b). Introduction of as little as five juveniles into the sample has been demonstrated to correct the L0 estimates (Smart et al. 2015). Using both methods for sampling, as well as targeted sampling of individuals (e.g. nursery areas; Smart et al. 2015), may be highly beneficial to overcome gear-selective sampling and result in the collection of a well-represented sample of all length classes. If access to juvenile individuals is not possible, then back-calculation techniques can be used successfully to account for the juveniles and produce biologically realistic estimates (Smart et al. 2013). Although back-calculation techniques can account for the missing juvenile length classes, these techniques are limited to the oldest age estimate in the sample and cannot account for the absence of fully grown individuals (Cailliet et al. 2006; Smart et al. 2015).
Despite C. longimanus having been described as a large-bodied species and one of the most abundant pelagic sharks in tropical and subtropical oceans, along with the blue shark (Prionace glauca) and silky shark (Carcharhinus falciformis; Compagno 1984; Nakano and Stevens 2008; Castro 2011; Baum et al. 2015), there was a lack of large individuals >200 cm TL in the present study. The absence of these large individuals can affect the growth parameters (Haddon 2001; Pilling et al. 2002; Smart et al. 2015), but there is no method that can retrospectively account for the missing large individuals. The absence of large individuals in the present study may be attributed to several reasons, such as size and sexual segregation, seasonal migratory behaviours and length-selective fishing mortality. Currently, very little is known about the population organisation, movements and habitat use in the Pacific Ocean. The lack of females, particularly mature females, in the present study suggests sexual segregation in the WCPO and the Pacific Ocean. Evidence of sexual and size segregation of C. longimanus has been reported in the Maldives, where females within the length range 110–179 cm TL were caught more frequently than males in the same size range (Anderson and Ahmed 1993). In the WCPO, most of the males in the present study caught were between 150 and 189 cm TL, whereas most of the females sampled were between 170 and 189 cm TL. Furthermore, because C. longimanus is a highly migratory species, it is possible that a 3-month sampling period was an inadequate time frame to collect a representative and equal sample in PNG (WCPO), and further studies into the population structure and migration behaviours of C. longimanus in the WCPO are required.
C. longimanus exhibits a strong preference for warm and shallow waters above 120 m and is highly susceptible to longline gear, particularly in fisheries that deploy FADs (Tolotti et al. 2013; Tolotti et al. 2015). The absence of large individuals is likely the result of length-selective fishing mortality, given the history of extensive fishing in the WCPO, as well as migration behaviour and sampling time frame. Shifts in the length composition to smaller sizes due to length-selective fishing mortality have been attributed to the exploitation of a range of shark species (Ricker 1969; Jennings and Kaiser 1998; Walker et al. 1998; Stevens et al. 2000). Length-selective fishing mortality occurs when larger, older individuals are removed from the population, resulting in a smaller maximum size and younger maximum age (Thorson and Simpfendorfer 2009). C. longimanus was one of the main eight species in the WCPO shark longline fishery, but it is now considered overfished and well below maximum sustainable yields (Clarke 2011; Rice and Harley 2012). The largest observed specimen of C. longimanus was 350 cm TL in the North Atlantic Ocean in the 1940s (Bigelow and Schroeder 1948). However, no individual was caught at such length either in the present study in PNG (largest 240 cm TL male) or in previous studies in the North Pacific Ocean (largest 272 cm TL female; Seki et al. 1998), north-western Pacific (largest 268 cm TL male; Joung et al. 2016) and south-west Atlantic Ocean (largest 250 cm TL female; Lessa et al. 1999). The median size of C. longimanus was observed to be decreasing significantly, until samples became too scarce in the Pacific Ocean, based on long-term catch data (Clarke 2011). Thus, the rarity of individuals larger than 270 cm TL in the present study and in catches obtained worldwide imply the length composition of this species has been significantly altered, and median length and maximum size have been reduced (Lessa et al. 1999). The decrease in size can affect the parameters of the growth models (Pilling et al. 2002) and may explain the lack of a distinct asymptote in the growth model. It is also possible that the growth rates of the species have changed over time as a result of length-selective fishing mortality (Walker et al. 1998). Compensatory (density-dependent) growth has been demonstrated for carcharinid shark populations that have been fished to low population sizes (Sminkey and Musick 1995).
C. longimanus from PNG and WCPO have a slower growth rate and mature later and at a larger size than other conspecific populations. These life history traits suggest that the population from the WCPO has a higher vulnerability to fishing pressure and low ability to recover from perturbations than other populations for which data are available. The recent no-retention policy and the closure of the shark longline fishery in PNG present an opportunity for this overfished species to recover in this region. However, C. longimanus is still being taken as bycatch, especially in the tuna longline fisheries and fisheries that deploy FADs (Dagorn et al. 2013), and ongoing management for this species is required. The regional life history information presented herein provides an important step towards understanding the population status of C. longimanus in PNG and the WCPO.
Acknowledgements
This project was co-funded by the National Fisheries Authority (NFA) and the Australian Centre for International Agricultural Research (ACIAR; project FIS/2012/102). The authors thank Brian Kumasi, Luanah Yaman, Leban Gisawa and Ludwig Kumoru from the NFA, as well as the fishers and the NFA on-board fisheries observers: Jackson Maravee, Noah Lurang Jr, Daniel Sau, Murphy John, Paliau Parkop, Towai Peli and Udill Jotham. The authors also thank Samantha Sherman, Satoshi Shiratsuchi and Andrea Cabrera Garcia for laboratory assistance.
References
Akaike, H. V. (1973). Information theory and an extension of the maximum likelihood principle. In ‘Second International Symposium on Information Theory’, 2–8 September 1973, Tsahkadsor, Armenia. (Eds F. Csáki and B. N. Petrov.) pp. 267–282. (Akademiai Kiado: Budapest, Hungary.)Anderson, R., and Ahmed, H. (1993). Appendix 3. Accounts of shark species found in the Maldives. In ‘The Shark Fisheries of the Maldives.’ pp. 64–65. (Ministry of Fisheries and Agriculture: Male, Republic of Maldives; and Food and Agriculture Organization: Rome, Italy.)
Baum, J. K., Medina, E., Musick, J. A., and Smale, M. (2015). Carcharhinus longimanus (Oceanic Whitetip Shark, Whitetip Oceanic Shark, White-tipped Shark, Whitetip Shark). In ‘The IUCN Red List of Threatened Species’, Vol. 2015. (International Union for Conservation of Nature and Natural Resources.) Available at http://www.iucnredlist.org/details/39374/0 [Verified 5 August 2016].
Bigelow, H. B., and Schroeder, W. C. (1948). Sharks. In ‘Fishes of the Western North Atlantic (Part One: Lancelets, Ciclostomes, Sharks)’. (Eds A. E. Parr and Y. H. Olsen.) Vol. 1, pp. 59–546. (Memoir Sears Foundation for Marine Research: New Haven, CT, USA.)
Burnham, K. P., and Anderson, D. R. (2002). ‘Model Selection and Multimodel Inference: a Practical Information–Theoretic Approach.’ (Springer Science & Business Media.)
Cailliet, G. M., and Goldman, K. J. (2004). Age determination and validation in chondrichthyan fishes. In ‘Biology of Sharks and Their Relatives’. (Eds J. Carrier, J. A. Musick and M. R. Heithaus.) pp. 399–447. (CRC Press: Boca Raton, FL, USA.)
Cailliet, G. M., Smith, W. D., Mollet, H. F., and Goldman, K. J. (2006). Age and growth studies of chondrichthyan fishes: the need for consistency in terminology, verification, validation, and growth function fitting. Environmental Biology of Fishes 77, 211–228.
| Age and growth studies of chondrichthyan fishes: the need for consistency in terminology, verification, validation, and growth function fitting.Crossref | GoogleScholarGoogle Scholar |
Campana, S. E. (1990). How reliable are growth back-calculations based on otoliths? Canadian Journal of Fisheries and Aquatic Sciences 47, 2219–2227.
| How reliable are growth back-calculations based on otoliths?Crossref | GoogleScholarGoogle Scholar |
Campana, S. E. (2001). Accuracy, precision and quality control in age determination, including a review of the use and abuse of age validation methods. Journal of Fish Biology 59, 197–242.
| Accuracy, precision and quality control in age determination, including a review of the use and abuse of age validation methods.Crossref | GoogleScholarGoogle Scholar |
Campana, S. E., Annand, M. C., and McMillan, J. I. (1995). Graphical and statistical methods for determining the consistency of age determinations. Transactions of the American Fisheries Society 124, 131–138.
| Graphical and statistical methods for determining the consistency of age determinations.Crossref | GoogleScholarGoogle Scholar |
Carlander, K. (1969). Life history data on freshwater fishes of the United States and Canada, exclusive of the Perciformes. In ‘Handbook of Freshwater Fishery Biology'. Vol. 1, p. 752. (Iowa State University Press: Ames, IA, USA.)
Carlson, J. K., Sulikowski, J. R., and Baremore, I. E. (2006). Do differences in life history exist for blacktip sharks, Carcharhinus limbatus, from the United States South Atlantic Bight and Eastern Gulf of Mexico? Environmental Biology of Fishes 77, 279–292.
| Do differences in life history exist for blacktip sharks, Carcharhinus limbatus, from the United States South Atlantic Bight and Eastern Gulf of Mexico?Crossref | GoogleScholarGoogle Scholar |
Castro, J. I. (2011). Family Carcharhinidae, the Requiem Sharks. In ‘The Sharks of North America’. pp. 388–503. (Oxford University Press: Oxford, UK.)
Chin, A., Simpfendorfer, C., Tobin, A., and Heupel, M. (2013). Validated age, growth and reproductive biology of Carcharhinus melanopterus, a widely distributed and exploited reef shark. Marine and Freshwater Research 64, 965–975.
| Validated age, growth and reproductive biology of Carcharhinus melanopterus, a widely distributed and exploited reef shark.Crossref | GoogleScholarGoogle Scholar |
Clarke, S. (2011). A status snapshot of key shark species in the western and central Pacific and potential management options. Western and Central Pacific Fisheries Commission, number WCPFC-SC7–2011/EB-WP-04, Pohnpei, Federated States of Micronesia.
Clarke, S., Harley, S., Hoyle, S., and Rice, J. (2011a). An indicator-based analysis of key shark species based on data held by SPC-OFP. Western and Central Pacific Fisheries Commission number WCPFC-SC7–2011/EB-WP-01, Pohnpei, Federated States of Micronesia.
Clarke, S., Yokawa, K., Matsunaga, H., and Nakano, H. (2011b). Analysis of North Pacific shark data from Japanese commercial longline and research/training vessel records. Western and Central Pacific Fisheries Commission number WCPFC-SC7–2011/EB-WP-02, Pohnpei, Federated States of Micronesia.
Clarke, S. C., Coelho, R., Francis, M. P., Kai, M., Kohin, S., Liu, K., Simpendorfer, C., Tovar-Availa, J., Rigby, C., and Smart, J. J. (2015). Report of the Pacific Shark Life History Expert Panel Workshop. Western and Central Pacific Fisheries Commission.
Compagno, L. J. V. (1984). Family Carcharhindae. In ‘Sharks of the World. An Annotated and Illustrated Catalogue of Shark Species Known to Date. FAO Species Catalogue 125, Vol. 4, Part. 2 – Carcharhiniformes’. pp. 449–485. (FAO: Rome, Italy.)
Compagno, L. J. V. (1990). Alternative life-history styles of cartilaginous fishes in time and space. Environmental Biology of Fishes 28, 33–75.
| Alternative life-history styles of cartilaginous fishes in time and space.Crossref | GoogleScholarGoogle Scholar |
Cortés, E. (2000). Life history patterns and correlations in sharks. Reviews in Fisheries Science 8, 299–344.
| Life history patterns and correlations in sharks.Crossref | GoogleScholarGoogle Scholar |
Cortés, E. (2008). Comparative life history and demography of pelagic sharks. In ‘Sharks of the Open Ocean: Biology, Fisheries and Conservation’. (Eds M. Camhi, E. Pikitch, and E. Babcock.) pp. 309–322. (Blackwell Publishing: Oxford, UK.)
Cortés, E., Arocha, F., Beerkircher, L., Carvalho, F., Domingo, A., Heupel, M., Holtzhausen, H., Santos, M. N., Ribera, M., and Simpfendorfer, C. (2010). Ecological risk assessment of pelagic sharks caught in Atlantic pelagic longline fisheries. Aquatic Living Resources 23, 25–34.
| Ecological risk assessment of pelagic sharks caught in Atlantic pelagic longline fisheries.Crossref | GoogleScholarGoogle Scholar |
Dagorn, L., Holland, K. N., Restrepo, V., and Moreno, G. (2013). Is it good or bad to fish with FADs? What are the real impacts of the use of drifting FADs on pelagic marine ecosystems? Fish and Fisheries 14, 391–415.
| Is it good or bad to fish with FADs? What are the real impacts of the use of drifting FADs on pelagic marine ecosystems?Crossref | GoogleScholarGoogle Scholar |
Driggers, W., Carlson, J., Cullum, B., Dean, J., and Oakley, D. (2004). Age and growth of the blacknose shark, Carcharhinus acronotus, in the western North Atlantic Ocean with comments on regional variation in growth rates. Environmental Biology of Fishes 71, 171–178.
| Age and growth of the blacknose shark, Carcharhinus acronotus, in the western North Atlantic Ocean with comments on regional variation in growth rates.Crossref | GoogleScholarGoogle Scholar |
Dulvy, N. K., Baum, J. K., Clarke, S., Compagno, L. J. V., Cortés, E., Domingo, A., Fordham, S., Fowler, S., Francis, M. P., Gibson, C., Martínez, J., Musick, J. A., Soldo, A., Stevens, J. D., and Valenti, S. (2008). You can swim but you can’t hide: the global status and conservation of oceanic pelagic sharks and rays. Aquatic Conservation: Marine and Freshwater Ecosystems 18, 459–482.
| You can swim but you can’t hide: the global status and conservation of oceanic pelagic sharks and rays.Crossref | GoogleScholarGoogle Scholar |
Dulvy, N. K., Fowler, S. L., Musick, J. A., Cavanagh, R. D., Kyne, P. M., Harrison, L. R., Carlson, J. K., Davidson, L. N., Fordham, S. V., and Francis, M. P. (2014). Extinction risk and conservation of the world’s sharks and rays. eLife 3, e00590.
| Extinction risk and conservation of the world’s sharks and rays.Crossref | GoogleScholarGoogle Scholar | 24448405PubMed |
Francis, M. P. (2006). Morphometric minefields – towards a measurement standard for chondrichthyan fishes. Environmental Biology of Fishes 77, 407–421.
| Morphometric minefields – towards a measurement standard for chondrichthyan fishes.Crossref | GoogleScholarGoogle Scholar |
Francis, M. P., Campana, S. E., and Jones, C. M. (2007). Age under-estimation in New Zealand porbeagle sharks (Lamna nasus): is there an upper limit to ages that can be determined from shark vertebrae? Marine and Freshwater Research 58, 10–23.
| Age under-estimation in New Zealand porbeagle sharks (Lamna nasus): is there an upper limit to ages that can be determined from shark vertebrae?Crossref | GoogleScholarGoogle Scholar |
Francis, M. P., Natanson, L. J., and Campana, S. E. (2008). The biology and ecology of the porbeagle shark, Lamna nasus. In ‘Sharks of the Open Ocean: Biology, Fisheries and Conservation’. (Eds M. Camhi, E. Pikitch and E. Babcock.) pp. 105–113. (Blackwell Publishing: Oxford, UK.)
García, V. B., Lucifora, L. O., and Myers, R. A. (2008). The importance of habitat and life history to extinction risk in sharks, skates, rays and chimaeras. Proceedings of the Royal Society of London – B. Biological Sciences 275, 83–89.
| The importance of habitat and life history to extinction risk in sharks, skates, rays and chimaeras.Crossref | GoogleScholarGoogle Scholar |
Goldman, K. J. (2004). Age and growth of elasmobranch fishes. In ‘Elasmobranch Fisheries Management Techniques’. (Eds J. Musick and R. Bonfil.) pp. 97–132. (Asia Pacific Economic Cooperation: Singapore.)
Goldman, K. J., and Musick, J. A. (2006). Growth and maturity of salmon sharks (Lamna ditropis) in the eastern and western North Pacific, and comments on back-calculation methods. Fishery Bulletin 104, 278–292.
Goldman, K. J., Cailliet, G. M., Andrews, A. H., and Natanson, L. J. (2012). Assessing the age and growth of chondrichthyan fishes. In ‘Biology of Sharks and Their Relatives’, 2nd edn. (Eds J. C Carrier, J. A. Musick, and M. R Heithaus.) pp. 423–451. (CRC Press: Boca Raton, FL, USA.)
Haddon, M. (2001). ‘Modelling and Quantitative Methods in Fisheries.’ (CRC Press: Boca Raton, FL, USA.)
Harry, A. V., Tobin, A. J., and Simpfendorfer, C. A. (2013). Age, growth and reproductive biology of the spot-tail shark, Carcharhinus sorrah, and the Australian blacktip shark, C. tilstoni, from the Great Barrier Reef World Heritage Area, north-eastern Australia. Marine and Freshwater Research 64, 277–293.
| Age, growth and reproductive biology of the spot-tail shark, Carcharhinus sorrah, and the Australian blacktip shark, C. tilstoni, from the Great Barrier Reef World Heritage Area, north-eastern Australia.Crossref | GoogleScholarGoogle Scholar |
Hoenig, J. M., and Gruber, S. H. (1990). Life-history patterns in the elasmobranchs: Implications for fisheries management. In ‘Elasmobranchs as Living Resources: Advances in the Biology, Ecology, Systematics, and the Status of the Fisheries. Proceedings of the Second United States–Japan Workshop’, 9–14 December 1987, Honolulu, HI, USA. (Eds H. L Pratt Jr, S. H. Gruber, and T. Taniuchi.) NOAA Technical Report NMFS 90, pp. 1–16. (US Department of Commerce, National Oceanic and Atmospheric Administration.) Available at http://spo.nmfs.noaa.gov/tr90opt.pdf [Verified 23 August 2016].
Howey-Jordan, L. A., Brooks, E. J., Abercrombie, D. L., Jordan, L. K. B., Brooks, A., Williams, S., Gospodarczyk, E., and Chapman, D. D. (2013). Complex movements, philopatry and expanded depth range of a severely threatened pelagic shark, the oceanic whitetip (Carcharhinus longimanus) in the western North Atlantic. PLoS One 8, e56588.
| Complex movements, philopatry and expanded depth range of a severely threatened pelagic shark, the oceanic whitetip (Carcharhinus longimanus) in the western North Atlantic.Crossref | GoogleScholarGoogle Scholar | 1:CAS:528:DC%2BC3sXjsF2is7c%3D&md5=5a923c5d5236b695bb08fa2f979a3606CAS | 23437180PubMed |
Jennings, S., and Kaiser, M. J. (1998). The effects of fishing on marine ecosystems. In ‘Advances in Marine Biology’. (Eds J. H. S. Blaxter, A. J. Southward, and P. A. Tyler.) Vol. 34, pp. 201–352. (Academic Press: London, UK.)
Jolly, K., da Silva, C., and Attwood, C. (2013). Age, growth and reproductive biology of the blue shark Prionace glauca in South African waters. African Journal of Marine Science 35, 99–109.
| Age, growth and reproductive biology of the blue shark Prionace glauca in South African waters.Crossref | GoogleScholarGoogle Scholar |
Joung, S. J., Chen, N.-F., Hsu, H.-H., and Liu, K.-M. (2016). Estimates of life history parameters of the oceanic whitetip shark, Carcharhinus longimanus, in the Western North Pacific Ocean. Marine Biology Research 12, 758–768.
| Estimates of life history parameters of the oceanic whitetip shark, Carcharhinus longimanus, in the Western North Pacific Ocean.Crossref | GoogleScholarGoogle Scholar |
Kalish, J., and Johnston, J. (2001). Determination of school shark age based on analysis of radiocarbon in vertebral collagen. In ‘Use of the Bomb Radiocarbon Chronometer to Validate Fish Age’. (Ed. J. Kalish.) Vol. 93, pp. 116–129. (Fisheries Research and Development Corporation: Canberra.)
Katsanevakis, S. (2006). Modelling fish growth: model selection, multi-model inference and model selection uncertainty. Fisheries Research 81, 229–235.
| Modelling fish growth: model selection, multi-model inference and model selection uncertainty.Crossref | GoogleScholarGoogle Scholar |
Katsanevakis, S., and Maravelias, C. D. (2008). Modelling fish growth: multi-model inference as a better alternative to a priori using von Bertalanffy equation. Fish and Fisheries 9, 178–187.
| Modelling fish growth: multi-model inference as a better alternative to a priori using von Bertalanffy equation.Crossref | GoogleScholarGoogle Scholar |
Kimura, D. K. (1980). Likelihood methods for the von Bertalanffy growth curve. Fishery Bulletin 77, 765–776.
Kumoru, L. (2003). The shark longline fishery in Papua New Guinea. In ‘Proceedings of the Billfish and By-catch Research Group, 176th Meeting of the Standing Committee on Tuna and Billfish’, 9–16 July 2003, Moloolaba, Qld, Australia. pp. 1–5. (National Fisheries Authority: Port Moresby, Papua New Guinea.)
Kyne, P., and Simpfendorfer, C. (2010). Deepwater chondrichthyans. In ‘Biology of Sharks and Their Relatives II’. (Eds J. C. Carrier, J. A. Musick, and M. R Heithaus.) pp. 37–113. (CRC Press: Boca Raton, FL, USA.)
Lessa, R., Marcante Santana, F., and Renato, P. (1999). Age, growth and stock structure of the oceanic whitetip shark, Carcharhinus longimanus, from the southwestern equatorial Atlantic. Fisheries Research 42, 21–30.
| Age, growth and stock structure of the oceanic whitetip shark, Carcharhinus longimanus, from the southwestern equatorial Atlantic.Crossref | GoogleScholarGoogle Scholar |
Lombardi-Carlson, L. A., Cortés, E., Parsons, G. R., and Manire, C. A. (2003). Latitudinal variation in life-history traits of bonnethead sharks, Sphyrna tiburo (Carcharhiniformes: Sphyrnidae) from the eastern Gulf of Mexico. Marine and Freshwater Research 54, 875–883.
| Latitudinal variation in life-history traits of bonnethead sharks, Sphyrna tiburo (Carcharhiniformes: Sphyrnidae) from the eastern Gulf of Mexico.Crossref | GoogleScholarGoogle Scholar |
Mollet, H., Ezcurra, J., and O’Sullivan, J. (2002). Captive biology of the pelagic stingray, Dasyatis violacea (Bonaparte, 1832). Marine and Freshwater Research 53, 531–541.
| Captive biology of the pelagic stingray, Dasyatis violacea (Bonaparte, 1832).Crossref | GoogleScholarGoogle Scholar |
Musyl, M. K., Brill, R. W., Curran, D. S., Fragoso, N. M., McNaughton, L. M., Nielsen, A., Kikkawa, B. S., and Moyes, C. D. (2011). Postrelease survival, vertical and horizontal movements, and thermal habitats of five species of pelagic sharks in the central Pacific Ocean. Fishery Bulletin 109, 341–368.
Nakano, H., and Stevens, J. D. (2008). The biology and ecology of the blue shark, Prionace glauca. In ‘Sharks of the Open Ocean: Biology, Fisheries and Conservation’. (Eds M. Camhi, E. Pikitch and E. Babcock.) pp. 140–151. (Blackwell Publishing: Oxford, UK.)
Natanson, L. J., Mello, J. J., and Campana, S. E. (2002). Validated age and growth of the porbeagle shark (Lamna nasus) in the western North Atlantic Ocean. Fishery Bulletin 100, 266–278.
Natanson, L. J., Adams, D. H., Winton, M. V., and Maurer, J. R. (2014). Age and growth of the bull shark in the western North Atlantic Ocean. Transactions of the American Fisheries Society 143, 732–743.
| Age and growth of the bull shark in the western North Atlantic Ocean.Crossref | GoogleScholarGoogle Scholar |
Pilling, G. M., Kirkwood, G. P., and Walker, S. G. (2002). An improved method for estimating individual growth variability in fish, and the correlation between von Bertalanffy growth parameters. Canadian Journal of Fisheries and Aquatic Sciences 59, 424–432.
| An improved method for estimating individual growth variability in fish, and the correlation between von Bertalanffy growth parameters.Crossref | GoogleScholarGoogle Scholar |
Rice, J., and Harley, S. (2012). Stock assessment of oceanic whitetip sharks in the western and central Pacific Ocean. Western and Central Pacific Fisheries Commission, number WCPFC-SC8–2012/SA-WP-06, Busan, South Korea.
Ricker, W. (1969). Effects of size-selective mortality and sampling bias on estimates of growth, mortality, production, and yield. Journal of the Fisheries Board of Canada 26, 479–541.
| Effects of size-selective mortality and sampling bias on estimates of growth, mortality, production, and yield.Crossref | GoogleScholarGoogle Scholar |
Ricker, W. E. (1975). Computation and interpretation of biological statistics of fish populations. In ‘Bulletin 191 of the Fisheries Research Board of Canada’. pp. 313–314. (The Blackburn Press.) Available at http://www.dfo-mpo.gc.ca/Library/1485.pdf [Verified 23 August 2016].
Ricker, W. (1979). Growth rates and models. In ‘Fish Physiology’. (Eds W. S. Hoar, D. J. Randall, and J. R. Brett.) Vol. 8, pp. 677–743. (Academic Press: New York.)
Rigby, C., and Simpfendorfer, C. A. (2013). Patterns in life history traits of deep-water chondrichthyans. Deep-sea Research. Part II, Topical Studies in Oceanography 115, 30–40.
Seki, T., Taniuchi, T., Nakano, H., and Shimizu, M. (1998). Age, growth and reproduction of the oceanic whitetip shark from Pacific Ocean. Fisheries Science 64, 14–20.
| 1:CAS:528:DyaK1cXhtlygtro%3D&md5=4f7a8a5726ab1fbf7dbb14b26ed3b441CAS |
Smart, J. J., Harry, A. V., Tobin, A. J., and Simpfendorfer, C. A. (2013). Overcoming the constraints of low sample sizes to produce growth data for rare or threatened sharks. Aquatic Conservation: Marine and Freshwater Ecosystems 23, 124–134.
| Overcoming the constraints of low sample sizes to produce growth data for rare or threatened sharks.Crossref | GoogleScholarGoogle Scholar |
Smart, J. J., Chin, A., Tobin, A. J., Simpfendorfer, C. A., and White, W. T. (2015). Age and growth of the common blacktip shark Carcharhinus limbatus from Indonesia, incorporating an improved approach to comparing regional population growth rates. African Journal of Marine Science 37, 177–188.
| Age and growth of the common blacktip shark Carcharhinus limbatus from Indonesia, incorporating an improved approach to comparing regional population growth rates.Crossref | GoogleScholarGoogle Scholar |
Smart, J. J., Chin, A., Baje, L., Green, M. E., Appleyard, S. A., Tobin, A. J., Simpfendorfer, C. A., and White, W. T. (2016). Effects of including misidentified sharks in life history analyses: a case study on the grey reef shark Carcharhinus amblyrhynchos from Papua New Guniea. PLoS One 11, e0153116.
| Effects of including misidentified sharks in life history analyses: a case study on the grey reef shark Carcharhinus amblyrhynchos from Papua New Guniea.Crossref | GoogleScholarGoogle Scholar | 27058734PubMed |
Smart, J. J., Chin, A., Tobin, A. J., and Simpfendorfer, C. A. (2016). Multimodel approaches in shark and ray growth studies: strengths, weaknesses and the future. Fish and Fisheries , .
| Multimodel approaches in shark and ray growth studies: strengths, weaknesses and the future.Crossref | GoogleScholarGoogle Scholar |
Sminkey, T. R., and Musick, J. A. (1995). Age and growth of the sandbar shark, Carcharhinus plumbeus, before and after population depletion. Copeia , 871–883.
| Age and growth of the sandbar shark, Carcharhinus plumbeus, before and after population depletion.Crossref | GoogleScholarGoogle Scholar |
Stevens, J., Bonfil, R., Dulvy, N., and Walker, P. (2000). The effects of fishing on sharks, rays, and chimaeras (chondrichthyans), and the implications for marine ecosystems. ICES Journal of Marine Science: Journal du Conseil 57, 476–494.
| The effects of fishing on sharks, rays, and chimaeras (chondrichthyans), and the implications for marine ecosystems.Crossref | GoogleScholarGoogle Scholar |
Tanaka, S., Cailliet, G. M., and Yudin, K. G. (1990). Differences in growth of the blue shark, Prionace glauca: technique or population? In ‘Elasmobranchs as Living Resources: Advances in the Biology, Ecology, Systematics, and the Status of the Fisheries. Proceedings of the Second United States–Japan Workshop’, 9–14 December 1987, Honolulu, HI, USA. (Eds H. L Pratt Jr, S. H. Gruber, and T. Taniuchi.) NOAA Technical Report NMFS 90, pp. 177–187. (US Department of Commerce, National Oceanic and Atmospheric Administration.) Available at http://spo.nmfs.noaa.gov/tr90opt.pdf [Verified 23 August 2016].
Thorson, J. T., and Simpfendorfer, C. A. (2009). Gear selectivity and sample size effects on growth curve selection in shark age and growth studies. Fisheries Research 98, 75–84.
| Gear selectivity and sample size effects on growth curve selection in shark age and growth studies.Crossref | GoogleScholarGoogle Scholar |
Tolotti, M. T., Travassos, P., Frédou, F. L., Wor, C., Andrade, H. A., and Hazin, F. (2013). Size, distribution and catch rates of the oceanic whitetip shark caught by the Brazilian tuna longline fleet. Fisheries Research 143, 136–142.
| Size, distribution and catch rates of the oceanic whitetip shark caught by the Brazilian tuna longline fleet.Crossref | GoogleScholarGoogle Scholar |
Tolotti, M. T., Bach, P., Hazin, F., Travassos, P., and Dagorn, L. (2015). Vulnerability of the oceanic whitetip shark to pelagic longline fisheries. PLoS One 10, e0141396.
| Vulnerability of the oceanic whitetip shark to pelagic longline fisheries.Crossref | GoogleScholarGoogle Scholar | 26492091PubMed |
von Bertalanffy, L. (1938). A quantitative theory of organic growth (inquiries on growth laws. II). Human Biology 10, 181–213.
| 1:CAS:528:DyaA1MXksVGhtg%3D%3D&md5=acd96effa5f541ba74af8e51a2d0f948CAS |
Walker, T. I. (2005). Reproduction in fisheries science. In ‘Reproductive Biology and Phylogeny of Chondrichthyans: Sharks, Batiods, and Chimaeras’. (Ed. W. C. Hamlett.) Vol. 3, pp. 81–127. (Science Publishers: Enfield, NH, USA.)
Walker, T. I., Taylor, B. L., Hudson, R. J., and Cottier, J. P. (1998). The phenomenon of apparent change of growth rate in gummy shark (Mustelus antarcticus) harvested off southern Australia. Fisheries Research 39, 139–163.
| The phenomenon of apparent change of growth rate in gummy shark (Mustelus antarcticus) harvested off southern Australia.Crossref | GoogleScholarGoogle Scholar |
Western and Central Pacific Fisheries Commission (2013). Conservation and Management Measure 2013-08. Conservation and management measure for silky sharks. Commission 10th Regular Session, 2–6 December, Cairns, Australia. Available at https://www.wcpfc.int/doc/cmm-2013-08/conservation-and-management-measure-silky-sharks [Verified 17 August 2016].
White, W., Bartron, C., and Potter, I. (2008). Catch composition and reproductive biology of Sphyrna lewini (Griffith & Smith) (Carcharhiniformes, Sphyrnidae) in Indonesian waters. Journal of Fish Biology 72, 1675–1689.
| Catch composition and reproductive biology of Sphyrna lewini (Griffith & Smith) (Carcharhiniformes, Sphyrnidae) in Indonesian waters.Crossref | GoogleScholarGoogle Scholar |
Zhu, L., Li, L., and Liang, Z. (2009). Comparison of six statistical approaches in the selection of appropriate fish growth models. Chinese Journal of Oceanology and Limnology 27, 457–467.
| Comparison of six statistical approaches in the selection of appropriate fish growth models.Crossref | GoogleScholarGoogle Scholar |