

An assessment of alternative cotton fibre quality attributes and their relationship with yarn strength
Robert L. Long A D E , Michael P. Bange B D , Christopher D. Delhom C , Jeffrey S. Church A and Greg A. Constable BA CSIRO Materials Science and Engineering, PO Box 21, Belmont, Vic. 3216, Australia.
B CSIRO Plant Industry, Locked Bag 59, Narrabri, NSW 2390, Australia.
C USDA-ARS Southern Regional Research Centre, 1100 Robert E. Lee Boulevard, New Orleans, LA 70124, USA.
D Cotton Catchment Communities Co-operative Research Centre, Australia.
E Corresponding author. Email: robert.long@csiro.au
Crop and Pasture Science 64(8) 750-762 https://doi.org/10.1071/CP12382
Submitted: 13 November 2012 Accepted: 15 February 2013 Published: 9 April 2013
Journal Compilation © CSIRO Publishing 2013 Open Access CC BY-NC-ND
Abstract
Knowing the yarn-strength performance potential of cotton fibre is advantageous to spinners during mill preparation, and to researchers developing new genotypes and management strategies to produce better fibre. Standard High Volume Instrument (HVI) fibre quality attributes include micronaire (a combined measure of fibre linear density and maturity) and bundle tensile properties. While these attributes relate well to yarn strength, alternative fibre quality attributes may better explain the variation in yarn strength. Two field experiments over two seasons were conducted to assess the fibre and yarn performance of some Australian cotton genotypes. The aim was to assess and compare alternative measures for micronaire, and to compare bundle and single-fibre tensile measurements, and assess the relative yarn-strength predictive performance of these attributes. Specific fibre measurement comparisons were for linear density (double-compression Fineness Maturity Tester (FMT) and gravimetric), maturity ratio (FMT, polarised light, calculated, and cross-sectional), and tensile properties (HVI bundle and Favimat Robot single fibre). Multiple linear regression models for yarn strength that included yarn manufacturing variables and standard HVI fibre quality parameters performed well (standard error of prediction (SEP) 2.40 cN tex–1). Multiple linear regression models performed better when alternatives to micronaire were used, e.g. using gravimetric linear density (SEP, 2.15 cN tex–1) or laser photometric determined ribbon width (SEP 1.71 cN tex–1). Yarn strength models were also better when single fibre tensile properties were substituted for bundle tensile properties (SEP 1.07 cN tex–1). The substitution of alternative fineness variables for micronaire or single-fibre strength for bundle strength in a simple fibre quality index also improved the prediction of yarn strength.
Introduction
Every day, most people utilise cotton fibre. As fabric for apparel its light weight, good breathability, good handle, and versatility keep it in demand. There is, however, the need to continue to add value to the cotton crop to maintain its profitability in light of increasing production costs and competition from other fibres. Better fibre that contributes to the construction of stronger yarns is desirable and allows the more efficient production of fabric (May and Taylor 1998; Foulk et al. 2009). Therefore, effective prediction of the yarn performance potential of fibre is advantageous to spinners during lay-down management and to researchers developing new genotypes and management strategies to produce better fibre.
Important fibre attributes include length, bundle tensile properties, and fineness. Testing with a High Volume Instrument (HVI) (Uster Technologies AG, Uster, Switzerland) (Schleth et al. 2007) is standard practice to determine these fibre attributes in many production regions, and these properties are used to establish the value of cotton fibre (USDA 2005). HVI properties explain much but not all of the variation in yarn strength, and significant work has been conducted into understanding the relative contribution of fibre properties (El Sourady et al. 1974; Ureyen and Kadoglu 2006) and how these properties relate to yarn performance, through the development of fibre quality indices (Hunter 2004) or modelling techniques (Ramey et al. 1977; Zurek et al. 1987; Cheng and Adams 1995). There remain opportunities to include fibre quality measurements that may better explain yarn strength, for example by employing alternative attributes for, among others, the still commonly used micronaire measure.
Micronaire is a measurement based on air resistance, originally intended to efficiently determine cotton fibre linear density (original units micrograms per inch) (Fowler and Hertel 1940; Smith 1947; Lord 1956), which is a surrogate for cross-sectional fineness (or coarseness) of fibre. Micronaire is a standard HVI measurement but is now reported without units because it unreliably represents linear density and is confounded by true fibre linear density and the degree of cell-wall thickening (maturity). This relationship is explained by the Lord equation: maturity ratio × linear density = 3.86 × micronaire2 + 18.16 × micronaire + 13 (Lord 1956; Montalvo 2005). High-micronaire cotton is considered coarse (large perimeter) by spinners and results in fewer fibres in the yarn cross-section, which translates into weaker yarns. Alternatively, while lower micronaire is associated with more desirable, finer fibres, it is also interpreted as being immature and prone to dye uptake problems, breakage, and nep (fibre knot) formation.
Various instruments have been developed for commercial use that attempt to quickly and easily measure cotton-fibre linear density and maturity independently. Two established technologies are the dual-compression Fineness and Maturity Tester (FMT), as originally produced by the Shirley Institute, Manchester, UK, and since 1998 sold as the WIRA Electronic Cotton Fineness and Maturity Meter (WIRA Instrumentation Ltd, Bradford, UK) (Chapman and Staten 1957; ASTM 1997), and the Uster Technologies Advanced Fibre Information System (AFIS) (Williams and Yankey 1996; Bradow et al. 1997). The FMT has been the choice of Australian researchers for assessing the linear density and maturity of cotton fibres due to its rapid operation and requirement for large sample size (4 g v. 0.5 g for AFIS). Prototype instruments have also been developed by the Commonwealth Scientific and Industrial Research Organisation (CSIRO). Cottonscan (Abbott et al. 2010) was developed to rapidly and directly measure linear density, being a modified, automated version of the cut-and-weigh method (ASTM International 2010a). To measure fibre maturity, the Siromat instrument (Gordon and Phair 2005) was developed as an alternative to assess smaller samples (5 mg). Siromat is an automated, digital imaging version of the polarised light microscopy method (Schwarz and Hotte 1935; Grimes 1945) employed in ASTM Standard D1442-06 (ASTM International 2010b). Both the Cottonscan and Siromat technologies are commercially available in one instrument called Cottonscope (Cottonscope Pty Ltd, Perth, W. Aust.) (Rodgers et al. 2012).
The definitive method for determining cross-sectional parameters such as maturity is via cross-sectional image analysis (Matic-Leigh and Cauthen 1994; Thibodeaux and Rajasekaran 1999; Hequet et al. 2006). This method is time-consuming but is potentially useful for calibrating or testing the performance of less direct methods. Certainly, there is a need to compare some of the linear density and maturity measures and how they relate to yarn performance across different genotypes. This would provide practical information for researchers and spinners who critically evaluate cotton fibre quality.
The external geometry of cotton fibres is influenced by the combination of perimeter, maturity, and the unique irregular cross-sectional shape that is formed by dried convoluted hollow fibres. Particular parameters such as fibre circularity and fullness have been described (Skau 1951; Hebert et al. 1979), and the diameter or width of fibres or ‘ribbons’ has been acknowledged to be an indication of fibre fineness. Lord (1961) described ribbon width as the maximum width of a given fibre measured between two convolutions as determined via a manual light-microscopy method, and average random diameter as a random measurement of fibre width on each fibre, although measuring such attributes by this method is impractical. Adedoyin et al. (2010) and Zhang et al. (2010) also acknowledged the potential importance of such a measurement and described laboratory prototype instruments for laser diffraction to measure the width of manually presented, single cotton fibres. Indeed, a commercially available device based on laser photometry, called the Sirolan Laserscan (ASTM International 2010c), was developed in the 1990s to rapidly measure the diameter of textile fibres, mainly wool fibres. This instrument was also demonstrated to effectively and quickly (<1 min) measure the average fibre width of enough cotton fibres (~1000 snippets) to represent a classing sample, and thus have commercial potential (Long et al. 2010). However, no work has been reported relating yarn performance with such a measure of cotton fibre width.
Fibre tensile properties include strength, which is the force to break normalised to the weight or other physical dimension of the bundle or fibre, and elongation, which is the percentage extension of fibre at break. HVI bundle tensile testing is easy to conduct and gives average measurements for many thousands of fibres. Single-fibre tensile testing is more tedious and thus not undertaken routinely, and although it relates to bundle tensile properties (Thibodeaux et al. 1998) it is seen to give a better indication of intrinsic fibre tensile properties (Huson et al. 2000). Various single-fibre tensile testing devices have been developed, including prototype research-specific instruments (Sasser et al. 1991) and those manufactured for commercial use. Such instruments include more manual devices (Lord 1961), and semi-automated instruments such as the Mantis (Hebert et al. 1995), which normalises the strength of fibres to the width of each fibre, and the Favimat (Textechno, Mönchengladbach, Germany) (Foulk and McAlister 2002; Delhom et al. 2010), which uses vibroscope-determined linear density as the normalising parameter (Patt 1958; ASTM International 2010a). The latest Favimat Robot uniquely provides more automated testing of pre-mounted fibres, allowing more fibre tests with less manual input, thus providing average single-fibre tensile data that better represent a sample. Although work has been published comparing single-fibre and bundle tensile measures and their relative relationship to yarn properties (e.g. Sasser et al. 1991), there are few studies examining the relationship between single-fibre tensile properties determined by Favimat Robot and yarn performance.
The specific undertakings and aims of the research described herein are threefold. First, Australian-bred cotton genotypes that ranged in fibre quality were grown over two seasons, with harvested fibre being spun into carded or combed yarns at multiple tex and twist levels. Second, this enabled fundamental comparisons to be made between some measurement techniques for fineness and maturity fibre quality relevant to the Australian research position—specifically for double-compression FMT, gravimetrically determined linear density, polarised light maturity, and cross-sectional image analysis. Bundle and single-fibre tensile properties were also compared.
Finally, to augment and integrate these comparisons and assess the practical functionality of alternative fibre attributes, linear regression models predicting yarn strength were developed using fibre quality attributes and yarn manufacturing parameters as variables. Importantly, models were developed using one season of data and validated with an independent dataset from the second season, and vice versa. While it was not intended to develop a definitive model of yarn strength, the purpose was to assess fibre and spinning parameters collectively within a simple multivariate scenario. The intention was to examine the substitution of micronaire with alternative parameters such as linear density, maturity, or ribbon width, or with cross-sectional attributes such as perimeter. Model performance where single-fibre tensile properties were used in substitution for bundle tensile properties was also examined. Another approach was also taken examining the substitution of the same variables in a simple fibre quality index (FQI = length × strength/fineness) as previously described (Hunter 2004). The linear relationship between FQI genotype rankings and rankings based on actual yarn strength were compared across yarn type for the different fibre fineness and fibre strength variables.
Materials and methods
Production, harvest, and ginning
Two field experiments comparing different cotton genotypes were conducted over two consecutive growing seasons (Expt 1, 2006–07; Expt 2, 2007–08) at the Australian Cotton Research Institute (ACRI), Narrabri (30.3°S 149.8°E), in north-western New South Wales, Australia. The location is a semi-arid environment with grey Vertosol soil (Isbell 2002). Details of, and some data from, Expt 1 were previously reported in Long et al. (2010). Both experiments employed a randomised complete block design with genotypes as treatments, with two replications. The genotypes used were bred by the CSIRO and included commercially available Gossypium hirsutum L. (upland) cultivars Sicot 71BR, Sicot 70BRF, and Sicala 350B (Stiller 2005); unreleased upland breeding lines CHQX12B, CHQX377, and CHQX90; and the commercially available G. barbadense L. (pima) cultivar Sipima 280 (Stiller 2008).
Experiments were sown with a disc opening Kinze commercial row-crop planter (Kinze Manufacturing, Williamsburg, IA, USA). Seeds were sown at 5 cm depth, delivered at 15 seeds m–1 in rows spaced at 1 m. Expt 1 was sown on 17 October 2006, and Expt 2 on 16 October 2007. Treatment plots were 585 m by three rows in Expt 1 and 175 m by four rows in Expt 2. Crops were established and grown with full irrigation and using non-limiting nitrogen applied as anhydrous ammonia (injected below and to the side of the plant-line before sowing) at a rate of 180 kg ha–1 in Expt 1 and 160 kg ha–1 in Expt 2. Crops were controlled for pests when required (Hearn and Fitt 1992; Deutscher et al. 2004). Experiments were defoliated in preparation for harvest when all treatments had >60% of bolls open (Expt 1, 5 April 2007; Expt 2, 26 April 2008).
Experiments were machine-harvested with a John Deere spindle cotton picker. Upland seed cotton was ginned on a Continental Eagle 100 saw gin (Continental Gin Company, Birmingham, USA) with one lint-cleaning passage, at Cotton Seed Distributors, Wee Waa, New South Wales. Pima cotton was ginned with a commercial Continental Eagle roller gin at Clyde Agriculture, Bourke, New South Wales. For each experimental unit (plot), a bale of ≥50 kg of cotton fibre was produced (Expt 1, n = 12 bales; Expt 2, n = 14 bales). Fibre (1 kg) was randomly subsampled from each bale and used for fibre quality measurements.
Fibre quality measurements
The HVI testing was undertaken using an Uster HVI 1000, located at Auscott Ltd, Sydney, New South Wales. Length properties were upper half mean length (mm), which is the average length of the longer half of fibres by weight; length uniformity (%), which is the ratio of the mean length to the upper half mean length; and short fibre index (%), which is an estimate of the percentage of fibres that are shorter than 12.7 mm (Behery 1993). Other HVI properties were bundle strength (g tex–1) and elongation (%), and fibre micronaire. HVI results were the average of two replicate tests made for each experimental bale.
Testing of air-flow-based linear density (mtex, mg 1000 m–1) and maturity (maturity ratio) was undertaken at ACRI using an SDL IIC–Shirley Fineness/Maturity Tester III (FMT) instrument. Each 10-g fibre sample was cleaned using an SDL HVI Fibre Blender before testing. Results were the average of two replicate tests made per bale.
Fibre samples (15–20 g each) were also subjected to an air-driven piston coring instrument (Abbott et al. 2010) to make ~300 mg of 2-mm-long fibre snippets. Some snippets were tested for maturity ratio using the CSIRO polarised light microscopy instrument SiroMat (5 mg of snippets per test). Samples were also tested for gravimetrically determined linear density (mtex) using the CSIRO Cottonscan instrument (Naylor and Purmalis 2005; Abbott et al. 2010). Cottonscan requires an accurately weighed sample of ~80 mg, which is suspended in a liquid allowing digital fibre images to be obtained. Snippets were also subjected to average fibre width (µm) determination (referred to herein as ‘ribbon width’) using the CSIRO laser photometric instrument Sirolan Laserscan (Lynch and Michie 1976; Lunney and Irvine 1979; Charlton 1995), in which 1000 snippets were assessed per sample replicate. Results presented for polarised light maturity, gravimetric linear density, and ribbon width, respectively, were the average of three, five, and three replicate tests per bale.
Single fibre strength (cN tex–1) and elongation (%) testing was undertaken with a Textechno Favimat Robot at the USDA Southern Regional Research Laboratory in New Orleans (Delhom et al. 2010). Testing was conducted using a 13-mm gauge length, a pre-tension force of 0.85 cN, and a cross-head speed of 13 mm min–1. Reported single-fibre tensile properties for each bale were an average of ≥300 single-fibre tests.
Fibre cross-sectional analysis was conducted at Texas Tech University, Lubbock, Texas, via the method described by Hequet et al. (2006). Briefly, a combed fibre sample was embedded in a methacrylate polymer and 1-μm-thick fibre cross-sections were obtained via a microtome. Slide-mounted fibre cross-sections were observed with a microscope, and the captured digital images were analysed by custom image analysis software to measure fibre perimeter, cross-sectional area, and lumen area; cell wall area is cross-sectional area minus lumen area. Fibre maturity in this case was a direct determination of the degree of secondary wall thickening (or theta, θ), which is the ratio of the cell wall area to the area of a circle having the same perimeter as the fibre of interest. While θ can range theoretically between 0 and 1, it is also directly related to maturity ratio (maturity ratio = θ/0.577) (Montalvo 2005). Approximately 500 single-fibre cross-sections were analysed per test. Cross-sectional maturity results were the average of three replicate tests per bale.
Yarn manufacture
For each experimental bale, 50 kg of fibre was opened and cleaned via a Trützschler ‘blowroom’ (Trützschler, Mönchengladbach, Germany), which incorporated an inclined lattice bale feed and CVT3 opener and cleaner. The fibre was then carded via a Trützschler DK 903 card and then drawn via one passage of a Trützschler HSR 1000 draw frame. The resulting drawn sliver was then divided into two lots. One lot was subjected to a second draw-frame passage (designated ‘card’) while the second lot was combed with a Vouk CM 400/S combing machine (Vouk Macchine Tessili, Gorizia, Italy) and then drawn a second time (designated ‘comb’). Drawn slivers were converted into twisted roving via a Zinser 660 FU roving machine (Zinser Textilmaschinen GmbH, Ebersbach, Germany). Twisted roving was then spun into yarn on a Zinser 350 RM ring spinning machine. Three different yarn weights were manufactured, i.e. 12, 15, and 20 tex (g 1000 m–1), which correspond to the common, yet imperial-based, English cotton count of 49, 39, and 30 Ne yarns, respectively. Each yarn was manufactured at two twist levels: a knitting twist (αe 3.7) and a weaving twist (αe 4.0). Thirty bobbins of yarn were produced for each bale.
Yarn strength measurements
Yarn was tested for strength (cN tex–1) using a Zellweger Uster, Uster Tensorapid 3 (Uster Technologies). Yarn strength results were an average taken from ten bobbins randomly selected for measurement from the 30 produced. Yarn strength data for four of the 12 yarns manufactured for Expt 1 (20 tex at knitting twist, for both card and comb yarns) were previously reported (Long et al. 2010).
Data analyses
Two-factor ANOVA tests were conducted using Genstat 12 (Lawes Agricultural Trust, IACR, Rothamsted, UK) to determine the statistical differences between methods of fibre measurement for linear density (FMT and gravimetric), maturity ratio (FMT, polarised light, calculated via the Lord equation using gravimetric linear density, and cross-sectional), and for tensile property determination (HVI bundle and Favimat single fibre). The factors for each of the three ANOVA tests were instrument and genotype. Standard error of the difference (SED) is reported for each of the two-factor interaction effects.
To quantify some linear correlations between fibre quality parameters, Pearson’s correlation coefficients (R-values) and the degree of their significance were calculated using Genstat 12.
Multiple linear regression (MLR) models for yarn strength were developed using the three yarn manufacturing parameters card or comb (numerically designated as either 1 or 2, respectively), yarn count (tex), and yarn twist (turns per metre), and including various combinations of fibre quality attributes. This enabled an uncomplicated yet collective and simultaneous assessment of the yarn performance predictive ability of fibre quality attributes for different yarn types. Individual replicate data for each experiment were used for MLR analysis (Expt 1, 12 genotype bales assessed at 12 different yarns structures, n = 144; Expt 2, 14 genotype bales assessed at 12 different yarns structures, n = 168). The model designated as a control or standard model, and used as a benchmark for comparing other models with alternative fibre attributes, incorporated the yarn manufacturing variables and standard HVI parameters length, length uniformity, short fibre index, bundle strength, bundle elongation, and micronaire. MLR analysis was carried out using Matlab 2011a and the Statistics Toolbox (The MathWorks, USA). The significance of the coefficients determined in each model was assessed at the 5% confidence level using the calculated P-values.
For model performance statistics, the standard error of the estimate (SEE) is the square root of the quotient of the sum of the residuals (SSerr) and the total degrees of freedom (dft):

where  is the predicted Y value, k is the number of variables in the model, and n is the number of observations.
The standard error of prediction (SEP) was determined in a similar manner to the SEE but using the equation determined for one dataset to predict the other. For example, data from Expt 1 were used as a calibration set to develop the model, while data from Expt 2 were used as a validation set. The resulting predicted Y values, the s, were compared with the actual Y values from the Expt 2 dataset.
The coefficient of determination (R2) is the square of the Pearson’s correlation coefficient, R, which is defined as the covariance of the two variables divided by the product of their standard deviations. For the case herein, the variables are Y and :

where  and
and  and SY and
  are the means and standard deviations of the measured (Y) and predicted () values.
Another approach was also taken to assess the impact of fibre quality variable substitution on yarn strength performance. Of the 12 FQIs tabled in the review by Hunter (2004), all were based on that reported by Lord (1961), which is the ratio of the product of length and strength to a measure of fineness. Thus, this basic FQI was employed using HVI length, bundle strength, and one of the various fineness measures micronaire, gravimetric or FMT linear density, ribbon width, or cross-sectional perimeter, or using the FQI with micronaire but substituting single-fibre strength for bundle strength. For a combined set of both experiments, genotype bales were ranked based on each FQI and these rankings were compared via Pearson’s correlation analysis with actual rankings for bales based on yarn strength. This was undertaken for each of the 12 yarn types (which were positively correlated and statistically significant), and average coefficients of determination were compared across the different FQIs using ANOVA.
Results and discussion
Fibre quality—genotype and instrument differences
Fibre quality parameter results for the different cotton genotypes obtained using different instruments are presented in Tables 1 and 2. Specific results are discussed below.

|

|
Length
There were differences between genotypes for HVI fibre length parameters across both experiments, with upper half mean length ranging between 29.3 mm (‘medium to long’, Uster Statistics classification group, Uster Technologies) and 36.2 mm (‘extra long’) (Table 1). Length uniformity of genotypes ranged between 83.4 and 86.2%, and short fibre index ranged between 6.3 and 7.8%.
Linear density and maturity
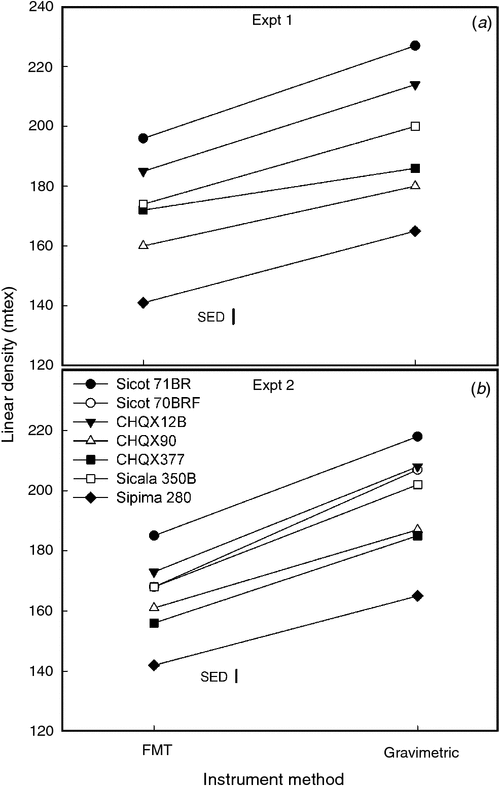
Across both experiments micronaire ranged 1.34 units, while for linear density, FMT ranged 64 mtex and gravimetric ranged 68 mtex (Table 1). Gravimetric linear density results were consistently higher across genotypes, without statistical interaction, compared with FMT linear density by an average of 27 mtex (Fig. 1), and results from these instruments were correlated (r = 0.90, P < 0.001).
|
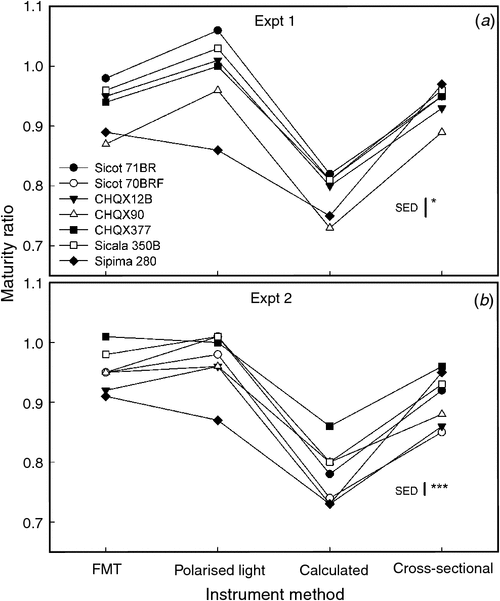
The range in maturity ratio for genotypes was 0.17 for FMT, calculated, and cross-sectional methods, but was greater (0.23) for polarised light maturity ratio (Tables 1, 2). Relative to the more direct ‘reference’ cross-sectional maturity ratio results, FMT maturity ratio had an average difference of 0.02, polarised light a difference of 0.06, and calculated maturity ratio was 0.14 different. As averaged across both experiments, polarised light maturity ratio values were highest, followed by FMT, then cross-sectional, with calculated values being the lowest (Fig. 2). There were no significant linear relationships between cross-sectional maturity (theta) and either polarised light or FMT maturity ratio values; however, calculated maturity ratio values were correlated with cross-sectional maturity results (r = 0.53, P < 0.01).
|
From Fig. 2 it is clear that maturity ratio results for genotypes typically varied between instruments, although there were some consistent patterns. For example, in Expt 1 CHQX90 tended to have the lowest maturity of the upland genotypes for all four instrument results (Fig. 2a), whereas in Expt 2 CHQX377 tended to be high in maturity for each of the instruments (Fig. 2b). Notably, while Sipima 280 tended to have similarly low maturity as other genotypes for either FMT or calculated maturity ratio results, for results determined by polarised light it had markedly low maturity compared with the other genotypes (Fig. 2). Conjecture about the reliability of polarised light determined maturity has typically centred on suggestions that the measurement is confounded by total wall area (Lord 1961; Lord and Heap 1988). It is well known that pima cotton is inherently finer (distinctly smaller fibre perimeter) than upland cotton, ensuring the wall area of pima cotton will be less than that of an upland genotype regardless of maturity, and thus appearing to have lower polarised light determined maturity. Indeed, Rodgers et al. (2012) reported that polarised light maturity ratio was more strongly linearly related to micronaire (R2 = 0.88) than to cross-sectional determined maturity ratio (R2 = 0.65) for 104 reference bales (Hequet et al. 2006). Certainly micronaire should be reasonably well related to total wall area, because it too is influenced concurrently by maturity and perimeter.
The other significant finding was that, in contradiction to results from three of the methods, cross-sectional maturity ratio for Sipima 280 tended to be high (Fig. 2). While the cross-section technique is seen to be a direct reference method, it has been criticised as having a bias towards mature fibres, i.e. the image analysis software has more difficulty discerning the perimeter of less mature folded fibres and thus excludes such fibres from any analysis. Padmaraj et al. (2011) attempted to quantify this bias as an 8–9% overestimation. While this maturity anomaly seen for Sipima 280 was not detected for other genotypes lower in maturity, such as CHQX90 in Expt 1, this inconsistency might be related to the markedly smaller perimeter of pima cotton, which might exaggerate this effect; that is, less mature pima fibres may provide even a greater challenge to the image analysis software.
Ribbon width and perimeter
Laser photometric determined ribbon width ranged between 13.7 and 15.2 μm and was highest for Sicot 71BR and CHQX12B, while Sipima 280 had the smallest value (Table 2). Cross-sectional determined fibre perimeter ranged between 43.9 and 54.2 μm with CHQX12B tending to have the biggest, while Sipima 280 had the smallest perimeter.
Strength and elongation
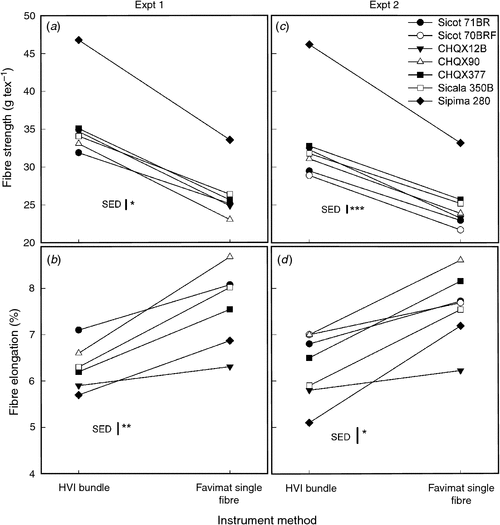
Differences were measured between genotypes for bundle strength and elongation, with strength ranging18.7 g tex–1 and elongation ranging 2.3%. The range for single-fibre strength was 14.5 cN tex–1 and elongation 2.7% (Table 2). Bundle strength was on average ~9 g tex–1 higher than single-fibre strength (cN tex–1 was converted to g tex–1 for comparisons; 1 cN = 1.0197 g), and bundle elongation was on average 1.3% less than single-fibre elongation (Table 2, Fig. 3). Bundle and single-fibre strength measurements were linearly related (r = 0.94, P < 0.001) as were bundle and single-fibre elongation measurements (r = 0.67, P < 0.001). Statistically significant interactions between methods of measurement across genotypes were captured; for example, Sipima 280 was consistently stronger (bundle or single-fibre) than the other genotypes, although it tended to have the lowest bundle elongation, but sungle-fibre elongation similar to other genotypes (Fig. 3).
|
In comparison to other work, Delhom et al. (2010) reported that HVI bundle strength was also higher than Favimat single-fibre strength results (single-fibre gauge length of 13 mm) by an average (for eight genotypes) of 7.2 g tex–1 and HVI elongation was 2.3% less than single-fibre elongation. Those authors also reported correlations between bundle and single-fibre strength (r = 0.92) and bundle and single-fibre elongation (r = 0.63). Sasser et al. (1991) also reported a correlation between bundle and single-fibre strength (r = 0.79), although in that case single-fibre strength was, on average (across 33 genotypes, no elongation data reported), higher than bundle strength by 9.1 g tex–1. This is attributed to the smaller gauge length used (3.2 mm), which is the same as the HVI bundle gauge length. Similarly, Delhom et al. (2010) reported single-fibre strength determined at the 3.2-mm gauge length as being higher than bundle strength by an average of 12.2 g tex–1; the relationship between single-fibre and bundle strength at this gauge length was not as strong (r = 0.74) as with the bigger gauge length. The 13-mm gauge length for single-fibre testing is required, particularly for the automated Favimat protocol, to allow an accurate linear density determination of each fibre via the vibroscope technology. Where single-fibre strength data are reported at a smaller gauge length (3.2 mm), linear density is pre-determined on a subsample of fibres via a manual linear density method (e.g. cut and weigh), which is used in conjunction with single-fibre force-at-break data.
Yarn performance
Yarn strength was different between genotypes, and combed yarns were consistently stronger than carded yarns for all genotypes by an average of 1.4 cN tex–1 (Table 3). Higher count yarns were consistently stronger, and higher (weave) twist yarns were stronger, than lower (knit) twist yarns on average by ~0.7 cN tex–1.

|
Yarn strength prediction
To bolster the comparisons presented previously and to understand the practical implications of these alternative fibre attributes, MLR models and FQIs were developed to predict yarn strength.
Models and FQIs using standard HVI variables
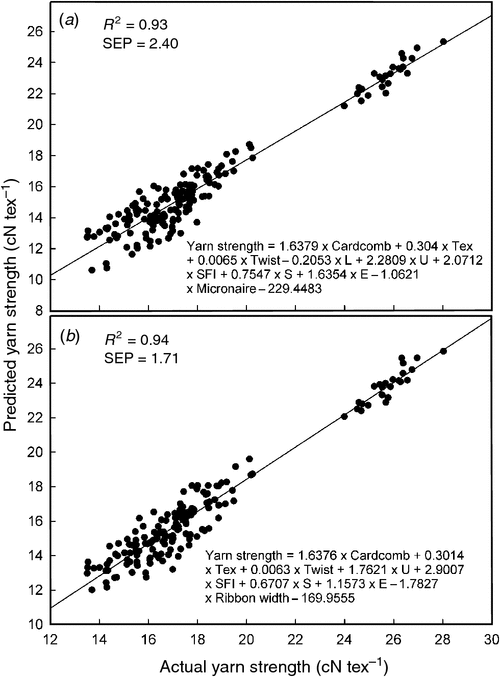
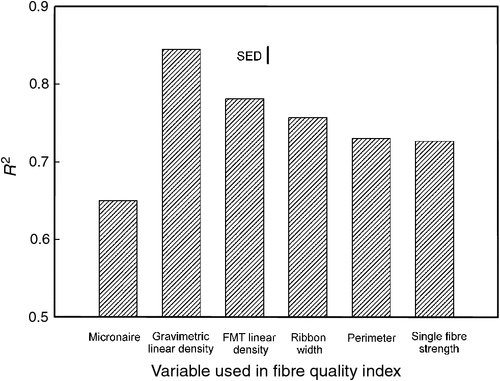
Calibration statistics for MLR models predicting yarn strength using all standard HVI fibre quality variables were good (e.g. for Expt 1, R2 = 0.98, SEE = 0.56) (Table 4). As anticipated, when either of the two experiments was used as a validating population against a model developed for the other, performance statistics were not as good (e.g. Expt 2 data validated against Expt 1 standard variables model: R2 = 0.93, SEP = 2.40) (Fig. 4a). Most fibre variables contributed significantly to models at the 95% confidence limit, except for some length attributes (e.g. when Expt 1 was validated against the Expt 2 model). For genotype rankings based on the FQI including micronaire, the relationship with rankings based on yarn strength was reasonable (R2 = 0.65) (Fig. 5).

|
|
|
Models and FQIs using alternatives for micronaire
Yarn strength models developed using linear density and maturity ratio variables as an alternative to micronaire performed better than the models using micronaire. For example, using Expt 1 data validated against Expt 2 models, the SEP for the standard model including micronaire was 1.56, compared with better SEP values of 1.13, 1.10, and 1.07, respectively, for models using FMT linear density and maturity ratio, gravimetric linear density and polarised maturity ratio, and gravimetric linear density and calculated maturity ratio variables (Table 4); the average improvement in SEP across both experiments was ~20% for these three alternative models. While some length attributes did not significantly contribute to the models, maturity ratio was also determined as not significantly contributing for either FMT or calculated models. When either gravimetric or FMT linear density was substituted for micronaire in an FQI, the genotype–yarn strength ranking relationship also improved (R2 = 0.84 and 0.78, respectively) (Fig. 5).
Models developed using cross-sectional determined fibre perimeter and maturity (theta) parameters as replacements for micronaire performed well (low SEE values for both experiments) and were similar to standard models with micronaire from a predictive standpoint (4% difference averaged across SEP values for both experiments) (Table 4). Fibre quality variables were found to be significant in these models, except fibre bundle strength for the model developed from Expt 2. The FQI genotype–yarn strength ranking relationship also improved when perimeter was used instead of micronaire in the FQI, but it did not perform as well as other measures of fineness (Fig. 5).
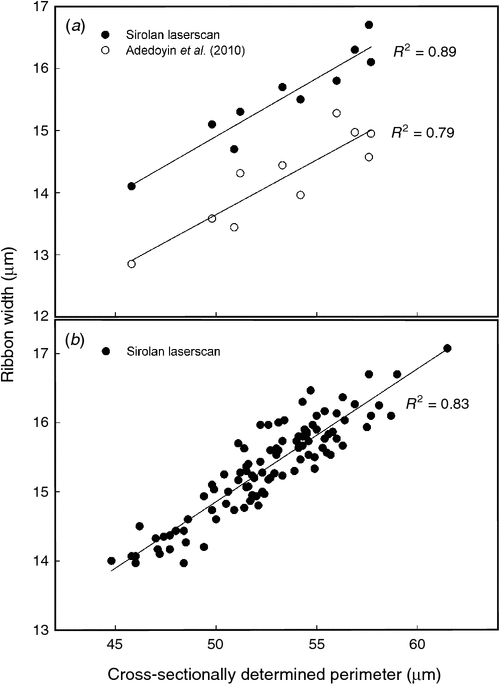
When laser photometric determined ribbon width was used as a replacement for micronaire, models also performed better, by ~30% based on the average improvement in SEP across experiments (e.g. Expt 2 data validated against Expt 1 model: SEP = 1.71) (Table 4, Fig. 4b). Substituting ribbon width for micronaire in an FQI also significantly improved the relationship between FQI genotype rankings and rankings based on yarn strength (Fig. 5). Ribbon width has potential as a unique measure that helps explain how fibres will pack together in a yarn. While any measure that helps to define cotton fineness (e.g. micronaire, linear density, or cross-section perimeter) will be useful, ribbon width may well simply give an average indication of the external cross-sectional architecture of fibres which will be collectively influenced by other components such as convolutions, the degree of fullness affected by fibre maturity, and fibre perimeter. Indeed, the relationship between ribbon width and cross-sectional perimeter was expected to be reasonable but not perfect due to convolutions and fullness effects. This was demonstrated by Adedoyin et al. (2010), who measured the ribbon width of ~1000 fibres from each of a selection of ten of the 104 reference cotton bales (Hequet et al. 2006) and reported a reasonable linear relationship between ribbon width and cross-sectional determined perimeter (R2 = 0.81) (Fig. 6a). For the same ten samples (as part of a separate subset of the 104 reference cotton bales made available to the CSIRO in 2006), cross-sectional perimeter was slightly more linearly related to laser photometric (Sirolan Laserscan) ribbon width (R2 = 0.89) (Fig. 6a), but not as strongly when all 104 reference cottons were analysed (excluding five missing/outlier samples, n = 99) (R2 = 0.83) (Fig. 6b). For the data reported herein for the two experiments, the relationship was not as strong (R2 = 0.53).
|
Apart from re-confirming the concept of using laser technology to measure the width of fibres, the work of Adedoyin et al. (2010) attempted to use the technique (laser diffraction) specifically for cotton. While Sirolan Laserscan has been available commercially since the 1990s, other technology has also been available to measure the width of textile fibres, such as the OFDA (BSC Electronics, Australia) (Qi et al. 1994), which is based on digital image analysis technology and has now been incorporated into Cottonscope (Rodgers et al. 2012). Similarly, Xu et al. (2009) described a prototype microscope-based instrument that combined fibre width and translucence measurements to measure fibre maturity. A microscope image determination of ribbon width may well differ from that derived via the laser photometric method and would in turn relate differently to yarn strength data. Such differences have yet to be quantified.
Models and FQIs using single-fibre tensile properties
Models that employed single-fibre attributes performed better than those using standard HVI bundle tensile properties. For example, using Expt 2 data validated against Expt 1 models, the SEP for the model including single-fibre strength and elongation was 1.07 compared with the standard model SEP of 2.40 (Table 4). Most fibre attributes significantly contributed to these models, except for elongation in the Expt 2 model. Significant conjecture on the importance of elongation and its relationship to fibre and yarn strength has been reported previously (Chee and Campbell 2009) and this requires more research. When single-fibre strength was used instead of bundle strength in an FQI, the relationship between FQI genotype rankings and rankings based on yarn strength improved significantly (Fig. 5). Sasser et al. (1991) also reported that correlations between fibre strength and yarn strength were improved when single-fibre tensile properties were used instead of stelometer or HVI bundle strength parameters; however, they did not report elongation results. Single-fibre testing is thought to offer a more complete measure of inherent fibre tensile properties, which will thus reflect more directly how fibres will affect the tensile properties of yarn. The clamping of multiple fibres and associated slippage effects, variable length of fibres, fibre alignment inconsistencies, and variable strain at break are components of bundle testing that can adulterate fibre tensile property determination (Huson et al. 2000). Nonetheless, bundle testing is still a fast, convenient, and practical method of determining the tensile properties of cotton fibre. Single-fibre testing will be undertaken more readily when testing instrumentation such as the Favimat Robot becomes more available and when such technology becomes more automated.
Conclusion
Two field experiments assessing Australian cotton genotypes were conducted to compare standard and alternative methods of measuring fibre fineness, maturity, and tensile properties, and to test the yarn strength predictive performance of these attributes. For fibre linear density, FMT and the gravimetric method were related with no interacting effects of genotype across instruments. For maturity ratio, interactions were captured between genotype and the method of measurement, with the polarised light technique underestimating the maturity of the small-perimeter (pima) genotype, whereas the cross-section method may have overestimated the maturity of pima. In replacement for micronaire, respective combinations of linear density and maturity gave rise to better predictive models for yarn strength, although maturity ratio variables tended not to contribute statistically to models, with linear density playing a more important role. This is attributed to a more independent measure of linear density better representing fibre fineness and subsequently the packing density of fibres in a yarn. Similarly, when alternative measures of fineness were used instead of micronaire in a FQI, the relationship between FQI genotype rankings and rankings for yarn strength improved. As the only replacement for micronaire, laser photometric determined ribbon width also produced better models for yarn strength and better FQI ranking relationships, because this measure was seen to collectively quantify all influencing components (e.g. unique shape and perimeter) on cross-sectional fineness. Fibre strength and elongation varied across genotypes for the bundle and single-fibre methods, and yarn strength models including single-fibre properties as replacements for bundle properties performed better. Genotype rankings based on an FQI using single-fibre strength instead of bundle strength were more related to genotype–yarn strength rankings. This was attributed to single-fibre testing being free of alignment, length variation, and variable strain-at-break effects. Furthermore, the number of fibres in a bundle of a given linear density may vary due to differences in individual fibres (e.g. there will be a greater number of less mature fibres in a bundle), and this might compound the effects of bundle-testing issues.
Acknowledgments
The authors gratefully acknowledge Jane Caton, Darin Hodgson, Mark Freijah, Fred Horne, Susan Miller, Nicole Phair-Sorensen, and the CSIRO textile testing laboratory for technical assistance. Thanks to Cotton Seed Distributors (CSD) for provision of commercial cotton seed, CSD and Clyde Agriculture for ginning the cotton, Greg Parle and Auscott Limited for HVI testing, Eric Hequet and Mary Rains at Texas Tech University for cross-section analysis, and to Holly King at the USDA for single fibre tensile testing. This work was supported by the Cotton Research and Development Corporation, the Cotton Catchment Communities Cooperative Research Centre, and the CSIRO.
References
Abbott AM, Higgerson GJ, Long RL, Lucas SR, Naylor GRS, Tischler CR, Purmalis MM (2010) An instrument for determining the average fiber linear density (fineness) of cotton lint samples. Textile Research Journal 80, 822–833.| An instrument for determining the average fiber linear density (fineness) of cotton lint samples.Crossref | GoogleScholarGoogle Scholar | 1:CAS:528:DC%2BC3cXmvFCltLg%3D&md5=da365d80873f75242de1b16cb482913fCAS |
Adedoyin AA, Li C, Toews MD (2010) Characterization of single cotton fibers using a laser diffraction system. Textile Research Journal 81, 355–367.
| Characterization of single cotton fibers using a laser diffraction system.Crossref | GoogleScholarGoogle Scholar |
ASTM (1997) Standard test methods for linear density and maturity index of cotton fibers (IIC-Shirley Fineness/Maturity Tester) D3818-92. In ‘Annual book of ASTM standards. Section seven: Textiles. Vol. 07.02’. pp. 133–136. (American Society for Testing and Materials: West Conshohocken, PA)
ASTM International (2010a) Standard test methods for linear density of textile fibers D1577-07. In ‘Annual book of ASTM standards. Section seven: Textiles. Vol. 07.01’. pp. 368–377. (ASTM International: West Conshohocken, PA)
ASTM International (2010b) Standard test method for maturity of cotton fibers (sodium hydroxide swelling and polarized light procedures) D1442-06. In ‘Annual book of ASTM standards. Section seven: Textiles. Vol. 07.01’. pp. 321–326. (ASTM International: West Conshohocken, PA)
ASTM International (2010c) Standard test methods for diameter of wool and other animal fibers by Sirolan-Laserscan fiber diameter analyser D6466-10. In ‘Annual book of ASTM standards. Section seven: Textiles. Vol. 07.02’. pp. 590–598. (ASTM International: West Conshohocken, PA)
Behery HM (1993) ‘Short fiber content and uniformity index in cotton—ICAC review article on cotton production research. No. 4.’ (CAB International: Wallingford, UK)
Bradow JM, Wartelle LH, Bauer PJ, Sassenrath-Cole GF (1997) Small-sample cotton fiber quality quantitation. The Journal of Cotton Science 1, 48–60.
Chapman WE, Staten G (1957) Cotton fiber maturity rapidly predicted with variable volume of sample in micronaire. Textile Research Journal 27, 991–992.
| Cotton fiber maturity rapidly predicted with variable volume of sample in micronaire.Crossref | GoogleScholarGoogle Scholar | 1:CAS:528:DyaG1cXhvVOgsw%3D%3D&md5=35fc864ee32502f868c7eabebc1d5563CAS |
Charlton D (1995) Sirolan-Laserscan. A review of its development, performance and application. Wool Technology and Sheep Breeding 43, 212–228.
Chee PW, Campbell BT (2009) Bridging classical and molecular genetics of cotton fiber quality and development. In ‘Genetics and genomics of cotton, plant genetics and genomics: crops and models 3’. (Ed. AH Paterson) pp. 283–311. (Springer Science + Business Media: New York)
Cheng L, Adams DL (1995) Yarn strength prediction using neural networks part 1: fiber properties and yarn strength relationship. Textile Research Journal 65, 495–500.
| Yarn strength prediction using neural networks part 1: fiber properties and yarn strength relationship.Crossref | GoogleScholarGoogle Scholar | 1:CAS:528:DyaK2MXnslWqs7s%3D&md5=3b3b4683f7e073f6254b389dcbc4c67bCAS |
Delhom CD, Cui X, Thibodeaux DP (2010) Single fiber testing via Favimat. In ‘2010 Beltwide Cotton Conference’. New Orleans, Louisiana, 4–7 January 2010. (National Cotton Council of America: Cordova, TN)
Deutscher SA, Wilson LJ, Mensah R (2004) ‘Integrated pest management guidelines for cotton production systems in Australia.’ (The Australian Cotton Cooperative Research Centre: Narrabri, NSW)
El Sourady AS, Worley S, Stith LS (1974) The relative contribution of fiber properties to variations in yarn strength in upland cotton, Gossypium hirsutum L. Textile Research Journal 44, 301–306.
| The relative contribution of fiber properties to variations in yarn strength in upland cotton, Gossypium hirsutum L.Crossref | GoogleScholarGoogle Scholar |
Foulk JA, McAlister DD (2002) Single cotton fiber properties of low, ideal, and high micronaire values. Textile Research Journal 72, 885–891.
| Single cotton fiber properties of low, ideal, and high micronaire values.Crossref | GoogleScholarGoogle Scholar | 1:CAS:528:DC%2BD38XnvFKjt7o%3D&md5=4b260333477d0757273f482634645c60CAS |
Foulk J, Meredith W, McAlister D, Luke D (2009) Fiber and yarn properties improve with new cotton cultivar. The Journal of Cotton Science 13, 212–220.
Fowler JL, Hertel KL (1940) Flow of a gas through porous media. Journal of Applied Physics 11, 496–502.
| Flow of a gas through porous media.Crossref | GoogleScholarGoogle Scholar | 1:CAS:528:DyaH3MXktFGk&md5=c96d9f170689d8f6dfc11c6a46731dd8CAS |
Gordon SG, Phair NL (2005) An investigation of the interference colors in mature and immature cotton fibers. In ‘Proceedings Beltwide Cotton Conferences’. New Orleans, LA. 4–7 January 2005. (Eds P Dugger, D Richter) pp. 2284–2290. (National Cotton Council of America: Cordova, TN)
Grimes MA (1945) Polarized light: Preferred for maturity tests. Textile World 161–163.
Hearn AB, Fitt GP (1992) Cotton cropping systems. In ‘Ecosystems of the world—field crop ecosystems’. (Ed. CJ Pearson) pp. 85–142. (Elsevier: London)
Hebert JJ, Boylston EK, Wadsworth JI (1979) Cross-sectional parameters of cotton fibers. Textile Research Journal 49, 540–542.
| Cross-sectional parameters of cotton fibers.Crossref | GoogleScholarGoogle Scholar |
Hebert JJ, Thibodeaux DP, Shofner FM, Singletary JK, Patelke DB (1995) A new single fiber tensile tester. Textile Research Journal 65, 440–444.
| A new single fiber tensile tester.Crossref | GoogleScholarGoogle Scholar |
Hequet EF, Wyatt B, Abidi N, Thibodeaux DP (2006) Creation of a set of reference material for cotton fiber maturity measurements. Textile Research Journal 76, 576–586.
| Creation of a set of reference material for cotton fiber maturity measurements.Crossref | GoogleScholarGoogle Scholar | 1:CAS:528:DC%2BD28XnsVeitrw%3D&md5=a475668fb84cc3d879375582f0444315CAS |
Hunter L (2004) Predicting cotton yarn properties from fibre properties in practice. In ‘Proceedings 27th International Cotton Conference’. 24–27 March, Bremen, Germany. pp. 62–77. (Faserinstitut Bremen: Bremen, Germany)
Huson MG, Phair NL, Maxwell JM, Turner PS (2000) Bundle strength and intrinsic fibre strength of finewools from different bloodlines. Asian–Australasian Journal of Animal Science 13, 268
Isbell RF (2002) ‘The Australian Soil Classification.’ (CSIRO Publishing: Melbourne)
Long RL, Bange MP, Gordon SG, van der Sluijs MHJ, Naylor GRS, Constable GA (2010) Fiber quality and textile performance of some Australian cotton genotypes. Crop Science 50, 1509–1518.
| Fiber quality and textile performance of some Australian cotton genotypes.Crossref | GoogleScholarGoogle Scholar |
Lord E (1956) Air flow through plugs of textile fibers. Part II – The micronaire test for cotton. The Journal of the Textile Institute 47, T16–T47.
Lord E (1961) ‘The characteristics of raw cotton.’ (The Textile Institute: Manchester, UK)
Lord E, Heap SA (1988) ‘The origin and assessment of cotton fibre maturity.’ (International Institute for Cotton: Manchester, UK)
Lunney HWM, Irvine PA (1979) Some factors affecting measurement by the CSIRO fiber-fineness distribution analyser. Textile Research Journal 49, 371–379.
| Some factors affecting measurement by the CSIRO fiber-fineness distribution analyser.Crossref | GoogleScholarGoogle Scholar |
Lynch LJ, Michie NA (1976) An instrument for the rapid automatic measurement of fiber fineness distribution. Textile Research Journal 46, 653–660.
Matic-Leigh R, Cauthen DA (1994) Determining cotton fiber maturity by image analysis – part 1 direct measurement of cotton fiber characteristics. Textile Research Journal 64, 534–544.
| Determining cotton fiber maturity by image analysis – part 1 direct measurement of cotton fiber characteristics.Crossref | GoogleScholarGoogle Scholar |
May OL, Taylor RA (1998) Breeding cottons with higher yarn tenacity. Textile Research Journal 68, 302–307.
| Breeding cottons with higher yarn tenacity.Crossref | GoogleScholarGoogle Scholar | 1:CAS:528:DyaK1cXitFeisLw%3D&md5=883dad22dc3e5a0140f53392b524d74fCAS |
Montalvo JG (2005) Relationships between micronaire, fineness, and maturity. Part I – Fundamentals. The Journal of Cotton Science 9, 81–88.
Naylor GRS, Purmalis M (2005) Update on Cottonscan: An instrument for rapid and direct measurement of fiber maturity and fineness. In ‘Proceedings Beltwide Cotton Conferences’. New Orleans, LA, 4–7 Jan. 2005. (Eds P Dugger, D Richter) pp. 2302–2306. (National Cotton Council of America: Cordova, TN)
Padmaraj L, Krifa M, Xu B (2011) Evaluating immature fiber bias in fiber cross-section analysis. In ‘Proceedings Beltwide Cotton Conferences’. Atlanta, GA, January 2011. (Eds S Boyd, M Huffman, B Robertson) p. 1476. (National Cotton Council of America: Cordova, TN)
Patt DH (1958) Findings and recommendations on the use of the vibroscope. Textile Research Journal 28, 691–700.
| Findings and recommendations on the use of the vibroscope.Crossref | GoogleScholarGoogle Scholar | 1:CAS:528:DyaG1cXhtVSlsLY%3D&md5=57e161e131298f2c4e8eb45d00dea5a2CAS |
Qi K, Lupton CJ, Pfeiffer FA, Minikhiem DL (1994) Evaluation of the optical fibre diameter analyser (OFDA) for measuring fiber diameter parameters of sheep and goats. Journal of Animal Science 72, 1675–1679.
Ramey HH, Lawson R, Worley S (1977) Relationship of cotton fiber properties to yarn tenacity. Textile Research Journal 47, 685–691.
Rodgers J, Delhom C, Fortier C, Thibodeaux D (2012) Rapid measurement of cotton fiber maturity and fineness by image analysis microscopy using the Cottonscope®. Textile Research Journal 82, 259–271.
| Rapid measurement of cotton fiber maturity and fineness by image analysis microscopy using the Cottonscope®.Crossref | GoogleScholarGoogle Scholar | 1:CAS:528:DC%2BC38XjsV2itr0%3D&md5=6ea83f24951236606f2fa70cac502ed9CAS |
Sasser PE, Shofner FM, Chu YT, Shofner CK, Townes MG (1991) Interpretations of single fiber, bundle, and yarn tenacity data. Textile Research Journal 61, 681–690.
| Interpretations of single fiber, bundle, and yarn tenacity data.Crossref | GoogleScholarGoogle Scholar |
Schleth A, Ghorashi H, Furter R (2007) ‘Uster HVI 1000 application report—the role of cotton classification in the textile industry.’ (Uster Technologies AG: Uster, Switzerland)
Schwarz ER, Hotte GH (1935) Micro-determination of cotton fiber maturity in polarized light. Textile Research Journal 5, 370–376.
| Micro-determination of cotton fiber maturity in polarized light.Crossref | GoogleScholarGoogle Scholar |
Skau EL (1951) Simple expressions for the circularity and fullness of fibers. Textile Research Journal 21, 14–17.
| Simple expressions for the circularity and fullness of fibers.Crossref | GoogleScholarGoogle Scholar |
Smith WS (1947) Air gauge measures fiber fineness. Textile Industries 111, 86–88.
Stiller WN (2005) Sicala 350B. Plant Varieties Journal 19, 76–80.
Stiller WN (2008) Sipima 280. Plant Varieties Journal 21, 112
Thibodeaux DP, Rajasekaran K (1999) Development of new reference standards for cotton fiber maturity. The Journal of Cotton Science 3, 188–193.
Thibodeaux DP, Hebert JJ, El-Gawad NSA, Moraitis JS (1998) Relating bundle strength to mantis single fiber strength measurements. The Journal of Cotton Science 2, 62–67.
Ureyen ME, Kadoglu H (2006) Regressional estimation of ring cotton yarn properties from HVI fiber properties. Textile Research Journal 76, 360–366.
| Regressional estimation of ring cotton yarn properties from HVI fiber properties.Crossref | GoogleScholarGoogle Scholar | 1:CAS:528:DC%2BD28XlsVOgsL0%3D&md5=5df56b039741f12fb4724f7dda29f230CAS |
USDA (2005) ‘Cotton classification understanding the data.’ Agricultural Marketing Services Cotton Program. (United States Department of Agriculture: Washington, DC)
Williams GF, Yankey JM (1996) New developments in single fiber fineness and maturity measurements. In ‘Proceedings Beltwide Cotton Conferences’. Nashville, TN, 9–12 January 1996. (Eds P Dugger, D Richter) pp. 1284–1289. (National Cotton Council of America: Cordova, TN)
Xu B, Yao X, Bel P, Hequet EF, Wyatt B (2009) High volume measurements of cotton maturity by a customized microscope system. Textile Research Journal 79, 937–946.
| High volume measurements of cotton maturity by a customized microscope system.Crossref | GoogleScholarGoogle Scholar | 1:CAS:528:DC%2BD1MXnvV2is7k%3D&md5=8e1499bbcbf0ae9b0b2fccdac130e243CAS |
Zhang Z, Lu C, Su Y (2010) A novel method to assess cotton fiber qualities based on fraunhofer diffraction. In ‘Proceedings 2nd International Asia Conference on Informatics in Control, Automation and Robotics’. Wuhan, China. 6–7 March, Vol. 1. pp. 226–228.
Zurek W, Frydrych I, Zakrzewski S (1987) A method of predicting the strength and breaking strain of cotton yarn. Textile Research Journal 57, 439–444.
| A method of predicting the strength and breaking strain of cotton yarn.Crossref | GoogleScholarGoogle Scholar |