

Dynamics of the ground layer communities of tropical eucalypt woodlands of northern Queensland
V. J. Neldner A B and D. W. Butler A
A Queensland Herbarium, Department of Environment and Science, Mt Coot-tha Road, Toowong, Qld 4066, Australia.
B Corresponding author. Email: john.neldner@des.qld.gov.au
Australian Journal of Botany 69(2) 85-101 https://doi.org/10.1071/BT20014
Submitted: 3 February 2020 Accepted: 22 January 2021 Published: 12 March 2021
Journal Compilation © CSIRO 2021 Open Access CC BY
Abstract
This paper presents insights from long-term monitoring into the dynamics of savanna plant species composition, specifically on the ground layer. Key questions are (1) how much variation is there from year to year in plant species abundance and composition? And (2) is there evidence of directional change in community composition? Five sites were located near Mareeba, north-eastern Australia, and sampled 18 times with fixed 500-m2 plots at the annual peak of plant species richness over 23 years. The sites were located in eucalypt communities across an altitudinal range of 460 m. Sampling involved systematic searching of all plant species visible above ground. The results show variation from year to year among satellite herbaceous species, with more than 50% of grasses and forbs observed at a given site only being detected at half or fewer of the 18 samplings. Herbaceous composition did not show clear signs of directional change relative to inter-annual variability. Over the 23 years, there were three very dry periods and 4 very wet years. Rainfall variation affected total cover more than plant species composition or richness. Several fires and episodes of grazing affected ground cover but did not have a lasting impact on cover or diversity. The cover and composition of the ground layer is consistently dominated by the core perennial grasses Themeda triandra Forssk. and Heteropogon triticeus (R.Br.) Stapf, with many species collectively contributing minimally to the overall cover but significantly to richness. Many herb species are persistent long-lived perennials which do not appear above ground every year. The number of naturalised plants in the ground layer was consistently low. Overall, the ground layer communities appear to be very stable in these woodlands that have been burnt 3–5 times in 23 years. High inter-annual variability of subdominant species is consistent with other studies, and emphasises the need for replication in time in ecological sampling.
Keywords: species turnover, floristic diversity, vegetation, savannas, long-term monitoring, Themeda triandra, sampling, Einasleigh Uplands bioregion, Wet Tropics bioregion.
Savannas dominate the globe in tropical areas where the climate is seasonally wet and dry. The vegetation generally consists of canopy layer of C3 trees and a ground stratum dominated by C4 grasses (Williams et al. 2017). Tropical savannas cover ~20% of land worldwide and 25% of Australia (Fox et al. 2001; Williams et al. 2017) (Fig. S1 of the Supplementary material). Although the magnitude of the drivers of tropical savannas vary across the world, water availability, temperature and fire are primary determinants of Australian savanna structure which is uniquely dominated by the family Myrtaceae, with soil nutrients and grazing being less influential (Bond and Van Wilgen 1996; Sankaran et al. 2005; Hirota et al. 2011; Lehmann et al. 2011, 2014). As savannas are predominately used for pastoralism and biodiversity conservation, there was been significant research into the effects of climate, soils, grazing and fire management on the savanna structure, particularly tree–grass interactions (Lehmann et al. 2014; Archibald et al. 2020).
Tree populations in tropical savannas are frequently characterised by very few saplings but a large number of suppressed juvenile trees <1 m tall of indeterminate age that have survived as multi-stemmed shrubs or lignotubers. This situation has been reported for the savannas of north America e.g. Scholes and Archer (1997), Asia e.g. Baker and Bunyavejchewin (2006), Africa e.g. Bond and Midgley (2001) and Australia Lehmann et al. (2009), Andersen et al. (2003), Scott et al. (2012), Werner and Prior (2013), Freeman et al. (2017), and fire appears to be an important demographic driver. The ‘fire trap’ hypothesis suggests that woody recruits need to rapidly grow to escape the fire recruitment bottleneck if they are to develop into canopy trees, which implies that suppressed juveniles are ‘caught’ within the trap (Bond et al. 2003, 2012).
Long-term studies in Australian tropical savannas (e.g. Bowman et al. 1988; Bowman and Panton 1995; Andersen et al. 2003, Scott et al. 2009, 2012) have focused primarily on the dynamics of woody trees and shrubs and their responses to fire and herbivory (Williams et al. 2003; Midgley et al. 2010; Werner and Peacock 2019) rather than the larger pool of herbaceous species in the ground layer. Russell-Smith et al. (2003b) noted high levels of variation from year to year in ground layer savanna species composition, but few other published long-term observations exist to corroborate or extend that observation (Williams et al. 2003; Scott et al. 2012). Many of the ground flora species of the Australian open forest savannas are perennial with buds protected in a range of subterranean organs such as bulbs, corms, stem tubers or root tubers (Pate and Dixon 1982; Klimesŏvá and Klimes 2007). Tall grasses, some with flowering stalks to 2 m tall, proliferate during the wet season and often burn during the dry season in fires deliberately lit by land managers or ignited naturally by lightning strikes (Williams et al. 1999; Allan et al. 2001; Dyer et al. 2001). Others are annual species or herbaceous perennials that senesce during the dry season and are not always detected in field surveys (Rice and Westoby 1983; Taylor and Dunlop 1985; Pärtel 2014). Herbaceous species richness may not vary much from year to year, but there could be significant changes in species’ dominance and community composition, which can only be revealed through repeated observation through time (Ives et al. 2003; Benson and Picone 2009).
The aim of this study was to document temporal changes in the abundance of plant species in the ground layer of monsoonal savannas in northern Queensland. The ground layer is characterised by short statured plants and may include graminoids, forbs, sprawling vines, shrubs and seedlings or suckers of trees generally less than 100 cm tall (Neldner et al. 2020). The floristic composition of the ground layer is extremely important in savanna systems because more than half of plant species in savannas are herbaceous. We assess data on variation in ground layer species’ abundance over a 23-year period, including correlations with possible drivers such as rainfall variability, domestic grazing and sporadic fires, which are fundamental to understanding the global savanna biome.
Methods
Site settings
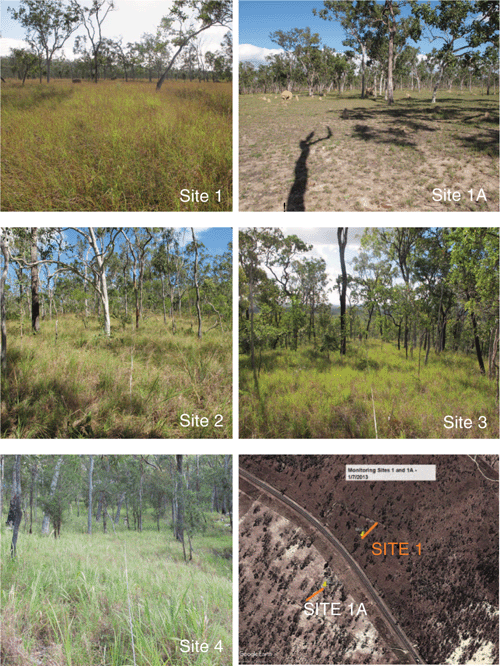
Five permanently marked sites were established within a 750-km2 area of northern Queensland. All were in open forests and woodlands dominated by Eucalyptus spp. and Corymbia spp. (broad vegetation group 2 in Fox et al. 2001) and within 20 km of Mareeba in north-eastern Australia (Fig. 1, S1). There was significant variation between sites both in terms of the environmental conditions (landscape position, geology, and climate) and the dominant tree species. Each site occurred in a different regional ecosystem and across three different land zones (Queensland Herbarium 2019). The altitudinal range of the sites from 380 to 840 m above sea level, was associated with mean annual rainfall ranging from 997 to 1457 mm (Fig. S2 of the Supplementary material). Details of the site characteristics, together with the frequency of fires and observations of grazing impacts are summarised in Table 1. Fig. 1 is photographs of the sites in 2013 and demonstrates clearly the grazing impact on the ground cover when comparing Sites 1 and 1A.
|

|
Field sampling
This study is based on repeated samplings of five permanently marked locations. Sampling methods followed the standard for detailed vegetation survey sites utilised by the Queensland Herbarium (Neldner et al. 2020). In summary, a single 50-m transect was established by V. J. Neldner in November 1991 (1993 for Site 1A) at each site and permanently marked at both ends with steel pickets.
A previous 3-year seasonal study conducted on these sites in 1992–1994, confirmed that a late wet season sampling (early May) recorded the majority of the ground layer species (Neldner et al. 2004). This is different to winter-rainfall dominated temperate grassy woodlands in south-eastern Australia where richness peaks in spring (Burrows 2004; Schultz et al. 2014). Ground layer sampling occurred on or near 1 May in 18 of the 23 years between 1992 and 2015. The 6 years when no sampling occurred were 1995, 1996, 2005, 2011, 2012 and 2014.
Projective foliage cover (PFC) of each ground layer species was visually estimated to the nearest 1% in ten 1-m2 quadrats placed at 5-m intervals along the transect. The cover values for each species from the ten quadrats were averaged to provide a mean cover for each species at the site. In addition to the ten quadrats, all vascular plant species occurring within 5 m either side of the centre line (500-m2 area) were recorded, with the majority vouchered at the Queensland Herbarium to address future taxonomic changes (Sparrow 2017). Plant nomenclature followed Brown and Bostock (2019). PFC of the tree canopy was recorded at each sampling using the line intercept method (Neldner et al. 2020). Visual estimates of cover have been shown to correlate highly with ground cover estimates derived by various more objectively repeatable methods including mapped areas, digital image analysis and point quadrat methods (Vanha-Majamaa et al. 2000; Murphy and Lodge 2002). One author (V. J. Neldner) provided the visual estimates of the actual cover values for all samplings, and hence reduced potential observer variability.
Data analysis
Data manipulation and statistical analyses were performed using R (ver. 3.0, see http://www.r-project.org/, accessed 1 February 2021). Ordination used the metaMDS routine from the R-package ‘vegan’ (ver. 2.0-8, https://cran.r-project.org/web/packages/vegan/index.html), which was applied following square-root transformation of the percentage cover data. Regression was used to assess relationships between wet season rainfall, time since last fire in months, ground layer vegetation cover and species richness (number of species) (model structures are specified in results). Regression models were developed across all sites with the ‘lmer’ function from the R-package ‘lme4’ (ver. 1.1-26, https://cran.r-project.org/web/packages/lme4/index.html) to assess evidence of effects across the whole dataset. Predictors were treated as fixed effects with ‘site’ as a random effect in all models. This model structure allowed intercepts to vary between sites but estimated a common parameter for the slope of the relationship between predictor and response. Results are generally presented at the individual site level as there is substantial between-site variation in many of the relationships. The sites clustered consistently together in the ordination, reinforcing the unique ground flora communities at each site. To summarise the influence of lifeform and longevity, the frequency of species are analysed as site × species sampling combinations, e.g. Themeda triandra in Sites 1, 1A, 2, 3, and 4 represent five combinations at each sampling.
Statistical significance of fixed effects were assessed by comparing models that included the particular fixed-effect with an appropriate ‘null’ model, containing only the random effect for sites, using maximum likelihood estimation through the ‘ANOVA’ function in R. Because there was a clear effect of rainfall on total cover and species richness, the null models used to test the effect of time since fire on these two variables, include rainfall as well as the random effect for sites. Where the mixed regression models indicated significant effects, simpler linear models were used to examine relationships between variables at each site using the ‘lm’ function in R. The relationship between cumulative species richness and the number of times each site had been sampled was examined using standardised major axis regression to fit curves of the form species number ~esample-effort with the R-package ‘smatr’ (ver. 3.4-8, see https://cran.r-project.org/web/packages/smatr/index.html).
Results
Species
A total of 218 vascular plant species, representing 45 families, was recorded in the ground layer across the site samplings (88 events, 18 years × 4 (of 5) sites, plus 16 years for Site 1A) and over the 23 years. The majority of the species were native (88.5%) and perennial (60.5%). Poaceae (44 species) and Fabaceae (30 species) were the dominant families in both richness and total cover. Statistical indicators of variability in the species cover and site composition are presented in Table S1 of the Supplementary material, and graphically presented in a pearl diagram for Site 1 as an example (Fig. 2). Similar diagrams for each site, indicating the cover of each species at each sampling are in Fig. S3 of the Supplementary material. Fig. 3 displays the frequency distribution of species (using species × site × sampling combinations) over the sampling period, which shows a familiar bimodal distribution. Many species particularly annual forbs only occur infrequently (satellite species), whereas there is a group of species, mostly perennial grasses that are always present (core species). Of the total of 218 species, only 15 occurred at all 5 sites (17 at 4, 22 at 3, 76 at 2, and 88 only at 1 site).

|

|
Site grouping of the ground flora
The sites formed distinct clusters in the ordination of 88 ground layer samplings across the different sites over the 23 years (Fig. 4). Only three outlier samples fell outside their site clusters in the ordination. Two of these outliers were sampled soon after fire. The two sites on landforms underlain by metamorphic rocks (Land zone 11, Sites 2 and 3), whereas forming distinct groups, are more closely related to each other than the other three sites that occurred on different land zones. As expected the grazed and ungrazed sites in the same regional ecosystem (1 and 1A) on the depositional Land zone 5 are very closely related to each other, but samples from each of these two adjacent sites still formed distinct groups in the ordination. Site 4 which occurred on a granitic substrate (Land zone 12) and received the most annual rainfall formed a clearly distinct group. Interestingly, there is no sign of directional change through time in the composition of the ground layers at individual sites, as evidenced by the detailed ordination panels in Fig. 4b–d with year of sampling shown within each symbol.

|
Species richness across sites
At all sites the number of non-native species was low (mean less than four species per site, Table 2). The number of all species was consistently highest at Site 2 (mean = 48.3 ± 9.1 s.d.) and Site 3 (mean = 53.2 ± 8.6 s.d.). These two sites, with medium or high mean rainfall and regular burning, also had the highest variability in richness and the largest number and cover of annual species (Table 2). They also had relatively low cover of the dominant perennial grasses T. triandra and Heteropogon triticeus (Table 3) compared to the other sites where perennial grasses made up 97% or more of the overall ground cover.

|

|
Site 4 received the highest rainfall and was regularly burnt and recorded a moderate species richness (mean = 33.6 ± 6.4 s.d.) with the highest integrity of species recorded at each sample. Non-native species made up the lowest proportion of the species recorded (5.2%) of any of the sites. There was only a low number of annual species (7.2 ± 2.9 s.d.) recorded at each sampling.
The paired sites (1 and 1A) had the lowest overall richness per sampling 29.1 ± 5.9 s.d. and 26.4 ± 5.1 s.d. respectively. They also had the highest percentage of non-native species per sampling 13.4 and 15.2 respectively. In these sites, the proportion of annual species per sampling was the lowest 6.2 and 6.4 respectively.
Total cover of ground layers
All sites had a total cover for the ground layer of more than 40% (sum of PFC for all species, averaged over the 18 samplings). Site 2 had the lowest mean cover (40.5%) and the driest site (Site 1) the highest (74.6%). The variation in total cover across all years was relatively low for all sites (s.d. ranging from 11.3 to 14.6% for Sites 1–4, with s.d. of 21.4 at the grazed Site 1A).
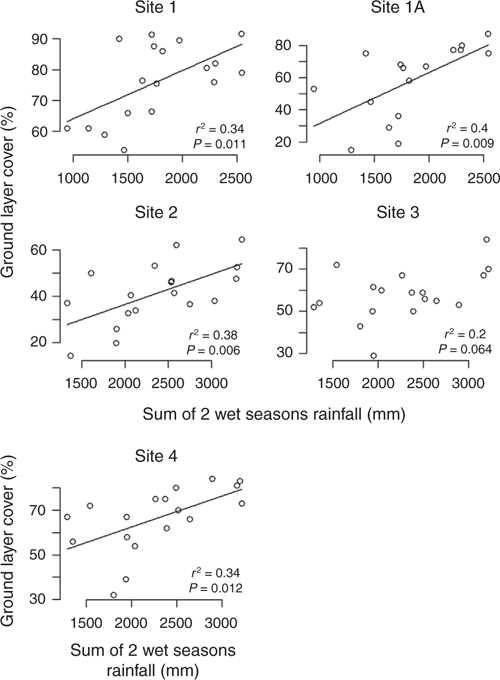
There was a positive linear relationship between the amount of rainfall received in the wet season and the cover of the ground layer. This relationship was most strongly apparent in Sites 1, 1A and 2, particularly when the sum of the previous two wet seasons were included (see Table 4; Fig. 5 and Fig. S4, S5 of the Supplementary material). Total ground cover and dominant grass species cover were the strongest vectors in two dimensional ordinations of the species composition data for each site. Canopy tree cover varied little and was not correlated with wet season rainfall (Fig. S6 of the Supplementary material) nor with ground cover (Fig. S7 of the Supplementary material).

|
|
Annual species contributed only a minor proportion of the ground cover in the driest and wettest sites (Sites 1, 1A and 4; 1.9, 1.7 and 2.5 respectively), but their contribution was more substantial in mid-range rainfall sites (Sites 2 and 3; 27.2 and 18.0% respectively) (Table 3). The average total cover in the grazing paddock (Site 1A) was significantly lower than the ungrazed site nearby (Site 1) (Table 3). Site (1A) had the most variable total cover (s.d. 21.4.)
Species richness over time
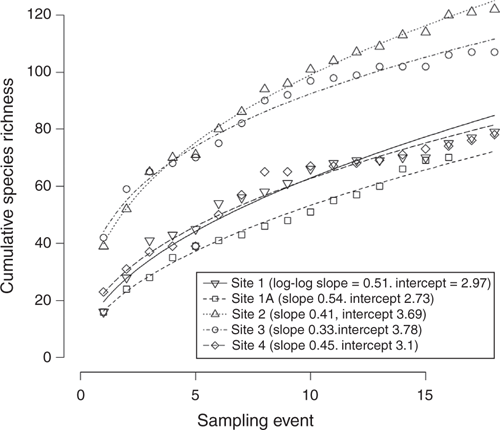
The cumulative species richness increased with successive samplings in all sites (Fig. 6). The exponent of the species–time relationship (i.e. the slope of the log-log linear relationship between the natural logarithm of cumulative richness and the natural log of the number of ~annual samples recorded) ranged from 0.33 to 0.54, and was largest in the more depauperate, driest sites (Sites 1 and 1A). These sites also had high cover that was strongly dominated by perennial tussock grasses.
|
All sites are continuing to accumulate new species although the rate is relatively slower for the more diverse sites (2 and 3). Occasional additional species are recorded over time, e.g. Ischaemum rugosum was recorded for the first time on Site 1A in 2013, in a protected-from-grazing situation at the base of a termite mound.
At all sites except Site 2, the majority (>60%) of the species in the ground layer were encountered on more than half of the sampling occasions (Table 2). This pattern is broadly similar across graminoids, forbs and woody lifeforms across all sites. The species of shrubs and trees (which were included in the ground layer only as seedlings and small plants < 100 cm tall), however, were only rarely present (Fig. 3). The mid-rainfall site (Site 2) was the most diverse site overall, partly because of a greater number of shrub species present in the ground layer than other sites, but it also because of a greater number of annual species per sampling (≥21). The percentage of species that were recorded at all of the 18 sampling occasions ranged from 5.8 to 12.5% (Sites 2 and 4 respectively).
Non-native species
The cover of non-native plants in the ground layer was relatively low both for number of species (11% of the overall flora recorded) and their overall contribution to ground cover (maximum of 5.1% of the ground cover) (Table 3). Of the non-native species, Sporobolus jacquemontii, Lantana camara and Cryptostegia grandiflora are the only species from the sites that are restricted invasive plants under the Queensland government Biosecurity Act 2014. The presence across sites and frequency of occurrence within sites of the 25 non-native species (11% of the overall flora) are listed in Table S2 of the Supplementary material. There was an average of four or fewer non-native species present at a sampling of any site (Table 2 and Table S2) with a maximum of eight species at any individual sampling, and at only one site (Site 1A). Seven species of non-native plants were recorded at every site at some sampling, while eight species were only ever recorded at a single site. Species from three families were recorded at four or more sites: the Asteraceae Ageratum houstonianum, Emilia sonchifolia and Praxelis clematidea; Fabaceae Crotalaria goreensis, Desmodium strigillosum and Stylosanthes scabra, and Poaceae Melinis repens. Comparing sites, the non-native species had their highest contribution to the ground layer, both in mean number and total cover, in the most regularly grazed site (1A) (Table 3).
During the 23 years the sites have been invaded by P. clematidea, a non-native species that has rapidly expanded its range in the last two decades and is on the Australia Alert List for Environmental Weeds (Laidlaw 2013). It was first recorded in the sites in 1999 (Sites 1A and 4), 2000 (3), 2006 (1) and 2007 (2). It has continued to persist in disturbed areas near the sites, and appeared to be increasing in cover from 2006 to 2008 at Sites 1 and 1A. However, after this initial invasion its subsequent cover and persistence at sites was very low. It was only recorded at Sites 2 and 4 in 2013 and 2015.
Passiflora suberosa, which was first recorded at Site 1 in 2001 and 1A in 2008, is persisting and increasing in cover (maximum cover of 2.5%) in the ungrazed Site 1. Its ability to sprawl over the top of the dense T. triandra sward allows it to compete effectively for light at this ungrazed site. Passiflora foetida has not persisted in the adjacent grazed Site 1A, only being recorded in 2008 and 2010.
Grazing
Three sites (1A, 2, and 4) had evidence of domestic grazing (presence of faeces, hoof prints and eaten plant parts) on several occasions (Table 1). A comparison of the paired sites in the low-rainfall area (1 and 1A) suggests that grazing reduced the mean species richness (Table 2), the mean ground cover and ground cover of the dominant perennial grasses (Table 3). There were 13 non-native species at both sites (none dominant), with increased cover of S. scabra in the grazed site (1A) site in the 2013 and 2015 samplings.
Fire
Low intensity fires that burnt the ground and shrub layer occurred in all sites, with Site 1 only being burnt once in September 1999 (Fig. S3). The fires generally occurred in the dry season from July to November, with the fire intensity increasing with fuel load, monthly temperature and prevailing local weather conditions. An intense fire in Site 4 in October 2014 scorched the canopy of trees, felled a canopy tree on the site and burnt all the subcanopy Allocasuarina torulosa trees. Sites 2 and 4 were grazing leases on state forest and Site 3 was in a national park. These sites had active fire management which aimed to burn each area every 3 years with the drier areas burnt in June and the wetter ones as late as August (R. Miller, pers. comm.). Five fires occurred every 2–5 years in Sites 2 and 3, whereas the fire interval for Site 4 ranged from 1 to 10 years. In the grazed property, three fires occurred at an interval of 5–7 years, although the adjacent road reserve only burnt once.
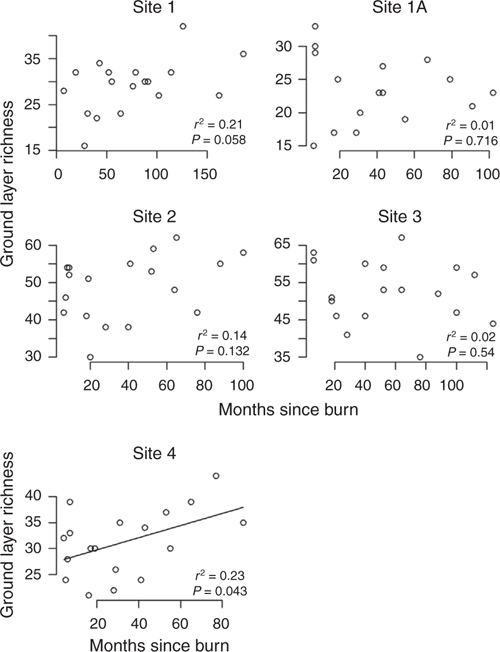
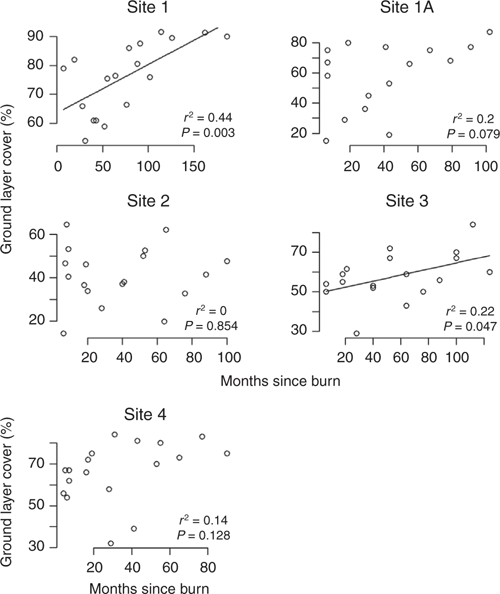
Time since fire had less influence on total ground cover or dominant species than the magnitude of the wet season, but was greatest at the mid-rainfall sites (2 and 3) where each had experienced five fires during the 23 years of the study (Fig. S8 of the Supplementary material), suggesting that fire per se may be a strong factor in determining species composition. However species richness was only correlated with months since fire for Site 4 (Fig. 7). The number of months since fire was positively correlated with ground cover for Sites 1 and 3 only (Fig. 8).
|
|
Species richness correlations
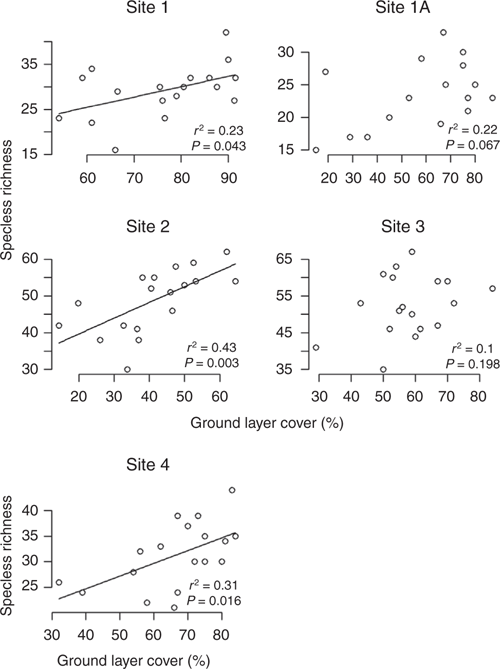
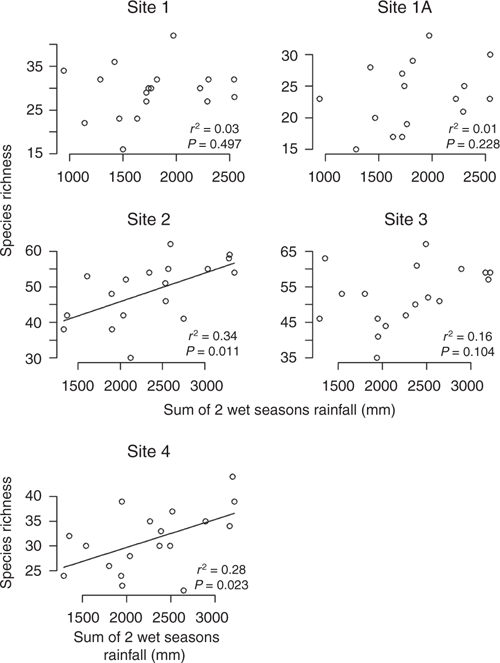
Statistical parameters for the mixed regression model analysing correlations of fire and rainfall and total species cover, and the effects of all three as drivers of richness are summarised in Table 4. Ground layer species richness was positively correlated with ground layer cover, with the clearest relationship in Sites 2 and 4 (Fig. 9). Within each site, there was a positive correlation, although across sites those with lower average cover (Sites 2 and 3) tended to have higher species richness. There was a weak positive relationship between species richness and mean annual rainfall for Site 2 (Fig. S9 of the Supplementary material). Further, when rainfall in consecutive wet seasons was used as the explanatory (predictor) variable, the relationship was slightly stronger for Sites 2 and 4 (Fig. 10).
|
|
Discussion
The dominant species composition and cover of the ground layer of these north-eastern Queensland tropical savanna communities remained remarkably similar over the 23 years of sampling. This was despite large variability in annual rainfall; i.e. 6 years with rainfall at least 250 mm below the long-term mean, and 4 years with rainfall greater than 400 mm above the mean. In addition, grazing pressure varied across the sites, and even though all sites were burnt across the 23 years, fires occurred at different frequencies, from 1 to 5 times per site.
The species richness of 23–53 species per 500-m2 plot is similar to that of eucalypt savanna in the Northern Territory (Fensham 1990) and in Cape Cleveland north Queensland (Williams et al. 2003). The ground layer in this study is dominated by the perennial C4 grass T. triandra and is similar to many savanna studies in the Northern Territory, although there is a frequent dominance of the biomass of annual grasses particularly Sarga spp. in the Northern Territory (Russell-Smith et al. 2003b; Andersen et al. 2005; Scott et al. 2012). The dominant ground layer in this study is more comparable to the 5-year study of Williams et al. (2003).
Dominant species over time
The cumulative number of species recorded at a given site can only increase over time, because of events operating at three temporal scales; sampling effects, ecological changes such as succession and evolutionary changes (Preston 1960). Even though some species may not be present at any particular sampling, e.g. subdominant perennial species with underground storage structures or annual species with low cover, the composition and cover of species recorded at each sampling allowed the sites to be consistently classified together (Fig. 4). Stability of ecological communities depends on species richness, species composition and the interactions between species (Ives et al. 2003), but also on disturbance, nutrient supply and climatic conditions (Bai et al. 2004). In this study, the dominant ground layer species, T. triandra, was always present at all sites and consistently had the highest cover (47–69% of the ground cover). Themeda triandra is one of the most widespread C4 grasses in the world and is central to the ecological functioning of palaeotropical savannas (Snyman et al. 2013; Dunning et al. 2017). Other studies have shown that the ecological dominance of T. triandra is tied to periodic burning and can tolerate moderate grazing, relying on its ability to rapidly resprout after removal of biomass by fire or grazing (Morgan and Lunt 1999; Bond et al. 2003; Price et al. 2019). Tropical grasslands dominated by T. triandra and Digitaria macroblephara on the Serengeti Plains, central-east Africa, were also fairly stable with respect to plant composition over 7–10 years (Belsky 1985; Anderson 2008).The hypotheses that T. triandra is dependent on fire and grazing to persist in a savanna grassland (Danckwerts 1993; Snyman et al. 2013) is inconsistent with Site 1, which over 28 years (23 of this study plus an observation in June 2020, M. R. Newton, pers. comm.) has maintained a T. triandra ground layer with only one fire and no cattle grazing in that period.
The perennial grasses H. triticeus and Alloteropsis semialata were also consistently present and subdominant in all sites across this study. The fire responses reported for H. triticeus are somewhat conflicting and may suggest an interaction between fire and grazing. Heteropogon triticeus is selectively grazed by cattle and it is common to see plants uprooted under even moderate grazing pressure (G. M. Crowley and S. T. Garnett, unpubl. data) in Crowley and Garnett (2001). In field experimental studies at Cape Cleveland, H. triticeus and A. semialata were significantly more abundant in plots burnt early in the dry season than in unburnt plots (Williams et al. 2003), whereas these species increased over time in both unburnt and annually burnt plots in north-central wetter savannas of the Northern Territory (Russell-Smith et al. 2003b). Scott et al. (2009) suggest that the dominant grasses H. triticeus and the annual Sarga intrans have declined in the Territory Wildlife Park because of the lack of fire and associated increase in mid-storey trees and litter cover, and these grass species require a fire at least each 7 years to ensure their persistence, and without fire over a 14-year period they are eliminated from a site.
Core and occasional species
The finding that the ground layer of these savannas have stable dominant and sub-dominant species over time, and that there are a very large number of other species, supports the concept of assemblages being composed of core and occasional or satellite species. This has been proposed for other plant communities (Glenn and Collins 1990; Pärtel et al. 2001) as well as for fish (Magurran and Henderson 2003) and insects (Ulrich and Ollik 2004). The results of this study do not support the Carousel Model (van der Maarel and Sykes 1993) with the core perennial species (T. triandra and H. triticeus) maintaining their relative dominance over the 23 years of variable magnitude wet seasons and the disturbances of fires and grazing. Perennial subdominant grasses Arundinella setosa and Eremochloa bimaculata (Sites 2, 3 and 4), and Mnesithea rottboellioides (Site 4) were consistently present despite five fires and grazing over the 23-year period.
The distribution of species frequencies within sites was strongly bimodal (a peak for core species and another for satellite species) and shows some differences between lifeforms. In particular, a large proportion of graminoids had high frequencies, reflecting their dominance in cover. Anderson (2008) found that dominant grass composition in the Serengeti was also very stable through time, despite significant fluctuations in rainfall and in fires. Some of the occasional species in our study were very scarce, e.g. Ischaemum rugosum was initially observed in a drainage area adjacent to Sites 1 and 1A, known previously from a Herbarium specimen. Some distinctive vine species such as Aristolochia holtzei and Ipomoea graminea, which have subterranean tubers, have each been recorded on four occasions each (Site 1), but have not been recorded there since 2003 and 2007 respectively. The drivers for these changes in hidden diversity (Pärtel 2014) are unknown, although further long-term studies may offer the opportunity to better understand such changes over time. The exponents of species-time relationships in this study (ranging from 0.33 to 0.54) were comparable to mean values of 0.35–0.45 reported for grasslands from four North American studies detailed in White et al. (2006).
Responses of non-native species
Only seven non-native species were widespread (recorded at every site) and a further eight were found only at a single site. The majority of non-native species had a cover of <1% on all occasions, suggesting they had played a limited role in the community structure of these savannas. This is in contrast to some areas of the wetter savannas of the Northern Territory where gamba grass (Andropogon gayanus) and other introduced African grass species have become dominant species and are altering fire regimes and vegetation structure and function (Rossiter-Rachor et al. 2009; Setterfield et al. 2010)
The impacts of invading species on native communities can range from no effects to large declines (Meffin et al. 2010). In our study, with sites subject to light grazing and irregular fire regimes, the native species are able to continue to dominate the ground cover at these savanna sites, and resist invasive non-native species. Similarly, Day and Buckley (2013) found minor changes in species composition in New Zealand tussock grasslands over 25 years, despite the presence of three species of highly invasive Hieracium species, and concluded that the grasslands are stable. Although two recently introduced species to our sites, Praxelis clematidea and Passiflora suberosa, continue to increase in cover, to date the effects on species richness and ground cover are minimal. Themeda triandra has been to found to be resistant to weed invasion in temperate areas (Prober and Lunt 2009). The introduced woody pasture legume S. scabra is present at all sites except Site 4 and increasing at Sites 1A and 3. Stylosanthes scabra is increasingly prevalent at the nearby (within 100 km) Brooklyn station after the removal of domestic stock 10 years ago (Kemp and Kutt 2020).
Seasonal effects on the ground layer cover and richness
The magnitude of the wet season rainfall was strongly correlated with the total cover of the ground layer, although it varied in strength across the sites. This correlation was most strong in the sites typically receiving less winter rainfall (Sites 1, 1A and 2). The tree canopy cover was generally sparse and varied little and was unlikely to be constraining the productivity of the ground layer. Canopy cover was not correlated with the ground layer cover or species richness. Whereas it might be expected that amount of rainfall in any particular wet season would affect the biomass and cover of the ground layer of a savanna, and therefore species richness. However, the direct relationship between rainfall and richness was inconsistent compared to those between rainfall and cover, or cover and richness (see Fig. 5, 9, 10). Similarly, in a study of a Californian annual grassland, Hobbs and Mooney (1995) found that relationships between individual species’ abundances and rainfall were complex, with varying lags between rain and peak abundance contributing to hysteresis in community level variation in relative abundance.
Fire effects on the ground layer
There is a picture developing across northern Australia of stability in savanna ground layers with regular fires. This stability is based around a set of ‘core species’, especially perennial grasses, in regularly burnt sites. Savanna ground layers generally have a consistent post-fire flush of ephemeral species, with changes following longer intervals between fire (Williams et al. 2003; Scott et al. 2012; Lebbink et al. 2018). Disturbance theory is a key framework for understanding species coexistence in plant communities generally (Miller 1982) and in Australian temperate grasslands (Lunt and Morgan 2002; Price et al. 2019). The theory is that especially in highly productive environments, large dominant species, usually perennial grasses, monopolise resources such as light and outcompete and exclude most other species (Grime 1973; Grace 1999), as well regulating nutrient cycling and species population dynamics (Lunt 1997; Morgan and Lunt 1999).
In the tropical savannas where the seasons are generally predictable in their pattern and timing but variable in their magnitude, the primary disturbance is fire, although in some cases it is grazing. Disturbance such as fire can increase species richness by removing the competitive dominance of perennial grasses (Price et al. 2019). This competitive exclusion is thought to be less strong in less productive situations, as rates of biomass accumulation are regulated by climate and soil fertility (Knapp and Smith 2001; O’Halloran et al. 2013; Harpole et al. 2016). The general hypothesis is that an intermediate level of disturbance will produce the highest species diversity (Miller 1982). Sites 2 and 3, which experienced five fires, and light grazing in Site 2, have the highest overall species diversity of the sites, which supports the hypothesis. Site 4 which also experienced five fires had lower species richness, as did the very infrequently burnt Site 1. The influence of site substrate is also a fundamental attribute in determining species richness (Scott et al. 2012; Lebbink et al. 2018). Site 1A, which experienced the highest level of disturbance mainly as grazing, had the lowest species richness and the highest non-native species contribution.
The situation in the tropical savannas is further complicated by the competition between the woody plants and the herbaceous community. The influence of fire on the woody plant-herbaceous plant balance has been the subject of multiple studies with the ‘fire trap’ hypothesis suggesting that regular fires inhibit woody tree recruitment (Bond et al. 2003, 2012), and the lack of fire leading to woody thickening and loss of ground layer species (Fensham 1990; Russell-Smith et al. 2003a; Williams and Centurino 2007). As found in other northern Australian studies, there is a complex relationship of bottom up environmental factors e.g. edaphic conditions and vegetation structure, and top down processes such as fire that interact to influence the ground layer composition (Scott et al. 2009; Williams et al. 2017).
In this study the species composition and cover of the dominant perennial grasses, primarily T. triandra and less dominant H. triticeus and other perennial grasses, is very stable over the 23-year study period and over the five sites. Four of these sites experienced 3–5 fires with intervals ranging from 1 to 10 years, whereas Site 1 experienced only 1 fire. This study documents stable savanna ground layers under regular burning (3–5-year intervals), however it does not show a decline in cover or species composition in the T. triandra dominated grassland that was only burnt once and not grazed in 23 years. Williams et al. (2003) found a significant decline in the dominant perennial H. triticeus without fire for 3 years at Cape Cleveland. In our study H. triticeus was consistently present at subdominant cover levels (2–10% of ground cover) in all sites across the 23 years, seemingly completely independent of the fire regime or lack of fire.
There were clear short-term effects of fire on the ground layer in this study, including appearance of ephemeral species in the samplings immediately after fires (Fig. S3), supporting the findings of Williams et al. (2003) who found that the abundance of several common species, including graminoids, ephemeral forbs and twining perennial forbs increased immediately after fire in north-eastern Australian savannas. However, there was no discernable longer-term effect of fires, or lack thereof, on the ground cover or species richness of the ground layer in this study. Similarly, over a 5-year period in open savanna forest in Kaplaga in the Northern Territory (Andersen et al. 2005), there were no detectable effect of fire on floristic composition of the grass layer. The short-term increase in ephemeral species and perennial forbs after fire is usually attributed to the reduction in perennial grasses in semi-arid (Kutt and Woinarski 2007; Cowley et al. 2014; Fensham et al. 2015; Lebbink et al. 2018) and tropical vegetation (Williams et al. 2003; Andersen et al. 2005) in Queensland and the Northern Territory. The contribution of annual and ephemeral species in this study was low for all sites both in terms of cover and species richness. The effect of potentially more frequent and intense fires under more variable and extreme climate predicted for the region (Moise et al. 2015) will need to be studied, and continuing this long-term study will contribute to that research.
Grazing effects on the ground layer
Although grazing had visible effects on understorey biomass it had little effect on species composition or total ground cover in these savannas, comparing sites within the same rainfall areas. This is consistent with Fensham et al. (2005) who found that fire and grazing effects had insignificant long-term influences on both overstorey and understorey woody cover in semi-arid central Queensland forests. Themeda triandra, H. triticeus and A. semialata are considered to be palatable pasture species and are selectively grazed by cattle throughout the year (Crowley and Garnett 2001; Snyman et al. 2013; Dunning et al. 2017) but are consistently present in all the study sites indicating a low intensity grazing regime.
In this study, the paired Sites 1 (not grazed by cattle) and 1A (regularly grazed) offer an opportunity to examine the influence of fire and grazing quite directly, as the environmental conditions vary far less between the pair than they do between the other sites. Kemp and Kutt (2020) found the response after 10 years of removal of domestic stock from Brooklyn station, 15 km north of Sites 1 and 1A, varied with the land types, which included depositional (RE9.5.9b), metamorphic and granitic land zones. At Brooklyn there was as expected an increase in some palatable species and native herbaceous species overall, but also an increase in the number of non-native species, particularly the introduced pasture legume S. scabra. The paired sites (1 and 1A) had the lowest overall species richness (29.1 and 26.4) of the five sites. The grazed and more frequently burnt Site 1A had a lower ground cover, lower species richness and a higher contribution from non-native species. The lower and more variable ground cover is an expected result of grazing impact through the physical removal of biomass, and this disturbance also creates opportunities for establishment of non-native species. A high presence of non-native species and grazing may also reduce native species richness through competition and preferential grazing. However both of these sites had the lowest proportion of annual species (6.2% at 1) and interestingly the additional disturbances at Site 1A only raised the annual species richness to 6.4% of the total. So results here do not support a requirement for fire or disturbance to maintain T. triandra which still dominated Site 1 in June 2020.
The importance of site replication
Knowledge of temporal variability in community composition is undoubtedly useful in development of hypotheses relevant to theory, which might be tested through experiments. But it is also vitally important to be pragmatic regarding the important issue of sampling design for survey and assessment of savanna ecosystems, for example, by revealing the relative value of a single sampling in describing the ground layer community of tropical savannas (in terms of percentage floristic diversity capture). Approximately one-third of the species recorded at each site over the length of the study was recorded at the first survey. The timing of vegetation sampling in highly seasonal environments is also one of the critical factors in determining the proportion of the flora captured in a single sampling (Neldner et al. 2004). Observations of short-lived annual or short growing season perennial plants are generally the most affected by timing of sampling (Garrard et al. 2008), whereas perennial woody plants are generally detectable at any time of the year. For most survey and assessment activities, a sample site is visited only once, and this may not necessarily be in good seasonal conditions. In the long-term study reported here, sampling occurred at the end of the wet season, which has been shown to be the optimal time to obtain species presence and maximum ground cover (Neldner et al. 2004). Only 6–12% of the ground layer species found to occur at the site were recorded during every sampling event. Some plants have detection probabilities of less than one and can remain undetected at a site although present (Garrard et al. 2008) or may be in a life stage that is cryptic, e.g. terrestrial orchids (Kéry and Gregg 2003). For example, Corybas barbarae is a terrestrial orchid that has been observed above the surface on only five occasions over the 23 years of sampling at Site 4.
Nevertheless, for all sites (except Site 2 at 52%), more than 60% of the ground layer species observed in any given sample, were recorded in more than half of all samples of the site, and 100% of the dominant perennial grass species were recorded at every sampling. Still, there remains the need for several sites in the same vegetation type to be sampled, or the same site to be repeatedly sampled over time, to fully capture the diversity of a vegetation type. Conversely, if the ecological question is primarily about environmental gradients and sites are not spatially aggregated then a single survey may be adequate, as suggested by Schultz et al. (2014). Repeated site sampling is rarely practical for surveys, and often such assessments must be completed over short time periods, frequently less than 1 year, e.g. Environmental Impact Assessments. Thus, the requirement to replicate samplings spatially in the same vegetation type is generally accepted as necessary for comprehensive vegetation surveys, e.g. Neldner et al. (2020). Perhaps most importantly, not finding species in a single sampling event does not demonstrate that it will not occur there.
Conclusions
The ground layer of these north-eastern Queensland tropical savanna eucalypt communities appear to be very stable over decades, despite many species being infrequently recorded at any given site. The ground layers appear resilient to variations in yearly rainfall, and the effects of sporadic fires, light grazing and the presence of non-native plants. The cover and composition of the herbaceous ground layer is consistently dominated by the core perennial grasses T. triandra and H. triticeus, with many species of facultative seeders (annuals – satellite species) collectively contributing minimally to the overall cover but significantly to richness. In total, 60% of the subdominant herbaceous plant were perennial and although not always apparent at the time of any particular sampling event, are assumed to have persisted as underground storage structures.
The rainfall variability year to year did not have a significant effect on ground layer cover or species richness. There were up to five fires and periods of light grazing by domestic stock at the sites, but these disturbances did not appear to have a significant effect on the ground layer total cover nor on number of species. The number of non-native plant species in the ground layer was low (<7% of species for three sites, and no more than 17% at the most disturbed site), with the stable native ground layer largely resisting invasion from adjacent disturbed areas. Repeat samplings over time, and additional samplings in space, are required to capture the full floristic variation that can occur within these communities.
Conflicts of interest
The authors declare that they have no conflicts of interest.
Declaration of funding
This research did not receive any specific funding. Queensland Herbarium management facilitated field work and provided staff resources to conduct the research.
Acknowledgements
We thank Eda Addicott, Peter Bannink, John Clarkson, Wayne Harris, Mark Newton, Damian Milne, Ceri Pearce, John Thompson and Gary Wilson who assisted with the field data collection; Rosemary Niehus for preparing the map in Fig. S1. We also thank Rod Fensham, Gordon Guymer and anonymous reviewers for constructive comments on the paper.
References
Accad A, Neldner VJ, Kelley JAR, Li J, Richter D (2019) Remnant regional ecosystem vegetation in Queensland, analysis 1997–2017. (Queensland Department of Environment and Science: Brisbane, Qld, Australia) Available at https://www.qld.gov.au/environment/plants-animals/plants/ecosystems/remnant-vegetation/ [Verified 5 February 2021]Allan G, Dyer R, Johnson A, Russell-Smith J, Yates C (2001) Monitoring fire regimes. In ‘Savanna Burn. Understanding and using fire Northern Australia’. (Eds R Dyer, P Jacklyn, I Partridge, J Russell-Smith, D Williams) pp. 102–121. (Tropical Savannas CRC: Darwin, NT, Australia)
Andersen AN, Cook GD, Williams RJ (Eds) (2003) ‘Fire in Tropical Savannas: The Kapalga Experiment.’ (Springer-Verlag: New York, NY, USA)
Andersen AN, Cook GD, Corbett LK, Douglas MM, Eager RW, Russell-Smith J, Setterfield SA, Williams RJ, Woinarski JCZ (2005) Fire frequency and biodiversity conservation in Australian tropical savannas: implications from the Kapalga experiment. Austral Ecology 30, 155–167.
| Fire frequency and biodiversity conservation in Australian tropical savannas: implications from the Kapalga experiment.Crossref | GoogleScholarGoogle Scholar |
Anderson TM (2008) Plant compositional change over time increases with rainfall in Serengeti grasslands. Oikos 117, 675–682.
| Plant compositional change over time increases with rainfall in Serengeti grasslands.Crossref | GoogleScholarGoogle Scholar |
Archibald S, Bond WJ, Hoffmann W, Lehmann C, Staver C, Stevens N (2020) Distribution and determinants of savannas. In ‘Savanna Woody Plants and Large Herbivores’. (Eds PF Scogings, M Sankaran) pp. 3–24. (Wiley)
Bai Y, Han X, Wu J, Chen Z, Li L (2004) Ecosystem stability and compensatory effects in the Inner Mongolia grassland. Nature 431, 181–184.
| Ecosystem stability and compensatory effects in the Inner Mongolia grassland.Crossref | GoogleScholarGoogle Scholar | 15356630PubMed |
Baker PJ, Bunyavejchewin S (2006) Suppression, release and canopy recruitment in five tree species from a seasonal tropical forest in western Thailand. Journal of Tropical Ecology 22, 521–529.
| Suppression, release and canopy recruitment in five tree species from a seasonal tropical forest in western Thailand.Crossref | GoogleScholarGoogle Scholar |
Belsky AJ (1985) Long-term vegetation monitoring in the Serengeti National Park, Tanzania. Journal of Applied Ecology 22, 449–460.
| Long-term vegetation monitoring in the Serengeti National Park, Tanzania.Crossref | GoogleScholarGoogle Scholar |
Benson D, Picone D (2009) Monitoring vegetation change over 30 years: lessons from an urban bushland reserve in Sydney. Cunninghamia 11, 195–202.
Bond WJ, Midgley JJ (2001) Ecology of sprouting in woody plants: The persistence niche. Trends in Ecology & Evolution 16, 45–51.
| Ecology of sprouting in woody plants: The persistence niche.Crossref | GoogleScholarGoogle Scholar |
Bond WJ, Van Wilgen BW (1996) ‘Fire and Plants. Population and Community Biology Series.’ (Chapman and Hall: London, UK)
Bond WJ, Midgley GF, Woodward FI (2003) What controls South African vegetation – climate or fire? South African Journal of Botany 69, 79–91.
| What controls South African vegetation – climate or fire?Crossref | GoogleScholarGoogle Scholar |
Bond WJ, Cook GD, Williams RJ (2012) Which trees dominate in savannas? The escape hypothesis and eucalypts in northern Australia. Austral Ecology 37, 678–685.
| Which trees dominate in savannas? The escape hypothesis and eucalypts in northern Australia.Crossref | GoogleScholarGoogle Scholar |
Bowman DMJS, Panton WJ (1995) Munmarlary revisited: Response of a north Australian Eucalyptus tetrodonta savanna protected from fire for 20 years. Australian Journal of Ecology 20, 526–531.
| Munmarlary revisited: Response of a north Australian Eucalyptus tetrodonta savanna protected from fire for 20 years.Crossref | GoogleScholarGoogle Scholar |
Bowman DMJS, Wilson BA, Hooper RJ (1988) Response of Eucalyptus forest and woodland to four fire regimes at Munmarlary, Northern Territory. Journal of Ecology 76, 215–232.
| Response of Eucalyptus forest and woodland to four fire regimes at Munmarlary, Northern Territory.Crossref | GoogleScholarGoogle Scholar |
Brown GK, Bostock PD (2019) Introduction to the Census of the Queensland flora 2019. (Queensland Department of Environment and Science: Brisbane, Qld, Australia) Available at https://www.data.qld.gov.au/dataset/census-of-the-queensland-flora-2019 [Verified 15 February 2021]
Burrows GE (2004) The importance of seasonality in the timing of flora surveys in the South and Central Western Slopes of New South Wales. Cunninghamia 8, 514–520.
Cowley RA, Hearnden MN, Joyce KE, Tovar-Valencia M, Cowley TM, Pettit CL, Dyer RM (2014) How hot? How often? Getting the fire frequency and timing right for optimal management of woody cover and pasture composition in northern Australian grazed tropical savannas. Kidman Springs Fire Experiment 1993–2013. The Rangeland Journal 36, 323–345.
| How hot? How often? Getting the fire frequency and timing right for optimal management of woody cover and pasture composition in northern Australian grazed tropical savannas. Kidman Springs Fire Experiment 1993–2013.Crossref | GoogleScholarGoogle Scholar |
Crowley GM, Garnett ST (2001) Growth, seed production and effect of defoliation in an early flowering perennial grass, Alloteropsis semialata (Poaceae), on Cape York Peninsula, Australia. Australian Journal of Botany 49, 735–743.
| Growth, seed production and effect of defoliation in an early flowering perennial grass, Alloteropsis semialata (Poaceae), on Cape York Peninsula, Australia.Crossref | GoogleScholarGoogle Scholar |
Danckwerts JE (1993) Reserve carbon and photosynthesis: Their role in regrowth of Themeda triandra, a widely distributed subtropical Graminaceous species. Functional Ecology 7, 634–641.
| Reserve carbon and photosynthesis: Their role in regrowth of Themeda triandra, a widely distributed subtropical Graminaceous species.Crossref | GoogleScholarGoogle Scholar |
Day NJ, Buckley HL (2013) Twenty-five years of plant community dynamics and invasion in New Zealand tussock grasslands. Austral Ecology 38, 688–699.
| Twenty-five years of plant community dynamics and invasion in New Zealand tussock grasslands.Crossref | GoogleScholarGoogle Scholar |
Dunning LT, Liabot A-L, Olofsson JK, Smith EK, Vorontsova MS, Besnard G, Simpson KJ, Lundgren MR, Addicott E, Gallagher RV, Chu Y, Pennington RT, Christin P-A, Lehmann CER (2017) The recent and rapid spread of Themeda triandra. Botany Letters 164, 327–337.
| The recent and rapid spread of Themeda triandra.Crossref | GoogleScholarGoogle Scholar |
Dyer R, Jacklyn P, Partridge I, Russell-Smith J, Williams RJ (Eds) (2001) ‘Savanna Burning: Understanding and Using Fire in Northern Australia.’ (Tropical Savannas Cooperative Research Centre: Darwin, NT, Australia)
Fensham RJ (1990) Interactive effects of fire frequency and site factors in tropical Eucalyptus forest. Australian Journal of Ecology 15, 255–266.
| Interactive effects of fire frequency and site factors in tropical Eucalyptus forest.Crossref | GoogleScholarGoogle Scholar |
Fensham RJ, Fairfax RJ, Archer S (2005) Rainfall, land-use and woody vegetation cover change in semi-arid Australian savanna. Journal of Ecology 93, 596–606.
| Rainfall, land-use and woody vegetation cover change in semi-arid Australian savanna.Crossref | GoogleScholarGoogle Scholar |
Fensham RJ, Wang J, Kilgour C (2015) The relative impacts of grazing, fire and invasion by buffel grass (Cenchrus ciliaris) on the floristic composition of a rangeland savanna ecosystem. The Rangeland Journal 37, 227–237.
| The relative impacts of grazing, fire and invasion by buffel grass (Cenchrus ciliaris) on the floristic composition of a rangeland savanna ecosystem.Crossref | GoogleScholarGoogle Scholar |
Fox ID, Neldner VJ, Wilson GW, Bannink PJ (2001) ‘The Vegetation of the Australian Tropical Savannas.’ (Environmental Protection Agency: Brisbane, Qld, Australia)
Freeman ME, Vesk PA, Murphy BP, Cook GD, Richards AE, Williams RJ (2017) Defining the fire trap: Extension of the persistence equilibrium model in mesic savannas. Austral Ecology 42, 890–899.
| Defining the fire trap: Extension of the persistence equilibrium model in mesic savannas.Crossref | GoogleScholarGoogle Scholar |
Garrard GE, Bekessy SA, McCarthy MA, Wintle BA (2008) When have we looked hard enough? A novel method for setting minimum survey effort protocols for flora surveys. Austral Ecology 33, 986–998.
| When have we looked hard enough? A novel method for setting minimum survey effort protocols for flora surveys.Crossref | GoogleScholarGoogle Scholar |
Glenn SM, Collins SL (1990) Patch structure in tallgrass prairies: dynamics of satellite species. Oikos 57, 229–236.
| Patch structure in tallgrass prairies: dynamics of satellite species.Crossref | GoogleScholarGoogle Scholar |
Grace JB (1999) The factors controlling species density in herbaceous plant communities: an assessment. Perspectives in Plant Ecology, Evolution and Systematics 2, 1–28.
| The factors controlling species density in herbaceous plant communities: an assessment.Crossref | GoogleScholarGoogle Scholar |
Grime JP (1973) Competitive exclusion in herbaceous vegetation. Nature 242, 344–347.
| Competitive exclusion in herbaceous vegetation.Crossref | GoogleScholarGoogle Scholar |
Harpole WS, Sullivan LL, Lind EM, Firn J, Adler PB, Borer ET, Chase J, Fay PA, Hautier Y, Hillebrand H, MacDougall AS, Seabloom EW, Williams R, Bakker JD, Cadotte MW, Chaneton EJ, Chu C, Cleland EE, D’Antonio C, Davies KF, Gruner DS, Hagenah N, Kirkman K, Knops JMH, La Pierre KJ, McCulley RL, Moore JL, Morgan JW, Prober SM, Risch AC, Schuetz M, Stevens CJ, Wragg PD (2016) Addition of multiple limiting resources reduces grassland diversity. Nature 537, 93–96.
| Addition of multiple limiting resources reduces grassland diversity.Crossref | GoogleScholarGoogle Scholar | 27556951PubMed |
Hirota M, Holmgren M, Van Nes EH, Scheffer M (2011) Global resilience of tropical forest and savanna to critical transitions. Science 334, 232–235.
| Global resilience of tropical forest and savanna to critical transitions.Crossref | GoogleScholarGoogle Scholar | 21998390PubMed |
Hobbs RJ, Mooney HA (1995) Spatial and temporal variability in California annual grassland: results from a long‐term study. Journal of Vegetation Science 6, 43–56.
| Spatial and temporal variability in California annual grassland: results from a long‐term study.Crossref | GoogleScholarGoogle Scholar |
Intergovernmental Committee on Surveying and Mapping (2014) Geocentric datum of Australia technical manual. Version 2.4. (Commonwealth of Australia) available at https://www.icsm.gov.au/sites/default/files/2017-09/gda-v_2.4_0.pdf [Verified 5 February 2021]
Ives AR, Dennis B, Cottingham KL, Carpenter SR (2003) Estimating community stability and ecological interactions from time‐series data. Ecological Monographs 73, 301–330.
| Estimating community stability and ecological interactions from time‐series data.Crossref | GoogleScholarGoogle Scholar |
Kemp JE, Kutt AS (2020) Vegetation change 10 years after cattle removal in a savanna landscape. The Rangeland Journal 42, 73–84.
| Vegetation change 10 years after cattle removal in a savanna landscape.Crossref | GoogleScholarGoogle Scholar |
Kéry M, Gregg KB (2003) Effects of life‐state on detectability in a demographic study of the terrestrial orchid Cleistes bifaria. Journal of Ecology 91, 265–273.
| Effects of life‐state on detectability in a demographic study of the terrestrial orchid Cleistes bifaria.Crossref | GoogleScholarGoogle Scholar |
Klimesŏvá J, Klimes L (2007) Bud banks and their role in vegetative regeneration – a literature review and proposal for simple classification and assessment. Perspectives in Plant Ecology, Evolution and Systematics 8, 115–129.
| Bud banks and their role in vegetative regeneration – a literature review and proposal for simple classification and assessment.Crossref | GoogleScholarGoogle Scholar |
Knapp AK, Smith MD (2001) Variation among biomes in temporal dynamics of aboveground primary production. Science 291, 481–484.
| Variation among biomes in temporal dynamics of aboveground primary production.Crossref | GoogleScholarGoogle Scholar | 11161201PubMed |
Kutt AS, Woinarski JCZ (2007) The effects of grazing and fire on vegetation and the vertebrate assemblage in a tropical savanna woodland in north-eastern Australia. Journal of Tropical Ecology 23, 95–106.
| The effects of grazing and fire on vegetation and the vertebrate assemblage in a tropical savanna woodland in north-eastern Australia.Crossref | GoogleScholarGoogle Scholar |
Laidlaw M (2013) Praxelis (Praxelis clematidea) – 20 years down the track. Weed Spotters Network Queensland Bulletin 2, 1–2.
Lebbink G, Fensham R, Cowley R (2018) Vegetation responses to fire history and soil properties in grazed semi-arid tropical savanna. The Rangeland Journal 40, 271–285.
| Vegetation responses to fire history and soil properties in grazed semi-arid tropical savanna.Crossref | GoogleScholarGoogle Scholar |
Lehmann CER, Prior LD, Bowman DMJS (2009) Decadal dynamics of tree cover in an Australian tropical Savanna. Austral Ecology 34, 601–612.
| Decadal dynamics of tree cover in an Australian tropical Savanna.Crossref | GoogleScholarGoogle Scholar |
Lehmann CER, Archibald SA, Hoffmann WA, Bond WJ (2011) Deciphering the distribution of the savanna biome. New Phytologist 191, 197–209.
| Deciphering the distribution of the savanna biome.Crossref | GoogleScholarGoogle Scholar |
Lehmann CER, Felfili J, Hutley LB, Ratnam J, San Jose J, Montes R, Franklin D, Russell-Smith J, Ryan CM, Durigan G, Hiernaux P, Anderson TM, Haidar R, Bowman DMJS, Bond WJ, Sankaran M, Higgins SI, Archibald S, Hoffmann WA, Hanan NP, Williams RJ, Fensham RJ (2014) Savanna vegetation-fire-climate relationships differ among continents. Science 343, 548–552.
| Savanna vegetation-fire-climate relationships differ among continents.Crossref | GoogleScholarGoogle Scholar |
Lunt ID (1997) Effects of long-term vegetation management on remnant grassy forests and anthropogenic native grasslands in south-eastern Australia. Biological Conservation 81, 287–297.
| Effects of long-term vegetation management on remnant grassy forests and anthropogenic native grasslands in south-eastern Australia.Crossref | GoogleScholarGoogle Scholar |
Lunt ID, Morgan JW (2002) Grasslands of southern Australia. In ‘Flammable Australia: the fire Regimes and Biodiversity of a Continent’. (Eds RJ Williams, AM Gill, RA Bradstock) pp. 177–196. (CSIRO Publishing: Melbourne, Vic., Australia)
Magurran AE, Henderson PA (2003) Explaining the excess of rare species in natural species abundance distributions. Nature 422, 714–716.
| Explaining the excess of rare species in natural species abundance distributions.Crossref | GoogleScholarGoogle Scholar | 12700760PubMed |
Meffin R, Miller AL, Hulme PE, Duncan RP (2010) Experimental introduction of the alien plant Hieracium lepidulum reveals no significant impact on montane plant communities in New Zealand. Diversity & Distributions 16, 804–815.
| Experimental introduction of the alien plant Hieracium lepidulum reveals no significant impact on montane plant communities in New Zealand.Crossref | GoogleScholarGoogle Scholar |
Midgley JJ, Lawes MJ, Chamaillé-Jammes S (2010) Savanna woody plant dynamics: the role of fire and herbivory, separately and synergistically. Australian Journal of Botany 58, 1–11.
| Savanna woody plant dynamics: the role of fire and herbivory, separately and synergistically.Crossref | GoogleScholarGoogle Scholar |
Miller TE (1982) Community diversity and interactions between the size and frequency of disturbance. American Naturalist 120, 533–536.
| Community diversity and interactions between the size and frequency of disturbance.Crossref | GoogleScholarGoogle Scholar |
Moise A, Abbs D, Bhend J, Chiew F, Church H, Ekström M, Kirono D, Lenton A, Lucas C, McInnes K, Monselesan D, Mpelasoka F, Webb L, Whetton P (2015) Monsoonal North cluster report. In ‘Climate Change in Australia Projections for Australia’s Natural Resource Management Regions: Cluster Reports’. (Eds M Ekström, P Whetton, C Gerbring, M Grose, L Webb, J Risbey) pp. 1–51. (CSIRO and Bureau of Meteorology: Australia.)
Morgan JW, Lunt ID (1999) Effects of time-since-fire on the tussock dynamics of a dominant grass (Themeda triandra) in a temperate Australian grassland. Biological Conservation 88, 379–386.
| Effects of time-since-fire on the tussock dynamics of a dominant grass (Themeda triandra) in a temperate Australian grassland.Crossref | GoogleScholarGoogle Scholar |
Murphy SR, Lodge GM (2002) Ground cover in temperate native perennial grass pastures1.Comparison of four estimation methods. The Rangeland Journal 24, 288–300.
| Ground cover in temperate native perennial grass pastures1.Comparison of four estimation methods.Crossref | GoogleScholarGoogle Scholar |
Neldner VJ, Kirkwood AB, Collyer BS (2004) Optimum time for sampling floristic diversity in tropical eucalypt woodlands of northern Queensland. The Rangeland Journal 26, 190–203.
| Optimum time for sampling floristic diversity in tropical eucalypt woodlands of northern Queensland.Crossref | GoogleScholarGoogle Scholar |
Neldner VJ, Wilson BA, Dillewaard HA, Ryan TS, Butler DW, McDonald WJF, Addicott E, Appelman CN (2020) Methodology for survey and mapping of regional ecosystems and vegetation communities in Queensland. Version 5.1. Available at https://publications.qld.gov.au/dataset/redd/resource/6dee78ab-c12c-4692-9842-b7257c2511e4 [Verified 1 February 2021]
O’Halloran LR, Borer ET, Seabloom EW, MacDougall AS, Cleland EE, McCulley RL, Hobbie S, Harpole WS, DeCrappeo NM, Chu C, Bakker JD, Davies KF, Du G, Firn J, Hagenah N, Hofmockel KS, Knops JMH, Li W, Melbourne BA, Morgan JW, Orrock JL, Prober SM, Stevens CJ (2013) Regional contingencies in the relationship between aboveground biomass and litter in the world’s grasslands. PLoS One 8, e54988
| Regional contingencies in the relationship between aboveground biomass and litter in the world’s grasslands.Crossref | GoogleScholarGoogle Scholar | 23405103PubMed |
Pärtel M (2014) Community ecology of absent species: hidden and dark diversity. Journal of Vegetation Science 25, 1154–1159.
| Community ecology of absent species: hidden and dark diversity.Crossref | GoogleScholarGoogle Scholar |
Pärtel M, Moora M, Zobel M (2001) Variation in species richness within and between calcareous (alvar) grassland stands: the role of core and satellite species. Plant Ecology 157, 205–213.
| Variation in species richness within and between calcareous (alvar) grassland stands: the role of core and satellite species.Crossref | GoogleScholarGoogle Scholar |
Pate JS, Dixon KW (1982) ‘Tuberous, Cormous and Bulbous Plants : Biology of an Adaptive Strategy in Western Australia.’ (University of Western Australia Press: Perth, WA, Australia)
Preston FW (1960) Time and space and the variation of species. Ecology 41, 611–627.
| Time and space and the variation of species.Crossref | GoogleScholarGoogle Scholar |
Price JN, Good MK, Schulz NL, Guja LK, Morgan JW (2019) Multivariate drivers of diversity in temperate Australian grasslands. Australian Journal of Botany 67, 367–380.
| Multivariate drivers of diversity in temperate Australian grasslands.Crossref | GoogleScholarGoogle Scholar |
Prober SM, Lunt ID (2009) Restoration of Themeda australis swards suppresses soil nitrate and enhances ecological resistance to invasion by exotic annuals. Biological Invasions 11, 171–181.
| Restoration of Themeda australis swards suppresses soil nitrate and enhances ecological resistance to invasion by exotic annuals.Crossref | GoogleScholarGoogle Scholar |
Queensland Herbarium (2019) Regional Ecosystem Description Database (REDD). Version 11.1 (April 2019). Available at https://www.qld.gov.au/environment/plants-animals/plants/ecosystems/descriptions/download [Verified 1 February 2021]
Rice B, Westoby M (1983) Plant species richness at the 01 hectare scale in Australian vegetation compared to other continents. Vegetatio 52, 129–140.
| Plant species richness at the 01 hectare scale in Australian vegetation compared to other continents.Crossref | GoogleScholarGoogle Scholar |
Rossiter-Rachor NA, Setterfield SA, Douglas MM, Hutley LB, Cook GD, Schmidt S (2009) Invasive Andropogon gayanus (gamba grass) is an ecosystem transformer of nitrogen relations in Australian savanna. Ecological Applications 19, 1546–1560.
| Invasive Andropogon gayanus (gamba grass) is an ecosystem transformer of nitrogen relations in Australian savanna.Crossref | GoogleScholarGoogle Scholar | 19769102PubMed |
Russell-Smith J, Whitehead PJ, Cook GD, Hoare JL (2003a) Response of Eucalyptus-dominated savanna to frequent fires: Lessons from Munmarlary, 1973–1996. Ecological Monographs 73, 349–375.
| Response of Eucalyptus-dominated savanna to frequent fires: Lessons from Munmarlary, 1973–1996.Crossref | GoogleScholarGoogle Scholar |
Russell-Smith J, Whitehead PJ, Williams RJ, Flannigan M (2003b) Fire and savanna landscapes in northern Australia – regional lessons and global challenges. International Journal of Wildland Fire 12, v–ix.
| Fire and savanna landscapes in northern Australia – regional lessons and global challenges.Crossref | GoogleScholarGoogle Scholar |
Sankaran M, Hanan NP, Scholes RJ, Ratnam J, Augustine DJ, Cade BS, Gignoux J, Higgins SI, Le Roux X, Ludwig F, Ardo J, Banyikwa F, Bronn J, Bucini G, Caylor KK, Coughenour MB, Diouf A, Ekaya W, Ferai CJ, February EC, Frost PGA, Hiernaux P, Hrabar H, Metzger KL, Prins HHT, Ringrose S, Sea W, Tews J, Worden J, Zambatis N (2005) Determinants of woody cover in African savannas. Nature 438, 846–849.
| Determinants of woody cover in African savannas.Crossref | GoogleScholarGoogle Scholar | 16341012PubMed |
Scholes RJ, Archer SR (1997) Tree-grass interactions in savannas. Annual Review of Ecology and Systematics 28, 517–544.
| Tree-grass interactions in savannas.Crossref | GoogleScholarGoogle Scholar |
Schultz NL, Reid N, Lodge G, Hunter JT (2014) Seasonal and interannual variation in vegetation composition: Implications for survey design and data interpretation. Austral Ecology 39, 755–766.
| Seasonal and interannual variation in vegetation composition: Implications for survey design and data interpretation.Crossref | GoogleScholarGoogle Scholar |
Scott KA, Setterfield SA, Andersen AN, Douglas MM (2009) Correlates of grass-species composition in a savanna woodland in northern Australia. Australian Journal of Botany 57, 10–17.
| Correlates of grass-species composition in a savanna woodland in northern Australia.Crossref | GoogleScholarGoogle Scholar |
Scott KA, Setterfield SA, Douglas MM, Parr CL, Schatz J, Andersen AN (2012) Does long‐term fire exclusion in an Australian tropical savanna result in a biome shift? A test using the reintroduction of fire. Austral Ecology 37, 693–711.
| Does long‐term fire exclusion in an Australian tropical savanna result in a biome shift? A test using the reintroduction of fire.Crossref | GoogleScholarGoogle Scholar |
Setterfield SA, Rossiter-Rachor NA, Huntley LB, Douglas MM, Williams RJ (2010) Turning up the heat: the impacts of Andropogon gayanus (gamba grass) invasion on fire behaviour in northern Australian savannas. Diversity & Distributions 16, 854–861.
| Turning up the heat: the impacts of Andropogon gayanus (gamba grass) invasion on fire behaviour in northern Australian savannas.Crossref | GoogleScholarGoogle Scholar |
Snyman HA, Ingram LJ, Kirkman KP (2013) Themeda triandra: a keystone grass species. African Journal of Range & Forage Science 30, 99–125.
| Themeda triandra: a keystone grass species.Crossref | GoogleScholarGoogle Scholar |
Sparrow B (2017) Monitoring in the Australian Rangelands: Where we’ve come from and where we should be headed. In ‘Proceedings of the 19th Australian Rangeland Society Biennial Conference’, 25 to 29 September 2017, Port Augusta, SA, Australia. (Ed. MH Friedel) (Australian Rangelands Society: Adelaide, SA, Australia)
Taylor JA, Dunlop CR (1985) Plant communities of the wet-dry tropics of Australia: the Alligator Rivers region, Northern Territory. Proceedings of the Ecological Society of Australia 13, 83–127.
Ulrich W, Ollik M (2004) Frequent and occasional species and the shape of relative‐abundance distributions. Diversity & Distributions 10, 263–269.
| Frequent and occasional species and the shape of relative‐abundance distributions.Crossref | GoogleScholarGoogle Scholar |
van der Maarel E, Sykes MT (1993) Small-scale plant species turnover in a limestone grassland: the carousel model and some comments on the niche concept. Journal of Vegetation Science 4, 179–188.
| Small-scale plant species turnover in a limestone grassland: the carousel model and some comments on the niche concept.Crossref | GoogleScholarGoogle Scholar |
Vanha-Majamaa I, Salemaa M, Tuominen S, Mikkola K (2000) Digitized photographs in vegetation analysis - a comparison of cover estimates. Applied Vegetation Science 3, 89–94.
| Digitized photographs in vegetation analysis - a comparison of cover estimates.Crossref | GoogleScholarGoogle Scholar |
Werner PA, Prior LD (2013) Demography and growth of subadult savanna trees: interactions of life history, size, fire season, and grassy understory. Ecological Monographs 83, 67–93.
| Demography and growth of subadult savanna trees: interactions of life history, size, fire season, and grassy understory.Crossref | GoogleScholarGoogle Scholar |
Werner PA, Peacock SJ (2019) Savanna canopy trees under fire: long‐term persistence and transient dynamics from a stage‐based matrix population model. Ecosphere 10, e02706
| Savanna canopy trees under fire: long‐term persistence and transient dynamics from a stage‐based matrix population model.Crossref | GoogleScholarGoogle Scholar |
White EP, Adler PB, Lauenroth WK, Gill RA, Greenberg D, Kaufman DM, Rassweiler A, Rusak JA, Smith MD, Steinbeck JR, Waide RB, Yao J (2006) A comparison of the species/time relationship across ecosystems and taxonomic groups. Oikos 112, 185–195.
| A comparison of the species/time relationship across ecosystems and taxonomic groups.Crossref | GoogleScholarGoogle Scholar |
Williams P, Centurino P (2007) Vegetation dynamics, fuel loads and fire in an ‘of concern’ regional ecosystem on Magnetic Island National Park. A 25-year study: 1982 to 2007. Internal Department Report. (Queensland Parks and Wildlife Service) Available at http://ffec.com.au/wp-content/uploads/2018/09/Vegetation_dynamics_fuel_loads_and-_fire_2007.pdf
Williams PR, Congdon RA, Grice AC, Clarke PJ (2003) Effect of fire regime on plant abundance in a tropical eucalypt savanna of north‐eastern Australia. Austral Ecology 28, 327–338.
| Effect of fire regime on plant abundance in a tropical eucalypt savanna of north‐eastern Australia.Crossref | GoogleScholarGoogle Scholar |
Williams RJ, Cook GD, Gill AM, Moore PHR (1999) Fire regime, fire intensity and tree survival in a tropical savanna in northern Australia. Australian Journal of Ecology 24, 50–59.
| Fire regime, fire intensity and tree survival in a tropical savanna in northern Australia.Crossref | GoogleScholarGoogle Scholar |
Williams RJ, Cook GD, Liedloff AC, Bond WJ (2017) Australia’s tropical savannas: vast, ancient and rich landscapes. In ‘Australian Vegetation’. (Ed DA Keith) pp. 368–388. (Cambridge University Press: Cambridge, UK)