

More trees and fewer roads: the importance of local and landscape features for insectivorous bats in open urban green spaces
M. Callas A , L. F. Lumsden B , A. R. Rendall A and K. Yokochi A *
A
B
Abstract
Urbanisation poses new challenges for wildlife worldwide, and recent research suggests that urban parks, although highly modified, may act as important refuges. Insectivorous bats can persist in urban landscapes and play an important role in keeping insect populations in balance. Previous research on use of urban landscapes by these bats has often focused on patches of remnant bushland within cities, but their use of highly modified open spaces is not well understood.
We aimed to determine the use of open green spaces (e.g. open parks, sports ovals) by insectivorous bats in Melbourne, Australia and to identify landscape factors that influence their presence and activity level.
We conducted passive acoustic surveys at 35 sites across greater Melbourne. Once species were identified from the echolocation call data, we modelled species richness, total activity and activity of individual species against landscape and weather variables, using Generalised Linear Mixed Models and Generalised Additive Mixed Models.
Across 557 detector nights, we identified at least 11 of the 17 species recorded to occur in Melbourne. Both species richness and activity were greater in areas with more nearby trees and lesser in areas with more roads. There were weaker species-specific relationships between bat activity and both distance to the nearest water source and Normalised Difference Vegetation Index. Species richness and activity levels were lower on nights with a lower temperature at dusk, higher rainfall and stronger wind.
Our results show that multiple bat species consistently use Melbourne’s open green spaces, highlighting the potential habitat value of these areas, especially those surrounded by high tree densities and fewer roads.
Insectivorous bats play important roles within ecosystems and bring benefits to human society. To encourage the diversity and activity of insectivorous bats in urban landscapes, we recommend retaining and increasing indigenous vegetation surrounding open areas in urban parks, as well as more strategic planning of new urban parks that further increases tree density in cities.
Keywords: insectivorous bats, local councils, microbats, open green space, sports ovals, urban ecology, urban parks, urbanisation.
Introduction
The rate of urbanisation is increasing around the world, bringing with it a suite of challenges for wildlife. Australia is quickly becoming one of the world’s most urbanised countries; by 2050, it is projected that over 90% of Australians will live in an urban area (United Nations Department of Economic and Social Affairs Population Division (UNDESA) 2019). This increasingly urbanised landscape often incorporates patches of remnant vegetation that are highly modified and fragmented. Wildlife persisting in these landscapes often need to rely on highly modified parks and artificial green spaces for the resources they require. These areas are typically designed for human use rather than ecological functionality, but recent research is beginning to uncover previously unknown importance of these areas as refuges for biodiversity in our cities (Fernandez-Juricic and Jokimaki 1998; Lowry et al. 2013; Koh and Sodhi 2017). Although the factors enabling these species to survive in the urban environment are not fully understood, a wide variety of taxa, including some threatened species, have been observed utilising and even thriving in modified urban green spaces (e.g. Angold et al. 2006; Carbó-Ramírez and Zuria 2011; Van Helden et al. 2020).
Small, insectivorous bats (hereafter called ‘bats’) are one group of wildlife known to persist in urban landscapes worldwide. Australia is home to a diverse range of insectivorous bats, with 70 species across eight families (Armstrong et al. 2020). Seventeen of these species have been recorded in the greater Melbourne area (Australasian Bat Society 2021), making them the most diverse group of native mammals that inhabit the city. Due to their small size, large surface area and specialised mode of movement (flying), bats have high energy requirements, which they satisfy by consuming large quantities of insects. This makes them important ecosystem service providers keeping insect populations in balance, including many agricultural pest species (Suarez-Rubio et al. 2018); in the USA alone, the economic value of these services is estimated to be at least $3.7 billion USD per year (Boyles et al. 2011).
Urbanisation, including increased housing and road density, habitat fragmentation and noise and light pollution, has been linked by previous studies to decreased activity of bats in Australian cities (Threlfall et al. 2012; Bonsen et al. 2015; Caryl et al. 2016; Haddock et al. 2019a). The availability of water and watercourses is also important for bats because these features can act as corridors between patches of suitable habitat and support flying invertebrates, the main prey items of most species (Ober and Hayes 2008; Jones et al. 2009; Threlfall et al. 2012; Altringham and Kerth 2016; Straka et al. 2016). Riparian habitat along waterways also provides trees for roosting for many bat species (Gaisler et al. 1998; Threlfall et al. 2012). Vegetation structure can have species-specific impacts on bats, linked to differences in flight pattern and wing morphology between species. Fast-flying species with long, narrow wings, like white-striped free-tailed bat (Austronomus australis) are considered better adapted to open spaces, whereas slow-flying species with shorter, broader wings, such as the long-eared bats (Nyctophilus spp.), are more manoeuvrable and able to forage in dense vegetation (Norberg and Rayner 1987; Adams et al. 2009; Threlfall et al. 2011).
The impacts of landscape factors on bat activity have been widely explored, yet little research has considered whether these patterns are also applicable to open urban green spaces, including parks, sporting ovals and tennis courts. Existing literature on urban bats has largely focused on remnant vegetation patches, with little investigation of openness as a feature of urban parks (Basham et al. 2011; Caryl et al. 2016; Linley 2017; Haddock et al. 2019a; Moretto et al. 2019). Additionally, existing studies that have investigated bat activity in open areas have largely been conducted in rural–agricultural areas, which are much larger than the typical urban park or oval (Lumsden and Bennett 2005; Crisol-Martínez et al. 2017). Urban parks may have a low perceived conservation value, but these highly modified areas are often far more common features of the urban landscape than remnant bushland patches. It is therefore important that we understand the value of these areas to bat communities, to inform future urban park design and contribute to better management outcomes for these species.
Bats’ high energy requirements and insectivorous diet also mean that weather factors such as ambient temperature, rainfall, relative humidity and wind speed can influence their activity levels (e.g. Richards 1989; Scanlon and Petit 2008). For example, during colder months in southern Australia, bats enter torpor as ambient temperature and prey availability become low (Turbill 2008). Therefore, studies investigating activity patterns need to consider the potential influence of weather variables.
This study aims to investigate patterns of bat activity in open urban green spaces in greater Melbourne to determine the importance and suitability of these areas as habitat for bats. We specifically examine landscape factors that may influence activity patterns and species richness. The influence of prevailing weather conditions is also modelled to account for its possible confounding influence, with an expectation that the bat activity will be lower in colder, wetter and/or windier nights in general.
Materials and methods
Study area
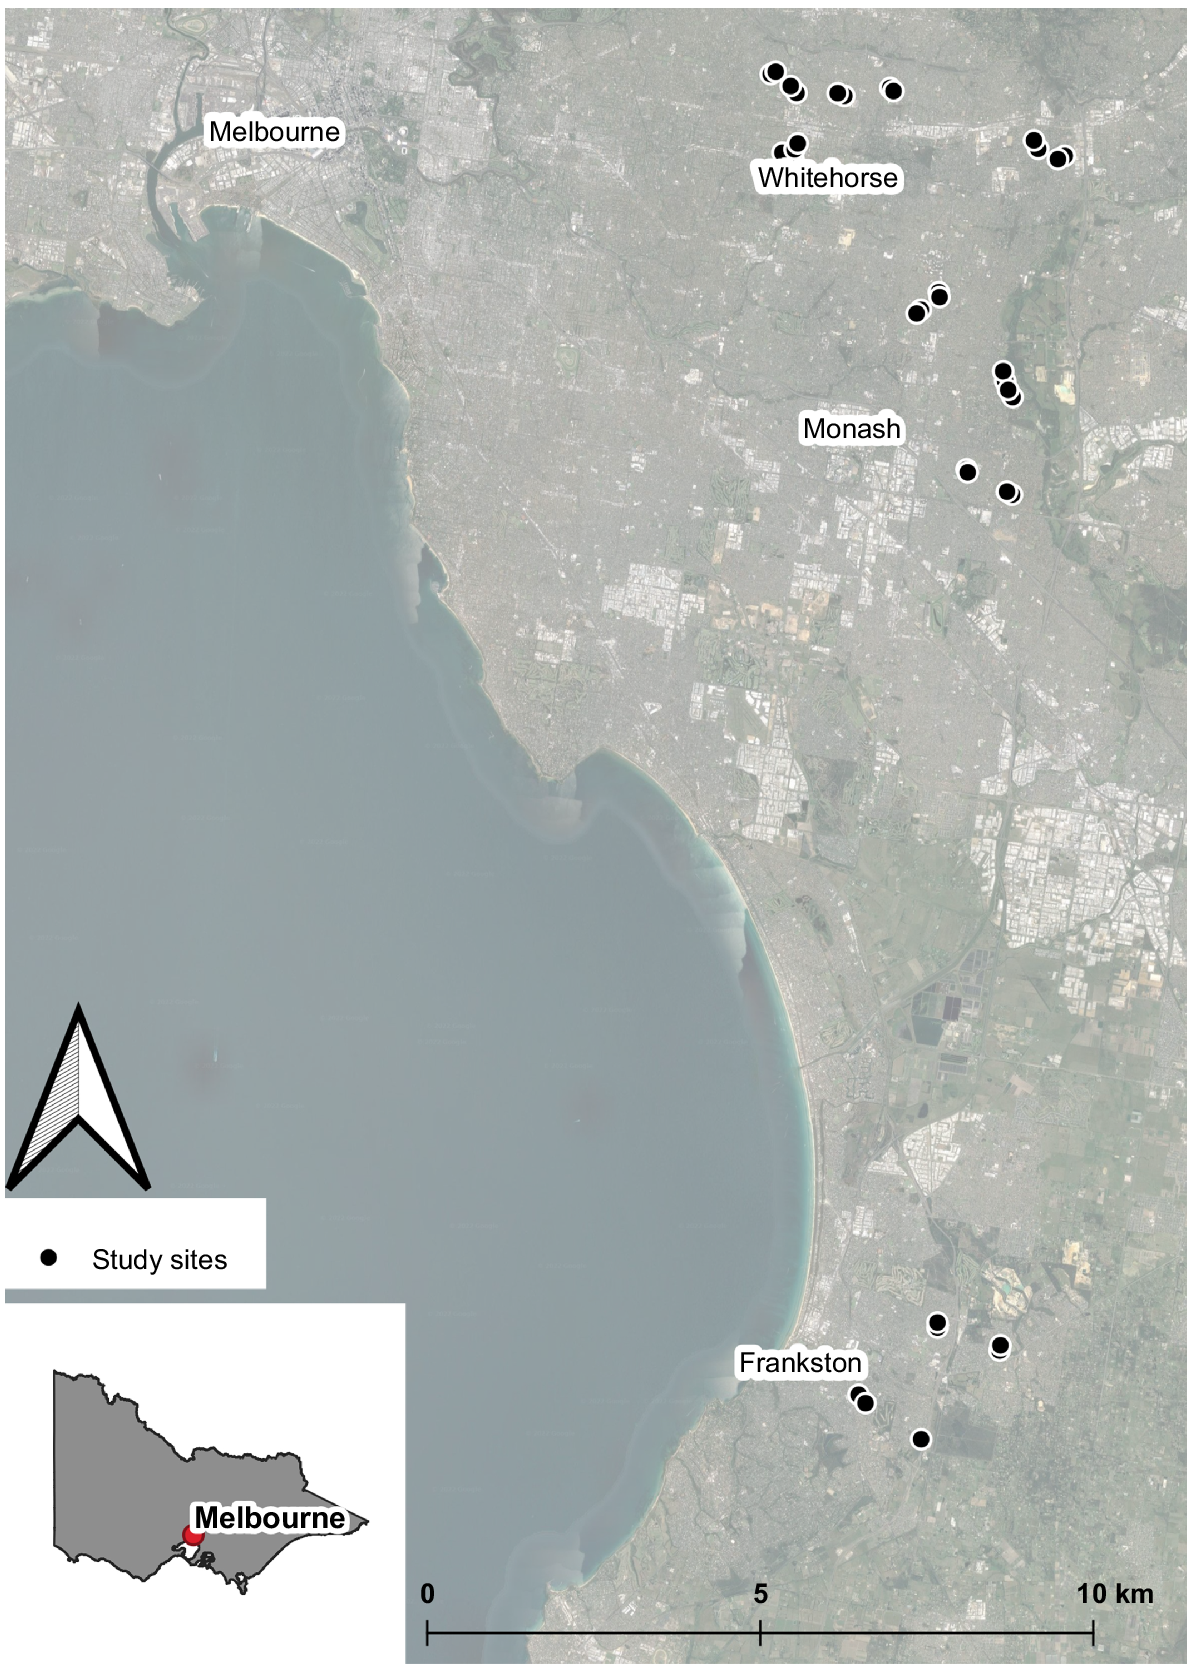
This study was conducted in the greater metropolitan area of Melbourne (37°48′50.4″S, 144°57′47.95″E), Victoria, Australia (Fig. 1). Melbourne is expected to become the most populous city in Australia in the 2030s, with the current estimated population of approximately five million people (Australian Bureau of Statistics (ABS) 2023). The area continues to experience one of the highest population growth rates of all Australian capital cities, at 1.1–2.3 percent per annum (Australian Bureau of Statistics (ABS) 2023). The area has a temperate oceanic climate, with warm to hot summers and mild winters, and a mean annual rainfall of 648.3 mm (Bureau of Meteorology 2020).
Experimental design
Sites were selected across three local government areas in Melbourne (City of Whitehorse, City of Monash and City of Frankston), with sites situated in either an open area within an urban park, or at an outdoor sporting venue with comparable size of areas with no tree cover (Supplementary Fig. S1). In total, we surveyed for bats at 36 locations within 18 urban parks and sporting venues across the study area, with the mean distance between sites of 221 m (range: 100–14,000 m). Sites were carefully selected so that there was no permanent light source nearby, and during our survey period, there was no temporary lighting used at the sporting venues.
Bat surveys
At each site we deployed an ultrasonic bat detector to record bat echolocation calls at night. Acoustic bat surveys were conducted between January and March 2020, with three deployments conducted sequentially. We selected this survey period because it sits in the middle of warmer months in Melbourne when the bats are most active, and their activity level is less likely to be impacted by seasonal behavioural changes within these months, compared with earlier or later parts in the warmer months (e.g. November or April). Each deployment consisted of eight Anabat SD2 detectors (Titley Scientific, Brendale, Australia) and four Anabat Swift detectors (Titley Scientific, Brendale, Australia), for a total of 12 detectors per deployment (n = 36). Detectors were secured within a nest-box to protect them from severe weather and possible theft. The microphones were set to point horizontally, with the SD2 detector microphones sheathed in a small plastic pipe for additional protection from the weather. Each nest-box was mounted to a tree at 2–3 m off the ground. All nest-boxes were placed so that their microphones were directed out into an open area without obstruction from tree branches or foliage. The location of each detector was recorded on a handheld GPS (Garmin Ltd, Kansas, USA).
Before their first deployment, a controlled pilot study was conducted to ensure that the sensitivity and detection range of the Anabat Swift and SD2 models were comparable. First, we used a handheld ultrasonic signal source at different distances to determine the range of each detector and calibrate its sensitivity. Once calibrated, these detectors were deployed together at the same location for 1 week, in a setup identical to the field survey (i.e. including nest boxes and pipes). We then confirmed that the number of bat calls recorded was comparable across detector types, and that the quality was similar and resulted in equivalent identification rates.
After the pilot study, detectors were deployed for 23 days in January and February and 12 days in March, with a mean of 15.9 survey nights per site (range: 9–23 nights). All detectors recorded bat echolocation calls from 1900 to 0700 hours (1 h before sunset to 1 h after sunrise at the time of sampling). The dates of surveys were chosen to avoid the two nights either side of a full moon as previous surveys have shown that the activity of some bat species may be impacted by the increased lunar illumination on these nights (Basham et al. 2011; Threlfall et al. 2011; Caryl et al. 2016; Linley 2017). One detector experienced technical issues and did not record any data; we therefore include data from just 35 survey sites in the analyses.
Call identification
Bat call data were recorded in Zero Crossing format. The calls were initially viewed using AnalookW software (Titley Scientific, Brendale, Australia) to remove any obvious noise files that were large in size because these can cause the species identification program to crash. Files containing bat echolocation calls were then analysed using AnaScheme (Lumsden and Bennett 2005; Adams et al. 2010), via an identification key developed for this region, based on an extensive reference library of calls. Call sequences were identified to species by analysing a range of call parameters such as frequency and slope measures, time between pulses and duration of pulses. Species identification was only attempted for files that contained five or more valid pulses (i.e. those with a minimum of six data points and model quality greater than 0.9), and these were defined as a ‘pass’. A pass was included in our activity count for a certain species if more than 50% of its pulses were identified to that species (sensuThrelfall et al. 2011; Caryl et al. 2016; Haddock et al. 2019a). Automated identifications were manually checked when the software identified a species that was rare or outside of its known distribution within the Melbourne region. A genus complex was used to combine Nyctophilus species and Myotis macropus because these species could not be confidently distinguished acoustically. Passes that could not be identified to a species or this genus complex were grouped into ‘unknown’ calls (i.e. ≤50% of pulses within the pass were identified to a single species); these unknown calls were included in the calculation of total bat activity but excluded from analyses of species-specific activity patterns.
Our dataset therefore consisted of the number of passes per night per site for each species and a count of the number of passes per night per site for all species combined, including ‘unknown’ calls. Because it cannot be determined how many individual bats made the passes, this measure was used as an index of activity, not a measure of abundance. Species richness per site per night was also calculated.
Landscape and weather variables
We assessed the influence of both landscape and weather variables on species richness and activity levels. Landscape variables included the number of trees (any woody plants above 2 m height) recorded within a 25-m radius of each site (hereafter ‘Trees’) and variables that were spatially generated using QGIS (QGIS Development Team 2020): mean annual Normalised Difference Vegetation Index (NDVI) for the calendar year preceding surveys (mean value within 500 m of the site); distance to the closest waterbody (m); and the total length of watercourses and roads within a 500-m radius of the site (see Table 1 for full details). We estimated weather variables for each survey night based on hourly data between 1900 and 0700 hours, taken at the Scoresby Research Institute weather station by the Bureau of Meteorology (Table 1).
| Variable | Unit | Source | Rationale | Observed range | |
|---|---|---|---|---|---|
| Road length | m within 500-m radius of survey point | Vicmap Transport DELWP Spatial Datamart | Used as a measure of urbanisation around each site. Roads may also have direct impacts on bats by causing mortality and creating barriers to movement (McGregor et al. 2017; Medinas et al. 2019). | 5116–12,005 | |
| Watercourse length | m within 500-m radius of survey point | Vicmap Hydro DELWP Spatial Datamart | Watercourses provide corridors for movement throughout the landscape and support riparian habitat for roosting and foraging (Threlfall et al. 2012; Altringham and Kerth 2016). | 0–1637 | |
| Distance to water | m | Vicmap Hydro DELWP Spatial Datamart | Water sources support flying invertebrate populations (Gili et al. 2020), on which bats feed. The distance from a site to the nearest water source may influence occupancy and species richness (Straka et al. 2016). | 13–1485 | |
| NDVI | Mean annual NDVI from all 2019 images within 500-m radius | Sentinel 2A satellite data | Normalised Difference Vegetation Index: used as a measure of greenness around each survey point to investigate the impact of varying vegetation availability and productivity on bat activity (Pettorelli et al. 2011). | 0.20–0.31 | |
| Total trees | Number within 25 m of survey point | Data collected on site | Trees are important resources for foraging, roosting and shelter for bats (Verboom and Spoelstra 1999; Threlfall et al. 2012; Straka et al. 2016). This variable was chosen for modelling over the number of trees with DBH of >20 cm because the results were the same for both variables. | 8–61 | |
| Rainfall | Total nightly rainfall in mm | Bureau of Meteorology | Nights of heavy rainfall result in lower total bat activity, possibly due to changes in insect activity and the increased energy requirements of flying in rain (Voigt et al. 2011). | 0–23.2 | |
| Dusk temperature | °C | Bureau of Meteorology | Temperature can impact insect activity and bat activity (O’Donnell 2000). We used dusk temperature as bat activity peaks around dusk (Maier 1992; Rydell et al. 1996). | 13–29 | |
| Wind speed | Mean of hourly speed at night in km/h | Bureau of Meteorology | High wind speeds may reduce insect activity and impact bat flight ability, reducing their activity (Rydell 1989; Adam et al. 1994; Verboom and Spoelstra 1999). | 1.5–13.0 | |
| Humidity | Mean of hourly measurements at night in % | Bureau of Meteorology | High humidity positively impacts activity of some species, possibly due to increased insect abundance (Pasek 1988; Haddock et al. 2019b). | 44.7–97.7 |
Statistical analyses
We used Generalised Linear Mixed Models (GLMMs) with a negative binomial distribution to examine the effects of landscape and weather variables against species richness, total bat activity and activity (i.e. the number of recorded passes) of individual species. Site was included as a random factor to account for repeated sampling at each site and therefore controlled for inherent site-level variability. Individual species modelling was conducted for all species that recorded over 1000 passes during our survey period. Where evidence of non-linear relationships existed, Generalised Additive Mixed Models (GAMMs) with a negative binomial distribution were used instead. The white-striped free-tailed bat, eastern bent-winged bat (Miniopterus orianae oceanensis), and the long-eared bats (Nyctophilus) and Myotis genus complex were all recorded at relatively low numbers; we therefore reduced these data to presence or absence and used a binomial distribution. Landscape models were not constructed for these three species and genus complex because they were present at 90–100% of sites. GLMMs were run in ‘lme4’ (Bates et al. 2015) and GAMMs in ‘gamm4’ (Wood and Scheipl 2020), using R statistical software (R Core Team 2020). Models were validated by comparing residual values with fitted values and comparing residual values with each variable included in the model. Cook’s distance was used to identify influential values. Where outliers were identified, models were run with and without the outlier to determine its influence – no outliers influenced our results. All independent variables were scaled and centred prior to modelling, and no variable having a correlation coefficient of >0.4 with any other variable was included in the same model.
We developed global models for landscape and weather variables and used a backward model selection approach. Model selection was performed in the package ‘AICcmodavg’ (Mazerolle 2020), using Akaike’s Information Criterion corrected for small sample sizes (AICc) to determine the most parsimonious model. Models were considered to have support if they had a delta AICc score of <2 (Burnham and Anderson 1998). A null model was generated and included in all model selection. R-squared values were calculated using the MuMin package (Barton 2020) to determine the amount of variation explained by each model. For GLMMs, both marginal and conditional R2 values are reported to distinguish between the explanatory power of fixed and random effects. For GAMMs, only adjusted R2 values are reported, because marginal and conditional values cannot be obtained.
This research was approved by Deakin University Animal Ethics Committee (WECW-B) under the project number B33-2019.
Results
In the three months of survey, we recorded 92,665 bat passes from a total of 557 detector nights across 35 sites (mean detector nights per site = 16, median = 19). These passes were identified to ten species and one genus complex (Nyctophilus–Myotis genus complex) (Table 2), with each site recording 6–11 species/genus complex. Sufficient data were available for four species to enable species-level activity modelling: Gould’s wattled bat (Chalinolobus gouldii); chocolate wattled bat (Chalinolobus morio); little forest bat (Vespadelus vulturnus); and the southern free-tailed bat (Ozimops planiceps). Additionally, when examining weather variables, A. australis, M. o. oceanensis and the Nyctophilus–Myotis genus complex were modelled using a binomial presence–absence model due to their smaller sample size. The remaining species were excluded from individual modelling due to insufficient data; however, their data were included in the total bat activity and species richness models.
| Scientific name | Common name | Total recorded passes | % sites present | % detector nights recorded | Functional guild | |
|---|---|---|---|---|---|---|
| Chalinolobus gouldiiA | Gould’s wattled bat | 13,550 | 100% | 93.2% | Edge | |
| Vespadelus vulturnusA | Little forest bat | 12,748 | 100% | 79.4% | Edge | |
| Ozimops planicepsA | Southern free-tailed bat | 5117 | 100% | 89.1% | Open | |
| Chalinolobus morioA | Chocolate wattled bat | 4695 | 100% | 64.6% | Edge | |
| Miniopterus orianae oceanensisB | Eastern bent-winged bat | 1964 | 91.4% | 47.8% | Edge | |
| Nyctophilus and Myotis generaB | Long-eared bats and mouse-eared bats | 1564 | 91.4% | 51.5% | Clutter | |
| Austronomus australisB | White-striped free-tailed bat | 1534 | 100% | 58.2% | Open | |
| Vespadelus darlingtoni | Large forest bat | 266 | 42.9% | 14.5% | Edge | |
| Vespadelus regulus | Southern forest bat | 45 | 45.7% | 5.9% | Edge | |
| Ozimops ridei | Ride’s free-tailed bat | 13 | 11.4% | 0.9% | Edge | |
| Scotorepens orion | Eastern broad-nosed bat | 2 | 5.7% | 0.4% | Edge |
Functional guilds are classified according to Adams et al. (2009) and Threlfall et al. (2011). They describe the typical foraging environment of the species, based on proximity to vegetation clutter.
Landscape models
Road length, used as a measure of urbanisation, was in the best supported model for species richness, total activity and the activity of all modelled species (Table 3). Greater road lengths resulted in lower species richness and activity for all species, with confidence intervals overlapping zero for V. vulturnus (Fig. 2).
| Response variable/species | Model | K | LL | AICc | ΔAICc | AICcωi | R2m | R2c | |
|---|---|---|---|---|---|---|---|---|---|
| Total activity | RD + Tr | 5 | −3261.36 | 6532.80 | 0.00 | 0.36 | 0.134 | 0.500 | |
| Dwater + NDVI + RD + Tr | 7 | −3259.67 | 6533.50 | 0.71 | 0.25 | 0.171 | 0.500 | ||
| Dwater + RD + Tr | 6 | −3260.78 | 6533.70 | 0.89 | 0.23 | 0.152 | 0.503 | ||
| Null | 8 | −3266.73 | 6539.50 | 6.68 | 0.01 | 0.000 | 0.504 | ||
| Species richness | RD + Tr | 5 | −1154.31 | 2318.70 | 0.00 | 0.48 | 0.156 | 0.482 | |
| RD + WL + Tr | 6 | −1153.87 | 2319.90 | 1.16 | 0.27 | 0.164 | 0.481 | ||
| Null | 3 | −1160.99 | 2328.00 | 9.30 | 0.00 | 0.000 | 0.488 | ||
| Chalinolobus gouldii | Dwater + RD | 5 | −2232.12 | 4474.36 | 0.00 | 0.32 | 0.069 | 0.360 | |
| Dwater + RD + Tr | 6 | −2231.39 | 4474.94 | 0.58 | 0.24 | 0.085 | 0.361 | ||
| RD | 4 | −2233.53 | 4475.12 | 0.77 | 0.22 | 0.039 | 0.357 | ||
| Null | 3 | −2231.18 | 4478.62 | 4.27 | 0.04 | 0.000 | 0.358 | ||
| Chalinolobus morio | Dwater + NDVI + RD + Tr | 7 | −1332.19 | 2678.59 | 0.00 | 0.54 | 0.283 | 0.693 | |
| Dwater + NDVI + WL + RD + Tr | 8 | −1331.97 | 2680.21 | 1.62 | 0.24 | 0.290 | 0.693 | ||
| Dwater + RD + Tr | 6 | −1334.13 | 2680.41 | 1.82 | 0.22 | 0.247 | 0.702 | ||
| Null | 3 | −1351.33 | 2708.71 | 30.12 | 0.00 | 0.000 | 0.697 | ||
| Vespadelus vulturnus | RD + Tr | 5 | −1930.27 | 3870.64 | 0.00 | 0.24 | 0.084 | 0.703 | |
| RD | 4 | −1931.43 | 3870.94 | 0.30 | 0.21 | 0.043 | 0.703 | ||
| Null | 3 | −1932.55 | 3871.14 | 0.50 | 0.19 | 0.000 | 0.703 | ||
| Dwater + RD + Tr | 6 | −1929.53 | 3871.21 | 0.57 | 0.18 | 0.118 | 0.706 | ||
| Ozimops planiceps | RD + Tr | 5 | −1700.36 | 3410.84 | 0.00 | 0.36 | 0.087 | 0.405 | |
| WL + RD + Tr | 6 | −1699.74 | 3411.64 | 0.80 | 0.24 | 0.098 | 0.403 | ||
| Dwater + WL + RD + Tr | 7 | −1698.99 | 3412.18 | 1.35 | 0.18 | 0.117 | 0.406 | ||
| Null | 3 | −1704.36 | 3414.76 | 3.92 | 0.05 | 0.000 | 0.408 |
Models are ranked using Akaike’s Information Criterion corrected (AICc). Included are the number of parameters within each model (K): log-likelihood of each model (LL); AICc scores of each model (AICc); differences between ranked models (ΔAICc); AICc weights (AICcωi); and R-squared values for each model (adjusted = Adj. R2; marginal = R2m; conditional = R2c). Model parameters include distance to water (Dwater), Normalised Difference Vegetation Index (NDVI), road density (RD), watercourse length (WL) and surrounding trees (Tr). Only models with ΔAICc <2 were considered supported and thus included in this table; null models are reported for comparison.
Coefficients of landscape variables (β ± 95%CI) on total bat activity (Activity), species richness (Richness) and the activity of individual species: Gould’s wattled bat (Chalinolobus gouldii) [Cgouldii]; chocolate wattled bat (Chalinolobus morio) [Cmorio]; little forest bat (Vespadelus vulturnus) [Vvulturnus]; and southern free-tailed bat (Ozimops planiceps) [Oplaniceps].
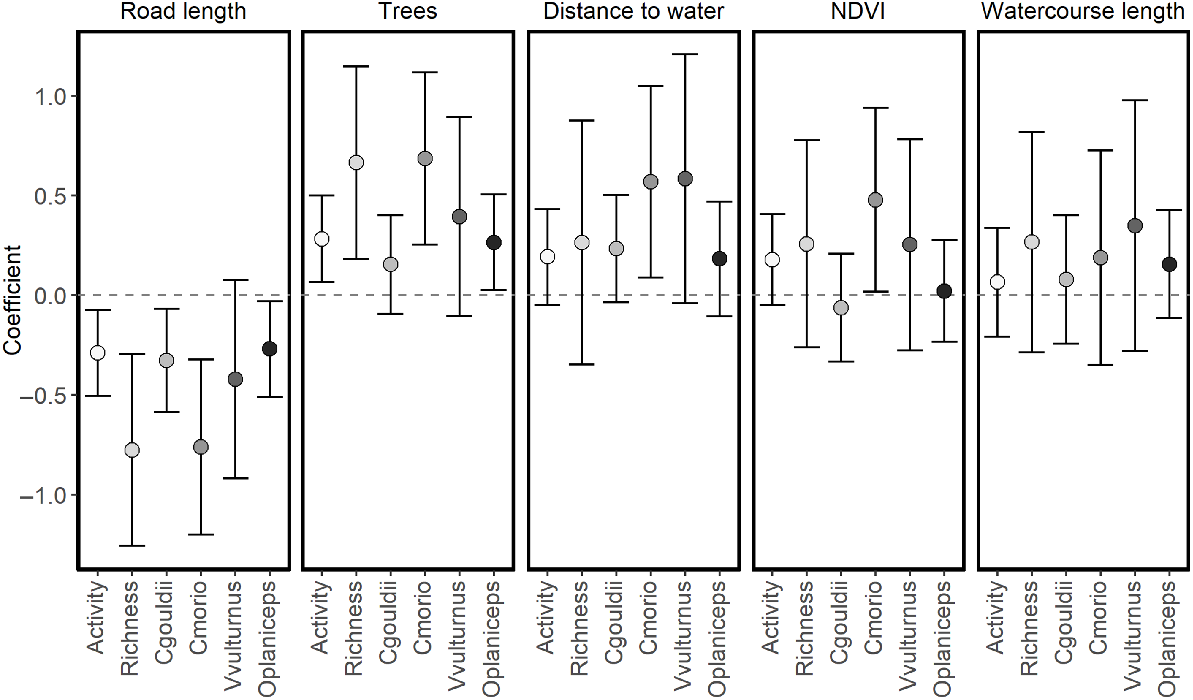
The number of trees within a 25-m radius was present in the best models for species richness, total activity and activity levels of C. morio, V. vulturnus and O. planiceps (Table 3). Support also existed for C. gouldii (ΔAIC = 0.58, AICωi = 0.24). More trees were associated with higher species richness, overall bat activity and activity of C. morio and O. planiceps, and trended towards increased activity levels for C. gouldii and V. vulturnus (Fig. 2).
Distance to the nearest water source was in the best supported model for C. gouldii and C. morio (Table 3). There was also support in models for total activity (ΔAIC = 0.71) and O. planiceps (ΔAIC = 1.35; Table 3). Higher activity levels were associated with greater distances from water sources for all modelled species, although the confidence intervals overlapped zero for total activity, C. gouldii, V. vulturnus and O. planiceps, indicating uncertainty (Fig. 2). There was no support for an influence of distance to the nearest water source on species richness.
NDVI was in the best supported model for C. morio, with support also given for its influence on total activity (ΔAIC = 0.71; Table 3). More green areas in the landscape were associated with higher activity levels of C. morio, with a similar trend observed for total activity (Fig. 2). There was no support for an influence of NDVI on species richness or the activity of C. gouldii, V. vulturnus and O. planiceps.
The length of watercourse within a 500-m radius of a site was not a variable in the best model for any species or group; however, support existed for species richness (ΔAIC = 1.16), C. morio (ΔAIC = 1.62) and O. planiceps (ΔAIC = 1.35). In each case, areas with higher water course length trended towards having higher activity and richness levels; however, confidence intervals strongly overlapped zero, suggesting considerable uncertainty (Fig. 2). There was no support for total activity or the activity of C. gouldii and V. vulturnus.
Weather models
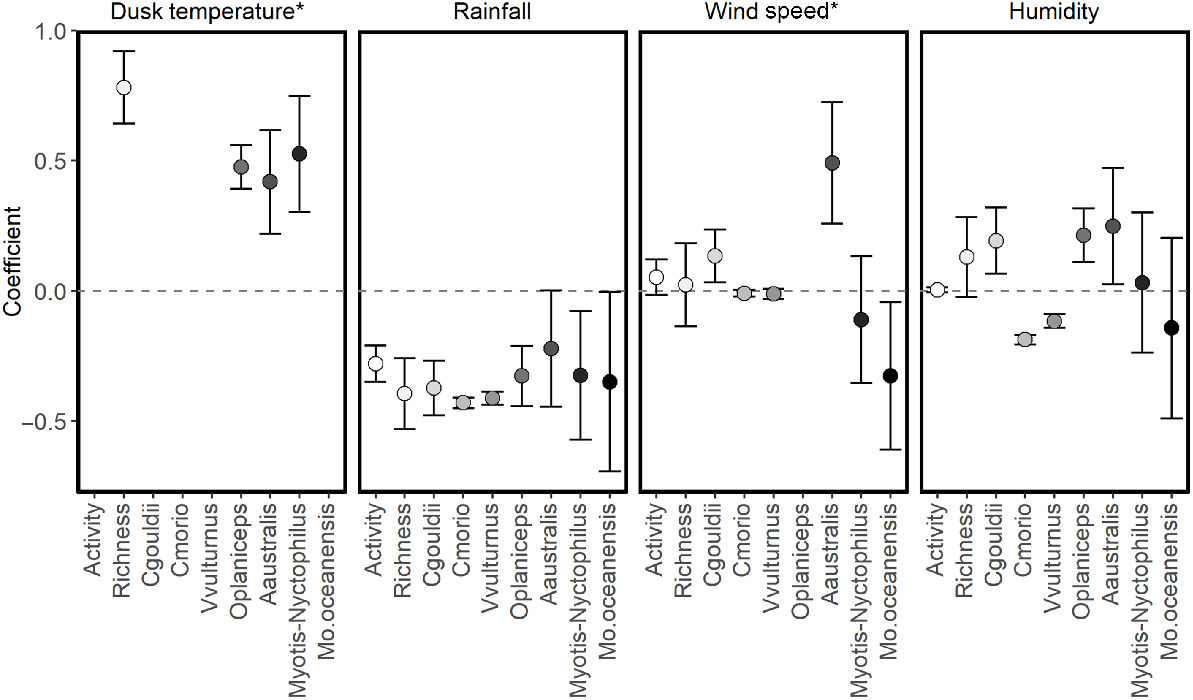
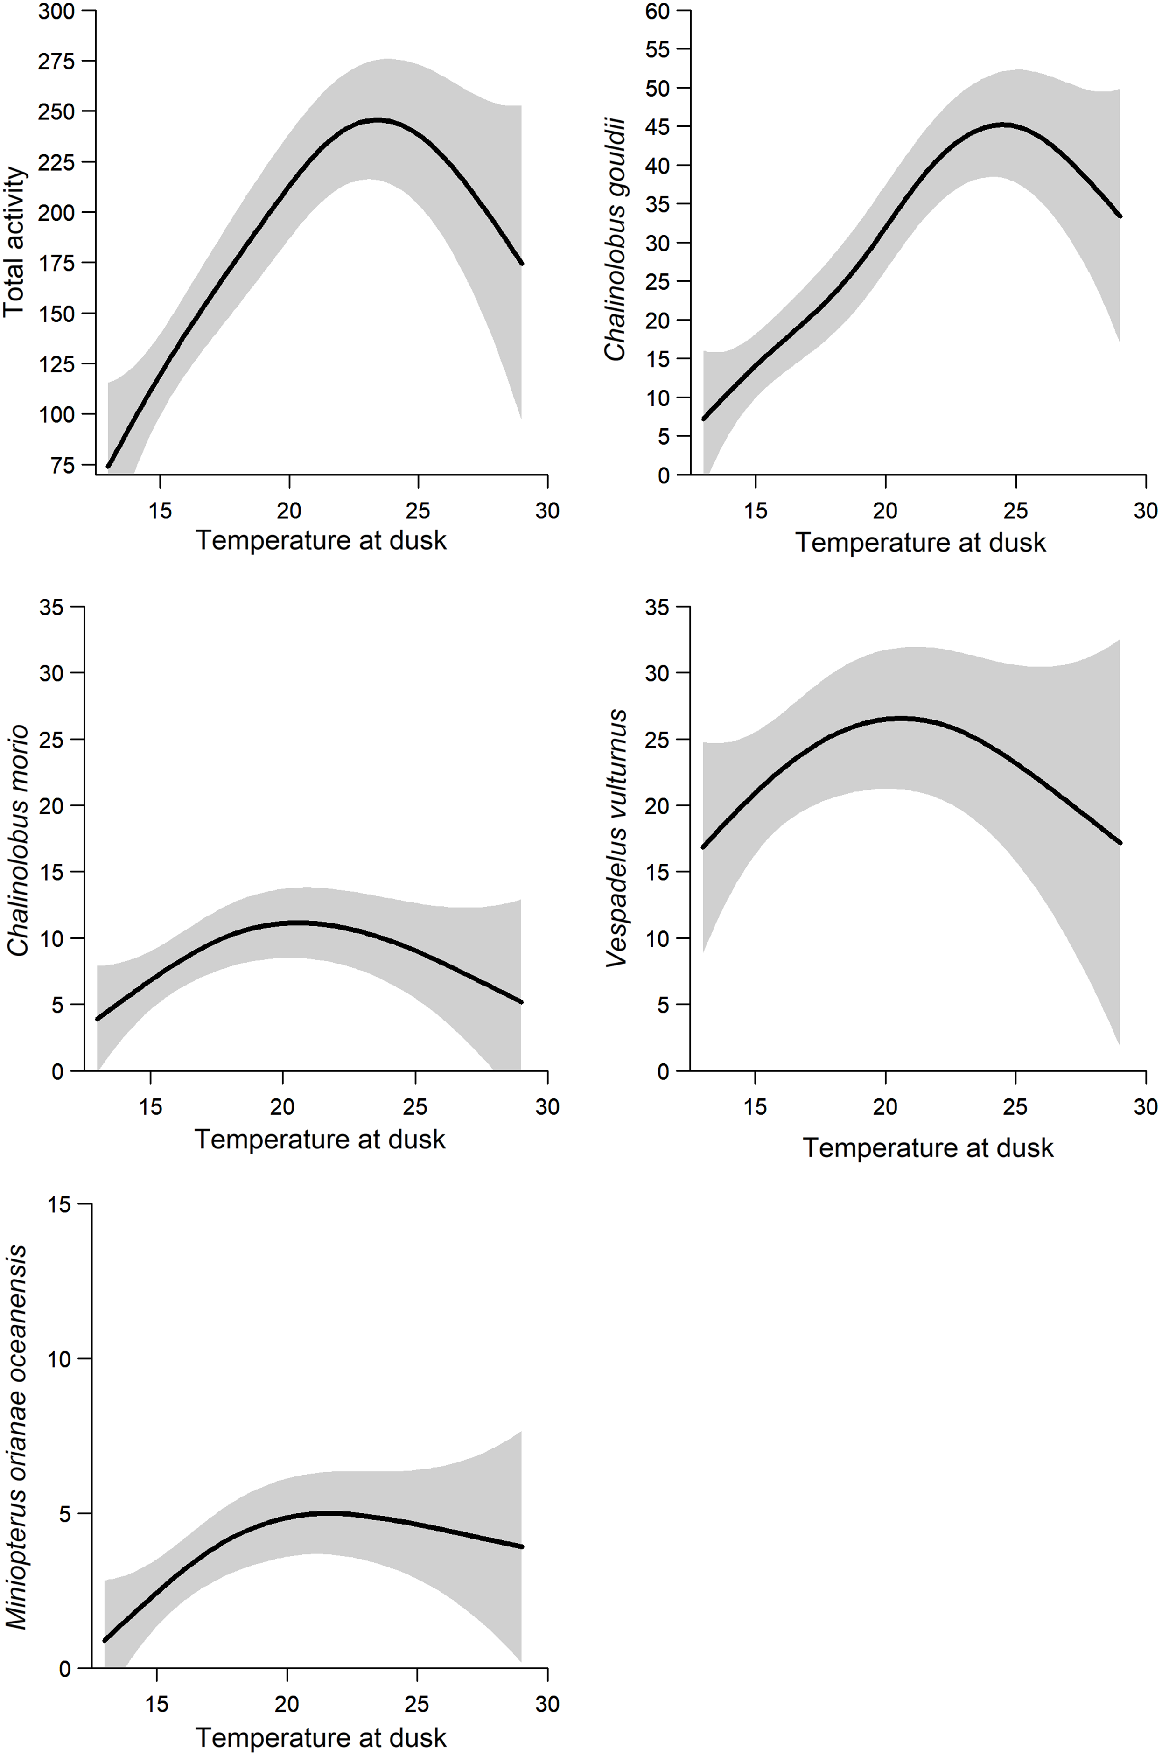
Dusk temperature was included in the best model for all species and groups modelled (Table 4). Higher dusk temperatures were associated with increased species richness and activity of A. australis, O. planiceps and the Nyctophilus–Myotis genus complex (Fig. 3). There was a non-linear relationship between dusk temperature and total activity: activity levels of C. gouldii, C. morio, V. vulturnus, O. planiceps and M. o. oceanensis increased with dusk temperature up to approximately 20–25°C, at which point activity levels appear to plateau (Fig. 4). However, large variations in activity levels of C. morio and V. vulturnus were recorded across survey nights, especially in higher temperatures, reducing these models’ explanatory power.
| Response variable/species | Model | K | LL | AICc | ΔAICc | AICcωi | Adj. R2 | R2m | R2c | |
|---|---|---|---|---|---|---|---|---|---|---|
| Total activity | Rain + s(Temp) + Wind | 7 | −3185.84 | 6385.89 | 0.00 | 0.70 | 0.108 | |||
| Rain + s(Temp) + Wind + Humidity | 8 | −3185.66 | 6387.59 | 1.70 | 0.30 | 0.113 | ||||
| Null | 3 | −3268.25 | 6542.54 | 156.65 | 0.00 | 0.000 | ||||
| Species richness | Rain + Temp + Humidity | 6 | −1085.67 | 2183.49 | 0.00 | 0.48 | 0.126 | 0.602 | ||
| Rain + Temp | 5 | −1087.01 | 2184.13 | 0.64 | 0.35 | 0.122 | 0.605 | |||
| Rain + Temp + Wind + Humidity | 7 | −1085.63 | 2185.47 | 1.98 | 0.18 | 0.127 | 0.602 | |||
| Null | 3 | −1160.99 | 2328.02 | 144.53 | 0.00 | 0.000 | 0.488 | |||
| Chalinolobus gouldii | Rain + s(Temp) + Wind + Humidity | 8 | −2134.88 | 4286.03 | 0.00 | 1.00 | 0.141 | |||
| Null | 3 | −2251.66 | 4509.36 | 223.33 | 0.00 | 0.000 | ||||
| Chalinolobus morio | Rain + s(Temp) + Humidity | 7 | −1320.47 | 2655.15 | 0.00 | 0.73 | −0.006 | |||
| Null | 3 | −1356.27 | 2718.58 | 61.39 | 0.00 | 0.000 | ||||
| Vespadelus vulturnus | Rain + s(Temp) + Humidity | 7 | −1890.38 | 3794.97 | 0.00 | 0.53 | −0.002 | |||
| Rain + s(Temp) | 6 | −1892.05 | 3796.26 | 1.29 | 0.28 | 0.004 | ||||
| Null | 3 | −1942.23 | 3890.50 | 95.53 | 0.00 | 0.000 | ||||
| Ozimops planiceps | Rain + Temp + s(Wind) + Humidity | 8 | −1627.02 | 3270.30 | 0.00 | 0.90 | 0.102 | |||
| Null | 3 | −1709.20 | 3424.45 | 154.15 | 0.00 | 0.000 | ||||
| *Austronomus australis | Rain + Temp + Wind + Humidity | 6 | −354.77 | 721.70 | 0.00 | 0.70 | 0.069 | 0.141 | ||
| Temp + Wind + Humidity | 5 | −356.66 | 723.43 | 1.74 | 0.30 | 0.059 | 0.132 | |||
| Null | 2 | −371.94 | 747.91 | 26.21 | 0.00 | 0.000 | 0.090 | |||
| * Nyctophilus–Myotis genera | Rain + Temp | 4 | −295.99 | 600.04 | 0.00 | 0.56 | 0.054 | 0.480 | ||
| Rain + Temp + Wind | 5 | −295.60 | 601.32 | 1.28 | 0.29 | 0.055 | 0.480 | |||
| Null | 2 | −312.29 | 628.60 | 28.56 | 0.00 | 0.000 | 0.472 | |||
| *Miniopterus orianae oceanensis | Rain + s(Temp) + Wind + Humidity | 7 | −267.54 | 549.29 | 0.00 | 1.00 | 0.052 | |||
| Null | 2 | −294.26 | 592.55 | 43.26 | 0.00 | 0.000 |
Models are ranked using Akaike’s Information Criterion corrected (AICc). Species that were run using a binomial (presence–absence) model are denoted with an asterisk (*). Included are the number of parameters within each model (K): AICc scores of each model (AICc); differences between ranked models (ΔAICc); AICc weights (AICcωi); R-squared values for each model (adjusted = Adj. R2; marginal = R2m; conditional = R2c); and log-likelihood of each model (LL). Model parameters include total overnight rainfall (Rain), temperature at dusk (Temp), median overnight wind speed (Wind) and median overnight humidity (Humidity). Non-linear smoothers are denoted by s(x). Only models with ΔAICc <2 were considered supported and thus included in this table; null models are reported for comparison.
Coefficients of temporal variables (β ± 95%CI) on total bat activity (Activity), species richness (Richness) and the activity of individual species: Gould’s wattled bat (Chalinolobus gouldii) [Cgouldii]; chocolate wattled bat (Chalinolobus morio) [Cmorio]; little forest bat (Vespadelus vulturnus) [Vvulturnus]; and southern free-tailed bat (Ozimops planiceps) [Oplaniceps]. *only linear effects are reported here, with non-linear relationships shown in Figs 4 and 5.
Non-linear relationship between bat activity levels and temperature at dusk (line of best fit ± 95%CI), including for total bat activity (top left), Chalinolobus gouldii (top right), C. morio (middle left), Vespadelus vulturnus (middle right) and Miniopterus orianae oceanensis (bottom left).
Rainfall was included in the best supported model for species richness, total activity and all species modelled (Table 4). Nights with more rainfall were associated with lower species richness and activity levels in all cases (Fig. 3).
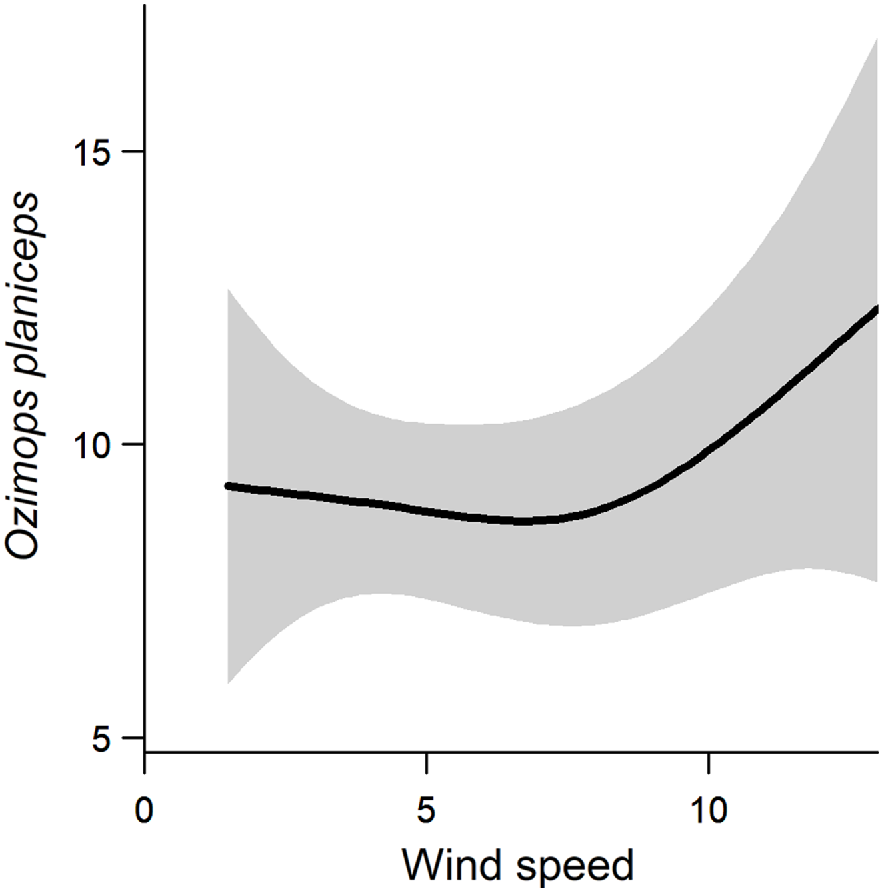
Wind speed was included in the best supported models for species richness, total activity and activity levels of C. gouldii, O. planiceps, A. australis and M. o. oceanensis (Table 4). Support also existed in the Nyctophilus–Myotis genus complex (ΔAIC = 1.28, AICωi = 0.29; Table 4). Greater wind speeds were associated with higher total activity and activity levels of C. gouldii and A. australis. Conversely, greater wind speeds were associated with lower activity levels of M. o. oceanensis, and a similar trend was observed for the Nyctophilus–Myotis genus complex (Fig. 3). A non-linear relationship existed between wind speed and O. planiceps, with activity levels remaining constant at low wind speeds before increasing when wind speeds were >10 km/h (Fig. 5). The effect on species richness was weak (β = 0.022), and confidence intervals overlapped zero (Fig. 3).
Non-linear relationship between Ozimops planiceps and wind speed (line of best fit ± 95% CI).
Humidity was in the best supported model for species richness and activity levels of C. gouldii, C. morio, V. vulturnus, O. planiceps, A. australis and M. o. oceanensis (Table 4). Support also existed for total activity (ΔAIC = 1.70, AICωi = 0.30). Higher humidity was associated with greater activity of C. gouldii, O. planiceps and A. australis. As humidity increased, there was a trend for greater species richness (β = 0.0029; 95%CI: −0.0066 to 0.0125) but lower activity level for M. o. oceanensis (Fig. 3).
Discussion
Our results highlight the value of Melbourne’s open urban green spaces as habitat for insectivorous bats. We detected at least 11 of the 17 species known from Melbourne, a value slightly lower but similar to earlier studies on bats in the greater Melbourne region (Caryl et al. 2016; Straka et al. 2016), despite these earlier studies sampling areas with higher densities of trees than our study. Average activity levels were also comparable between studies for most species, except for the species that typically forage in cluttered environments (e.g. Nyctophilus–Myotis genus complex) showing slightly lower activity levels in our study (Caryl et al. 2016). These slight differences confirm our current understanding that reserves with patches of remnant vegetation can support a wider range of bat species compared with open green spaces; however, it also highlights that open green spaces still hold habitat value for multiple bat species.
Species richness and activity levels in our study were influenced by landscape features such as the presence of nearby trees, road density and water courses in the surrounding area. We found that greater levels of urbanisation (based on road length) were associated with lower bat species richness and activity levels, and greater number of trees was associated with higher species richness and activity levels. Limited trends were observed with NDVI, a result likely attributed to the influence of open green spaces (i.e. grass) contributing to overall ‘greenness’ at sites – supporting the relatively narrow variability in sites observed. As such, this metric likely reflects habitat and non-habitat for microbats. Such findings suggest that even small-scale tree planting efforts in urban green spaces could benefit bats within the urban matrix and potentially mitigate some impacts of urbanisation. Our results also add support for the importance of urban landscape as habitat for wildlife (Fernandez-Juricic and Jokimaki 1998; Angold et al. 2006; Carbó-Ramírez and Zuria 2011; Koh and Sodhi 2017; Van Helden et al. 2020).
We found that road density was negatively associated with species richness and activity levels in open urban parks. This is consistent with previous findings, which have similarly recorded lower bat activity with increasing urbanisation (Threlfall et al. 2012; Luck et al. 2013; Caryl et al. 2016). Highly urbanised areas may have smaller property sizes with less yard space, higher building density and fewer trees available for roosting and foraging. In addition to being a surrogate for urbanisation, roads may directly impact bat activity by fragmenting areas of potential habitat, creating a barrier to movement or causing mortality through vehicle collisions (Altringham and Kerth 2016; Fensome and Mathews 2016). Bats could also be indirectly impacted by roads, with these environments experiencing higher levels of anthropogenic noise and artificial light – factors that have been identified to impact activity levels (Bennett and Zurcher 2013; Song et al. 2020). These combined impacts of roads have previously been thought to be species-specific, with low-and slow-flying species considered to be most at risk (Stone et al. 2015; Fensome and Mathews 2016). We could not directly examine the impacts of road density on clutter-adapted species (e.g. Nyctophilus–Myotis genus complex) due to their lower activity levels in our open study areas in general; however, the lower species richness and consistent negative relationship between activity levels and road density among modelled species highlight the negative impacts of roads and urbanisation on the insectivorous bat community in general.
Species richness and activity were greater in open urban green spaces with more trees in the surrounding area. This is consistent with existing knowledge of bat activity; trees offer roosting opportunities, shelter from illumination (and thus predation) and support flying insect populations (Lumsden and Bennett 2005; Basham et al. 2011; Threlfall et al. 2012; Straka et al. 2016; Crisol-Martínez et al. 2017; Haddock et al. 2019a). All modelled species in this study showed positive responses to tree density; however, previous studies have recorded different responses to vegetation structure across functional guilds (Norberg and Rayner 1987; Ober and Hayes 2008; Threlfall et al. 2012). There are two possible explanations for this disparity between studies: (1) we only modelled the activity of four species that are all edge- (C. gouldii, C. morio, and V. vulturnus) or open-adapted (O. planiceps) species (Threlfall et al. 2011); or (2) previous research on bat activity in open areas have focused on rural–agricultural landscapes and open farmland (Lumsden and Bennett 2005; Crisol-Martínez et al. 2017) – areas that are typically much larger (and thus may exhibit different species trends) than smaller-scale urban parks and sporting fields. Our results suggest that even in highly modified open urban parks, increasing tree availability is beneficial for bats, leading to greater species richness and activity.
Within our urban environment, proximity to a water source did not appear to be associated with the activity of most species, but unexpectedly was associated with lower activity levels of C. morio. Previous research identified watercourses as important flyways and corridors for bats (Law et al. 1998); waterways are considered particularly important in highly urbanised areas, where they may be the only available corridors that remain relatively dark (Barré et al. 2020) and support increased invertebrate abundances (Ober and Hayes 2008; Threlfall et al. 2012). Our results, however, indicated a weak or no relationship with distance to waterbodies, and this is likely linked to the distribution of waterbodies in our study area. The local government areas we surveyed contained multiple water bodies and watercourses, with the maximum distance to a water source from our survey sites being approximately 1.5 km. Given that the species modelled in this study can fly greater distances than this each night (e.g. Lumsden et al. 2002), distance to water was likely not a major driver of bats’ activity. Therefore, our results here are likely a reflection of the high availability of water in the landscape, rather than C. morio showing active avoidance of watercourses.
Weather factors were found to strongly influence bat species richness and activity levels. Higher dusk temperatures were associated with greater species richness and activity levels, whereas higher night-time rainfall figures were associated with lower species richness and activity levels of all species and the genus complex group, which is consistent with previous research (O’Donnell 2000; Straka et al. 2016). During each deployment period, sites across multiple landscape contexts were deployed simultaneously; we therefore consider detectability across different landscape types comparable throughout our landscape models. Higher temperatures likely increase invertebrate activity and thus increase foraging opportunities, although this effect seemed to plateau or decline at higher temperatures for some species, which could be attributed to seasonality, prey availability and/or satiation of bats given the higher abundance of insects on warmer nights (Richards 1989; O’Donnell 2000). Greater uncertainty was observed at higher temperatures, especially for C. morio and V. vulturnus, probably because only 6% of our survey nights experienced dusk temperature of above 25°C. The consistent negative association with rainfall could be linked to a range of factors, including: (1) a reduced detection probability due to ambient rain noise, as has been suggested for some mammals (Whisson et al. 2021); (2) an increased energetic cost of flight (Voigt et al. 2011); and/or (3) rainfall interfering with echolocation and reducing the ability of bats to forage (Griffin 1971; Voigt et al. 2011). These impacts could also have been exacerbated in our study due to the open nature of our survey sites, leading to bats being more exposed to rain during poor weather.
Wind speed and humidity had species-specific associations with bat activity levels, supporting the conflicting results of previous studies (Rydell 1989; Maier 1992; Adam et al. 1994; Hecker and Brigham 1999; Verboom and Spoelstra 1999). This diversity of associations could be attributed to inter-species variations in wing morphology and flight patterns. Chalinolobus gouldii, O. planiceps and A. australis all had increased activity levels on nights with higher wind speeds; these species are edge- or open-adapted species, which typically display faster flight and lower manoeuvrability (Threlfall et al. 2011). In contrast, the clutter-adapted Nyctophilus–Myotis genus complex, which includes the slow-flying Nyctophilus species, was recorded less on windy nights. Presence of M. o. oceanensis, which is generally considered an edge-adapted species, showed a negative association with wind speed. This species is considered a strong flyer; however, previous research found that they may forage in more sheltered areas in a coastal healthy strip in absence of large trees, and that their activity lowered on nights with strong wind (White 2011). A similar trend to this was also found in the open areas we surveyed. Open-adapted species with a greater speed capability are likely better equipped to continue foraging during strong winds when compared wth clutter-adapted species, leading to species-specific response to wind speed. The effect of humidity may, however, relate more to increased flying invertebrate activity when humidity increases (Pasek 1988). Previous research has suggested increased humidity may reduce the effectiveness of echolocation and thus reduce activity levels (Griffin 1971). Our inferences may be limited, however, by the narrow range of wind speeds (min = 1.5 km/h, max = 13 km/h) and humidity levels (45% to 98% median) recorded during this study.
Management implications
Our results show that a diverse range of insectivorous bat species are using open green spaces in urban environments. This highlights the value of these spaces as habitat for bats persisting in the urban landscape, which can provide valuable ecosystem services in surrounding areas. Our findings can inform future urban park design and management to make these spaces more hospitable to insectivorous bats, and likely other wildlife. We make two key recommendations to local councils or land managers managing open urban green spaces:
Increase tree availability and connectivity in existing open urban green spaces. Increasing the number of trees near open areas can increase both the species richness and activity levels of bats. Land managers should aim to protect existing vegetation while also planting more, preferably indigenous, trees around open spaces such as parks, ovals and tennis courts. These management options should be strategic to improve connectivity, particularly linking these areas to remnant vegetation patches such as along waterways and riparian corridors.
Planning of new urban parks and outdoor sporting facilities. Councils and urban planners should carefully consider the development of new parks and ovals, selecting areas in which remnant trees can be retained and revegetation can provide good connectivity to nearby remnant patches. Construction of a new park should occur in existing cleared patches so that removal of trees is avoided. The new park should, with strategic revegetation, increase connectivity among existing remnant patches in the landscape.
Data availability
The data that support this research will be shared upon reasonable request to the corresponding author.
Declaration of funding
This study was supported by School of Life and Environmental Science and Faculty of Science, Engineering, and Build Environment at Deakin University.
Acknowledgements
The authors acknowledge that this research was conducted on the traditional lands of the Wurundjeri Woi Wurrung and Bunurong People of the Kulin nation. We thank City of Monash, City of Whitehorse and Frankston City for providing their support in site selection and access for this study. We are grateful for the support we received from staff and members at all the tennis clubs involved in this research, Glen Waverley Golf Course and St Justin’s Catholic Primary School during our bat surveys. Our sincere thanks go to Steve Griffith for lending us the nest boxes for bat surveys, Calvin Lee for creating the NDVI layer for our analysis and Leroy Gonsalves for helping us troubleshoot during species identification process. We thank anonymous reviewers for constructive comments that improved the manuscript.
References
Adam MD, Lacki MJ, Shoemaker LG (1994) Influence of environmental conditions on flight activity of Plecotus townsendii virginianus (Chiroptera: Vespertilionidae). Brimleyana 21, 77-86.
| Google Scholar |
Adams MD, Law BS, French KO (2009) Vegetation structure influences the vertical stratification of open- and edge-space aerial-foraging bats in harvested forests. Forest Ecology and Management 258, 2090-2100.
| Crossref | Google Scholar |
Adams MD, Law BS, Gibson MS (2010) Reliable automation of bat call identification for eastern New South Wales, Australia, using classification trees and AnaScheme software. Acta Chiropterologica 12(1), 231-245.
| Crossref | Google Scholar |
Angold PG, Sadler JP, Hill MO, Pullin A, Rushton S, Austin K, Small E, Wood B, Wadsworth R, Sanderson R, Thompson K (2006) Biodiversity in urban habitat patches. Science of The Total Environment 360, 196-204.
| Crossref | Google Scholar | PubMed |
Armstrong KN, Reardon TB, Jackson SM (2020) A current taxonomic list of Australian Chiroptera (Version 2020-06-09). Australasian Bat Society. Available at https://www.ausbats.org.au/species-list.html [Accessed 21 May 2023]
Australasian Bat Society (2021) BatMap. Available at http://ausbats.org.au/batmap [Accessed 21 May 2023]
Australian Bureau of Statistics (ABS) (2023) Regional population, 2021-22 financial year, catalogue number 3218.0. Available at https://www.abs.gov.au/statistics/people/population/regional-population/2021-22 [Accessed 31 May 2023]
Barré K, Spoelstra K, Bas Y, Challéat S, Kiri Ing R, Azam C, Zissis G, Lapostolle D, Kerbiriou C, Le Viol I (2020) Artificial light may change flight patterns of bats near bridges along urban waterways. Animal Conservation 24, 259-267.
| Crossref | Google Scholar |
Barton K (2020) Package ‘MuMIn’ – multi-model inference. Available at https://cran.r-project.org/web/packages/MuMIn/index.html
Basham R, Law B, Banks P (2011) Microbats in a ‘leafy’ urban landscape: are they persisting, and what factors influence their presence? Austral Ecology 36(6), 663-678.
| Crossref | Google Scholar |
Bates D, Mächler M, Bolker B, Walker S (2015) Fitting linear mixed-effects models using lme4. Journal of Statistical Software 67(1), 1-48.
| Crossref | Google Scholar |
Bennett VJ, Zurcher AA (2013) When corridors collide: road-related disturbance in commuting bats. The Journal of Wildlife Management 77(1), 93-101.
| Crossref | Google Scholar |
Bonsen G, Law B, Ramp D (2015) Foraging strategies determine the effect of traffic noise on bats. Acta Chiropterologica 17(2), 347-357.
| Crossref | Google Scholar |
Boyles JG, Cryan PM, McCracken GF, Kunz TH (2011) Economic importance of bats in agriculture. Science 332(6025), 41-42.
| Crossref | Google Scholar | PubMed |
Bureau of Meteorology (2020) Climate statistics for Australian locations. Available at http://www.bom.gov.au/climate/averages/tables/cw_086071.shtml [Accessed 4 September 2020]
Carbó-Ramírez P, Zuria I (2011) The value of small urban greenspaces for birds in a Mexican city. Landscape and Urban Planning 100(3), 213-222.
| Crossref | Google Scholar |
Caryl FM, Lumsden LF, van der Ree R, Wintle BA (2016) Functional responses of insectivorous bats to increasing housing density support ‘land-sparing’ rather than ‘land-sharing’ urban growth strategies. Journal of Applied Ecology 53(1), 191-201.
| Crossref | Google Scholar |
Crisol-Martínez E, Ford G, Horgan FG, Brown PH, Wormington KR (2017) Ecology and conservation of insectivorous bats in fragmented areas of macadamia production in eastern Australia. Austral Ecology 42(5), 597-610.
| Crossref | Google Scholar |
Fensome AG, Mathews F (2016) Roads and bats: a meta-analysis and review of the evidence on vehicle collisions and barrier effects. Mammal Review 46(4), 311-323.
| Crossref | Google Scholar | PubMed |
Fernandez-Juricic E, Jokimaki J (1998) A habitat island approach to conserving birds in urban landscapes: case studies from southern and northern Europe. Biodiversity and Conservation 10(12), 2023-2043.
| Crossref | Google Scholar |
Gaisler J, Zukal J, Rehak Z, Homolka M (1998) Habitat preference and flight activity of bats in a city. Journal of Zoology 244(3), 439-445.
| Crossref | Google Scholar |
Gili F, Newson SE, Gillings S, Chamberlain DE, Border JA (2020) Bats in urbanising landscapes: habitat selection and recommendations for a sustainable future. Biological Conservation 241, 108343.
| Crossref | Google Scholar |
Griffin DR (1971) The importance of atmospheric attenuation for the echolocation of bats (Chiroptera). Animal Behaviour 19, 55-61.
| Crossref | Google Scholar | PubMed |
Haddock JK, Threlfall CG, Law B, Hochuli DF (2019a) Light pollution at the urban forest edge negatively impacts insectivorous bats. Biological Conservation 236, 17-28.
| Crossref | Google Scholar |
Haddock JK, Threlfall CG, Law B, Hochuli DF (2019b) Responses of insectivorous bats and nocturnal insects to local changes in street light technology. Austral Ecology 44(6), 1052-1064.
| Crossref | Google Scholar |
Hecker KR, Brigham RM (1999) Does moonlight change vertical stratification of activity by forest-dwelling insectivorous bats? Journal of Mammalogy 80(4), 1196-1201.
| Crossref | Google Scholar |
Jones G, Jacobs DS, Kunz TH, Willig MR, Racey PA (2009) Carpe noctem: the importance of bats as bioindicators. Endangered Species Research 8(1), 93-115.
| Crossref | Google Scholar |
Koh LP, Sodhi NS (2017) Importance of reserves, fragments, and parks for butterfly conservation in a tropical urban landscape. Ecological Applications 14(6), 1695-1708.
| Crossref | Google Scholar |
Law B, Anderson J, Chidel M (1998) A bat survey in State Forests on the south-west slopes region of New South Wales with suggestions of improvements for future surveys. Australian Zoologist 30(4), 467-479.
| Crossref | Google Scholar |
Linley GD (2017) The impact of artificial lighting on bats along native coastal vegetation. Australian Mammalogy 39(2), 178-184.
| Crossref | Google Scholar |
Lowry H, Lill A, Wong BBM (2013) Behavioural responses of wildlife to urban environments. Biological Reviews 88(3), 537-549.
| Crossref | Google Scholar | PubMed |
Luck GW, Smallbone L, Threlfall C, Law B (2013) Patterns in bat functional guilds across multiple urban centres in south-eastern Australia. Landscape Ecology 28(3), 455-469.
| Crossref | Google Scholar |
Lumsden LF, Bennett AF (2005) Scattered trees in rural landscapes: Foraging habitat for insectivorous bats in south-eastern Australia. Biological Conservation 122(2), 205-222.
| Crossref | Google Scholar |
Lumsden LF, Bennett AF, Silins JE (2002) Location of roosts of the lesser long-eared bat Nyctophilus geoffroyi and Gould’s wattled bat Chalinolobus gouldii in a fragmented landscape in south-eastern Australia. Biological Conservation 106(2), 237-249.
| Crossref | Google Scholar |
Maier C (1992) Activity patterns of Pipistrelle bats (Pipistrellus pipistrellus) in Oxfordshire. Journal of Zoology 228(1), 69-80.
| Crossref | Google Scholar |
Mazerolle MMJ (2020) Package ‘AICcmodavg’. Available at https://cran.r-project.org/web/packages/AICcmodavg/index.html
McGregor M, Matthews K, Jones D (2017) Vegetated fauna overpass disguises road presence and facilitates permeability for forest microbats in Brisbane, Australia. Frontiers in Ecology and Evolution 5, 153.
| Crossref | Google Scholar |
Medinas D, Ribeiro V, Marques JT, Silva B, Barbosa AM, Rebelo H, Mira A (2019) Road effects on bat activity depend on surrounding habitat type. Science of The Total Environment 660, 340-347.
| Crossref | Google Scholar | PubMed |
Moretto L, Fahrig L, Smith AC, Francis CM (2019) A small-scale response of urban bat activity to tree cover. Urban Ecosystems 22, 795-805.
| Crossref | Google Scholar |
Norberg UM, Rayner JMV (1987) Ecological morphology and flight in bats (Mammalia; Chiroptera): wing adaptations, flight performance, foraging strategy and echolocation. Philosophical Transactions of the Royal Society B: Biological Sciences 316(1179), 335-427.
| Google Scholar |
Ober HK, Hayes JP (2008) Influence of vegetation on bat use of riparian areas at multiple spatial scales. The Journal of Wildlife Management 72(2), 396-404.
| Crossref | Google Scholar |
O’Donnell CFJ (2000) Influence of season, habitat, temperature, and invertebrate availability on nocturnal activity of the New Zealand long-tailed bat (Chalinolobus tuberculatus). New Zealand Journal of Zoology 27(3), 207-221.
| Crossref | Google Scholar |
Pasek JE (1988) 30. Influence of wind and windbreaks on local dispersal of insects. Agriculture, Ecosystems & Environment 22–23, 539-554.
| Crossref | Google Scholar |
Pettorelli N, Ryan S, Mueller T, Bunnefeld N, Jedrzejewska B, Lima M, Kausrud K (2011) The Normalized Difference Vegetation Index (NDVI): unforeseen successes in animal ecology. Climate Research 46(1), 15-27.
| Crossref | Google Scholar |
QGIS Development Team (2020) QGIS geographic information system (Version 3.12). Open Source Geospatial Foundation Project. Available at http://qgis.org
R Core Team (2020) ‘R: a language and environment for statistical computing.’ (R Foundation for Statistical Computing: Vienna, Austria) Available at http://www.R-project.org/
Richards GC (1989) Nocturnal activity of insectivorous bats relative to temperature and prey availability in tropical Queensland. Australian Wildlife Research 16(2), 151-158.
| Crossref | Google Scholar |
Rydell J (1989) Feeding activity of the northern bat Eptesicus nilssoni during pregnancy and lactation. Oecologia 80(4), 562-565.
| Crossref | Google Scholar | PubMed |
Rydell J, Entwistle A, Racey PA (1996) Timing of foraging flights of three species of bats in relation to insect activity and predation risk. Oikos 76(2), 243-252.
| Crossref | Google Scholar |
Scanlon AT, Petit S (2008) Effects of site, time, weather and light on urban bat activity and richness: considerations for survey effort. Wildlife Research 35(8), 821-834.
| Crossref | Google Scholar |
Song S, Chang Y, Wang D, Jiang T, Feng J, Lin A (2020) Chronic traffic noise increases food intake and alters gene expression associated with metabolism and disease in bats. Journal of Applied Ecology 57(10), 1915-1925.
| Crossref | Google Scholar |
Stone EL, Harris S, Jones G (2015) Impacts of artificial lighting on bats: a review of challenges and solutions. Mammalian Biology 80(3), 213-219.
| Crossref | Google Scholar |
Straka TM, Lentini PE, Lumsden LF, Wintle BA, van der Ree R (2016) Urban bat communities are affected by wetland size, quality, and pollution levels. Ecology and Evolution 6(14), 4761-4774.
| Crossref | Google Scholar | PubMed |
Suarez-Rubio M, Ille C, Bruckner A (2018) Insectivorous bats respond to vegetation complexity in urban green spaces. Ecology and Evolution 8(6), 3240-3253.
| Crossref | Google Scholar | PubMed |
Threlfall C, Law B, Penman T, Banks PB (2011) Ecological processes in urban landscapes: mechanisms influencing the distribution and activity of insectivorous bats. Ecography 34(5), 814-826.
| Crossref | Google Scholar |
Threlfall CG, Law B, Banks PB (2012) Influence of landscape structure and human modifications on insect biomass and bat foraging activity in an urban landscape. PLoS ONE 7(6), e38800.
| Crossref | Google Scholar | PubMed |
Turbill C (2008) Winter activity of Australian tree-roosting bats: influence of temperature and climatic patterns. Journal of Zoology 276, 285-290.
| Crossref | Google Scholar |
Van Helden BE, Close PG, Stewart BA, Speldewinde PC, Comer SJ (2020) Critically endangered marsupial calls residential gardens home. Animal Conservation 24(3), 445-456.
| Crossref | Google Scholar |
Verboom B, Spoelstra K (1999) Effects of food abundance and wind on the use of tree lines by an insectivorous bat, Pipistrellus pipistrellus. Canadian Journal of Zoology 77(9), 1393-1401.
| Crossref | Google Scholar |
Voigt CC, Schneeberger K, Voigt-Heucke SL, Lewanzik D (2011) Rain increases the energy cost of bat flight. Biology Letters 7(5), 793-795.
| Crossref | Google Scholar |
Whisson DA, McKinnon F, Lefoe M, Rendall AR (2021) Passive acoustic monitoring for detecting the Yellow-bellied Glider, a highly vocal arboreal marsupial. PLoS ONE 16(5), e0252092.
| Crossref | Google Scholar | PubMed |
White AW (2011) Roosting dynamics of Eastern Bent-wing Bats Miniopterus schreibersii oceanensis in disused military areas in eastern Sydney. In ‘The biology and conservation of Australasian bats’. (Eds B Law, P Eby, D Lunney, L Lumsden) pp. 471–484. (Royal Zoological Society of NSW: Mosman, NSW, Australia)
Wood S, Scheipl F (2020) Package ‘gamm4’. Available at https://cran.r-project.org/web/packages/gamm4/gamm4.pdf