

Evaluating predator control using two non-invasive population metrics: a camera trap activity index and density estimation from scat genotyping
Jessica L. Keem A * , Bronwyn A. Hradsky A , Joe Benshemesh B , Mark Le Pla C , Abigail Watkins D , Andrew R. Weeks E F , Anthony van Rooyen F , John Black F and Darren Southwell A G
A
B
C
D
E
F
G
Abstract
Invasive mammalian predators are a threat to biodiversity and agriculture globally, yet management outcomes for lethal predator control remain difficult to monitor and evaluate. Understanding whether changes in activity indices correspond to true changes in population density will help inform effective monitoring and management programs.
The aim of this study was to evaluate the effect of poison baiting on invasive red fox (Vulpes vulpes) populations using two alternative population metrics: fox activity from camera trap surveys and density estimation from scat genetic analysis.
We conducted before–after control–impact studies in two regions of semi-arid Australia (Wimmera and Mallee) by monitoring paired non-treatment and treatment sites during unbaited and baited periods. We estimated the effects of poison baiting on: (1) a monthly fox activity index, derived from an array of 10 off-road camera traps per site; and (2) fox density. To estimate density, we collected fox scats along 14-km transects, identified individuals using polymorphic microsatellite DNA markers and fitted spatially explicit capture–recapture models.
Fox activity remained consistently low at all sites except the Mallee non-treatment. The top-ranked models of fox activity and density contained an interaction between treatment and period, with an interactive and additive effect of region, respectively. However, there was little evidence that baiting reduced fox activity or density. In the unbaited period, fox densities ranged from 0.69 (95% CI: 0.47–1.0) to 1.06 (95% CI: 0.74–1.51) foxes km−2 and were similar across regions.
Camera traps have the potential to provide continuous index-based measures of fox populations but may not record sufficient observations to detect change. Indices can also be confounded by variations in animal behaviour. Scat genetic analysis is a viable option for providing direct estimates of population change at specific snapshots in time; however, this approach is considerably more expensive, and large sample sizes may be required if genotyping success is low.
Our study presents a rare example of multiple concurrent – and non-invasive – monitoring techniques to evaluate the effectiveness of predator control. We highlight the value of rigorous study designs and high-quality density information for designing predator management and monitoring programs.
Keywords: 1080 baiting, activity index, BACI design, density estimation, genetic sampling, Leipoa ocellata, non-invasive sampling, semi-arid, Vulpes vulpes.
Introduction
Invasive mammalian predators are global drivers of biodiversity decline and extinction, as well as livestock loss (Doherty et al. 2016; Fleming et al. 2017). Such predators thrive in novel landscapes and challenge ecosystems through predation, competition, hybridisation and disease (Daniels et al. 2001; Norbury 2001; Harris and Macdonald 2007; Wyatt et al. 2008; Spencer et al. 2017). Reducing invasive predator populations through targeted management is therefore considered a crucial component of biodiversity conservation and economic safeguarding (Greentree et al. 2000; Robinson et al. 2013). There is a general expectation that lethal control reduces the density of invasive predators, but there are relatively few examples where appropriate data are collected to quantify change (Clayton and Cowan 2010; Walsh et al. 2012; Doherty et al. 2016). Unless the impacts of lethal control of invasive predators are measured and evaluated, the nature and magnitude of environmental improvements arising from such investments will remain uncertain.
One globally significant invasive mammalian predator is the European red fox (Vulpes vulpes; hereafter ‘fox’) (Lowe et al. 2000; Doherty et al. 2016). In Australia, predation by foxes is a key threat to native fauna and agriculture: foxes are implicated in the extinction of over 20 Australian native mammals, and management costs amount to more than $16 million AUD per annum (McLeod 2004; Woinarski et al. 2015). A suite of techniques have been adopted to control foxes, including lethal poison baiting, shooting, fumigation, trapping, exclusion fencing and livestock guardian dogs (Saunders and McLeod 2007; van Bommel and Johnson 2012). Lethal poison baiting with sodium fluoroacetate (hereafter ‘baiting’), commonly known as 1080, is the dominant management method for controlling fox populations in Australia (Saunders et al. 2010). However, the effects of 1080 baiting on fox population size or behaviour, and in turn the benefits to native species, are still poorly understood (Hunter et al. 2018; Manning et al. 2021).
Traditionally, the impacts of poison baiting on fox populations have largely been evaluated using index-based surrogates of fox abundance or density, such as bait-take rates, scat counts, spotlighting counts or track counts from sand pads (Sadlier et al. 2004; Reddiex et al. 2006). More recently, motion-triggered camera traps (hereafter ‘camera traps’) have become more affordable and therefore increasingly used to monitor the effects of fox management (e.g. Towerton et al. 2011; Benshemesh et al. 2014). Camera traps are a passive, non-invasive monitoring method that can be deployed across large spatial and temporal scales at low labour investment (Wearn and Glover-Kapfer 2019). Consequently, camera traps are potentially a cost-effective method to monitor cryptic species like the fox, which are nocturnal and capable of occupying large home ranges at low densities (Vine et al. 2009).
Camera traps are an effective tool for detecting fox presence (occupancy) if deployed for a sufficiently long period, but their value for detecting changes in fox population density is debatable. The uniform pelage of foxes prevents individual identification (Güthlin et al. 2014a; Carter et al. 2019), making it impossible to conduct mark–recapture analysis based on photographs. Methods for estimating true density from camera trap data without individual recognition are in development but remain largely unvalidated (Rowcliffe et al. 2008; Ramsey et al. 2015; Nakashima et al. 2018; Schaus et al. 2020). Instead, population changes in response to baiting are commonly inferred from relative abundance indices – such as activity – based on the photographic trapping rate (e.g. van Hespen et al. 2019). As with all activity indices, photographic trapping rates are a product of both population density and the observation process (Sollmann et al. 2013; Güthlin et al. 2014b; Stephens et al. 2015). This means that they are unable to distinguish changes in fox behaviour (that affect detectability) from true changes in population density.
Highly polymorphic genetic markers such as microsatellite loci provide an alternative approach for estimating fox density, by facilitating mark–recapture analysis without requiring invasive trapping and marking of individual foxes (Piggott and Taylor 2003; Le Pla et al. 2022). DNA can be obtained passively from epithelial cells shed in the environment and collected via hair-snares or scats (Sadlier et al. 2004; Immell and Anthony 2008; Ruell et al. 2009). These samples are genotyped to identify individual foxes, producing a dataset amenable to capture–recapture analysis (Royle and Young 2008; Wegge et al. 2019). Genetic techniques are becoming more cost-effective, and this approach has great potential. However, genotyping microsatellite markers can be both relatively expensive and time-intensive, and hair and scat samples often contain low quality DNA, meaning that a large quantity of samples is usually required to compensate for low genotyping success rates (Piggott 2004; Piggott et al. 2008; Berry et al. 2012).
Testing and comparing alternative methods to measure the effectiveness of invasive predator management is crucial to improving reliability in monitoring actions and hence the accuracy and precision of conservation initiatives (e.g. Lazenby et al. 2014; Wilson et al. 2017). To date, however, studies that have compared fox density estimates derived from non-invasive genotyping to activity indices have only focused on indirect signs (such as bait take, sand plots or scat counts) (e.g. Marks et al. 2009; Le Pla et al. 2022); the comparative value of camera trap data is yet to be evaluated.
Our study was conducted in association with the large-scale malleefowl Adaptive Management Predator Experiment (AMPE), which operates across southern Australia. The AMPE aims to learn about the effects of fox and cat (Felis catus) management on predator activity, and in turn, malleefowl (Leipoa ocellata) breeding activity (Benshemesh et al. 2018; Hauser et al. 2019). Approximately 20 pairs of experiment sites have been established across the malleefowl’s range. Fox baiting occurs in and around treatment sites, whereas paired non-treatment sites are left unmanaged. Camera traps operate continuously at all AMPE sites to monitor background rates of predator activity. However, whether the camera data can detect reductions in fox activity associated with a reduction in density due to baiting needs evaluation.
Our study measured the effect of baiting on fox populations at two paired non-treatment/treatment sites within the AMPE. These sites are patches of remnant native vegetation in the Wimmera and Mallee regions of semi-arid Victoria, Australia. Within each region, we aimed to evaluate the effects of baiting on: (1) fox activity using data from continuously operating camera traps; and (2) fox density using scat genotyping of microsatellite markers and spatially explicit capture–recapture analysis. We compared estimates of baiting effectiveness, based on these two different approaches while accounting for region-based differences in baiting regimes and environmental context. Comparative analysis of alternative sampling methods is crucial for designing optimal monitoring programs. Our findings help infer whether a camera trap network deployed across AMPE sites in southern Australia is likely to detect changes in fox density if fox density is affected by baiting. Our study also provides some of the first baseline estimates of fox density for semi-arid Australia, a key parameter for designing effective invasive predator management programs.
Materials and methods
Study sites
Our broad study design was replicated across the Wimmera and Mallee regions of Victoria, Australia. Within each region, we conducted a before–after control–impact (BACI) experiment, with repeated surveys through time at one non-treatment and one treatment site (Fig. 1). Baiting had previously occurred at both treatment (or ‘impact’) sites prior to initial surveying. Treatment sites in our study were managed for foxes by Parks Victoria and the Mallee Catchment Management Authority after initial surveying, respectively, with nearby non-treatment sites left unmanaged as experimental controls.
Location of the four study sites in (a) the Wimmera region and (b) the Mallee region in Victoria, Australia, used for camera trap surveys and scat collection. Baiting was conducted at treatment sites (black transect), whereas the non-treatment sites (grey transect) remained unbaited. Approximate camera sites are spread within the areas represented by black stippling, close to transects; precise locations are not shown for security reasons.
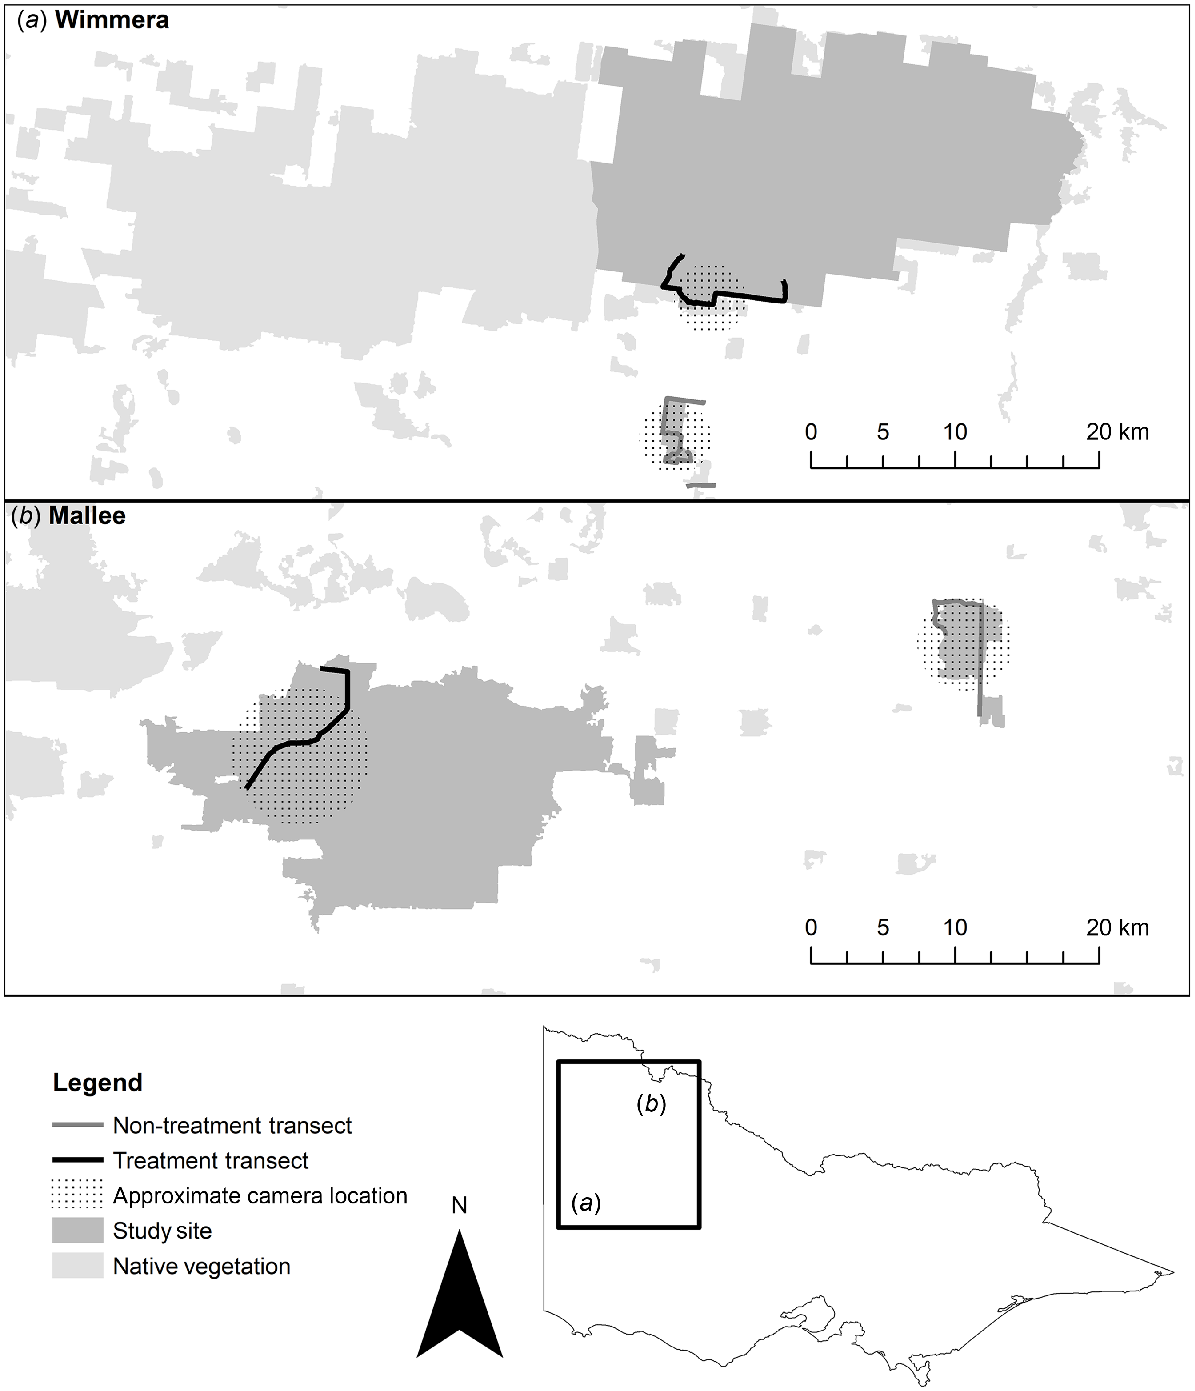
In the Wimmera region, the paired sites comprised the non-treatment site, Nurcoung Flora Reserve (36°41′39.8″S, 141°42′42.0″E), and the treatment site approximately 10 km away, the Eastern block of Little Desert National Park (36°34′50.0″S, 141°48′55.0″E) (Fig. 1a). The area of native vegetation at the non-treatment site is 5.9 km2, and the treatment site has an area of 476.8 km2. Both sites are bordered by pastoral and arable agricultural land. The Wimmera bioregion experiences hot, dry summers and cool winters with an average rainfall of 414 mm, falling primarily from June to August (data for Nhill, the nearest meteorological station; Bureau of Meteorology 2020a). The landscape typically supports Lowan Sands Mallee (Ecological Vegetation Class 87, Eucalyptus spp, Leptospermum spp.) (Victorian Government Department of Sustainability and Environment 2005a).
The Mallee region paired sites comprised the non-treatment site at Wandown Flora and Fauna Reserve (34°48′24.9″S, 142°59′20.9″E), and the treatment site approximately 30 km away at Annuello Flora and Fauna Reserve (34°53′38.7″S, 142°33′33.7″E) (Fig. 1b). The area of native vegetation at the non-treatment site has an area of 25.3 km2, and the treatment site an area of 361.0 km2. Both sites are bordered by irrigated agriculture on the northern side, and pastoral and arable agricultural land elsewhere. The Mallee bioregion also has a hot climate, with dry summers and cool winters. Rainfall averages 328.3 mm, with a strong bias across August–October (Data for Ouyen, the nearest meteorological station; Bureau of Meteorology 2020b). Vegetation is dominated by Woorinen Sands Mallee (Ecological Vegetation Class 86, Eucalyptus spp, Triodia spp.) (Victorian Government Department of Sustainability and Environment 2005b).
Fox-baiting regime
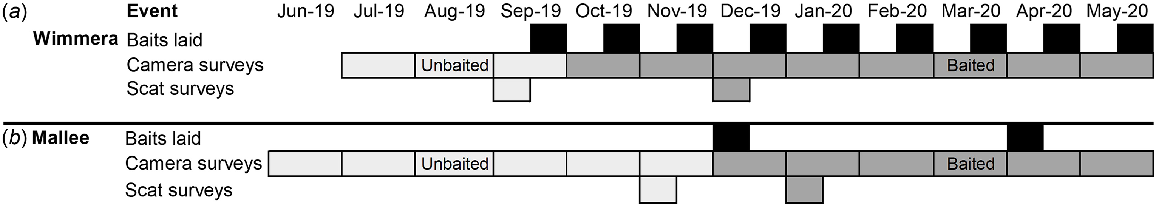
The non-treatment sites had no history of fox management and were not managed during our study. Pre-existing management at treatment sites ceased a month prior to our study commencing in both regions: June 2019 in the Wimmera, and May 2019 in the Mallee (Fig. 2). We consider this window to be unbaited in our study design but note that fox densities may be lower in treatment sites as a result of prior management.
Timeline of study events at the (a) Wimmera and (b) Mallee region. Poison baits were laid (black) at the treatment sites. For each region, the months before the first baiting event were the unbaited period (light grey), and those after baiting were the baited period (dark grey). Note, baiting commenced at the Wimmera treatment site only on the last days of September, therefore we treated this month as unbaited.
Both treatment sites were ground baited (Animal Control Technologies, FOXOFF®) following our unbaited scat surveys. Although we consulted with the land managers, the timing, extent and intensity of baiting at treatment sites was largely out of our control and dependent on the objectives and constraints of the organisations.
At the Wimmera treatment site, the Eastern and Central blocks have been pulse baited since 2010. This involved three 9-week pulses per year with fortnightly bait replacement. The unbaited period of our study was from June 2019 to September 2019. An intensified baiting regime commenced in late September 2019, and our baited survey period followed in October 2019 (Fig. 2). While pulse baiting continued in the central block, baits were laid monthly at the eastern block. Across the two blocks, 345 bait stations were operated, positioned approximately 750 m apart (Supplementary Fig. S1).
The Mallee treatment site was first baited in 2019. Baits were deployed across two pulses, one in April and May. The unbaited period of our study was from June 2019 to November 2019. The baited period of our study commenced with pulse baiting in December 2019 and continued into the next baiting event in April 2020. Baits were laid at 223 stations, spaced approximately 260 m apart. Each baiting pulse lasted for 2 weeks, and any removed baits were replaced daily.
Camera traps
All four sites were monitored with cameras traps (Wimmera: Scout Guard SG560k and Ltl Acorn Ltl-5310; Mallee: Scout Guard SG560k) to estimate fox activity. The AMPE continuously operates 10 solar-powered cameras at all sites (N = 40; Fig. 1). These cameras have all been operating since 2015, except for the Mallee treatment site (deployed in 2019).
We obtained 12 months (June 2019–May 2020) of raw camera data from the Victorian Malleefowl Recovery Group for each site. We grouped these camera data into unbaited and baited periods, specific to each region (Fig. 2). Note, baiting commenced at the Wimmera treatment site only on the last day of September, therefore we treated this month as unbaited.
The camera setup followed the approach described by van Hespen (2015) and van Hespen et al. (2019). Cameras were 1 m above ground in an off-track, grid formation, and spaced 0.8 km apart (Fig. 1). They were programmed to capture one photograph with a 5-min interval between sequential triggers to minimise repeat captures, and were not fitted with a lure to avoid altering predator behaviour (Benshemesh et al. 2014). Although camera spacing was not independent relative to fox movements, the design captured the ‘background’ rate of fox activity (therefore predation opportunities) at sites and accounted for potential spatial and temporal heterogeneities in fox activity (van Hespen et al. 2019).
Scat collection
We established a 14-km scat collection transect at each site, with a minimum of 8-km displacement between transect start and end (Fig. 1). Transects were based along roads adjacent to the camera traps at each site. This placement ensured that we maximised the number of scats collected (because roads are regions of high fox activity in mixed-agricultural landscapes; Hradsky et al. 2017) and that we surveyed a similar area as the camera traps. Transect length was approximately double the length of average fox home range estimates (95% kernel) from the nearest analogous bioregion (Carter et al. 2012). This ensured that the sampling area was likely to be greater than the range of any individual, an important model assumption for spatially explicit capture–recapture analysis (Efford and Boulanger 2019). Where feasible, transects were continuous for logistical reasons; otherwise, we split transects to preferentially survey along connected native vegetation (Fig. 1a).
We surveyed each transect across two primary survey sessions per region, one in the unbaited period and another in the baited period (Fig. 2). We cleared each transect of fox scats 2 days prior to a survey session so that only fresh scats would be collected. We aimed to collect scats across four secondary survey occasions (survey days) per survey session, alternating between the non-treatment and treatment transects over eight consecutive days. This ensured that scats were less than 48 h old and reduced the likelihood of DNA degradation (Piggott 2004). In total, there were eight survey sessions: two regions × two sites × two periods.
The survey sessions in the unbaited periods were conducted in full in both regions: Wimmera (September 2019) and Mallee (November 2019). For the baited period in the Wimmera region, one survey occasion at the non-treatment site was lost due to a Total Fire Ban day (December 2019). In the Mallee, the first survey occasion in the baited period was delayed until 7 days after scats were cleared due to a Bushfire State of Emergency, and we were only able to complete two and three survey occasions at the non-treatment and treatment site, respectively (January 2020).
Transects were walked simultaneously by two observers to collect fox scats from the middle of the road and up to 2 m either side. At all times, one observer was experienced in scat identification and the other had been trained for at least 1 day prior. We identified the species based on visual and odour specifications (Triggs 2004) and associated signs (Moseby et al. 2012). One disposable glove was used per scat to avoid cross-contamination of DNA. Scats were placed into individual zip-lock bags and marked with date, site, unique identifier and collector according to Piggott and Taylor (2003). We preserved scats frozen at −18°C immediately upon returning from collection (Piggott and Taylor 2003).
Analytic approach
We used a model comparison approach to evaluate support for an effect of baiting on fox activity (derived from camera records) and fox density (derived from scat genotypes).
We hypothesised that three main effects could influence fox activity and density: treatment (non-treatment or treatment site); period (unbaited or baited); and region (Wimmera or Mallee). We derived a set of candidate models for each response variable (activity rate and density), based on single, additive and interactive combinations of these effects, and a null model. In each case, support for models that included an interaction effect between treatment and period would be considered evidence that baiting affected fox activity or density. The region covariate was included to represent differences in the landscape context and baiting regime between the regions.
We ranked candidate models using Akaike’s information criterion adjusted for small sample size (AICc) (Burnham and Anderson 2002). We regarded the ‘best’ model to be the one with the lowest AICc value but considered those within two AICc as equally plausible. To measure precision around our estimates, we calculated the percentage relative standard error (RSE) as the standard error of the coefficient divided by the estimate; an RSE > 20% was assumed to indicate low precision and, therefore, low statistical power to detect a change in the population size (Williams et al. 2002; Palmer et al. 2018; Efford and Boulanger 2019). All statistical analyses were performed in in R v4.2.1 (R Core Team 2022).
Activity analysis
We identified fox captures from camera traps using FastStone software (Benshemesh et al. 2018; FastStone 2020). To minimise non-independent captures of the same individual, we classed repeat captures within a 30-min time frame as a single capture event using the ‘CamTrapR’ package (Niedballa et al. 2016). We then extracted the total number of independent fox captures per site for each camera-month. We assigned months into unbaited and baited periods (as detailed above; Fig. 2).
We modelled fox activity as the mean fox capture rate (number of captures per month) using generalised linear mixed effect models (GLMMs). To account for excess zeros in monthly fox capture rates (Blasco-Moreno et al. 2019), we assessed the fit of four alternative distributions (Poisson, negative binomial, zero-inflated Poisson and zero-inflated negative binomial) using simulation for dispersion and zero-inflation with ‘DHARMa’ (Hartig 2020). P-values suggested a zero-inflated negative binomial provided the best fit to the data, given by:
where Pc,m is the number of captures taken by camera c in month m, ηc,m is the mean capture rate and α is the variance of the distribution.
We fitted models using maximum likelihood methods, using the ‘glmmTMB’ package (Magnusson et al. 2021). We derived a set of 12 candidate models, based on combinations of the fixed effects and a null model (Table 1). To decide whether we needed to account for resampling at the same camera trap points each month, we evaluated our most complex fixed-effects model (treatment × period × region), with or without inclusion of camera trap point identity (1–10) as a random effect. We then used the structure of the most strongly supported model to fit the 12 candidate fixed effects models. We assessed competitive models with a combination of model weights, 95% confidence intervals of interaction terms and R2 values (calculated as per Nakagawa and Schielzeth (2013)).
| Rank | Model | K | LogLk | AICc | ΔAICc | AICcwt | R2m | R2c | |
|---|---|---|---|---|---|---|---|---|---|
| 1 | C ~ (t × p × r) | 11 | −502.10 | 1026.94 | 0.00 | 0.94 | 0.23 | 0.52 | |
| 2 | C ~ (t + p + r) | 7 | −510.40 | 1035.10 | 8.16 | 0.02 | 0.21 | 0.52 | |
| 3 | C ~ (t × r) | 7 | −510.86 | 1036.02 | 9.08 | 0.01 | 0.22 | 0.50 | |
| 4 | C ~ (t + r) | 6 | −512.13 | 1036.48 | 9.54 | 0.01 | 0.21 | 0.52 | |
| 5 | C ~ (t × p) | 7 | −511.18 | 1036.68 | 9.74 | 0.01 | 0.04 | 0.50 | |
| 6 | C ~ (p + r) | 6 | −512.24 | 1036.71 | 9.77 | 0.01 | 0.17 | 0.54 | |
| 7 | C ~ (p × r) | 7 | −511.65 | 1037.61 | 10.67 | 0.00 | 0.17 | 0.54 | |
| 8 | C ~ (r) | 5 | −513.88 | 1037.92 | 10.98 | 0.00 | 0.17 | 0.53 | |
| 9 | C ~ (t + p) | 6 | −516.78 | 1045.79 | 18.85 | 0.00 | 0.04 | 0.50 | |
| 10 | C ~ (p) | 5 | −517.87 | 1045.91 | 18.97 | 0.00 | 0.00 | 0.51 | |
| 11 | C ~ (.) | 4 | −519.85 | 1047.82 | 20.88 | 0.00 | 0.00 | 0.51 | |
| 12 | C ~ (t) | 5 | −518.87 | 1047.91 | 20.97 | 0.00 | 0.03 | 0.50 |
Zero-inflated negative binominal models are defined with fox captures (C) as constant (.), or varying according to treatment (t), period (p) and region (r). Number of parameters (K), LogLk, ΔAICC and AICCwt follow Burnham and Anderson (2002); marginal R2 (R2m) and conditional R2 (R2c) follow Nakagawa and Schielzeth (2013).
DNA extraction and species identification
Scats were removed from the freezer prior to DNA extraction and allowed to thaw before swabbing the outer surface of the scat repeatedly with a Copan dry swab (155CIS, Copan). Swabs when then placed in lysis buffer (500 μL ATL and 40 μL Proteinase K) in a 1.5-mL tube, with the swab tip snapped so that the tube lid could close. The tube was vortexed thoroughly, incubated at 56°C for 2 h before the sample was centrifuged at 6000g to pellet any debris. We then removed 200 μL of supernatant for extraction following the DNeasy spin column protocol with final elution in 100 μL buffer AE. Initially, we screened extracted DNA to confirm presence of fox DNA using the vv-CytB fox-specific primers in a qPCR assay described in Berry et al. (2012) on a Roche LightCycler 480 II system. A TaqMan Exogenous Internal Positive Control (VIC probe) was run for each sample to test for the presence of PCR inhibitors. Samples that were inhibited were then diluted 1/10 and rescreened with the qPCR assay.
All samples that were deemed positive for fox DNA (including diluted samples) were then genotyped by microsatellite loci and a single sex-specific marker to identify individuals and their sex. Microsatellite loci genotyped were V142, V374, V402, V602 (Wandeler and Funk 2006), C2054 (Francisco et al. 1996), DB1, DB3 and DB4 (Holmes et al. 1995), and the sex-determining marker was vvSRY (Berry et al. 2007). All markers were tagged with a unique fluorescent label during PCR using the method outlined in Blacket et al. (2012). Reactions included 5-μL Qiagen multiplex mix (Qiagen, Chadstone, Victoria, Australia), 4 μL of primer mix (0.2 μM of each primer) and 2 μL of template DNA. PCR conditions consisted of an initial 15-min denaturing step at 94°C, followed by 40 cycles of 94°C for 30 s, 59°C for 90 s and 72°C for 60 s, with a final extension step of 60°C for 30 min. All PCRs were undertaken on an Eppendorf Mastercycler S gradient (Eppendorf). All samples were genotyped in duplicate to avoid issues with allelic dropout.
After PCR, genotyping was undertaken using an Applied Biosystems 3730 capillary analyser, with product lengths determined relative to a GS500LIZ_3730 size standard. GeneMapper ver. 4.0 (Applied Biosystems) was used to score allele sizes, with all profiles examined manually. Individual fox haplotypes (multi-locus genotypes) were then identified with GenAlEx v6.5 (Peakall and Smouse 2012), as in Le Pla et al. (2022). If replicates matched at a locus, we assumed this to be the correct genotype, whereas if replicate genotypes differed at a locus, we then manually re-examined each histogram output to determine if there was an error in scoring, and if still conflicting, we excluded the locus from analysis. Individuals with six or more microsatellite loci scored across both replicate samples were included in all subsequent analyses to limit errors when identifying individuals (Waits et al. 2001).
Spatially explicit capture–recapture analysis
We estimated fox density using spatially explicit capture–recapture (SECR) analysis (Borchers and Efford 2008). SECR models the probability of detecting an animal as a declining function of distance from its range centre at an unknown location, and distance to the nearest trap location (Royle and Young 2008). Resulting models produce estimates of population density unbiased by edge effects and incomplete detection (Borchers and Efford 2008).
We fitted multisession SECR models to the data from the eight survey sessions. The multisession formulation was adopted because data aggregation can improve the precision of parameter estimations by sharing detection information across sessions (Efford et al. 2009) and regions (Morin et al. 2018; Proffitt et al. 2020).
Each 14-km transect was discretised into 200-m segments to create conceptual traps with scats assigned to the nearest segment (Efford 2011; Lonsinger et al. 2018; Le Pla et al. 2022). Each trap was considered a proximity detector to allow multiple detections per individual per occasion (Efford 2011). We defined a buffer distance of 3002 m around each transect as outer limit of the area of integration, where foxes beyond this estimate were considered unlikely to be detected in the survey (Borchers and Efford 2008). This value was based on double the diameter of the average home range (95% kernel) of GPS-collared foxes in the nearest similar climate zone (Carter et al. 2012). The buffer distance exceeded the minimum suggested buffer size of 2664 m, based on an estimate of dispersion, the root-pooled spatial variance (Calhoun and Casby 1958; Efford et al. 2009).
We modelled density with the ‘secr’ package (Efford 2020) by fitting the full-likelihood model assuming a half-normal detection function:
where D is density, g0 is the probability of detecting an animal at a trap located at its activity centre (per occasion) and σ is a home range spatial scale parameter (Efford et al. 2009).
As for the activity analysis, we had a set of 12 density models. Further, we considered that fox detectability might vary with period due to seasonal differences in behaviour, or with sex if females and males had differences in movement behaviour (e.g. male foxes generally disperse further than females) (Trewhella et al. 1988). Therefore, for each density model, we varied the detectability parameter (g0) and spatial scale parameter (σ) as constant, or as a function of period or sex. This resulted in 22 candidate models (Table S1).
Results
Fox activity
Across 11 and 12 survey months, we recorded 106 fox detections (27 unbaited, 79 baited) from 4503 trap nights in the Wimmera, and 483 detections (267 unbaited, 216 baited) from 6782 trap nights in the Mallee, respectively. This corresponded to a higher camera-trapping rate in the Mallee at 7.12 foxes per 100 trap nights, as compared with 2.35 foxes per 100 trap nights in the Wimmera. In the Wimmera region, foxes were detected at a total of 44% and 57% of the functioning camera traps at the non-treatment (n = 9) and treatment (n = 7) sites, respectively. In the Mallee region, foxes were detected at 100% of the functioning camera traps at the non-treatment (n = 9) and treatment (n = 10) sites.
A zero-inflated negative binomial distribution with a random effect for camera traps provided the best fit to the fox activity data. The top-ranked model was strongly supported over the other candidate models (ΔAICc to next model 8.16; model weight = 0.94; Table 1). The top model included a three-way interaction among treatment, period and region. However, this was primarily driven by a change in fox activity at the non-treatment site in the Mallee.
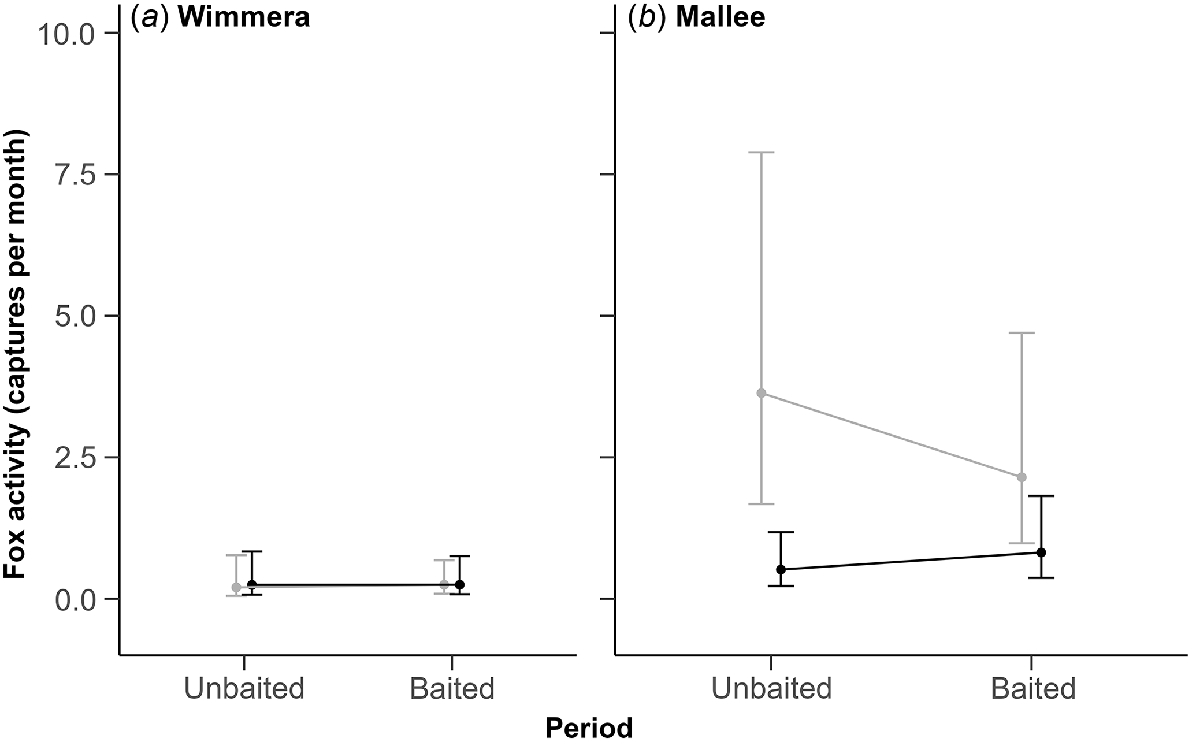
There was no evidence that fox baiting reduced fox activity in either region. In the Wimmera region, fox activity was low and similar at both sites across the unbaited and baited periods (Fig. 3a). In the Mallee region, fox activity was higher at the non-treatment than treatment site during the unbaited period; estimates overlapped during the baited period due to a large but uncertain decline in fox activity at the non-treatment site (Fig. 3b). The coefficient for the three-way interaction term was moderate and positive, but uncertain (1.19; 95% CI: −0.20–2.57). This uncertainty likely reflects the high level of variation in capture rates among camera traps within sites, which resulted in poor precision around most of the activity estimates (Table S2).
Predicted fox activity estimates (±95% CI) from the top-ranked model. Activity was derived from the monthly fox capture rate from 10 camera traps at each site. Estimates for non-treatment sites are light grey and treatment sites are black. Panels show estimates for the unbaited and baited periods in (a) the Wimmera and (b) the Mallee region.
There was no support for the simpler model that could also indicate an effect of baiting on fox activity (treatment × period); Table 1. The fixed effects for this model had little explanatory power (R2m = 0.04; Table 1).
Scat collection
In total, we collected 638 scats across the four sites. The number of scats collected per survey session varied between regions and periods. The greatest number of scats was detected from the Mallee region (Table 2). Scat numbers were lower in the baited periods, with approximately 60–70% fewer scats detected at all sites (Table 2), likely reflecting a seasonal difference.
| Region | Wimmera | Mallee | Total | |||||||
|---|---|---|---|---|---|---|---|---|---|---|
| Site | Non-treatment | Treatment | Non-treatment | Treatment | ||||||
| Period | Unbaited | Baited | Unbaited | Baited | Unbaited | Baited | Unbaited | Baited | ||
| Scats collected | 98 | 36 | 69 | 26 | 156 | 44 | 159 | 50 | 638 | |
| Scats genotyped | 52 | 26 | 34 | 8 | 41 | 26 | 51 | 28 | 266 | |
| Genotyping success (%) | 53 | 72 | 49 | 31 | 26 | 59 | 32 | 56 | 42 | |
Genotyping success and recapture rates
Of the 638 scats, 285 (45%) yielded fox DNA and 266 (42%) amplified enough microsatellite loci (n ≥ 6) to assign individual identities; 372 samples were unable to be genotyped (Table 2). We identified 108 individual foxes (Table 3). No individual foxes were detected moving between sites or regions, suggesting spatial independence of study sites.
| Region | Wimmera | Mallee | |||||||
|---|---|---|---|---|---|---|---|---|---|
| Site | Non-treatment | Treatment | Non-treatment | Treatment | |||||
| Period | Unbaited | Baited | Unbaited | Baited | Unbaited | Baited | Unbaited | Baited | |
| Females (n) | 15 | 9 | 6 | 4 | 10 | 10 | 13 | 6 | |
| Males (n) | 12 | 7 | 8 | 3 | 12 | 6 | 12 | 5 | |
| Total (n) | 27 | 16 | 14 | 7 | 22 | 16 | 25 | 11 | |
| New individuals (n) | 27 | 7 | 14 | 3 | 22 | 8 | 25 | 2 | |
| Recaptures within period (n) | 25 | 10 | 20 | 1 | 19 | 10 | 26 | 17 | |
| Recaptures between periods (propn.) | – | 0.56 | – | 0.57 | – | 0.50 | – | 0.82 | |
‘New individuals’ is the number of distinct individuals detected for the first time in each period. ‘Recaptures within period’ are repeat detections of distinct individuals within a survey period. ‘Recaptures between periods’ is the proportion of unique individuals detected that had already been detected in the previous period.
In the Wimmera region, we detected 51 unique individuals; 67% of these were at the non-treatment site (Table 3). At the non-treatment site, no fox contributed to more than 8% of all detections (n = 78 scats; Table 3). However, at the treatment site, one fox accounted for 26% of all detections (n = 42 scats; Table 3). In the Mallee, we detected a similar number of individuals to the Wimmera (57), but the number of individuals was approximately evenly split between the non-treatment and treatment sites (Table 3). No fox accounted for more than 13% of detections at the non-treatment site (n = 67 scats: Table 3). At the treatment site, recaptures were heavily skewed towards a few individuals, with three foxes contributing 41% of all detections (n = 79 scats; Table 3).
Across all sites, many individuals detected during the baited periods had previously been detected in the unbaited periods. Recapture rates between the periods ranged between 50% and 82% (Table 3) and were similar or higher in the treatment sites than the non-treatment sites, suggesting that these individuals survived baiting, and that baiting did not increase population turnover (Table 3).
Spatially explicit capture–recapture density modelling
Nine models of fox density received substantial support (Table 4). Model uncertainty was high and individual model weight was low, partly due to uncertainty around the detectability parameters: four density models with an identical density model but with or without an effect of sex on the detectability parameters received very similar support (Table 4).
| Rank | Model | npar | LogLk | AICc | ΔAICc | AICcwt | |
|---|---|---|---|---|---|---|---|
| 1 | D ~ (t × p + r) g0 ~ (s) σ ~ (s) | 9 | −1104.30 | 2228.00 | 0.00 | 0.13 | |
| 2 | D ~ (t + p + r) g0 ~ (s) σ ~ (s) | 8 | −1105.44 | 2228.00 | 0.00 | 0.13 | |
| 3 | D ~ (t × p + r) g0 ~ (.) σ ~ (.) | 7 | −1106.60 | 2228.07 | 0.07 | 0.13 | |
| 4 | D ~ (t + p + r) g0 ~ (.) σ ~ (.) | 6 | −1107.75 | 2228.14 | 0.14 | 0.12 | |
| 5 | D ~ (t) g0 ~ (s) σ ~ (s) | 6 | −1108.11 | 2228.87 | 0.87 | 0.08 | |
| 6 | D ~ (t) g0 ~ (.) σ ~ (.) | 4 | −1110.42 | 2229.14 | 1.14 | 0.07 | |
| 7 | D ~ (t) g0 ~ (p) σ ~ (p) | 6 | −1108.28 | 2229.21 | 1.21 | 0.07 | |
| 8 | D ~ (t + p × r) g0 ~ (s) σ ~ (s) | 9 | −1105.21 | 2229.82 | 1.82 | 0.05 | |
| 9 | D ~ (t + p × r) g0 ~ (.) σ ~ (.) | 7 | −1107.51 | 2229.89 | 1.89 | 0.05 |
Models are defined with fox density (D) as constant (.), or varying according to treatment (t), period (p) and region (r). Parameters g0 (likelihood of detection) and σ (spatial scale) are defined as constant (.), or varying according to period (p) or sex (s). Number of parameters (npar), LogLk, ΔAICC and AICCwt follow Burnham and Anderson (2002). Only models within two AICc of the top-ranked model are provided. See Table S1 of the Supplementary material for models ranked 10–22.
The top-ranked model contained an effect of sex on the detectability parameters, an interaction between treatment and period and an additive effect of region, indicating some evidence for an effect of baiting on fox density (Table 4; Fig. 4). However, uncertainty around the interaction term was wide (0.55; 95% CI: −0.17–1.26), and two other models without this interaction term received similar support (Table 4). The top-ranked model suggested that g0 was lower for female foxes (0.05; 95% CI: 0.04–0.08) than male foxes (0.08; 95% CI: 0.06–0.12). However, the σ value was larger for female foxes (726.78 m; 95% CI: 606.52–870.88), as compared with male foxes (569.01 m; 95% CI: 481.51–672.41).
Predicted fox density estimates (±95% CI). Density was derived from scat genetic analysis and spatially explicit capture–recapture analysis. Estimates for non-treatment sites are light grey and treatment sites are black. Panels show estimates for the top-ranked model in the (a) Wimmera and (b) Mallee regions.
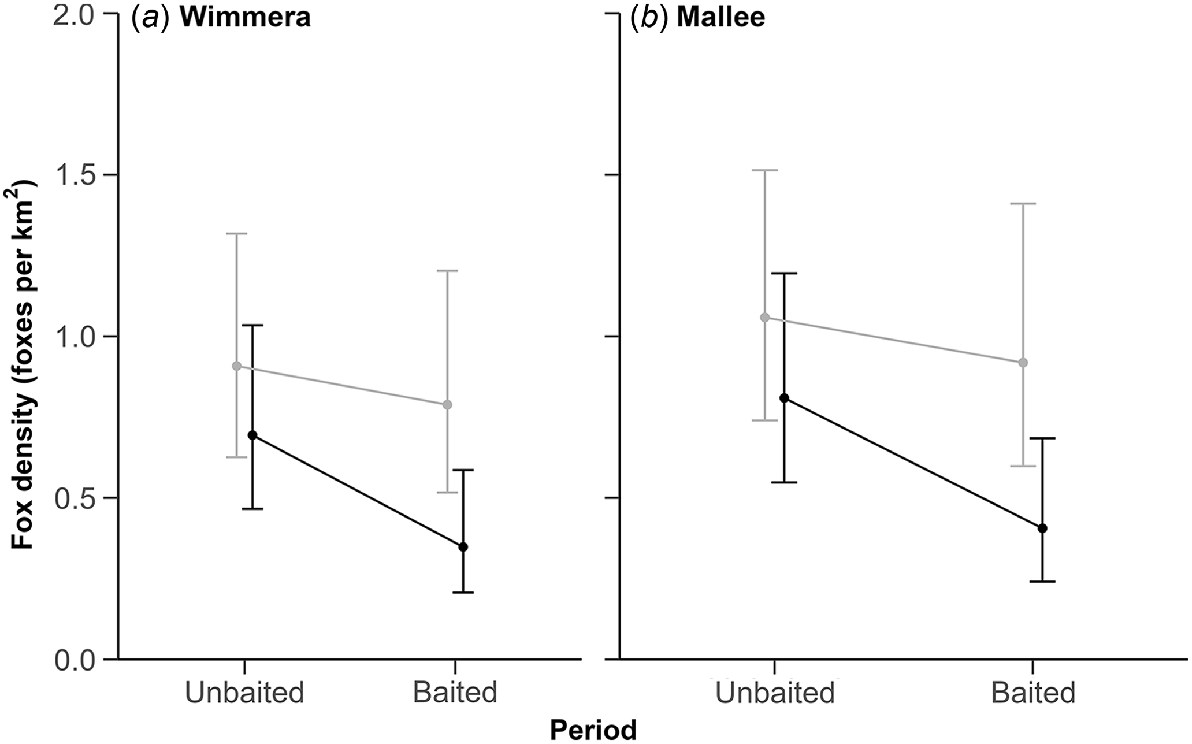
The top-ranked model suggested that fox densities were similar between regions (Fig. 4). Density estimates in the unbaited period ranged from 0.69 (95% CI: 0.47–1.0) to 1.06 (95% CI: 0.74–1.51) foxes km−2 across regions. Precision was highest at each site and region in the unbaited period, with RSE ≤ 20% (Table S3). Fox densities in both regions declined more at treatment sites (35–40% decline) than non-treatment sites (12–14% decline) between the survey periods, although confidence intervals still overlapped pre-baiting estimates (Fig. 4).
Discussion
Measuring the effectiveness of lethal predator control is crucial for determining appropriate management actions (Reddiex et al. 2006; Doherty and Ritchie 2017). Fox activity derived from camera traps showed no evidence of an effect of baiting but a high degree of variation among study sites and regions. Fox density estimates from scat genotyping were more consistent across regions and survey periods. There was weak evidence of a post-baiting decline in fox density, but a substantial number of individuals survived the baiting events in both regions. Our estimate of 0.69–1.06 foxes km−2 is the first empirical baseline fox density for semi-arid Victoria. Uncertainty around density estimates was much lower than uncertainty around activity estimates. Further increases in precision could be obtained by increasing the number of replicate surveys and genotyping success. This would likely increase statistical power to detect an effect of baiting on fox density if present. Our findings demonstrate the importance of high-quality information on predator density in the design and monitoring of predator management, as well as the need for cautious interpretation of relative abundance indices as standalone metrics.
Fox activity
Our top-ranked model of fox activity, derived from the AMPE camera trap data, provided no evidence that baiting decreased fox activity. Instead, fox activity differed greatly between the two regions. This variation was likely due to camera error and low sample size rather than a reflection of true difference. Three of the 20 camera traps in the Wimmera failed and did not record any photos. Others produced false zeros or were poorly aligned, leading to consistently low and imprecise fox capture rates.
Environmental factors may also have influenced fox behaviour and therefore detectability and activity. Fox activity was higher at the Mallee non-treatment site, perhaps because cameras at this smaller site tended to be closer to habitat edges and roads, where fox activity is known to concentrate (Šálek et al. 2010; Hradsky et al. 2017). Furthermore, fox breeding (winter) and cub births (spring) coincided with unbaited survey periods, and the baited survey periods included the dispersal season (autumn) (Pech et al. 1992). Seasonal changes in movement behaviour (such as females provisioning for cubs) may have also contributed to the higher initial fox activity at the Mallee non-treatment site. However, the expected increase in fox activity from cub independence and dispersal is not seen in the baited period. Although activity counts from camera traps are commonly employed to evaluate the outcomes of fox baiting (Towerton et al. 2011; van Hespen et al. 2019), these metrics may have limited value when population densities are low, or when environmental factors – or baiting – alter fox behaviour (Sollmann et al. 2013; Stephens et al. 2015). Our findings reiterate that under such circumstances, camera traps may not receive sufficient capture rates to detect population change.
Trapping rates on cameras in the Wimmera were similar to rates from two baited studies in similar bioregions: nearby in the Grampians, approximately 100 km to the south-east (2.35 foxes per 100 trap nights; Ramsey et al. 2015), and from semi-arid Western Australia (2.28 foxes per 100 trap nights; Thompson et al. 2019). However, the Mallee camera trapping rate was substantially smaller than the rate of approximately 24.67 foxes per 100 trap nights recorded at the same non-treatment site 4 years prior to our study (van Hespen et al. 2019). The discrepancy between these trapping rates is likely caused by differences in how consecutive captures on cameras were handled: we used a 30-min interval to class detections as ‘independent’, whereas van Hespen et al. (2019) used 5 min.
Spatially explicit capture–recapture
Our top model of fox density, derived from the scat genotyping data, provided weak evidence of an effect of baiting on fox density. Fox densities were similar across both regions prior to baiting, and there was some evidence that densities at the treatment sites declined more than at the non-treatment sites among the survey periods. It is important to note that fox densities at the treatment sites may have been impacted by prior baiting events. This may explain the tendency toward lower densities in treatment than non-treatment sites prior to baiting. The BACI design allowed us to quantify the effects of the next management pulse on the fox populations, while controlling for seasonal changes by monitoring changes in the non-impact landscapes. However, it was likely to be conservative in terms of quantifying an overall impact of baiting on unmanaged fox populations.
The identification of individual foxes using microsatellite genetic markers provided powerful information on fox survival rates in the baited period, revealing that more than half the foxes at each treatment site were unaffected by management actions. These foxes may not be encountering baits, not consuming baits or not consuming baits while the baits contain toxic levels of 1080. This suggests that managers need to explore options for improving population knockdown rates (rather than focus on reducing immigration). Such options could include modifying the baiting regime or method of bait delivery. For example, to increase the number of baits available to each fox, managers could increase bait density or the frequency of baiting (Saunders and McLeod 2007; Towerton et al. 2016). The likelihood of foxes consuming a toxic dose will decrease with bait avoidance and caching (Allsop et al. 2017). Trialling other bait matrices to improve palatability (Van Polanen Petel et al. 2001), trialling other poisons with greater efficacy (Southwell et al. 2011; Gentle et al. 2017) or combining baits with canid pest ejectors (Marks et al. 2002) may result in more rapid consumption of baits. Scat genetic analysis is evidently a valuable technique to refine baiting and monitoring regimes and for estimating fox densities.
Our study was able to establish the first empirical density estimates of fox populations for the semi-arid regions of Victoria. These estimates are broadly comparable with those from other semi-arid and arid grazing habitat in Australia (e.g. Marlow 1992; Marlow et al. 2000; Berry et al. 2012). They are higher than estimated densities from the Grampians, approximately 100 km south-east, which estimated 0.22 foxes km−2 using presence–absence camera trap data of foxes without individual identification (Ramsey et al. 2015). Our density estimates are also substantially greater than those from the closest analogous bioregion (approximately 200 km north-west). Here, concurrent GPS collaring and camera trap spatially explicit mark–resight analysis provided estimates of 0.05–0.14 foxes km−2 (Carter et al. 2019). In contrast, however, densities were substantially lower than those observed in Australian urban and temperate agricultural habitats (Coman et al. 1991; Thompson and Fleming 1994; Marks and Bloomfield 1999; Berghout 2001; Gentle 2005); this was expected because foxes have larger home ranges and occur at lower densities when productivity is low.
Comparison of metrics
Despite considerable uncertainty associated with all metrics, density estimates produced consistently lower RSEs than the activity indices, indicating that scat genetic analysis had a greater capacity to detect a change in fox populations, if one occurred. One potential reason for this is that our scat survey transects covered a larger area than the camera arrays and were therefore likely to produce less variation in sample size and more-precise estimates (Güthlin et al. 2014b).
Further, operating error and seasonal variation in fox behaviour led to low and variable fox capture rates on the camera traps. Activity indices can be skewed if detections are sparse or variable (Sollmann et al. 2013). Where capture rates are low, as exemplified in the Wimmera region, an activity index will be biased by detectability and thus have limited capacity to infer trends in density (Sollmann et al. 2013; Stephens et al. 2015). Nonetheless, our activity models indicated some promise for inferring population density: Mallee fox activity approximately corresponded with the suggested decline in density produced by SECR analysis. This suggests that camera trap activity indices may have the potential to parallel trends in density, given appropriate capture rates.
Survey design – camera activity index
Simple changes that optimised survey effort would likely improve the statistical power of the camera survey design. Although increasing the survey period would reduce uncertainty in our spatially replicated study, it is irrelevant for long-term monitoring programs such as the AMPE. Instead, survey effort would best be increased by ensuring that all cameras are functioning and not obscured. The detection rate of foxes at each camera could also be increased by placing cameras at areas of higher fox activity, such as on tracks (Mann et al. 2015; Carter et al. 2019; Geyle et al. 2020). However, camera placement on tracks has several limitations that need to be considered, including spatial variation in track networks and capture rates (e.g. Carter et al. 2019; Kolowski et al. 2021), and temporal variation in fox behaviour, such as dispersal patterns (Soulsbury et al. 2011). On-track cameras may also be logistically difficult for long-term monitoring programs due to concerns of theft and vandalism (e.g. Foster 2008; A. Watkins, pers. comm., May 2020). Lures and attractants may be an alternative to increase fox visitation rate and therefore capture rate (Meek et al. 2014) but again, may raise logistical concerns with maintenance.
Survey design – scat genotyping for density estimates
With spatially explicit capture–recapture analyses, the precision of the density estimate increases as the number of unique individuals and recaptures increases (albeit, non-linearly). That is, the relative standard error of the density estimate is inversely related to the square root of the minimum of either the number of unique individuals genotyped or the number of recapture events (Efford and Boulanger 2019). In our study, the number of individuals and recaptures were acceptably high (>20) for most of the unbaited surveys but were generally low (<10) during the baited surveys at both treatment and non-treatment sites. This likely reduced the statistical power of our study to detect an effect of fox baiting on fox densities, if one occurred (Efford and Boulanger 2019). Sample sizes could be boosted by improving genotyping success. Of the collected scat samples, only 42% of scats with extracted DNA were assigned individual identities, a rate comparable with similar nearby studies (Piggott et al. 2008; A. Weeks, unpubl. data). Degradation of scat DNA from environmental exposure can significantly increase microsatellite genotyping error (Murphy et al. 2007; Brinkman et al. 2010). Our survey periods overlapped extreme weather events, which exposed scat DNA to thunderstorms, dust storms and long intervals between collections. These conditions also prevented us conducting several surveys in the post-baiting sessions; more repeat surveys would have resulted in the collection of more scats for these sessions.
Three key assumptions may also have impacted the accuracy of our density estimates, primarily through bias in fox detectability. First, we assumed equal scat collection survey effort among observers. If observer experience affected detection of individual foxes, the detectability component of the SECR model may have underestimated fox density (Borchers and Efford 2008). Second, we assumed that fox detectability followed a half-normal function, and therefore that large detection distances were improbable. Given that a transect survey design only informs fox detection within two directions of its activity centre, a half-normal detection function is a conservative estimate of detection probability (Efford 2011; Efford et al. 2016; Efford 2019). Third, our primary survey sessions were paired and relatively short, so we assumed demographic closure within a survey session. The ‘secr’ closure test function confirmed all sites and periods were closed to gains and losses, except the Mallee non-treatment site in the baited period where data were insufficient to test for violation detect (Efford et al. 2009). However, baited surveys may have captured transient foxes due to timing of juvenile independence and subadult dispersal (Pech et al. 1992). Where possible, we advise future studies to time scat collection surveys during periods of stable fox population dynamics to minimise any confounding effects of season, or to repeat surveying to lower this uncertainty.
Management implications
Our study highlights the many challenges that face land managers when monitoring and managing a cryptic, wide-ranging invasive predator. We reiterate the importance of rigorous study design and setup in detecting population change. Camera traps can be a long-term and cost-effective option for detecting elusive, low-density species (Cutler and Swann 1999; Moruzzi et al. 2002). However, without an informed power analysis or pilot study, poor detection rates and limited numbers of cameras can reduce their power to detect changes in predator activity, so careful consideration must be given to the make and number of cameras, their set-up, positioning and maintenance (Meek et al. 2015; Newey et al. 2015; Findlay et al. 2020; Kolowski et al. 2021). Additionally, activity indices are prone to bias if behavioural changes from baiting, season or habitat affect detectability, obscuring changes in density (Sollmann et al. 2013; Güthlin et al. 2014b; Stephens et al. 2015).
Non-invasive scat genetic analysis is a powerful alternative for detecting predators and monitoring population change (e.g. Gopalaswamy et al. 2012; Anile et al. 2014; Rodgers et al. 2014; Wegge et al. 2019). This methodology can be used to inform management actions, providing useful information on relatedness, survival and population turnover, as well as direct density estimates to refine baiting and monitoring programs, or as an initial reference value for individual-based population simulations (e.g. Hradsky et al. 2019). Technological advances are expected to reduce costs and increase genotyping success rates, improving precision in density estimates and making scat collection more cost-efficient (Morin and McCarthy 2007; A. Weeks, unpubl. data). However, scat genetic analysis, paired with SECR, provides only ‘snapshots’ of density in time, and is unlikely to be financially suitable for continuous monitoring of invasive predator populations.
Camera trap surveys and scat genetic analysis are potentially most useful in tandem, because they can provide multiple lines of evidence about the effectiveness of invasive predator management. Where density estimates achieve a desirable level of precision, they could also be used to calibrate activity indices (e.g. Hopkins and Kennedy 2004; Siddig et al. 2015). Exploring these two metrics collectively has the potential to improve overall monitoring; for example, density estimates from SECR could be used to design appropriate camera trap arrays, and camera traps could locate hotspot areas of fox activity to target scat collection.
Our study is one of the few existing comparisons of relative and absolute predator population density metrics under lethal management actions. Our results suggested some evidence of an effect of baiting on fox density but also high survival rates, a finding supported by a similar study in the wet forests of southern Victoria, Australia (Le Pla et al. 2022). We therefore add to the growing body of literature emphasising the importance of evidence-based management actions. Above all, we demonstrate the many challenges associated with the monitoring and management of invasive mammalian predators, and the need for cautious interpretation of relative abundance indices as standalone metrics.
Data availability
Analyses reported in this study can be reproduced using the data available via Zenodo: https://doi.org/10.5281/zenodo.5883417 (Keem et al. 2022).
Declaration of funding
This study was funded by the State of Victoria through the Department of Environment, Land, Water and Planning TP829577: Optimising non-invasive genetic sampling strategies to evaluate predator control efficacy and impacts on native fauna.
Acknowledgements
We pay our respects to the Traditional Owners of the land on which research was conducted: Wotjobaluk, Jaadwa, Jadawadjali, Wergaia and Jupagulk Nations of the Wimmera region, and Kureinji, Ngintait, Nyeri Nyeri, Latji Latji, Tatti Tatti, Wadi Wadi and Maraura Nations of the Mallee land and waterways. This project was approved by the Science Animal Ethics Committee at the University of Melbourne (project ID 1914959.1). The Department of Environment, Land, Water and Planning (DELWP) granted a wildlife permit (no. 10009227) for this study, which adhered to the Wildlife Act 1975 and the National Parks Act 1975. We thank Parks Victoria and the Mallee Catchment Management Authority, especially Derrick Boord. Thank you to the National Malleefowl Recovery Team and the Victorian Malleefowl Recovery Group for ongoing support, in particular Iestyn Hosking, Mirinda Thorpe, Ronni O’Donnell, Tom O’Donnell, Stuart Thorpe and Kerrie Thorpe. Thank you to fieldwork volunteers Natalie Bates, Stefanie Jones, Laura Kors, Stella Johnston, Hannah Glasson, Annabel Cadzon, Kathy Keem, Hayden Keem, Erin Thomas and Eliza Thompson. We thank Matthew Rees, Brendan Wintle, José Lahoz-Monfort and two anonymous reviewers for useful comments and research guidance.
References
Allsop SE, Dundas SJ, Adams PJ, Kreplins TL, Bateman PW, Fleming PA (2017) Reduced efficacy of baiting programs for invasive species: some mechanisms and management implications. Pacific Conservation Biology 23, 240-257.
| Crossref | Google Scholar |
Anile S, Ragni B, Randi E, Mattucci F, Rovero F (2014) Wildcat population density on the Etna volcano, Italy: a comparison of density estimation methods. Journal of Zoology 293, 252-261.
| Crossref | Google Scholar |
Benshemesh J, Stokie P, Thompson D, Irvin J, Macfarlane N, Willis K, Willis C, Cattanach P, Bannerman M, Davies S (2014) Motion-sensitive cameras for monitoring a range of animals in malleefowl monitoring sites. In ‘Proceedings of the 5th National Malleefowl Forum’. pp. 151–161. (Printak Pty Ltd: Adelaide, South Australia)
Benshemesh J, Southwell DM, Lahoz-Monfort JJ, Hauser CE, Rumpff L, Bode M, Burnard T, Wintle BA (2018) The national malleefowl monitoring effort: citizen scientists, databases and adaptive management. In ‘Monitoring threatened species and ecological communities’. (Eds S Legge, DB Lindenmayer, NM Robinson, BC Scheele, DM Southwell, BA Wintle) pp. 389–398. (CSIRO Publishing: Australia)
Berry O, Sarre SD, Farrington L, Aitken N (2007) Faecal DNA detection of invasive species: the case of feral foxes in Tasmania. Wildlife Research 34, 1-7.
| Crossref | Google Scholar |
Berry O, Algar D, Angus J, Hamilton N, Hilmer S, Sutherland D (2012) Genetic tagging reveals a significant impact of poison baiting on an invasive species. The Journal of Wildlife Management 76, 729-739.
| Crossref | Google Scholar |
Blacket MJ, Robin C, Good RT, Lee SF, Miller AD (2012) Universal primers for fluorescent labelling of PCR fragments – an efficient and cost-effective approach to genotyping by fluorescence. Molecular Ecology Resources 12, 456-463.
| Crossref | Google Scholar | PubMed |
Blasco-Moreno A, Pérez-Casany M, Puig P, Morante M, Castells E (2019) What does a zero mean? Understanding false, random and structural zeros in ecology. Methods in Ecology and Evolution 10, 949-959.
| Crossref | Google Scholar |
Borchers DL, Efford MG (2008) Spatially explicit maximum likelihood methods for capture–recapture studies. Biometrics 64, 377-385.
| Crossref | Google Scholar | PubMed |
Brinkman TJ, Schwartz MK, Person DK, Pilgrim KL, Hundertmark KJ (2010) Effects of time and rainfall on PCR success using DNA extracted from deer fecal pellets. Conservation Genetics 11, 1547-1552.
| Crossref | Google Scholar |
Bureau of Meteorology (2020a) Climate statistics for Australian locations: Nhill. Available at http://www.bom.gov.au/climate/averages/tables/cw_078086.shtml [accessed 21 July 2020]
Bureau of Meteorology (2020b) Climate statistics for Australian locations: Ouyen. Available at http://www.bom.gov.au/climate/averages/tables/cw_076047.shtml [accessed 21 July 2020]
Burnham KP, Anderson DR (2002) ‘Model selection and multimodel inference: a practical information-theoretic approach.’ 2nd edn. (Springer-Verlag: New York) doi:10.1007/b97636
Calhoun JB, Casby JU (1958) Calculation of home range and density of small mammals. Public Health Monograph 55, 1-24.
| Google Scholar | PubMed |
Carter A, Luck GW, Mcdonald SP (2012) Ecology of the red fox (Vulpes vulpes) in an agricultural landscape. 2. Home range and movements. Australian Mammalogy 34, 175-187.
| Crossref | Google Scholar |
Carter A, Potts JM, Roshier DA (2019) Toward reliable population density estimates of partially marked populations using spatially explicit mark–resight methods. Ecology and Evolution 9, 2131-2141.
| Crossref | Google Scholar | PubMed |
Clayton R, Cowan P (2010) Management of animal and plant pests in New Zealand – patterns of control and monitoring by regional agencies. Wildlife Research 37, 360-371.
| Crossref | Google Scholar |
Coman BJ, Robinson J, Beaumont C (1991) Home range, dispersal and density of red foxes (Vulpes vulpes L.) in central Victoria. Wildlife Research 18, 215-223.
| Crossref | Google Scholar |
Cutler TL, Swann DE (1999) Using remote photography in wildlife ecology: a review. Wildlife Society Bulletin (1973-2006) 27, 571-581.
| Google Scholar |
Daniels MJ, Beaumont MA, Johnson PJ, Balharry D, Macdonald DW, Barratt E (2001) Ecology and genetics of wild-living cats in the north-east of Scotland and the implications for the conservation of the wildcat. Journal of Applied Ecology 38, 146-161.
| Crossref | Google Scholar |
Doherty TS, Ritchie EG (2017) Stop jumping the gun: a call for evidence-based invasive predator management. Conservation Letters 10, 15-22.
| Crossref | Google Scholar |
Doherty TS, Glen AS, Nimmo DG, Ritchie EG, Dickman CR (2016) Invasive predators and global biodiversity loss. Proceedings of the National Academy of Sciences 113, 11261-11265.
| Crossref | Google Scholar |
Efford MG (2011) Estimation of population density by spatially explicit capture–recapture analysis of data from area searches. Ecology 92, 2202-2207.
| Crossref | Google Scholar | PubMed |
Efford MG (2019) Non-circular home ranges and the estimation of population density. Ecology 100, e02580.
| Crossref | Google Scholar | PubMed |
Efford MG (2020) secr: spatially explicit capture–recapture models. R package version 4.3. Available at https://CRAN.R-project.org/package=secr
Efford MG, Boulanger J (2019) Fast evaluation of study designs for spatially explicit capture–recapture. Methods in Ecology and Evolution 10, 1529-1535.
| Crossref | Google Scholar |
Efford MG, Dawson DK, Jhala YV, Qureshi Q (2016) Density-dependent home-range size revealed by spatially explicit capture–recapture. Ecography 39, 676-688.
| Crossref | Google Scholar |
FastStone (2020) FastStone Image Viewer. Available at https://www.faststone.org/. [accessed 24 October 2020]
Findlay MA, Briers RA, White PJC (2020) Component processes of detection probability in camera-trap studies: understanding the occurrence of false-negatives. Mammal Research 65, 167-180.
| Crossref | Google Scholar |
Fleming PJS, Ballard G, Reid NCH, Tracey JP (2017) Invasive species and their impacts on agri-ecosystems: issues and solutions for restoring ecosystem processes. The Rangeland Journal 39, 523-545.
| Crossref | Google Scholar |
Francisco LV, Langsten AA, Mellersh CS, Neal CL, Ostrander EA (1996) A class of highly polymorphic tetranucleotide repeats for canine genetic mapping. Mammalian Genome 7, 359-362.
| Crossref | Google Scholar | PubMed |
Gentle M, Speed J, Allen BL, Harris S, Haapakoski H, Bell K (2017) The longevity of para-aminopropiophenone (PAPP) wild dog baits and the implications for effective and safe baiting campaigns. Environmental Science and Pollution Research International 24, 12338-12346.
| Crossref | Google Scholar | PubMed |
Geyle HM, Stevens M, Duffy R, Greenwood L, Nimmo DG, Sandow D, Thomas B, White J, Ritchie EG (2020) Evaluation of camera placement for detection of free-ranging carnivores; implications for assessing population changes. Ecological Solutions and Evidence 1, e12018.
| Crossref | Google Scholar |
Gopalaswamy AM, Royle JA, Delampady M, Nichols JD, Karanth KU, Macdonald DW (2012) Density estimation in tiger populations: combining information for strong inference. Ecology 93, 1741-1751.
| Crossref | Google Scholar | PubMed |
Greentree C, Saunders G, Mcleod L, Hone J (2000) Lamb predation and fox control in south-eastern Australia. Journal of Applied Ecology 37, 935-943.
| Crossref | Google Scholar |
Güthlin D, Storch I, Küchenhoff H (2014a) Is it possible to individually identify red foxes from photographs? Wildlife Society Bulletin 38, 205-210.
| Crossref | Google Scholar |
Güthlin D, Storch I, Küchenhoff H (2014b) Toward reliable estimates of abundance: comparing index methods to assess the abundance of a mammalian predator. PLoS ONE 9, e94537.
| Crossref | Google Scholar | PubMed |
Harris DB, Macdonald DW (2007) Interference competition between introduced black rats and endemic galápagos rice rats. Ecology 88, 2330-2344.
| Crossref | Google Scholar | PubMed |
Hartig F (2020) DHARMa: residual diagnostics for hierarchical (multi-level/mixed) regression models. R package 0.3.2.0. Available at https://cran.r-project.org/web/packages/DHARMa/index.html
Hauser CE, Southwell D, Lahoz-Monfort JJ, Rumpff L, Benshemesh J, Burnard T, van Hespen R, Wright J, Wintle B, Bode M (2019) Adaptive management informs conservation and monitoring of Australia’s threatened malleefowl. Biological Conservation 233, 31-40.
| Crossref | Google Scholar |
Holmes NG, Dickens HF, Parker HL, Binns MM, Mellersh CS, Sampson J (1995) Eighteen canine microsatellites. Animal Genetics 26, 132-133.
| Crossref | Google Scholar | PubMed |
Hopkins HL, Kennedy ML (2004) An assessment of indices of relative and absolute abundance for monitoring populations of small mammals. Wildlife Society Bulletin 32, 1289-1296.
| Crossref | Google Scholar |
Hradsky BA, Robley A, Alexander R, Ritchie EG, York A, Di Stefano J (2017) Human-modified habitats facilitate forest-dwelling populations of an invasive predator, Vulpes vulpes. Scientific Reports 7, 12291.
| Crossref | Google Scholar | PubMed |
Hradsky BA, Kelly LT, Robley A, Wintle BA (2019) FoxNet: an individual-based model framework to support management of an invasive predator, the red fox. Journal of Applied Ecology 56, 1460-1470.
| Crossref | Google Scholar |
Hunter DO, Lagisz M, Leo V, Nakagawa S, Letnic M (2018) Not all predators are equal: a continent-scale analysis of the effects of predator control on Australian mammals. Mammal Review 48, 108-122.
| Crossref | Google Scholar |
Immell D, Anthony RG (2008) Estimation of black bear abundance using a discrete DNA sampling device. Journal of Wildlife Management 72, 324-330.
| Crossref | Google Scholar |
Keem JL, Hradsky B, Benshemesh J, Le Pla M, Watkins A, Weeks AR, van Rooyen A, Black J, Southwell D (2022) Data from: Evaluating predator control using two non-invasive population metrics: a camera trap activity index and density estimation from scat genotyping. [Dataset]. Zenodo. Available at https://doi.org/10.5281/zenodo.5883417
Kolowski JM, Oley J, McShea WJ (2021) High-density camera trap grid reveals lack of consistency in detection and capture rates across space and time. Ecosphere 12, e03350.
| Crossref | Google Scholar |
Lazenby BT, Mooney NJ, Dickman CR (2014) Effects of low-level culling of feral cats in open populations: a case study from the forests of southern Tasmania. Wildlife Research 41, 407-420.
| Crossref | Google Scholar |
Le Pla MN, Birnbaum EK, Rees MW, Hradsky BA, Weeks AR, Van Rooyen A, Pascoe JH (2022) Genetic sampling and an activity index indicate contrasting outcomes of lethal control for an invasive predator. Austral Ecology 47, 1062-1076.
| Crossref | Google Scholar |
Lonsinger RC, Lukacs PM, Gese EM, Knight RN, Waits LP (2018) Estimating densities for sympatric kit foxes (Vulpes macrotis) and coyotes (Canis latrans) using noninvasive genetic sampling. Canadian Journal of Zoology 96, 1080-1089.
| Crossref | Google Scholar |
Lowe S, Browne M, Boudjelas S, Poorter M (2000) ‘100 of the world’s worst invasive alien species: a selection from the global invasive species database.’ (Invasive Species Specialist Group: Auckland, New Zealand) doi:10.1525/9780520948433-159
Magnusson A, Skaug H, Nielsen A, Berg C, Kristensen K, Maechler M, Bentham K van, Bolker B, Lüdecke D, Lenth R, O’Brien J, Geyer CJ, McGillycuddy M, Brooks M (2021) glmmTMB: generalized linear mixed models using template model builder. Available at https://CRAN.R-project.org/package=glmmTMB [accessed 22 August 2021]
Mann GKH, O’Riain MJ, Parker DM (2015) The road less travelled: assessing variation in mammal detection probabilities with camera traps in a semi-arid biodiversity hotspot. Biodiversity and Conservation 24, 531-545.
| Crossref | Google Scholar |
Manning AD, Andrewartha TA, Blencowe A, Brewer K, Gordon IJ, Evans MJ (2021) Bettering the devil you know: can we drive predator adaptation to restore native fauna? Conservation Science and Practice 3, e447.
| Crossref | Google Scholar |
Marks CA, Bloomfield TE (1999) Distribution and density estimates for urban foxes (Vulpes vulpes) in Melbourne: implications for rabies control. Wildlife Research 26, 763-775.
| Crossref | Google Scholar |
Marks CA, Gigliotti F, Busana F (2002) Estimated 1080 dose rate for the M-44 ejector for the control of red foxes (Vulpes vulpes). Wildlife Research 29, 291-294.
| Crossref | Google Scholar |
Marks CA, Gigliotti F, McPhee S, Piggott MP, Taylor A, Glen AS (2009) DNA genotypes reveal red fox (Vulpes vulpes) abundance, response to lethal control and limitations of contemporary survey techniques. Wildlife Research 36, 647-658.
| Crossref | Google Scholar |
Marlow NJ, Thomson PC, Algar D, Rose K, Kok NE, Sinagra JA (2000) Demographic characteristics and social organisation of a population of red foxes in a rangeland area in Western Australia. Wildlife Research 27, 457-464.
| Crossref | Google Scholar |
Meek PD, Ballard G, Claridge A, Kays R, Moseby K, O’Brien T, O’Connell A, Sanderson J, Swann DE, Tobler M, Townsend S (2014) Recommended guiding principles for reporting on camera trapping research. Biodiversity and Conservation 23, 2321-2343.
| Crossref | Google Scholar |
Meek PD, Ballard G-A, Fleming PJS, Meek PD, Ballard G-A, Fleming PJS (2015) The pitfalls of wildlife camera trapping as a survey tool in Australia. Australian Mammalogy 37, 13-22.
| Crossref | Google Scholar |
Morin PA, McCarthy M (2007) Highly accurate SNP genotyping from historical and low-quality samples. Molecular Ecology Notes 7, 937-946.
| Crossref | Google Scholar |
Morin DJ, Waits LP, McNitt DC, Kelly MJ (2018) Efficient single-survey estimation of carnivore density using fecal DNA and spatial capture–recapture: a bobcat case study. Population Ecology 60, 197-209.
| Crossref | Google Scholar |
Moruzzi TL, Fuller TK, DeGraaf RM, Brooks RT, Li W (2002) Assessing remotely triggered cameras for surveying carnivore distribution. Wildlife Society Bulletin (1973-2006) 30, 380-386.
| Google Scholar |
Murphy MA, Kendall KC, Robinson A, Waits LP (2007) The impact of time and field conditions on brown bear (Ursus arctos) faecal DNA amplification. Conservation Genetics 8, 1219-1224.
| Crossref | Google Scholar |
Nakagawa S, Schielzeth H (2013) A general and simple method for obtaining R2 from generalized linear mixed-effects models. Methods in Ecology and Evolution 4, 133-142.
| Crossref | Google Scholar |
Nakashima Y, Fukasawa K, Samejima H (2018) Estimating animal density without individual recognition using information derivable exclusively from camera traps. Journal of Applied Ecology 55, 735-744.
| Crossref | Google Scholar |
Newey S, Davidson P, Nazir S, Fairhurst G, Verdicchio F, Irvine RJ, van der Wal R (2015) Limitations of recreational camera traps for wildlife management and conservation research: a practitioner’s perspective. Ambio 44, 624-635.
| Crossref | Google Scholar | PubMed |
Niedballa J, Sollmann R, Courtiol A, Wilting A (2016) camtrapR: an R package for efficient camera trap data management. Methods in Ecology and Evolution 7, 1457-1462.
| Crossref | Google Scholar |
Norbury G (2001) Conserving dryland lizards by reducing predator-mediated apparent competition and direct competition with introduced rabbits. Journal of Applied Ecology 38, 1350-1361.
| Crossref | Google Scholar |
Palmer MS, Swanson A, Kosmala M, Arnold T, Packer C (2018) Evaluating relative abundance indices for terrestrial herbivores from large-scale camera trap surveys. African Journal of Ecology 56, 791-803.
| Crossref | Google Scholar |
Peakall R, Smouse PE (2012) GenAlEx 6.5: genetic analysis in Excel. Population genetic software for teaching and research – an update. Bioinformatics 28, 2537-2539.
| Crossref | Google Scholar | PubMed |
Pech RP, Sinclair ARE, Newsome AE, Catling PC (1992) Limits to predator regulation of rabbits in Australia: evidence from predator-removal experiments. Oecologia 89, 102-112.
| Crossref | Google Scholar | PubMed |
Piggott MP (2004) Effect of sample age and season of collection on the reliability of microsatellite genotyping of faecal DNA. Wildlife Research 31, 485-493.
| Crossref | Google Scholar |
Piggott MP, Taylor AC (2003) Extensive evaluation of faecal preservation and DNA extraction methods in Australian native and introduced species. Australian Journal of Zoology 51, 341-355.
| Crossref | Google Scholar |
Piggott MP, Wilson R, Banks SC, Marks CA, Gigliotti F, Taylor AC (2008) Evaluating exotic predator control programs using non-invasive genetic tagging. Wildlife Research 35, 617-624.
| Crossref | Google Scholar |
Proffitt KM, Garrott R, Gude JA, Hebblewhite M, Jimenez B, Paterson JT, Rotella J (2020) Integrated carnivore-ungulate management: a case study in West-Central Montana. Wildlife Monographs 206, 1-28.
| Crossref | Google Scholar |
Ramsey DSL, Caley PA, Robley A (2015) Estimating population density from presence-absence data using a spatially explicit model: estimating density from presence-absence data. The Journal of Wildlife Management 79, 491-499.
| Crossref | Google Scholar |
Reddiex B, Forsyth DM, McDonald-Madden E, Einoder LD, Griffioen PA, Chick RR, Robley AJ (2006) Control of pest mammals for biodiversity protection in Australia. I. Patterns of control and monitoring. Wildlife Research 33, 691-709.
| Crossref | Google Scholar |
Robinson OJ, Fefferman NH, Lockwood JL (2013) How to effectively manage invasive predators to protect their native prey. Biological Conservation 165, 146-153.
| Crossref | Google Scholar |
Rodgers TW, Giacalone J, Heske EJ, Janečka JE, Phillips CA, Schooley RL (2014) Comparison of noninvasive genetics and camera trapping for estimating population density of ocelots (Leopardus Pardalis) on Barro Colorado Island, Panama. Tropical Conservation Science 7, 690-705.
| Crossref | Google Scholar |
Rowcliffe JM, Field J, Turvey ST, Carbone C (2008) Estimating animal density using camera traps without the need for individual recognition. Journal of Applied Ecology 45, 1228-1236.
| Crossref | Google Scholar |
Royle JA, Young KV (2008) A hierarchical model for spatial capture–recapture data. Ecology 89, 2281-2289.
| Crossref | Google Scholar | PubMed |
Ruell EW, Riley SPD, Douglas MR, Pollinger JP, Crooks KR (2009) Estimating bobcat population sizes and densities in a fragmented urban landscape using noninvasive capture–recapture sampling. Journal of Mammalogy 90, 129-135.
| Crossref | Google Scholar |
Sadlier LMJ, Webbon CC, Baker PJ, Harris S (2004) Methods of monitoring red foxes Vulpes vulpes and badgers Meles meles: are field signs the answer? Mammal Review 34, 75-98.
| Crossref | Google Scholar |
Šálek M, Kreisinger J, Sedláček F, Albrecht T (2010) Do prey densities determine preferences of mammalian predators for habitat edges in an agricultural landscape? Landscape and Urban Planning 98, 86-91.
| Crossref | Google Scholar |
Saunders GR, Gentle MN, Dickman CR (2010) The impacts and managezment of foxes Vulpes vulpes in Australia: impact and management of foxes in Australia. Mammal Review 40, 181-211.
| Crossref | Google Scholar |
Schaus J, Uzal A, Gentle LK, Baker PJ, Bearman-Brown L, Bullion S, Gazzard A, Lockwood H, North A, Reader T, Scott DM, Sutherland CS, Yarnell RW (2020) Application of the Random Encounter Model in citizen science projects to monitor animal densities. Remote Sensing in Ecology and Conservation 6, 514-528.
| Crossref | Google Scholar |
Siddig AA, Ellison AM, Jackson S (2015) Calibrating abundance indices with population size estimators of red back salamanders (Plethodon cinereus) in a New England forest. PeerJ 3, e952.
| Crossref | Google Scholar | PubMed |
Sollmann R, Mohamed A, Samejima H, Wilting A (2013) Risky business or simple solution – relative abundance indices from camera-trapping. Biological Conservation 159, 405-412.
| Crossref | Google Scholar |
Soulsbury CD, Iossa G, Baker PJ, White PCL, Harris S (2011) Behavioral and spatial analysis of extraterritorial movements in red foxes (Vulpes vulpes). Journal of Mammalogy 92, 190-199.
| Crossref | Google Scholar |
Southwell D, McCowen S, Mewett O, Hennecke B (2011) Understanding the drivers and barriers towards adoption of innovative canid control technologies: a review. Australian Bureau of Agricultural and Resource Economics and Sciences: report prepared for the Invasive Animals Cooperative Research Centre, Canberra.
Spencer EE, Newsome TM, Dickman CR (2017) Prey selection and dietary flexibility of three species of mammalian predator during an irruption of non-cyclic prey. Royal Society Open Science 4, 170317.
| Crossref | Google Scholar | PubMed |
Stephens PA, Pettorelli N, Barlow J, Whittingham MJ, Cadotte MW (2015) Management by proxy? The use of indices in applied ecology. Journal of Applied Ecology 52, 1-6.
| Crossref | Google Scholar |
Thompson JA, Fleming PJS (1994) Evaluation of the efficacy of 1080 poisoning of red foxes using visitation to non-toxic baits as an index of fox abundance. Wildlife Research 21, 27-39.
| Crossref | Google Scholar |
Thompson GG, Thompson SA, Bengsen A (2019) The value of camera traps in monitoring a feral-cat and fox reduction program. Wildlife Research 46, 599-609.
| Crossref | Google Scholar |
Towerton AL, Penman TD, Kavanagh RP, Dickman CR (2011) Detecting pest and prey responses to fox control across the landscape using remote cameras. Wildlife Research 38, 208-220.
| Crossref | Google Scholar |
Towerton AL, Dickman CR, Kavanagh RP, Penman TD (2016) Control of the red fox in remnant forest habitats. Wildlife Research 43, 169-177.
| Crossref | Google Scholar |
Trewhella WJ, Harris S, McAllister FE (1988) Dispersal distance, home-range size and population density in the red fox (Vulpes vulpes): a quantitative analysis. Journal of Applied Ecology 25, 423-434.
| Crossref | Google Scholar |
van Bommel L, Johnson CN (2012) Good dog! Using livestock guardian dogs to protect livestock from predators in Australia’s extensive grazing systems. Wildlife Research 39, 220-229.
| Crossref | Google Scholar |
van Hespen R, Hauser CE, Benshemesh J, Rumpff L, Monfort JJL (2019) Designing a camera trap monitoring program to measure efficacy of invasive predator management. Wildlife Research 46, 154-164.
| Crossref | Google Scholar |
van Polanen Petel AM, Marks CA, Morgan DG (2001) Bait palatability influences the caching behaviour of the red fox (Vulpes vulpes). Wildlife Research 28, 395-401.
| Crossref | Google Scholar |
Victorian Government Department of Sustainability and Environment (2005a) Ecological vegetation classes: Wimmera bioregion. The State of Victoria Department of Sustainability and Environment. Available at https://www.environment.vic.gov.au/__data/assets/pdf_file/0033/48759/Wim_EVCs_combined.pdf
Victorian Government Department of Sustainability and Environment (2005b) Ecological vegetation classes: Murray Mallee bioregion. The State of Victoria Department of Sustainability and Environment. Available at https://www.environment.vic.gov.au/__data/assets/pdf_file/0026/48734/MuM_EVCs_combined.pdf
Vine SJ, Crowther MS, Lapidge SJ, Dickman CR, Mooney N, Piggott MP, English AW (2009) Comparison of methods to detect rare and cryptic species: a case study using the red fox (Vulpes vulpes). Wildlife Research 36, 436-446.
| Crossref | Google Scholar |
Waits LP, Luikart G, Taberlet P (2001) Estimating the probability of identity among genotypes in natural populations: cautions and guidelines. Molecular Ecology 10, 249-256.
| Crossref | Google Scholar | PubMed |
Walsh JC, Wilson KA, Benshemesh J, Possingham HP (2012) Unexpected outcomes of invasive predator control: the importance of evaluating conservation management actions. Animal Conservation 15, 319-328.
| Crossref | Google Scholar |
Wandeler P, Funk SM (2006) Short microsatellite DNA markers for the red fox (Vulpes vulpes). Molecular Ecology Notes 6, 98-100.
| Crossref | Google Scholar |
Wearn OR, Glover-Kapfer P (2019) Snap happy: camera traps are an effective sampling tool when compared with alternative methods. Royal Society Open Science 6, 181748.
| Crossref | Google Scholar | PubMed |
Wegge P, Bakke BB, Odden M, Rolstad J (2019) DNA from scats combined with capture–recapture modeling: a promising tool for estimating the density of red foxes – a pilot study in a boreal forest in southeast Norway. Mammal Research 64, 147-154.
| Crossref | Google Scholar |
Williams BK, Nichols JD, Conroy MJ (2002) Analysis and management of animal populations: modeling, estimation and decision making. Available at https://pubs.er.usgs.gov/publication/5200256 [accessed 24 January 2022]
Wilson DJ, Mulvey RL, Clarke DA, Reardon JT (2017) Assessing and comparing population densities and indices of skinks under three predator management regimes. New Zealand Journal of Ecology 41, 84-97.
| Crossref | Google Scholar |
Woinarski JCZ, Burbidge AA, Harrison PL (2015) Ongoing unraveling of a continental fauna: decline and extinction of Australian mammals since European settlement. Proceedings of the National Academy of Sciences of the United States of America 112, 4531-4540.
| Crossref | Google Scholar | PubMed |
Wyatt KB, Campos PF, Gilbert MTP, Kolokotronis S-O, Hynes WH, DeSalle R, Daszak P, MacPhee RDE, Greenwood AD (2008) Historical mammal extinction on Christmas Island (Indian Ocean) correlates with introduced infectious disease. PLoS ONE 3, e3602.
| Crossref | Google Scholar | PubMed |