

Movement and ranging behaviour of long-nosed potoroos (Potorous tridactylus) in south-west Victoria, Australia
Mark Le Pla A * , Bronwyn A. Hradsky A , Julian Di Stefano B , Tamika C. Farley-Lehmer C , Emma K. Birnbaum C and Jack H. Pascoe C
A Quantitative and Applied Ecology Group, School of Agriculture, Food and Ecosystem Sciences, University of Melbourne, Parkville, Vic. 3010, Australia.
B Fire Ecology and Biodiversity Group, School of Agriculture, Food and Ecosystem Sciences, University of Melbourne, Creswick, Vic. 3363, Australia.
C Conservation Ecology Centre, Cape Otway, Vic. 3233, Australia.
Abstract
A comprehensive understanding of movements and space use can underpin the effective management of threatened species. GPS dataloggers can collect large amounts of high-quality movement data, and recent advances in statistical approaches allow for robust estimates of home range size to be generated. Until recently, technological and practical constraints have generally restricted the collection of movement data via GPS dataloggers to larger species. However, reductions in the size and weight of GPS dataloggers now allow for this technology to be applied to smaller species.
The aim of this study was to describe the home range and movement patterns of a nationally vulnerable, native Australian ground-dwelling mammal, the long-nosed potoroo (Potorous tridactylus), in south-west Victoria, mainland Australia.
We attached GPS dataloggers to 40 long-nosed potoroos between 2020 and 2022 and estimated home range size using dynamic Brownian Bridge movement models. We evaluated the influence of physiological factors such as body mass and sex on home range size and described patterns of home range overlap between and within sexes.
Mean home range sizes were estimated to be 13.73 ha (95% CI: 10.9–16.6) and 6.67 ha (95% CI: 5.49–7.85) for males and females respectively. Home range size scaled with body mass in males but not females, and ranges were largely overlapping – although there was some evidence of intrasexual spatial partitioning of core range areas in females.
Ours is the first application of GPS dataloggers to this species, and our home range estimates are over twice as large as other reported estimates for mainland Australia. Long-nosed potoroos may range across larger areas than previously predicted on mainland Australia.
This knowledge may be used to optimise the management of long-nosed potoroo populations before and after fire – a key threatening process for this species. Our study highlights the value of integrating GPS dataloggers and robust home range estimators when describing the movement ecology of a population.
Keywords: behaviour, conservation management, endangered species, geographical range, locomotion, reproductive strategy, spatial ecology, threatened species.
Introduction
The movement of an animal influences many aspects of its ecology, from individual fitness and reproductive success to population dynamics, geneflow, and species distributions (Bohonak 1999; Bowler and Benton 2005; Elith and Leathwick 2009). Therefore, a detailed understanding of animal movements is fundamental to developing and enacting effective conservation strategies. For example, prior knowledge of home range size can be used to ensure survey sites are spatially independent for occupancy modelling (MacKenzie et al. 2002), a practice often used to monitor populations of conservation concern through time (Ahumada et al. 2013), or before and after a management intervention such as fire (Pons et al. 2003) or invasive predator control (Robley et al. 2014). This same knowledge can be used to parameterise sophisticated decision support tools, such as agent-based models (DeAngelis and Mooij 2005; Hradsky et al. 2019), to model the potential benefits and consequences of different management regimes. Finally, home range estimates may be used as informative priors for density estimation when individuals are able to be uniquely identified using spatially explicit capture–recapture modelling within a Bayesian framework (Royle et al. 2013). Despite these benefits, a detailed understanding of home range size for many species is lacking.
Historically, insight into an animal’s home range was generated either through direct observation (if they were individually identifiable), from capture locations (Kitchener 1973), or by attaching very high frequency (VHF) transmitters to individuals and relocating them using a VHF receiver (Long 2001). Both approaches are often characterised by small sample sizes, logistical challenges, and analytical issues. More recently, Global Positioning System (GPS) loggers that are physically attached to an animal are increasingly being used to generate high-volume and high-quality movement data (Cagnacci et al. 2010; Hebblewhite and Haydon 2010; Tomkiewicz et al. 2010). Although weight restrictions have historically limited the application of this technology to medium- to large-sized animals (Merrill and Mech 2003; Dussault et al. 2005), technological advances reducing the size and weight of GPS loggers have expanded the suite of species that can be tracked using GPS loggers (Price-Rees et al. 2013; Stevenson et al. 2013; Zhang et al. 2019).
A wide range of analytical approaches have been developed to take advantage of ever-increasing sample sizes of animal locations. The most basic of these, the minimum convex polygon (MCP), remains commonly used despite its shortcomings (Harris et al. 1990; Börger et al. 2006), because it allows for comparison of home range areas with older studies (Nilsen et al. 2008). Kernel density estimators (KDE) represent an advance on polygon-based estimators, because they use the density of fixes to estimate the area an animal ranges in addition to how intensely different areas are used, referred to as a utilisation distribution (UD) (Worton 1989; Kranstauber et al. 2012). KDEs commonly ignore the temporal structure of a movement dataset and often require fixes to originate from a regular sampling schedule or to be temporally independent (Fieberg 2007; Kranstauber et al. 2012). More recently, the development of the dynamic Brownian bridge movement model (hereafter referred to as ‘dBBMM’) has further improved upon traditional KDEs by incorporating both temporal and spatial structures of tracking data (Horne et al. 2007; Kranstauber et al. 2012). This development allows for variable movement patterns and irregular fix schedules, better capturing movement pathways compared with traditional KDE estimators (Horne et al. 2007; Kranstauber et al. 2012).
The long-nosed potoroo (Potorous tridactylus – hereafter ‘potoroo’) is a cryptic and largely nocturnal species that utilises dense vegetation, making direct observations difficult (Bennett 1993; Claridge et al. 2007; Norton et al. 2010). Despite belonging to a faunal group that has been highly disadvantaged by the landscape changes and introduction of invasive predators that followed European invasion in Australia (Burbidge and McKenzie 1989; Woinarski et al. 2015), the behaviour and movements of this species remains poorly understood. Potoroos are considered solitary yet non-territorial (Seebeck et al. 1989; Long 2001), and occur in a patchy distribution along the eastern coast of Australia, from south-eastern Queensland through to the south-eastern coast of South Australia and Tasmania (Johnston 2008). Their small size and generally low trapping success have likely contributed to the small number of studies that describe their home range.
In addition to the myriad of ecological factors that can influence potoroo movements and behaviour (Claridge et al. 1992; Bennett 1993; Norton et al. 2011), variability in survey technique, analytical approach, and sample sizes among the few studies that have estimated potoroo home range size makes direct comparisons challenging. For example, one study of Tasmanian potoroos reported home ranges of 19.4 ha for males and 5.2 ha for females using trapping data and MCP’s (Kitchener 1973), whereas a study of Victorian potoroos reported much smaller home ranges (4 ha for males and 2.9 ha for females) based on similar sample sizes but using VHF tracking and a KDE estimator (Long 2001). Another potential reason for this discrepancy may be due to the considerable variation in body mass displayed by potoroos throughout its geographic range (Norton et al. 2010; Frankham et al. 2011). Individuals in south-west Victoria are among the smallest described, whereas Tasmanian potoroos weigh almost twice as much on average (Hird 1996; Long 2001; Frankham et al. 2011). Regardless, females are consistently estimated to have smaller ranges than males (Kitchener 1973; Hird 1996; Long 2001), a characteristic potoroos share with many other macropod species (Fisher and Owens 2000). To date, there have been no reported instances of GPS datalogger technology being used to generate home range estimates for potoroos, and no instances of more sophisticated home range estimators being used to estimate the home range size of this species.
Here we present the first study to use GPS dataloggers to estimate the home range size of potoroos. Our aim was to provide robust estimates of home range size, evaluate the influence of physiological factors such as body mass and sex on home range size, and describe patterns of home range overlap between and within sexes, in a population of potoroos in south-west Victoria, mainland Australia.
Materials and methods
Site description
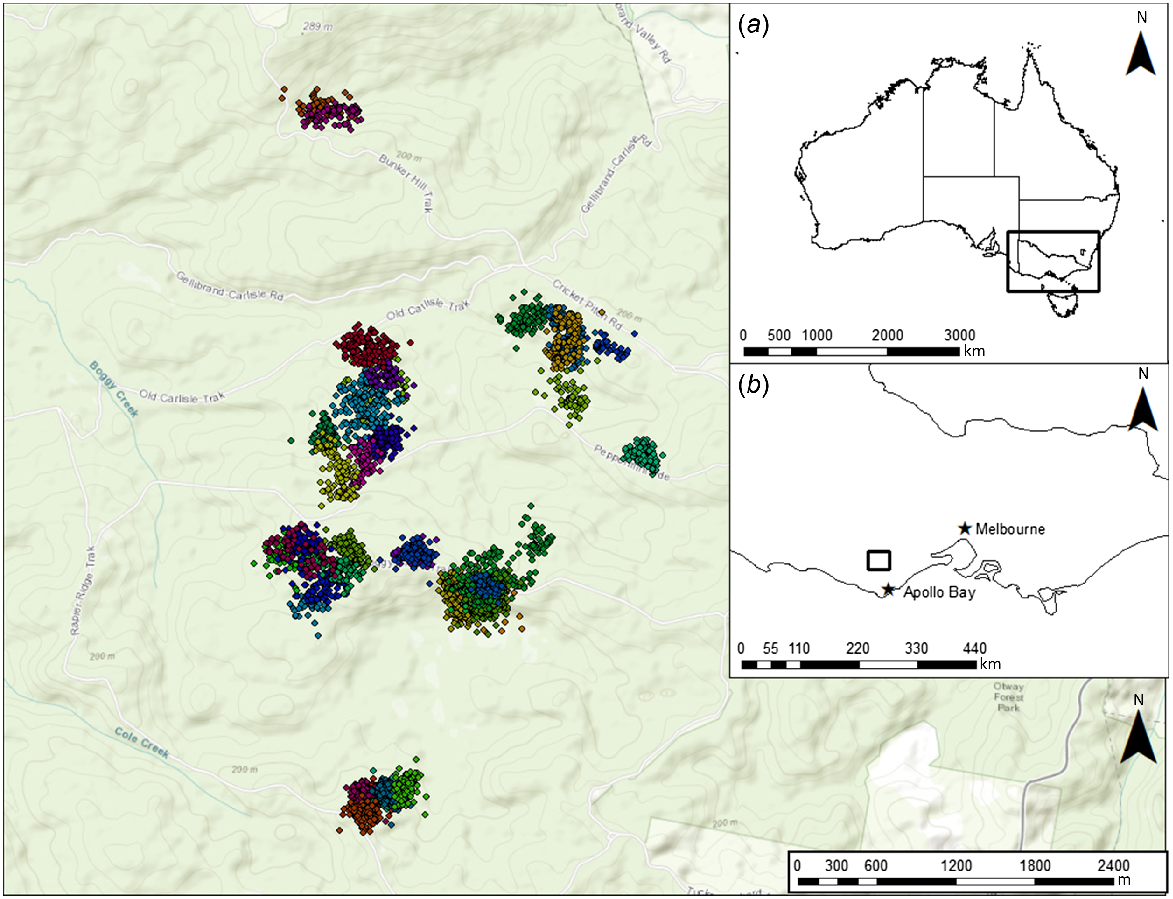
Our study was conducted in the western Heathy Woodlands of the Great Otway National Park (38.54S, 143.47E), Victoria, Australia (Fig. 1). This locality is 130–250 m above sea level and has a mild, temperate climate: maximum daily temperatures average 26.1°C in summer and 11.6°C in winter; annual rainfall averages 538 mm with more rainfall in winter and spring (June to November) relative to the warmer months of summer and autumn (December to May) (Bureau of Meteorology 2020). The overstorey is dominated by Eucalyptus baxterii and E. obliqua, with a mid-storey dominated by Banksia marginata, Epacris impressa, Xanthorrhoea australis, and Leptospermum continentale, with Melaleuca squarosa becoming the dominant mid-storey species in drainage lines. The understorey predominantly comprises a diverse array of herbs, graminoids, and lichens.
Live trapping, processing, and collar attachment of potoroos
Potoroos were live-trapped using wire mesh cage traps (approximately 72 cm long × 31 cm high × 31 cm wide) in seven ‘blocks’ broadly distributed throughout our study region between 2020 and 2022. Survey timing varied each year between March and August, with the majority of collar deployments taking place between late autumn and winter (May–August). Traps were baited using a traditional bait ball consisting of peanut butter, rolled oats, and golden syrup, and set in what was assessed as desirable habitat for potoroos. Traps were open continuously and checked each day at dawn and dusk. Captured potoroos were transferred to a soft cloth capture bag for further processing.
Potoroos were handled by experienced individuals to identify, mark, weigh, measure, sex, and attach or remove GPS collars to minimise stress to individuals during processing. Females were examined for reproductive status, and the developmental stage of any pouch young was recorded. Females with large, furred pouch young were released immediately and were not included in this study. All other potoroos were implanted with a uniquely coded Trovan microchip between their shoulder blades to allow for individual identification in subsequent captures. Non-target species captured in cage traps were processed as described above with the exception of microchip implanting and GPS collar attachment.
We attached a 20-g LiteTrack20 GPS collar (https://www.lotek.com/products/litetrack-20/) to potoroos that exceeded 500 g, so that the weight of the collars represented less than 4% of their body mass. The collars were attached using a 4-mm wide plastic cable-tie around the neck. Although this specific approach of using cable ties had not been previously attempted for potoroos, the use of cable ties as collar attachment mechanisms has been highly successful in terms of retention time and welfare outcomes for species of similar size and body shape (Coetsee et al. 2016). Collars were attached to alert animals, with a collar attachment time of approximately 2–4 min on average. Mean handling time was <10 min.
During 2020 deployments, GPS collars were programmed to collect fixes at half-hourly intervals during the night (1800–0600 hours) and 3-hourly intervals during the day (0600–1800 hours). Initial data collected during these deployments suggested potoroos were more active during the day than expected. Therefore, GPS collars in the 2021–22 deployments were programmed to collect fixes at hourly intervals continuously throughout the 24-h diel period. We retrieved all the collars during this study by recapturing individuals still fitted with dataloggers at the end point of battery life.
Data cleaning and pre-processing
The exclusion or correction of location errors after GPS data have been collected is a crucial first step to estimating home ranges. The primary goal of this screening step is to remove inaccurate locations, which can introduce bias and wrong conclusions, while retaining as many plausible locations as possible to improve statistical power and sample sizes (Bjørneraas et al. 2010). We discarded location data collected during the first night after collar attachment to ensure any short-term behavioural changes resulting from capture and collar attachment would not introduce bias into space use and home range estimates. Screening methods based upon the number of satellites, the geometry of those satellites (commonly represented by a measure called dilution of precision or DOP), or a combination of both are commonly used; however, these methods can lead to large data reductions without eliminating all obviously erroneous locations (D’eon and Delparte 2005; Bjørneraas et al. 2010). Alternative screening methods based upon identifying locations arising from unrealistic movement patterns have recently been developed and are increasingly being used to screen GPS datasets (Bjørneraas et al. 2010; McGregor et al. 2014). As per Bjørneraas et al. (2010), data were screened to remove fixes that reflected a turning angle of 170–190° and travelling speeds >1.5 km/h (indicating an erroneous ‘spike’ in movement), or that exceeded a mean distance of 300 m and median distance of 600 m from a moving window of 10 fixes.
Home range estimation
To ensure only individuals that displayed range residency were included in home range estimation, we first assessed range residency of all individuals via variogram analysis (Fleming et al. 2014). This exploratory analysis plots the semi-variance in positions as a function of the time lag separating observations, with individuals displaying range-resident behaviour showing clear asymptotes over longer time lags (Calabrese et al. 2016). All animals fulfilled this criterion (Supplementary Figs S1–S3).
We then fitted dBBMMs to estimate the 95% and 50% UD areas for all individuals. Brownian bridge movement models (BBMM) represent an improvement upon KDE-based methods to estimate the UD of an individual, because they incorporate information about the movement path rather than just individual points and provide an estimate of an individual’s mobility referred to as the Brownian motion variance (σ2m) (Horne et al. 2007; Kranstauber et al. 2012). The σ2m parameter contains information on both how straight a movement path is as well as how the path varies in speed and scale of movements (Kranstauber et al. 2012). However, while BBMMs produce a single estimate of σ2m for the entire movement path, dBBMMs allow σ2m to vary within a moving window of fixes, better representing the realistic variance in an animal’s movement path characteristics as they transition between different behavioural states (i.e. active and resting) (Kranstauber et al. 2012). We fitted dBBMMs for each potoroo following the recommendations of Kranstauber et al. (2012) using an estimated location error of 15 m, window size of 11 (equivalent to 11 h), and a margin of 5 (equivalent to 5 h) to account for potential diurnal versus nocturnal movement pattern differences. Additionally, we also conducted an asymptote analysis to determine the sensitivity of dBBMMs to sample size (Figs S4–S6).
Factors influencing nocturnal movements and home range size
We examined the influence of body mass and sex on 95% dBBMM range areas using generalised linear models (GLMs) with a Gamma distribution and log link function. A Gamma distribution was chosen as our response variable, and home range size in hectares was continuous, right skewed and had only positive values (Zuur et al. 2009). We compared support for body mass and sex individually, alongside their respective additive and interactive models, and a null model using Akaike’s Information Criterion corrected for small sample size (AICc) (Buckland et al. 1997). Models within 2 AICc units of the top-ranked model were considered equally plausible. We initially included a random intercept with block (seven levels: PP, GVR, BC, CH6, CH4, CH3, and CH2) nested within year (three levels: 2020, 2021 and 2022) to account for any potential spatial and temporal variation in home range sizes within our study design. To evaluate the need for this random intercept, we compared the AICc value of our most complex fixed effects (mass × sex) fitted as generalised linear mixed model (GLMM) with the AICc value of the same fixed effects fitted as a GLM without these random effects (Zuur et al. 2009). Because the model without random effects was more strongly supported (ΔAICc = 3.08), the random effects were discarded and the analysis run using GLMs instead (Bolker et al. 2009). Additionally, we also included the number of fixes and deployment duration as fixed effects, but because there was little evidence that these factors significantly influenced home range sizes, these factors were discarded. In total, we had five candidate models. Fitted GLMs were assessed for overdispersion via simulation (Hartig 2020), with no evidence of overdispersion detected.
Home range overlap
Intra- and intersexual home range overlap (%) was described by comparing the degree to which 95% and 50% dBBMM home range areas overlapped among all individuals that co-occurred in the same area using the intersect feature in ArcMap. Proportional overlap (%) for each pair of co-occurring individuals (e.g. hypothetical individuals A and B) was derived as [(areaAB/home rangeA)(areaAB/home rangeB)]0.5, where areaAB is the area of overlap of the co-occurring individuals and home rangeA and home rangeB are the home ranges of individuals A and B, respectively (Atwood and Weeks 2003).
Software
Variograms were generated using the ‘ctmm’ package (v 1.0.0, Fleming and Calabrese 2022), dBBMMs were fitted using the ‘move’ package (v 4.0.2, Kranstauber et al. 2020), GLMMs were fitted using the ‘lme4’ package (v 1.1-23; Bates et al. 2015), GLMs were fitted in the R programming environment (v. 3.6.1; R Core Team 2021), and residual diagnostics and overdispersion in fitted models were assessed using the ‘DHARMa’ package (v. 0.3.2.0; Hartig 2020). Home range overlap was undertaken using ArcMap (v 10.6).
Results
We successfully captured and attached GPS collars to 39 individual potoroos (23 males and 16 females) (Figs 1 and 2, Table 1). Although traps were open continuously, no potoroos were captured during the day. One collar failed to successfully collect any GPS fixes and was discarded from this study. Collar deployments are described in the Supplementary Information (Tables S1–S3). Beyond minor hair loss around the neck of some individuals, no observable negative effects of collar attachment, such as loss of body mass, were observed. Individuals varied in mass, but a two-sample Wilcoxon rank sum test revealed there was no significant difference in mean body mass between males and females (w = 219, P = 0.16). Males weighed 805 g (95% CI: 748–860) and females weighed 765 g (95% CI: 705–815) on average.
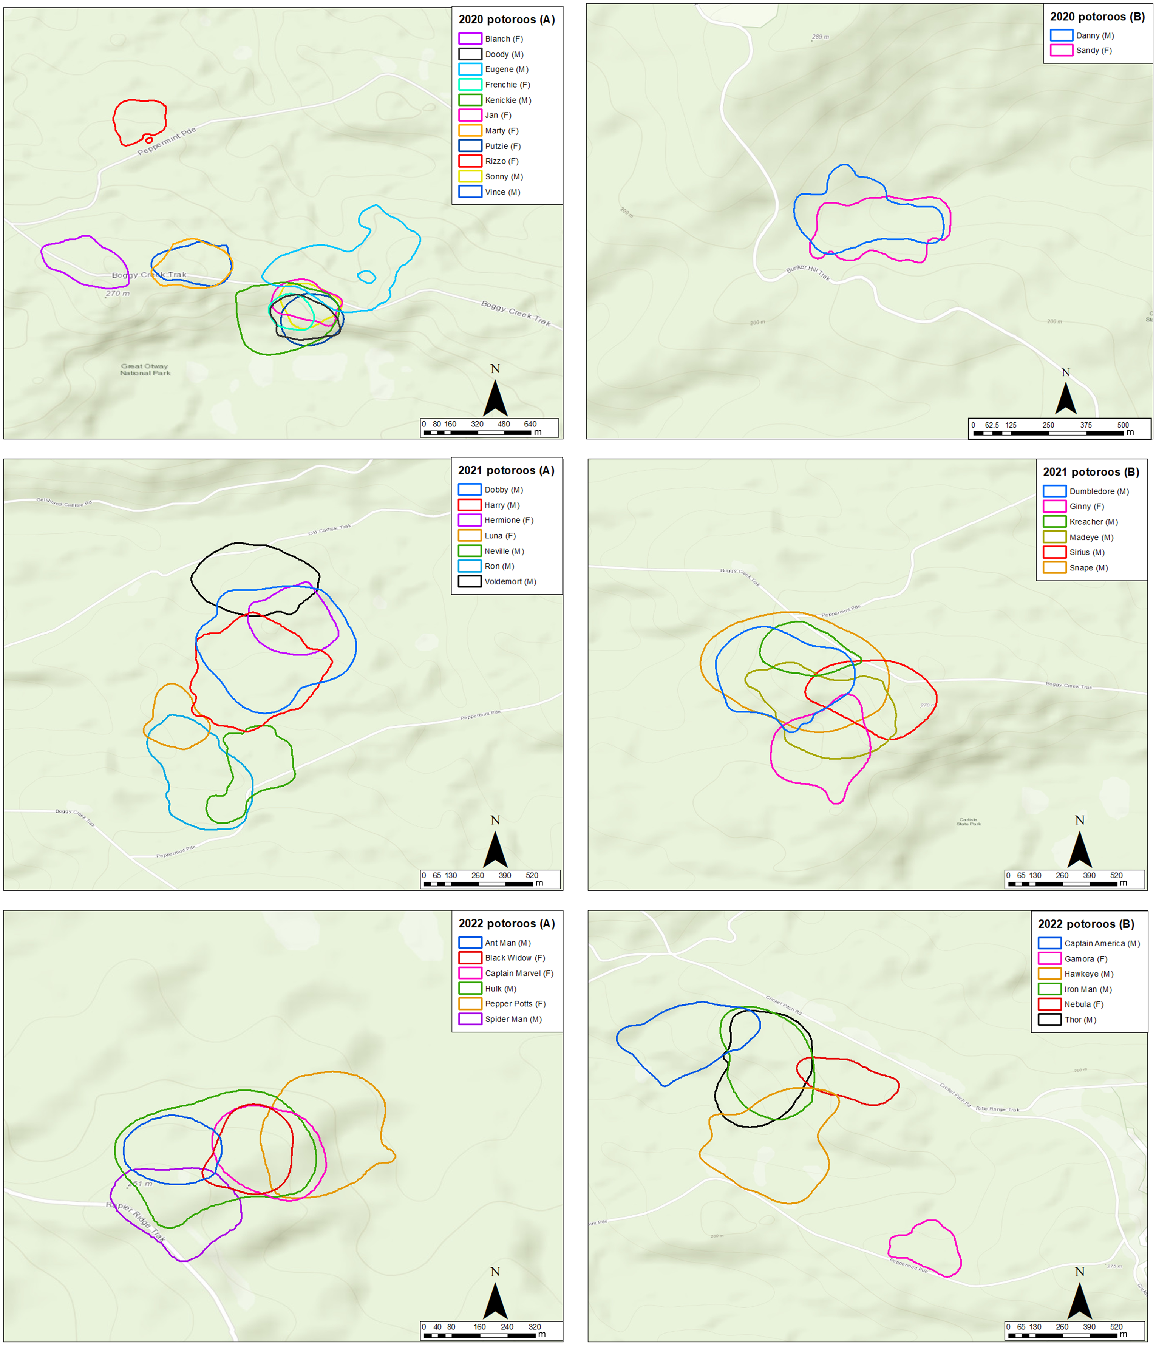
95% home ranges of long-nosed potoroos collared in 2020 (top two panels), 2021 (middle panels) and 2022 (bottom panels), as estimated by dBBMM analysis.
| ID | Year | Sex | Mass (g) | Fixes | dBBMM range (ha) | ||
|---|---|---|---|---|---|---|---|
| 50% | 95% | ||||||
| Blanch | 2020 | F | 620 | 158 | 1.29 | 8.49 | |
| Frenchie | 2020 | F | 540 | 646 | 0.62 | 3.52 | |
| Jan | 2020 | F | 790 | 48 | 1.62 | 6.13 | |
| Marty | 2020 | F | 880 | 128 | 1.49 | 8.12 | |
| Putzie | 2020 | F | 820 | 786 | 1.17 | 7.09 | |
| Rizzo | 2020 | F | 720 | 205 | 0.70 | 5.20 | |
| Sandy | 2020 | F | 880 | 95 | 1.76 | 8.00 | |
| Danny | 2020 | M | 880 | 81 | 1.37 | 8.53 | |
| DoodyA | 2020 | M | 620 | 452 | 1.24 | 6.55 | |
| Eugene | 2020 | M | 900 | 157 | 4.09 | 23.10 | |
| Kenickie | 2020 | M | 960 | 843 | 4.45 | 16.21 | |
| Sonny | 2020 | M | 640 | 539 | 1.16 | 5.50 | |
| Vince | 2020 | M | 680 | 108 | 1.35 | 7.40 | |
| Ginny | 2021 | F | 670 | 43 | 1.73 | 12.51 | |
| Hermione | 2021 | F | 670 | 111 | 1.29 | 8.35 | |
| Luna | 2021 | F | 770 | 186 | 1.12 | 5.08 | |
| Dobby | 2021 | M | 820 | 93 | 5.84 | 26.13 | |
| Dumbledore | 2021 | M | 860 | 105 | 3.89 | 17.63 | |
| Harry | 2021 | M | 780 | 206 | 4.72 | 20.29 | |
| Kreacher | 2021 | M | 660 | 107 | 1.36 | 6.56 | |
| Madeye Moody | 2021 | M | 960 | 100 | 2.74 | 17.21 | |
| Neville | 2021 | M | 820 | 106 | 1.80 | 8.55 | |
| Ron | 2021 | M | 850 | 135 | 2.04 | 14.40 | |
| Sirius | 2021 | M | 840 | 93 | 2.80 | 12.81 | |
| Snape | 2021 | M | 820 | 64 | 8.00 | 29.50 | |
| Voldemort | 2021 | M | 950 | 182 | 2.89 | 12.38 | |
| Black Widow | 2022 | F | 620 | 163 | 1.07 | 3.89 | |
| Captain Marvel | 2022 | F | 800 | 198 | 0.95 | 5.28 | |
| Gamora | 2022 | F | 840 | 202 | 0.63 | 4.60 | |
| Nebula | 2022 | F | 860 | 52 | 1.11 | 5.60 | |
| Pepper Potts | 2022 | F | 860 | 90 | 1.87 | 8.21 | |
| Ant Man | 2022 | M | 520 | 129 | 0.79 | 3.44 | |
| Captain America | 2022 | M | 800 | 163 | 2.45 | 12.92 | |
| Hawkeye | 2022 | M | 860 | 77 | 2.25 | 19.27 | |
| Hulk | 2022 | M | 1000 | 182 | 2.91 | 12.14 | |
| Iron Man | 2022 | M | 880 | 155 | 3.85 | 14.46 | |
| Spider Man | 2022 | M | 520 | 190 | 1.14 | 5.40 | |
| Thor | 2022 | M | 900 | 156 | 4.04 | 15.43 | |
ID, Year, Sex, Mass (g), and the number of GPS fixes available after data cleaning for potoroos collared during this study. Home ranges are derived by fitting dynamic Brownian Bridge movement models (dBBMM). Areas are presented in hectares.
Given any animal larger than 500 g was suitable for inclusion in our study, it is likely our sample included both resident adults as well as subadults yet to disperse (Table 1). Halfway through deployment, one male (‘Doody’) began to display extra-territorial movements and eventually dispersed into adjacent habitat approximately 2 km away. Therefore, only movement data before the first example of potential dispersal movement behaviour (assessed visually and characterised by marked departures from previously consistent movement patterns) were included in further analysis. The dispersal behaviour we observed in one individual male weighing 620 g (Doody) concurs with the suggestion of Hughes (1964) that males weighing less than 640 g are likely to be subadults. However, because Hughes (1964) based his study upon Tasmanian potoroos, which are larger on average relative to the potoroos found in south-eastern Australia, it is possible that potoroos in our study region could reach sexual maturity at lower body masses. Four of the 23 males and three of the 15 females included in this study were deemed to be subadults according to this criterion. An additional two-sample Wilcoxon rank sum test with subadults removed from the sample again suggested no significant difference in mean body mass between adult males and females (w = 158, P = 0.08). Individuals were tracked for an average of 14 days (range: 4–41 days). After data cleaning, 7534 fixes (range: 43–843 fixes per individual) were available for home range analysis.
Home ranges were roughly circular and the predicted 95% and 50% ranges of potoroos varied substantially among individuals (Fig. 2, Table 1). The largest 95% dBBMM range was predicted for the male ‘Snape’ (29.50 ha), and the smallest 95% dBBMM range was predicted for the female ‘Black Widow’ (3.44 ha). The average 95% dBBMM range was 13.73 ha (95% CI: 10.9–16.6) for males and 6.67 ha (95% CI: 5.49–7.85) for females. The average 95% dBBMM range across individuals was 10.94 ha (95% CI: 8.86–13.00).
The largest 50% dBBMM range was predicted for the male ‘Snape’ (8.00 ha) and the smallest 50% dBBMM range was predicted for the female ‘Frenchie’ (0.62 ha). The average 50% dBBMM range was 2.92 ha (95% CI: 2.20–3.64) for males and 1.23 ha (95% CI: 1.02–1.44) for females. The average 50% dBBMM range across individuals was 2.25 ha (95% CI: 1.74–2.76).
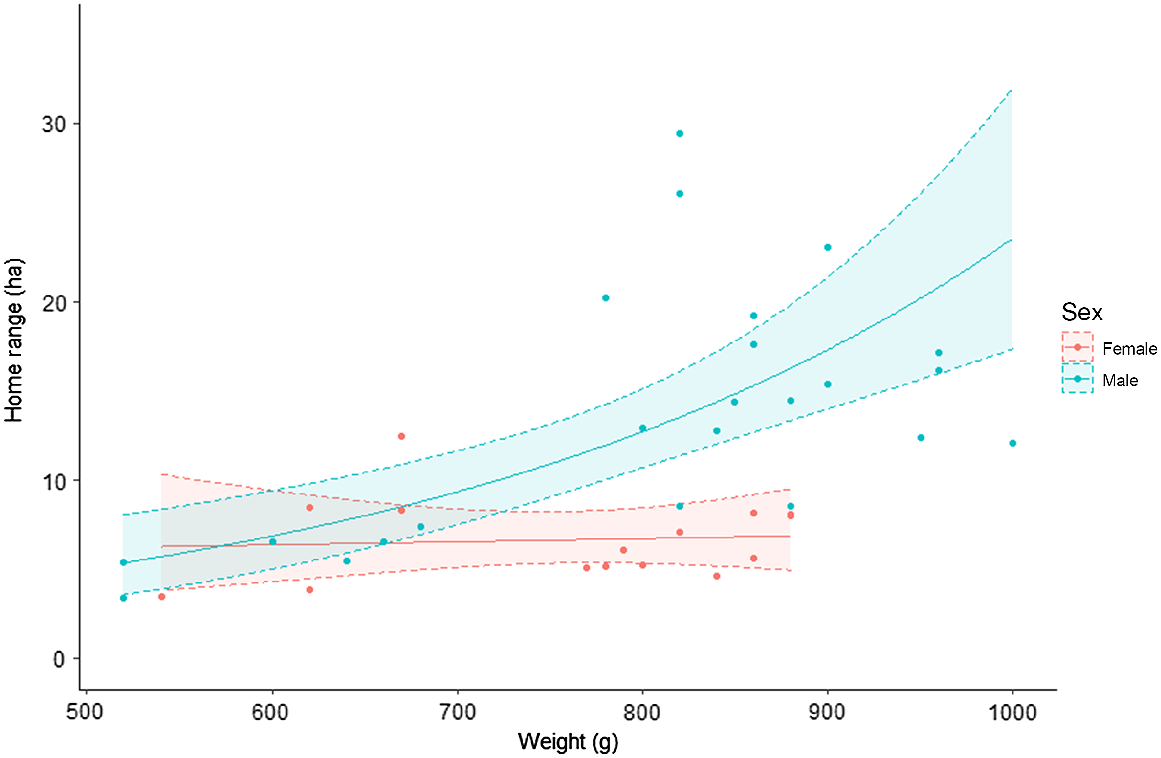
There was strong evidence that both body mass and sex influenced the home range size of potoroos in our study. Models that included both body mass and sex, either additively or interactively, were more supported relative to models that only included one of these covariates (Table 2). Estimates from the top-ranked model suggested that the influence of body mass on home range size depended on sex. Body mass had no detectable influence on home range size in females, but it had a positive influence on males (Fig. 3).
| Rank | Model | Parameters | LogLk | ΔAICc | AICcwt | |
|---|---|---|---|---|---|---|
| 1 | Range ∼ mass × sex | 5 | −100.83 | 0.00 | 0.84 | |
| 2 | Range ∼ mass + sex | 4 | −103.83 | 3.32 | 0.15 | |
| 3 | Range ∼ sex | 3 | −109.48 | 12.13 | 0.01 | |
| 4 | Range ∼ mass | 3 | −110.52 | 14.21 | 0.00 | |
| 5 | Range ∼ 1 | 2 | −118.29 | 27.39 | 0.00 |
Models are defined in terms of whether home range size (Range) was constant (1), varied according to body mass (mass), sex (sex), an additive effect of body mass and sex (mass + sex), or an interactive effect of body mass and sex. Log likelihood (LogLk), change in AICc (ΔAICc), and AICc weight (AICcwt) follow Burnham and Anderson 2002.
Predicted relationship between home range size and body mass for male and female long-nosed potoroos. Shaded areas indicate 95% confidence intervals.
There were 24 occasions where male and female 95% ranges overlapped, 23 occasions where male ranges overlapped with other males, and six occasions where female ranges overlapped with other females (Fig. 2). There was little evidence of exclusive 95% ranges amongindividuals or between sexes (Figs 2 and 3). Where individuals of the same sex co-occurred, 95% area overlap was 38.8% (95% CI: 29.0–48.6) for males and 47.1% (95% CI: 33.2–61.0) for females (Table S4–S9). Although samples sizes were small, there was some evidence that adult males may potentially orient their 95% ranges to maximise overlap with multiple female 95% ranges. For example, one male (‘Kenickie’) had a home range area that almost completely overlapped the entirety of three different female ranges, and another (‘Hulk’) had a home range area that almost completed overlapped the entirety of two different female ranges.
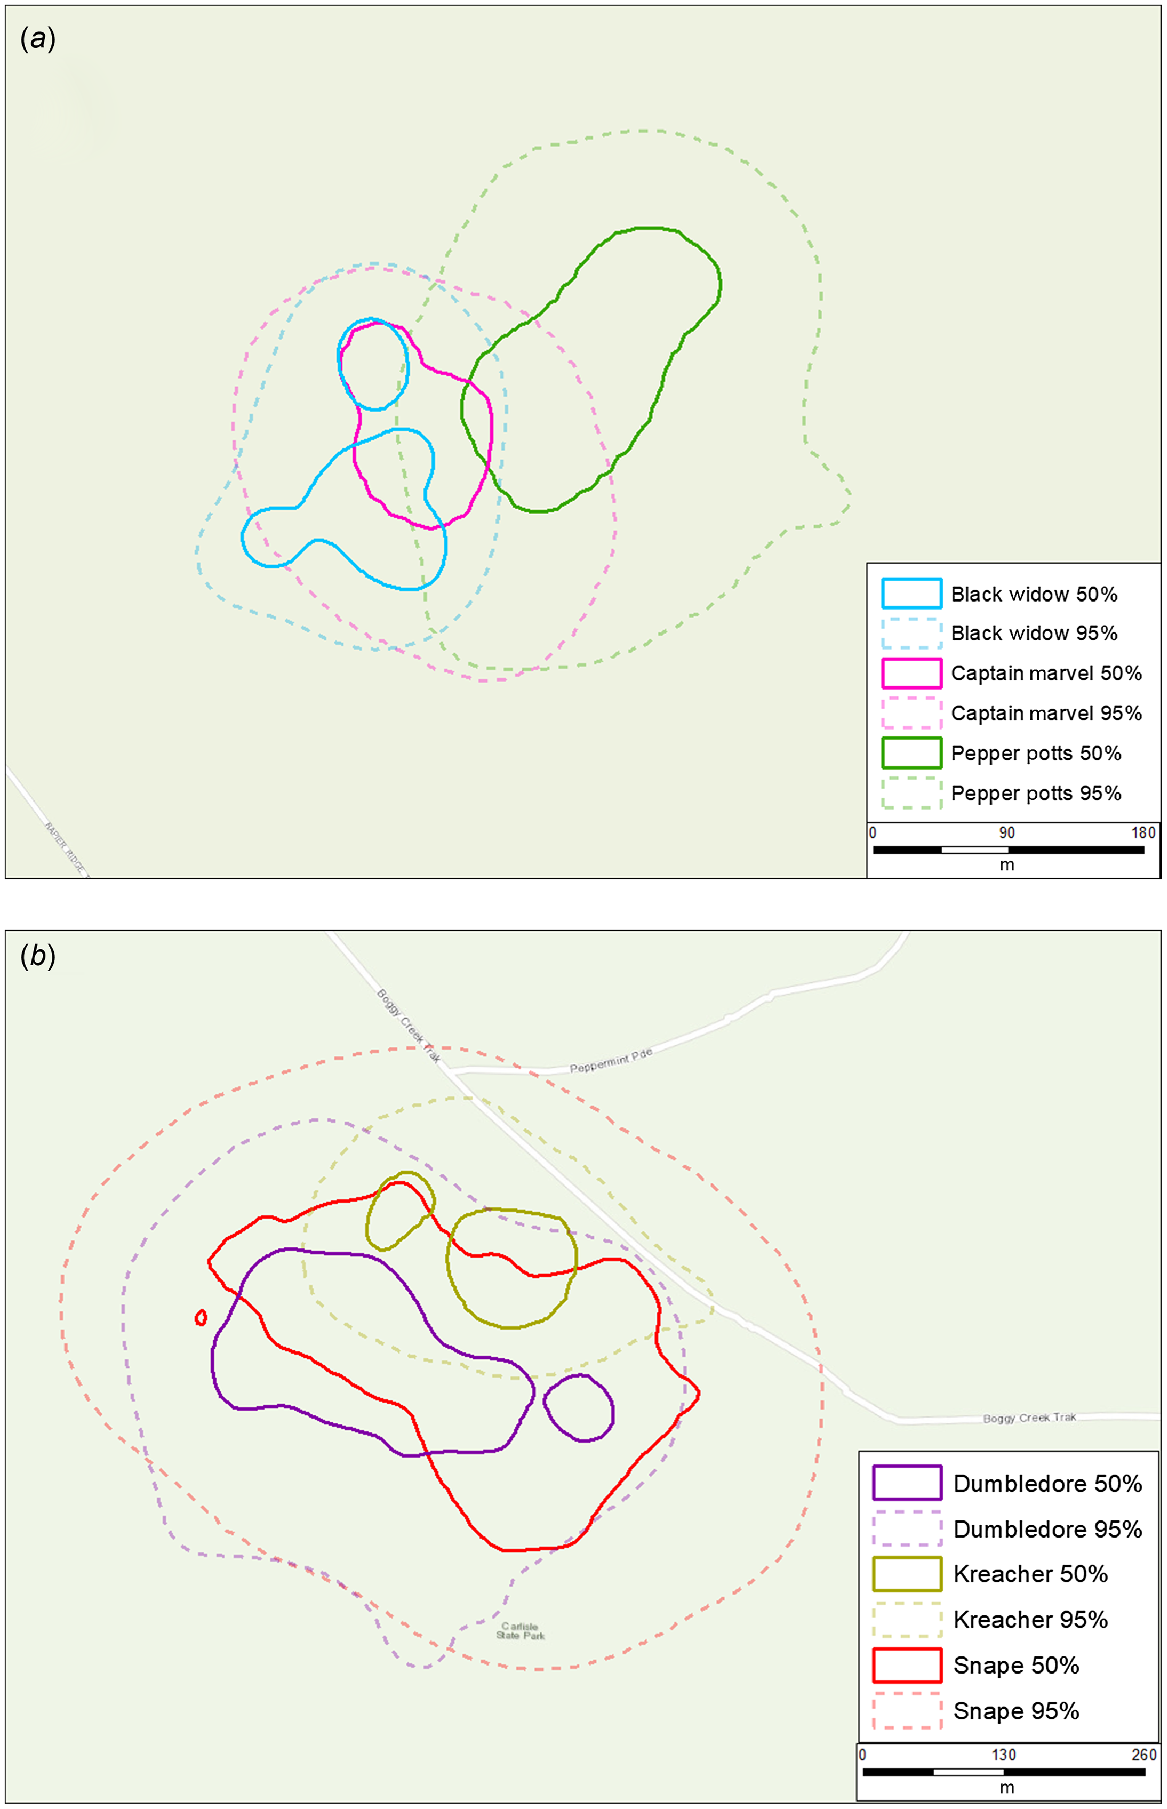
There were 12 occasions where male and female 50% ranges overlapped, eight occasions where male 50% ranges overlapped with other males, and four occasions where female 50% ranges overlapped with other females. There was little evidence of consistently distinct 50% core areas between males and females. Where males and females co-occurred, their 50% range overlap was 32.9% (95% CI: 20.4–45.4) on average. In contrast, there was some evidence of distinct 50% core areas among females (Fig. 4a) but not males (Fig. 4b). Where individuals of the same sex co-occurred, 50% range overlap was 28.6% (95% CI: 14.4–42.8) on average for males and 12.7% (95% CI: 0–33.7) on average for females – although sample sizes for co-occurring females were small.
Discussion
Our home range estimates of 13.73 ha (95% CI: 10.9–16.6) and 6.67 ha (95% CI: 5.49–7.85) for male and female potoroos, respectively, are more than twice as large as previous estimates reported in the literature for Victorian potoroos (Long 2001, Table 3). They are also the first to be produced for this species using GPS dataloggers and dynamic Brownian bridge movement models. Our results suggested that the influence of body mass on potoroo home range size depended on sex. Body mass had no detectable influence on home range size in females but a positive influence in males (Table 3, Fig. 3). Contrary to elsewhere throughout their range (Norton et al. 2010; Frankham et al. 2011) and similarly to studies nearby (Bennett 1987), we observed no substantial differences in body mass between male and female potoroos. Prior trapping surveys in the same area suggest the body mass of male and females used in our analysis were typical for potoroos in this region (Le Pla, unpubl.data).
| Population | Mass ± s.e. (g) | Survey type | Range estimator | n | Range size (ha) | Reference | ||||
|---|---|---|---|---|---|---|---|---|---|---|
| ♂ | ♀ | ♂ | ♀ | ♂ | ♀ | |||||
| Tasmania | – | – | Trap | MCP | 5 | 5 | 19.2 | 5.2 | Kitchener (1973) | |
| Tasmania | – | – | Trap | MCP | 10 | 1 | 4.4 | 0.9 | Johnson (1988) | |
| Tasmania | 1420 ± 43 | 1190 ± 67 | Trap | KDE | 16 | 8 | 10.8 | 5.7 | Hird (1996) | |
| Victoria | 789 ± 77 | 777 ± 86 | Trap | MCP | 6 | 6 | 2.0 | 1.5 | Bennett (1987) | |
| Victoria | 781 ± 37 | 689 ± 20 | VHF | KDE | 5 | 7 | 4.0 | 2.9 | Long (2001) | |
| Victoria | 805 ± 28 | 765 ± 31 | GPS | dBBMM | 23 | 15 | 13.7 | 6.7 | This study | |
Trap, data generated through trapping; VHF, data generated through tracking of animals with VHF data logger attached; GPS, data generated via attachment of GPS datalogger to individuals; MCP, Minimum Convex Polygon; KDE, Kernel Density Estimator; dBBMM, Dynamic Brownian bridge movement model.
The discrepancy between male and female potoroo ranges at larger mass, despite no significant differences in body mass between sexes, suggest that this difference is not driven by the increased energetic requirements that coincide with increasing body mass (McNab 1963; Lindstedt et al. 1986; Swihart et al. 1988). Indeed, given the largely similar range sizes we observed in females of all masses (Fig. 3), it is likely that a range of 6–7 ha is large enough to allow females and younger males to find sufficient food and shelter with minimum risk and energy expenditure in our study area (Sandell 1989; Fisher and Owens 2000). Rather, the intersexual home range overlap patterns observed in our study imply resident adult male potoroos may range across larger areas to maximise their range overlap with nearby females. Potoroos are continuous breeders with asynchronous oestrous cycles (Hughes 1964), and male reproductive success may be linked to a male’s ability to regularly assess the sexual status of nearby females (Long 2001; Frankham et al. 2012). Maximising intersexual spatial overlap may provide males with greater access to females, which in turn could provide males with detailed knowledge of female movements and potentially improve their reproductive fitness (Schwagmeyer 1988; Long 2001). For example, in a study on French Island, Victoria, male potoroos that successfully sired young also demonstrated a high degree of spatial overlap with the mothers of their offspring (Frankham et al. 2012). This behaviour may be common within our study region – we observed several large male ranges almost entirely overlapping co-occurring female ranges, and it is not uncommon for both male and female potoroos to be detected together on camera traps (Le Pla, unpubl. data).
The substantial difference in mean body mass between these populations of potoroos is often proposed as an explanation for why Tasmanian home range estimates are larger than Victorian estimates (Table 3; Kitchener 1973; Long 2001). Further, the Victorian and Tasmanian populations have been separated for over 2 million years (Frankham et al. 2016), potentially resulting in demographic differences influencing a range of characteristics, including home range size.
Substantial differences in sample sizes and methodological approaches may go some way to explaining the variability in potoroo home range estimates. For example, although the studies of Johnson (1988) and Hird (1996) were conducted at the same location and both used trapping data to estimate home range size, Johnson’s choice of estimator (MCP) is more vulnerable to biases compared with the estimator used by Hird (KDE) (Börger et al. 2006). At small sample sizes, such as those that characterise trapping datasets, MCPs tend to underestimate home range sizes relative to methods that estimate a UD (Girard et al. 2002; Börger et al. 2006; Fleming et al. 2019). Indeed, MCP estimates of potoroo ranges are consistently lower than those predicted using a KDE approach in both Tasmania and mainland Australia (except for Kitchener 1973; Table 3). Because all home range estimates of Tasmanian potoroos have been based upon trapping locations (Table 3), it is possible, much like we observed in our study, that Tasmanian potoroos also range across larger areas than previously predicted. If so, it is also possible that a latitudinal gradient in potoroo home range size exists and has gone undetected due to methodological and analytical differences among studies. Future studies that incorporate GPS tracking of Tasmanian potoroos will be helpful in determining if this is indeed the case.
Additionally, landscape context may also play a significant role in determining home range size and arrangement in potoroos. For example, the studies of Bennett (1987) and Long (2001) were undertaken within a relatively small habitat patch surrounded by cleared agricultural land, whereas past Tasmanian studies and our study were conducted in much larger, contiguously connected habitat patches (Kitchener 1973; Johnson 1988; Hird 1996). Potoroos often display a reluctance to use cleared agricultural landscapes, so this difference in landscape context may be partially responsible for the smaller and potentially more constrained home ranges described by Bennett (1987) and Long (2001). Fine-scale differences in availability, arrangement of suitable habitat (Bennett 1993; Norton et al. 2011), and access to key food resources (Bennett and Baxter 1989; Claridge et al. 1993; Claridge and Cork 1994) also likely play a pivotal role in determining the size and spatial arrangement of potoroo home ranges. We recommend similar research into the movement ecology of potoroo populations, particularly those at different latitudes (e.g. Barren Grounds and Booderee, NSW; Norton et al. 2010, 2011; Hall et al. 2021) and in different habitats (e.g. sub-tropical Queensland; McHugh et al. 2019, 2020) before generalising our estimates of home range size to other landscapes.
The lack of exclusive 95% inter- or intrasexual ranges in our study supports the notion of potoroos being solitary yet non-territorial (Bennett 1987; Long 2001; Norton et al. 2010). We observed several examples of larger males (e.g. >800 g) demonstrating patterns of high overlap of both 50% and 95% ranges (Fig. 4b), and larger male potoroos often had ranges that encapsulated large proportions of smaller male ranges. In contrast, although sample sizes were small, the limited overlap of 50% ‘core’ activity areas observed among females suggests female potoroos may display some degree of spatial partitioning of activity (Fig. 4a). This arrangement could be driven by resource or shelter availability (Bennett and Baxter 1989; Bennett 1993) and has been observed in potoroo populations elsewhere (Norton et al. 2010; Frankham et al. 2014). Although it is likely these females are closely related, (female potoroos have been shown to be highly philopatric in other studies; Frankham et al. 2012, 2014), the behavioural mechanisms that underpin exactly how female potoroos partition these core areas remain unknown and beyond the scope of our data. Moreover, because we were unable to attach GPS dataloggers to females with large pouch young in our study, this apparent partitioning may simply be an artifact of excluding these individuals from our sample. Attaching GPS dataloggers to more co-occurring female potoroos, collecting movement data at more frequent intervals, and incorporating additional data streams (e.g. accelerometers) could allow for the classification of fine-scale movement behaviours and provide researchers with the ability to discern movements patterns associated with different behaviours (e.g. foraging or reproductive movements) (Langrock et al. 2012; Bennison et al. 2017). This approach would allow for the detailed description of encounters among individual potoroos and the context in which these encounters occur.
The primary limitations of our study were the variable fix success (i.e. variation in the proportion of attempted fixes that each GPS datalogger was able to successfully record as a location but were not removed through data screening), our inability to attach GPS dataloggers to females with pouch young, and the short duration of deployments. Fix success may be influenced by many factors (e.g. topography, fix interval, habitat characteristics; Cain et al. 2005), and fix success varied widely among individual GPS dataloggers in our study. For example, one GPS datalogger failed to record any fixes whatsoever, whereas another produced an overall average fix success of 88.7%. Similarly, fix success also varied temporally for individual dataloggers throughout their deployments. For example, one GPS datalogger’s daily fix success ranged between 8% and 80%. Despite this variability in fix success, because dBBMMs explicitly incorporate both spatial and temporal features of an individual’s path when estimating the UD, this approach can robustly estimate the UD even with variable fix success (Kranstauber et al. 2012). Additionally, although capture rates of male and female potoroos in our study region are generally even (Le Pla, unpubl. data), the inability to attach GPS dataloggers to female potoroos with large pouch young resulted in more males than females being included in our study (Table 1). This reduced the opportunity to describe occasions where female potoroos co-occurred and limited our ability to assess the degree to which co-occurring female 95% and 50% ranges overlapped. Finally, the relatively short duration of deployments (4–41 days) precluded any investigation into how potoroo movements may change through time. Given the potoroo’s propensity for exploiting hypogeal fungi (Bennett and Baxter 1989; Claridge and Cork 1994), it is possible potoroos may alter the size and spatial arrangement of their ranges in response to drivers of this seasonally available food resource.
Inappropriate fire regimes are a key threatening process for potoroos (Woinarski et al. 2014) because they often tend to inhabit environments that are burnt, through both prescribed burning and wildfire. For example, the recent ‘Black Summer’ wildfires (which took place during summer 2019–2020) in Australia burnt a substantial proportion of the long-nosed potoroo distribution (Legge et al. 2022; Ward et al. 2022), and a recent meta-analysis identified potoroos as one of nine mammal species consistently negatively affected by fire (Pocknee et al. 2023). Further, there is mounting evidence that potoroos may be particularly vulnerable to predation by invasive predators immediately after fire (Smith 2013; Robley et al. 2016; Hradsky 2020; Le Pla, unpubl. data). Estimates of potoroo home range size can directly inform the management of this functionally important (Claridge et al. 1992), yet nationally vulnerable, species after fire. For example, robust pre-fire home range size estimates could be used to assess the suitability of unburnt patches post-fire. Indeed, the small scale of burnt patches (<2 ha) relative to assumed potoroo home ranges (∼6 ha) was proposed as a primary reason for the lack of negative impact of planned burns on potoroos in sub-tropical Queensland (McHugh et al. 2020). Identifying where to prioritise recovery efforts (i.e. post-fire predator management), understanding the carrying capacity of the landscape as it recovers, and informing the ideal size of – and distance between – unburnt habitat patches to leave remaining within a prescribed burn scar to maintain viable populations of potoroos in the landscape post-fire are all potential ways land managers could use home range data to improve the management of potoroos in fire-prone landscapes.
Our results demonstrate the value of integrating GPS loggers and robust home range estimators to describe the movement ecology of a small, vulnerable native Australian marsupial. We highlight the potential that home ranges of potoroos may be larger than previously expected in mainland Australia and provide further evidence that males may arrange their ranges to maximise reproductive opportunities. Given their highly variable body size and the diverse array of habitats inhabited by this species, there would be value in conducting similar research into the movement ecology of potoroos elsewhere throughout their distribution. Doing so woulddetermine if the patterns of movement and range overlap observed in our study are consistent or vary according to different habitat types, body sizes, and landscape contexts. Improving our understanding of how range size and overlap vary within potoroo populations can inform targeted management actions before and after fire – a key threatening process for this threatened marsupial.
Acknowledgements
We pay our respects to the Gadabanut, the traditional custodians of the lands upon which this study took place. We thank L. Bonifacio, E. Brooks, J. Dickson, Y. Eizenberg, L. Falls, E. Fitzsimmons, S. Girvan, M. Goodie, E. Hinde, E. Liddell, R. Loosveld, E. Mckenzie, D. Ng Sing Kwong, I. Swart, and J. Templeton for their assistance with field work. This project was supported by the Hermon Slade Foundation, Parks Victoria, and the Victorian Government’s Department of Environment, Land, Water and Planning. All research activities were undertaken under wildlife research permit number 10009226 and wildlife and small institutions animal ethics licence number SPFL20096.
References
Ahumada JA, Hurtado J, Lizcano D (2013) Monitoring the status and trends of tropical forest terrestrial vertebrate communities from camera trap data: a tool for conservation. PLoS ONE 8(9), e73707 PMID:.
| Crossref | Google Scholar | PubMed |
Atwood TC, Weeks HP, Jr (2003) Spatial home-range overlap and temporal interaction in eastern coyotes: the influence of pair types and fragmentation. Canadian Journal of Zoology 81(9), 1589-1597.
| Crossref | Google Scholar |
Bates D, Mächler M, Bolker B, Walker S (2015) Fitting linear mixed-effects models using lme4. Journal of Statistical Software 67(1), 1-48.
| Crossref | Google Scholar |
Bennett AF (1993) Microhabitat use by the long-nosed potoroo, Potorous tridactylus, and other small mammals in remnant forest vegetation, south-western Victoria. Wildlife Research 20, 267-285.
| Crossref | Google Scholar |
Bennett AF, Baxter BJ (1989) Diet of the long-nosed potoroo, Potorous-tridactylus (Marsupialia, Potoroidae), in Southwestern Victoria. Australian Wildlife Research 16(3), 263-271.
| Crossref | Google Scholar |
Bennison A, Bearhop S, Bodey TW, Votier SC, Grecian WJ, Wakefield ED, Hamer KC, Jessopp M (2017) Search and foraging behaviors from movement data: a comparison of methods. Ecology and Evolution 8(1), 13-24 PMID:.
| Crossref | Google Scholar | PubMed |
Bjørneraas K, Van Moorter B, Rolandsen CM, Herfindal I (2010) Screening global positioning system location data for errors using animal movement characteristics. The Journal of Wildlife Management 74(6), 1361-1366.
| Crossref | Google Scholar |
Bohonak AJ (1999) Dispersal, gene flow, and population structure. The Quarterly Review of Biology 74(1), 21-45 PMID:.
| Crossref | Google Scholar | PubMed |
Bolker BM, Brooks ME, Clark CJ, Geange SW, Poulsen JR, Stevens MHH, White J-SS (2009) Generalized linear mixed models: a practical guide for ecology and evolution. Trends in Ecology & Evolution 24(3), 127-135 PMID:.
| Crossref | Google Scholar | PubMed |
Bowler DE, Benton TG (2005) Causes and consequences of animal dispersal strategies: relating individual behaviour to spatial dynamics. Biological Reviews 80(2), 205-225 PMID:.
| Crossref | Google Scholar | PubMed |
Buckland ST, Burnham KP, Augustin NH (1997) Model selection: an integral part of inference. Biometrics 53(2), 603-618.
| Crossref | Google Scholar |
Burbidge AA, McKenzie NL (1989) Patterns in the modern decline of Western Australia’s vertebrate fauna: causes and conservation implications. Biological Conservation 50, 143-198.
| Crossref | Google Scholar |
Bureau of Meteorology (2020) Climate data online. Available at http://www.bom.gov.au/climate/data/index.shtml [Accessed June 2020]
Börger L, Franconi N, De Michele G, Gantz A, Meschi F, Manica A, Lovari S, Coulson T (2006) Effects of sampling regime on the mean and variance of home range size estimates. Journal of Animal Ecology 75, 1393-1405 PMID:.
| Crossref | Google Scholar | PubMed |
Cagnacci F, Boitani L, Powell RA, Boyce MS (2010) Animal ecology meets GPS-based radiotelemetry: a perfect storm of opportunities and challenges. Philosophical Transactions of the Royal Society B: Biological Sciences 365, 2157-2162.
| Crossref | Google Scholar |
Cain JW, III, Krausman PR, Jansen BD, Morgart JR (2005) Influence of topography and GPS fix interval on GPS collar performance. Wildlife Society Bulletin 33(3), 926-934.
| Crossref | Google Scholar |
Calabrese JM, Fleming CH, Gurarie E (2016) ctmm: an r package for analyzing animal relocation data as a continuous-time stochastic process. Methods in Ecology and Evolution 7(9), 1124-1132.
| Crossref | Google Scholar |
Claridge AW, Cork SJ (1994) Nutritional-value of hypogeal fungal sporocarps for the long-nosed potoroo (Potorous-tridactylus), a forest-dwelling mycophagous marsupial. Australian Journal of Zoology 42(6), 701-710.
| Crossref | Google Scholar |
Claridge AW, Tanton MT, Seebeck JH, Cork SJ, Cunningham RB (1992) Establishment of ectomycorrhizae on the roots of two species of Eucalyptus from fungal spores contained in the faeces of the long-nosed potoroo (Potorous tridactylus). Australian Journal of Ecology 17, 207-217.
| Crossref | Google Scholar |
Claridge AW, Tanton MT, Cunningham RB (1993) Hypogeal fungi in the diet of the long-nosed potoroo (Potorous tridactylus) in mixed-species and regrowth eucalypt forest stands in south-eastern Australia. Wildlife Research 20(3), 321-338.
| Crossref | Google Scholar |
Coetsee A, Harley D, Lynch M, Coulson G, de Milliano J, Cooper M, Groenewegen R (2016) Radio-transmitter attachment methods for monitoring the endangered eastern barred bandicoot (Perameles gunnii). Australian Mammalogy 38(2), 221-231.
| Crossref | Google Scholar |
DeAngelis DL, Mooij WM (2005) Individual-based modeling of ecological and evolutionary processes. Annual Review of Ecology, Evolution, and Systematics 36, 147-168.
| Crossref | Google Scholar |
Dussault C, Ouellet J-P, Courtois R, Huot J, Breton L, Jolicoeur H (2005) Linking moose habitat selection to limiting factors. Ecography 28, 619-628.
| Crossref | Google Scholar |
D’eon RG, Delparte D (2005) Effects of radio-collar position and orientation on GPS radio-collar performance, and the implications of PDOP in data screening. Journal of Applied Ecology 42, 383-388.
| Crossref | Google Scholar |
Elith J, Leathwick JR (2009) Species distribution models: ecological explanation and prediction across space and time. Annual Review of Ecology, Evolution, and Systematics 40, 677-697.
| Crossref | Google Scholar |
Fieberg J (2007) Kernel density estimators of home range: smoothing and the autocorrelation red herring. Ecology 88(4), 1059-1066 PMID:.
| Crossref | Google Scholar | PubMed |
Fisher DO, Owens IPF (2000) Female home range size and the evolution of social organization in macropod marsupials. Journal of Animal Ecology 69(6), 1083-1098.
| Crossref | Google Scholar |
Fleming CH, Calabrese JM (2022) ctmm: continuous-time movement modelling. R package version 1.0.0. Available at https://CRAN.R-project.org/package=ctmm
Fleming CH, Calabrese JM, Mueller T, Olson KA, Leimgruber P, Fagan WF (2014) From fine-scale foraging to home ranges: a semivariance approach to identifying movement modes across spatiotemporal scales. The American Naturalist 183(5), E154-E167 PMID:.
| Crossref | Google Scholar | PubMed |
Fleming CH, Noonan MJ, Medici EP, Calabrese JM (2019) Overcoming the challenge of small effective sample sizes in home-range estimation. Methods in Ecology and Evolution 10(10), 1679-1689.
| Crossref | Google Scholar |
Frankham GJ, Reed RL, Fletcher TP, Handasyde KA (2011) Population ecology of the long-nosed potoroo (Potorous tridactylus) on French Island, Victoria. Australian Mammalogy 33, 73-81.
| Crossref | Google Scholar |
Frankham GJ, Reed RL, Eldridge MDB, Handasyde KA (2012) The genetic mating system of the long-nosed potoroo (Potorous tridactylus) with notes on male strategies for securing paternity. Australian Journal of Zoology 60, 225-234.
| Crossref | Google Scholar |
Frankham GJ, Handasyde KA, Norton M, Murray A, Eldridge MDB (2014) Molecular detection of intra-population structure in a threatened potoroid, Potorous tridactylus: conservation management and sampling implications. Conservation Genetics 15, 547-560.
| Crossref | Google Scholar |
Frankham GJ, Handasyde KA, Eldridge MDB (2016) Evolutionary and contemporary responses to habitat fragmentation detected in a mesic zone marsupial, the long-nosed potoroo (Potorous tridactylus) in south-eastern Australia. Journal of Biogeography 43(4), 653-665.
| Crossref | Google Scholar |
Girard I, Ouellet J-P, Courtois R, Dussault C, Breton L (2002) Effects of sampling effort based on GPS telemetry on home-range size estimations. The Journal of Wildlife Management 66, 1290-1300.
| Crossref | Google Scholar |
Hall J, Rose K, Austen J, Egan S, Bilney R, Kambouris P, MacGregor C, Dexter N (2021) Baseline health parameters for a newly established population of long-nosed potoroo (Potorous tridactylus) at Booderee National Park, Australia. Journal of Wildlife Diseases 57(3), 515-524 PMID:.
| Crossref | Google Scholar | PubMed |
Harris S, Cresswell WJ, Forde PG, Trewhella WJ, Woollard T, Wray S (1990) Home-range analysis using radio-tracking data – a review of problems and techniques particularly as applied to the study of mammals. Mammal Review 20, 97-123.
| Crossref | Google Scholar |
Hartig F (2020) DHARMa: residual diagnostics for hierarchical (multi-level/mixed) regression models. R package 0.3.2.0. Available at https://CRAN.R-project.org/package=DHARMa
Hebblewhite M, Haydon DT (2010) Distinguishing technology from biology: a critical review of the use of GPS telemetry data in ecology. Philosophical Transactions of the Royal Society B: Biological Sciences 365, 2303-2312.
| Crossref | Google Scholar |
Horne JS, Garton EO, Krone SM, Lewis JS (2007) Analysing animal movements using Brownian bridges. Ecology 88(9), 2354-2363 PMID:.
| Crossref | Google Scholar | PubMed |
Hradsky BA (2020) Conserving Australia’s threatened native mammals in predator-invaded, fire-prone landscapes. Wildlife Research 47, 1-15.
| Crossref | Google Scholar |
Hradsky BA, Kelly LT, Robley A, Wintle BA (2019) FoxNet: an individual-based model framework to support management of an invasive predator, the red fox. Journal of Applied Ecology 56(6), 1460-1470.
| Crossref | Google Scholar |
Hughes RL (1964) Sexual development and spermatozoon morphology in the male macropod marsupial Potorous tridactylus (Kerr.). Australian Journal of Zoology 12, 42-51.
| Crossref | Google Scholar |
Kitchener DJ (1973) Notes on home range and movement in two small macropods, the potoroo (Potorous apicalis) and the quokka (Setonix brachyurus). Mammalia 37, 231-240.
| Crossref | Google Scholar |
Kranstauber B, Kays R, LaPoint SD, Wikelski M, Safi K (2012) A dynamic Brownian bridge movement model to estimate utilization distributions for heterogeneous animal movement. Journal of Animal Ecology 81, 738-746 PMID:.
| Crossref | Google Scholar | PubMed |
Kranstauber B, Smolla M, Scharf AK (2020) Move: visualising and analysing animal track data. R Package version 4.0.2. Available at https://CRAN.R-project.org/package=move
Langrock R, King R, Matthiopoulos J, Thomas L, Fortin D, Morales JM (2012) Flexible and practical modeling of animal telemetry data: hidden Markov models and extensions. Ecology 93(11), 2336-2342 PMID:.
| Crossref | Google Scholar | PubMed |
Legge S, Rumpff L, Woinarski JCZ, Whiterod NS, Ward M, Southwell DG, Scheele BC, Nimmo DG, Lintermans M, Geyle HM, Garnett ST, Hayward-Brown B, Ensbey M, Ehmke G, Ahyong ST, Blackmore CJ, Bower DS, Brizuela-Torres D, Burbidge AH, Burns PA, Butler G, Catullo R, Chapple DG, Dickman CR, Doyle KE, Ferris J, Fisher D, Gallagher R, Gillespie GR, Greenlees MJ, Hohnen R, Hoskin CJ, Hunter D, Jolly C, Kennard M, King A, Kuchinke D, Law B, Lawler I, Lawler S, Loyn R, Lunney D, Lyon J, MacHunter J, Mahony M, Mahony S, McCormack RB, Melville J, Menkhorst P, Michael D, Mitchell N, Mulder E, Newell D, Pearce L, Raadik TA, Rowley JJL, Sitters H, Spencer R, Valavi R, West M, Wilkinson DP, Zukowski S, Nolan R (2022) The conservation impacts of ecological disturbance: time-bound estimates of population loss and recovery for fauna affected by the 2019-2020 Australian megafires. Global Ecology and Biogeography 31, 2085-2104.
| Crossref | Google Scholar |
Lindstedt SL, Miller BJ, Buskirk SW (1986) Home range, time, and body size in mammals. Ecology 67(2), 413-418.
| Crossref | Google Scholar |
Long KI (2001) Spatio-temporal interactions among male and female long-nosed potoroos, Potorous tridactylus (Marsupialia : Macropodoidea): mating system implications. Australian Journal of Zoology 49(1), 17-26.
| Crossref | Google Scholar |
MacKenzie DI, Nichols JD, Lachman GB, Droege S, Royle JA, Langtimm CA (2002) Estimating site occupancy rates when detection probabilities are less than one. Ecology 83(8), 2248-2255.
| Crossref | Google Scholar |
McGregor HW, Legge S, Jones ME, Johnson CN (2014) Landscape management of fire and grazing regimes alters the fine-scale habitat utilisation by feral cats. PLoS ONE 9(10), e109097 PMID:.
| Crossref | Google Scholar | PubMed |
McHugh D, Goldingay RL, Link J, Letnic M (2019) Habitat and introduced predators influence the occupancy of small threatened macropods in subtropical Australia. Ecology and Evolution 9(11), 6300-6317 PMID:.
| Crossref | Google Scholar | PubMed |
McHugh D, Goldingay RL, Parkyn J, Goodwin A, Letnic M (2020) Short-term response of threatened small macropods and their predators to prescribed burns in subtropical Australia. Ecological Management & Restoration 21(2), 97-107.
| Crossref | Google Scholar |
McNab BK (1963) Bioenergetics and the determination of home range size. The American Naturalist 97(894), 133-140.
| Crossref | Google Scholar |
Merrill SB, Mech LD (2003) The usefulness of GPS telemetry to study wolf circadian and social activity. Wildlife Society Bulletin 31(4), 947-960.
| Google Scholar |
Nilsen EB, Pedersen S, Linnell JDC (2008) Can minimum convex polygon home ranges be used to draw biologically meaningful conclusions? Ecological Research 23(3), 635-639.
| Crossref | Google Scholar |
Norton MA, Claridge AW, French K, Prentice A (2010) Population biology of the long-nosed potoroo (Potorous tridactylus) in the Southern Highlands of New South Wales. Australian Journal of Zoology 58, 362-368.
| Crossref | Google Scholar |
Norton MA, French K, Claridge AW (2011) Habitat associations of the long-nosed potoroo (Potorous tridactylus) at multiple spatial scales. Australian Journal of Zoology 58(5), 303-316.
| Crossref | Google Scholar |
Pocknee CA, Legge SM, McDonald J, Fisher DO (2023) Modeling mammal response to fire based on species’ traits. Conservation Biology 37, e14062.
| Crossref | Google Scholar |
Pons P, Lambert B, Rigolot E, Prodon R (2003) The effects of grassland management using fire on habitat occupancy and conservation of birds in a mosaic landscape. Biodiversity and Conservation 12, 1843-1860.
| Crossref | Google Scholar |
Price-Rees SJ, Brown GP, Shine R (2013) Habitat selection by bluetongue lizards (Tiliqua, Scincidae) in tropical Australia: a study using GPS telemetry. Animal Biotelemetry 1, 7.
| Crossref | Google Scholar |
R Core Team (2021). R: A language and environment for statistical computing. R Foundation for Statistical Computing, Vienna, Austria. Available at https://www.R-project.org/
Robley A, Gormley AM, Forsyth DM, Triggs B (2014) Long-term and large-scale control of the introduced red fox increases native mammal occupancy in Australian forests. Biological Conservation 180, 262-269.
| Crossref | Google Scholar |
Robley A, Moloney P, Moxham C, Neave G, Friend G, Fraser I (2016) The effects of interaction between planned burning and foxes on the presence of native mammals. Technical Report Series No. 273. Arthur Rylah Institute for Environmental Research, Department of Environment, Land, Water and Planning, Heidelberg, Victoria.
Schwagmeyer PL (1988) Scramble-competition polygyny in an asocial mammal: male mobility and mating success. The American Naturalist 131, 885-892.
| Crossref | Google Scholar |
Stevenson CD, Ferryman M, Nevin OT, Ramsey AD, Bailey S (2013) Using GPS telemetry to validate least-cost modeling of gray squirrel (Sciurus carolinensis) movement within a fragmented landscape. Ecology and Evolution 3(7), 2350-2361 PMID:.
| Crossref | Google Scholar | PubMed |
Swihart RK, Slade NA, Bergstrom BJ (1988) Relating body size to the rate of home range use in mammals. Ecology 69(2), 393-399.
| Crossref | Google Scholar |
Tomkiewicz SM, Fuller MR, Kie JG, Bates KK (2010) Global positioning system and associated technologies in animal behaviour and ecological research. Philosophical Transactions of the Royal Society B: Biological Sciences 365, 2163-2176.
| Crossref | Google Scholar |
Ward M, Tulloch A, Stewart R, Possingham HP, Legge S, Gallagher RV, Graham EM, Southwell D, Keith D, Dixon K, Yong C, Carwardine J, Cronin T, Reside AE, Watson JEM (2022) Restoring habitat for fire-impacted species’ across degraded Australian landscapes. Environmental Research Letters 17(8), 084036.
| Crossref | Google Scholar |
Woinarski JCZ, Burbidge AA, Harrison PL (2015) Ongoing unraveling of a continental fauna: decline and extinction of Australian mammals since European settlement. Proceedings of the National Academy of Sciences 112(15), 4531-4540.
| Crossref | Google Scholar |
Worton BJ (1989) Kernel methods for estimating the utilization distribution in home-range studies. Ecology 70(1), 164-168.
| Crossref | Google Scholar |
Zhang J, Rayner M, Vickers S, Landers T, Sagar R, Stewart J, Dunphy B (2019) GPS telemetry for small seabirds: using hidden Markov models to infer foraging behaviour of Common Diving Petrels (Pelecanoides urinatrix urinatrix). Emu – Austral Ornithology 119, 126-137.
| Crossref | Google Scholar |