

Novel acoustic lure methodology facilitates detection of the cryptic ghost bat at a landscape scale
Laura Ruykys A * , Nicola Hanrahan A B and Danielle Stokeld A
A
B
Abstract
The conservation of the threatened ghost bat (Macroderma gigas) is currently hampered by a lack of standardised survey methodology for detecting the species away from known roosts. The low amplitude of the species’ echolocation call, together with only sporadic production of social calls while foraging, means that acoustic detection is unreliable. However, the ghost bat is known to be physically responsive to full-spectrum playback of its own social calls when these are broadcast in close vicinity (~100 m) to known roosts.
Using a two-phase investigation, we aimed to establish whether playback could be used to detect ghost bats away from the roost, in open woodland habitat in the Northern Territory.
In phase one, a trial of paired (active treatment and control) call playback experiments was conducted at three distances (1 km, 2.5 km and 5 km) from four known roosts using the ghost bat’s ‘squabble’ social vocalisation. Call playback, distance, roost and moon phase were used as explanatory variables in an information-theoretic approach using generalised linear models. In phase two, a 65 010-ha survey area was broken into a grid of adjacent hexagons with centroids spaced 5 km apart; replicate surveys using call playback were conducted at each centroid. An occupancy model was used to determine detection probability for the method in the survey area.
Ghost bats were successfully detected. In phase one, one model had substantial support and this contained only one variable: that of the presence or absence of the ‘squabble’ vocalisation. In phase two, ‘hotspots’ of ghost bat activity were detected in a region for which records were scant and predominantly historical. The occupancy model identified that 72% of sites were occupied and established a detection probability of 0.505, which provided a cumulative probability of 0.75.
Our results show that call playback is a reliable method of detecting the cryptic and threatened ghost bat at a landscape scale in the Northern Territory.
We suggest that call playback could be used as a standardised survey technique across the range of the ghost bat.
Keywords: acoustic, broadcast, call playback, Chiroptera, Macroderma gigas, survey guidelines, threatened species, vocalisations.
Introduction
The ghost bat (Macroderma gigas), which reaches up to 172 g in bodyweight (Armstrong et al. 2023), is the largest echolocating species of bat in Australia (Richards et al. 2008) and the third-largest in the world (after Vampyrum spectrum at up to 235 g (Reid 2009) and Cheiromeles torquatus at up to 200 g (Heller 1995)). It is a strictly carnivorous bat, being a predator of frogs, reptiles, birds, small terrestrial mammals and other bats, as well as large insects (Douglas 1967; Milne et al. 2016). Fossil and sub-fossil remains testify to the ghost bat’s earlier, more widespread distribution in Australia (Bridge 1975). However, the species is now restricted to tropical and sub-tropical northern Australia; specifically, to the Pilbara and Kimberley regions of Western Australia, the northern part of the Northern Territory (‘Top End’) and coastal and near-coastal eastern Queensland from Cape York to near Rockhampton (Australasian Bat Society – BatMap 2022). Within this distribution, the ghost bat is found in a range of habitats, from open savanna woodland to arid spinifex hillsides. However, the species’ area of occupancy is restricted by its reliance on underground roosts that have warm, humid microclimates and thus maintain individuals’ heat and water balance (Armstrong et al. 2021).
Ghost bats – which are highly social and colonial – roost in colonies that range in size from a few to hundreds of individuals; colonies in excess of 1000 animals are unusual (Richards et al. 2008). Worthington Wilmer et al. (1994, 1999) determined genetically that there is substantial population sub-division, with females having particularly high fidelity to their natal roosts. Acoustic communication is important for this social species, with the ghost bat producing several structurally distinguishable and functionally distinct vocalisations within the roost and while foraging (Hanrahan 2020). The species’ vocal repertoire consists of both humanly audible and ultrasonic vocalisations that are used in a range of scenarios; these include agonistic interactions, mother–pup communication, contact and, potentially, resource defence (Tidemann et al. 1985; Guppy and Coles 1988; Hanrahan et al. 2019, 2022).
Based on population size and evidence of decline, the ghost bat was listed as Vulnerable under the Environment Protection and Biodiversity Conservation (EPBC) Act 1999 and on the IUCN Red List (Armstrong et al. 2021). Identified conservation and management actions include surveying to better define distribution, and establishing or enhancing a monitoring program (Threatened Species Scientific Committee 2016). However, both of these are hampered by the absence of an agreed, standardised survey approach for the species. There are also challenges in relation to determining the presence or absence of the ghost bat during environmental impact assessments and referrals under the EPBC Act 1999. The Survey guidelines for Australia’s threatened bats (Australian Government 2010) are intended to provide a guide on the effort and methods considered appropriate when conducting a presence/absence survey for bat species listed under the EPBC Act 1999. However, the guidelines pre-date the listing of the ghost bat and consequently do not provide species-specific advice on how to survey for it.
Land managers, environmental consultants, researchers and/or other practitioners currently use a self-determined mixture of methods to survey for the species away from known roosts. That is, there is no common, agreed approach to standardising survey method, effort or timing and thus surveys are often not comparable temporally or geographically. Survey methods often include all of, or a selection from, full-spectrum acoustic surveys, spotlight surveys during call broadcast, live trapping, searching for and within caves and crevices that may be used as roost sites, counts using thermal imaging cameras and/or faecal DNA analysis (Hourigan 2011; Ottewell et al. 2020). None of these approaches are wholly reliable and some have the potential to cause disturbance that results in roost abandonment. Although the ghost bat has a distinctive echolocation call, it is of low intensity (‘soft’) (Pettigrew et al. 1986), which reduces the effective range of an ultrasonic detector (Duffy et al. 2000) and makes ghost bats difficult to detect with standard bat detectors. Furthermore, the ghost bat’s louder social vocalisation cannot be reliably detected away from the roost using bat detectors because animals only produce such calls at the roost or sporadically in association with particular behaviours away from the roost (Guppy and Coles 1988; Hanrahan et al. 2019). Spotlight surveys during call broadcast are not standardised, may be biased by being undertaken close to known or suspected roost locations, may be undermined by regionalisation of calls (Hanrahan 2020), cannot be deployed at a landscape-scale for surveying and may be influenced by distance from roost(s). Live trapping (harp trapping or mist netting) away from roosts is impractical for large survey regions and is unreliable because ghost bats have high visual acuity (Pettigrew et al. 1988) and may avoid such traps. Searching for roosts is also likely to be biased to known or suspected roost locations, is challenged by the temporally variable occupancy of roost sites (Toop 1985; Cramer et al. 2023), may inadvertently flush and/or disturb roosting ghost bats (a documented threat; Woinarski et al. 2014), may require experience in speleological exploration, is likely to be time-consuming and is also problematic for large survey regions.
A further – and currently relatively novel – method in bat surveying is the use of acoustic lures (Preble et al. 2021). The premise of acoustic lures is that broadcasting acoustic stimuli (natural or synthetic) may increase detection rates by provoking a response that makes individuals more readily detectable. For bats, this may include increasing trapping rates in mist nets and harp traps, or as an aid to surveys that do not involve capture (Michaelsen et al. 2011; Lintott et al. 2013). For example, research in Europe has found that capture rates of vespertilionid bats in harp traps or mist nets can be increased by using acoustic lures that broadcast simulations of bats’ social calls (Lintott et al. 2013). There has also been some use of acoustic lures for bats in Japan (e.g. Preble et al. 2021) and Australia (e.g. Hill et al. 2015). The ghost bat’s curiosity and response to acoustic stimuli was noted in Pettigrew et al. (1986), who commented that human-created whistles and squeaks ‘…proved to be very effective in attracting Macroderma, which flew in close to the observer’s head to investigate’. Recent research identified that ghost bats are physically responsive to the broadcast of some of their own social vocalisations – including the ‘squabble’ (Hanrahan 2020; Hanrahan et al. 2022) – at a distance of 100 m from a known roost. Specifically, individuals repeatedly swooped the speaker that was broadcasting the call and the capture rate in mist nets was significantly higher while the ‘squabble’ was being broadcast than during the ‘silence’ control (Hanrahan N, Turbill C, Dalziell AH, Armstrong KD, Welbergen JA unpubl. data).
We hypothesised that call playback, in conjunction with infra-red video recorders, could be used to detect ghost bats in open woodland habitat. Infra-red video recorders allow multiple sites to be sampled simultaneously and for extended periods each night, plus enable the validation of the identity of any responding bats. Our first aim was to determine whether call playback increased the detection of ghost bats and, if so, whether there was an effect of distance from known roost, roost size or moon phase. Secondly, assuming effectiveness, we aimed to apply the novel survey method at a landscape scale and identify areas of activity (‘hotspots’) for ghost bats in a region with a scattering of current and historical records of the species.
Materials and methods
This study was conducted in tropical woodland savanna in the Northern Territory, Australia and was divided into two phases. Phase one trialled the effectiveness of call playback (henceforth ‘trial’) and was conducted in the vicinity of the town of Pine Creek (13.8°S, 131.8°E), which is located approximately 200 km south-east of Darwin (Fig. 1). As part of the trial, a test of the ‘zone of influence’ of the call playback (i.e. determination of the distance at which calls could be heard) was conducted in the vicinity of Darwin (12.6°S, 131.0°E). Phase two tested the application of the method (henceforth ‘application’) and was conducted in an area around the town of Katherine (14.46°S, 132.3°E), which is located approximately 300 km south-east of Darwin.
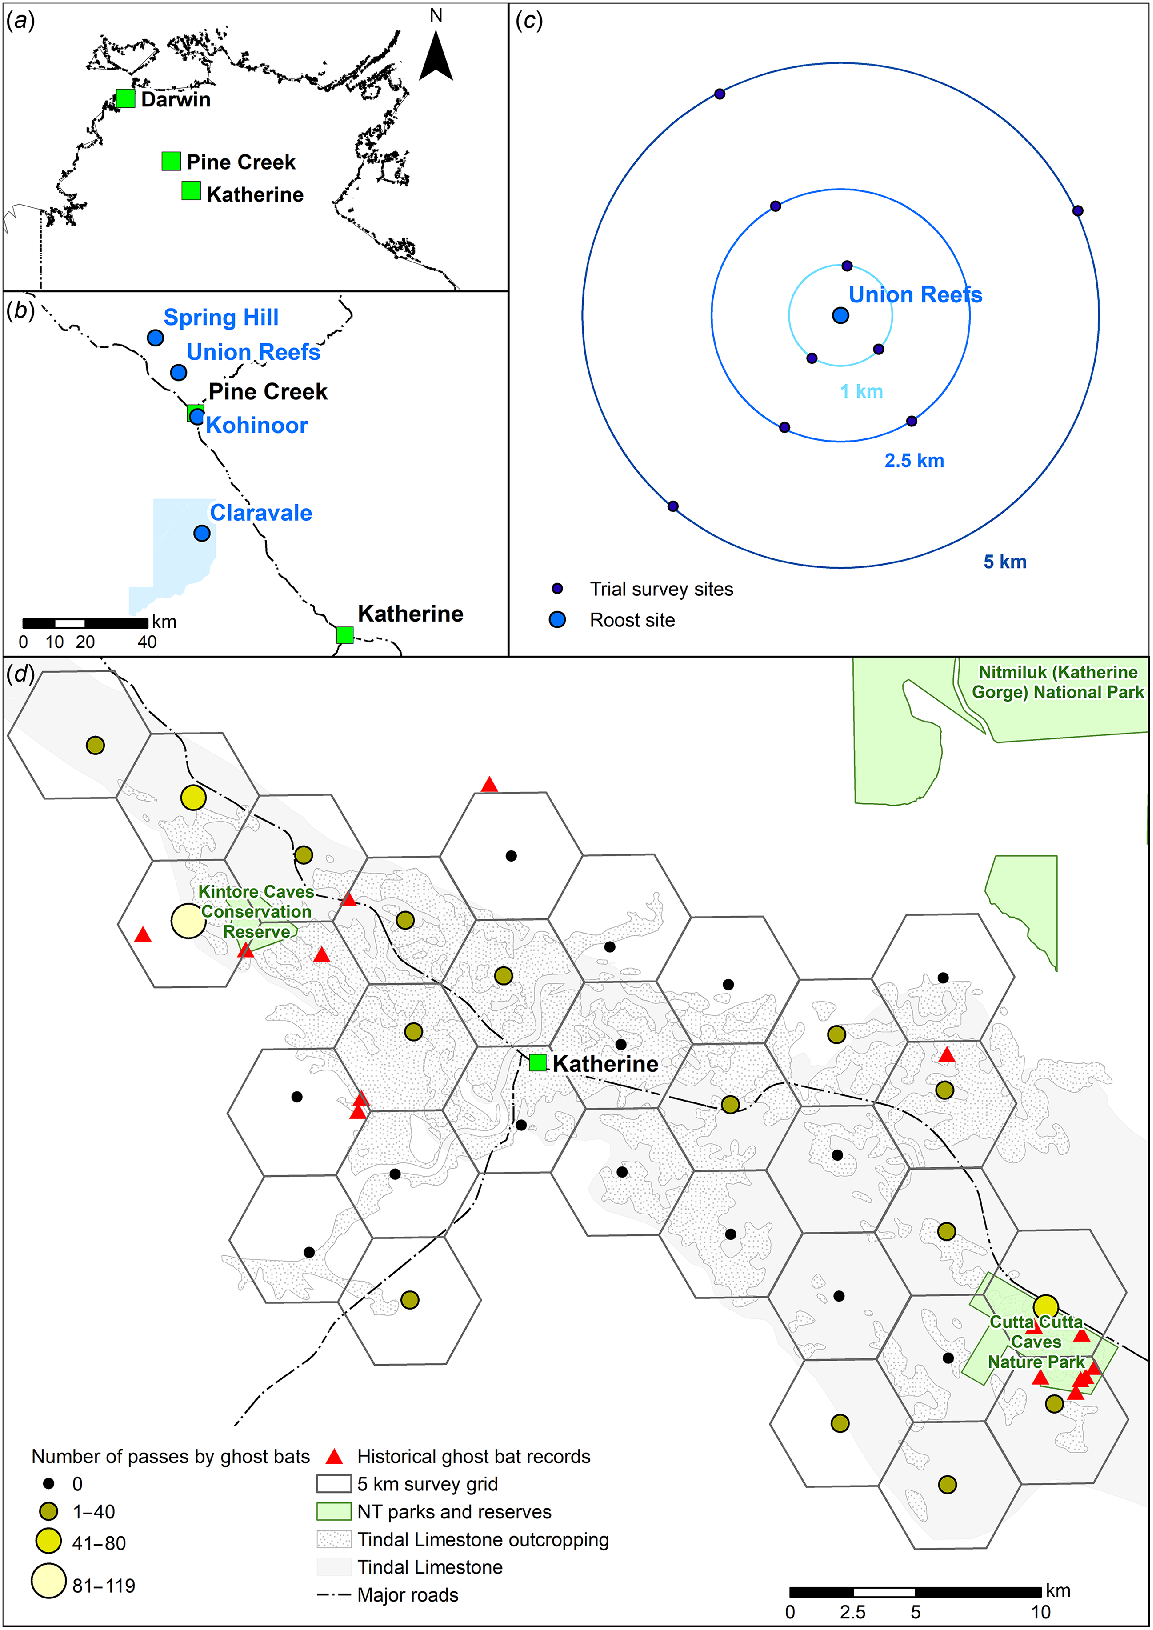
(a) Location of relevant locations within the Northern Territory, Australia: Pine Creek, where the effectiveness of call playback was trialled; Katherine, where the survey method was applied; and Darwin, where the ‘zone of influence’ experiment was conducted. (b) Location of known ghost bat roosts at which the Pine Creek trial was conducted. (c) Diagrammatic representation of the survey design around a known ghost bat roost in the trial conducted at Pine Creek. (d) Survey design of, and results from, the application of the survey method in Katherine.
Phase one – trial
The presence of ghost bats around Pine Creek has long been recognised (e.g. Parker 1973), and the species is known to roost in both natural caves and human-made sites (mine shafts and mine workings) in the region. The current size of the species’ regional population is uncertain. This is because many known sites have not been inspected recently, other roost sites are likely to be present but are undocumented, and some sites have been lost or damaged due to instability or during mining operations (Threatened Species Scientific Committee 2016; Barden and Armstrong 2019).
The trial was conducted around four known ghost bat roosts within the Pine Creek region: Kohinoor adit; Union Reefs; Claravale Station; and Spring Hill (Fig. 1). These four roosts do have recent count data, as collated by Barden and Armstrong (2019) from grey literature and by canvassing sources of fauna records for further details. As of late 2019, the population across the four roosts summed to approximately 570–1132 ghost bats (Barden and Armstrong 2019). This potentially constitutes 9.5–28.3% of the national (global) population, based on an estimate of 4000–6000 ghost bats by Armstrong et al. (2021). The four roosts have population estimates that range in size from ~20 to ~800 bats (Table 1); as such, roost was considered to be a proxy for population size. The four roosts are a minimum of 13.5 km and maximum of 65 km apart. There are no other known roost sites in the area; however, the region has not been systematically surveyed for ghost bats and thus it is possible that other roost sites may be present.
| Roost | Roost type | Historical count(s) | Date of most recent estimate | Recent lower estimate | Recent upper estimate | Comment | Reference | |
|---|---|---|---|---|---|---|---|---|
| Kohinoor | Adit (historical) | 300–1500 irregularly between 1981 and 2010 | 2015–2018 | 400 | 800 | Occupied year-round, supports reproduction (mating, parturition and weaning) | Barden and Armstrong (2019); Hanrahan (2020) | |
| Spring Hill | Adit (historical) | None pre-1990 | 2018 | 100 | 300 | All adits in project area considered collectively. Due to colony size during the estimated maternity period, some shafts are presumed to support reproductive behaviours | Northern Resource Consultants (2018) | |
| Claravale Station | Cave (limestone) | 70 to ‘>500’ between 1990 and 1992 | 2016–2018 | 50 | 100 | Pertains to the Top End Speleological Society’s cave identification of one roost only; estimates for other known caves excluded. Supports reproduction and occupied year-round | Top End Speleological Society records; Hanrahan (2020) | |
| Union Reefs | Adit (historical) | ~200 in now-destroyed adits G and H | 2019 | 20 | 30 | OK adit, Union North and Prospect considered collectively | Barden and Armstrong (2019) |
The trial was conducted in May 2020, the period of mating/gestation (Hanrahan et al. 2019), when males from the surrounding area have joined maternity roosts (Toop 1985). At each of the four roosts, surveys were conducted at three distances - 1 km, 2.5 km and 5 km - with the known roost located in the centre (Fig. 1). In total, there were 30 survey sites: three replicates per distance at Spring Hill (n = 9) and Union Reefs (n = 9) and, due to access constraints, only two replicates per distance at Claravale Station (n = 6) and Kohinoor (n = 6). The location of survey sites was determined via desktop assessment of aerial imagery, with as even a directional spread around the roost as possible, given access constraints. If ground-truthing indicated that the location of a survey site was unsuitable, surveyors could adjust its placement, but only such that the distance from the roost was maintained. Grounds for unsuitability included the survey site being inaccessible or survey equipment being highly visible from a track (and thus at increased risk of theft). All survey sites were within areas of savanna woodland and within 200 m of tracks (mostly single-vehicle dirt).
At each survey site, surveys were undertaken over two nights: on the first survey night, there was no call playback (‘control’) and on the second survey night, the ghost bat ‘squabble’ call was broadcast (‘active treatment’). Those two survey nights were not necessarily consecutive. Instead, the survey schedule was designed to ensure that, on any one night, active treatment was run at only one survey site within a roost; for example, active treatment was not undertaken simultaneously at the 1-km and 2.5-km distances within the one roost. The aim of this was to minimise any potential interference within a roost, because individuals may be less responsive to a second survey site within a roost if they have already responded to call playback at the first survey site. However, on any one night, up to four active treatments were run across the four roosts (i.e. multiple roosts were surveyed simultaneously with active treatments), because it was considered less likely for interference to occur across roosts. Furthermore, it was considered that running multiple controls simultaneously would not lead to interference; as such, on any one night, up to two controls were run within a single roost. On no occasion were a control and an active treatment run on the same night within one roost. Survey sites and distances from roosts were surveyed randomly over the 20-night sampling period.
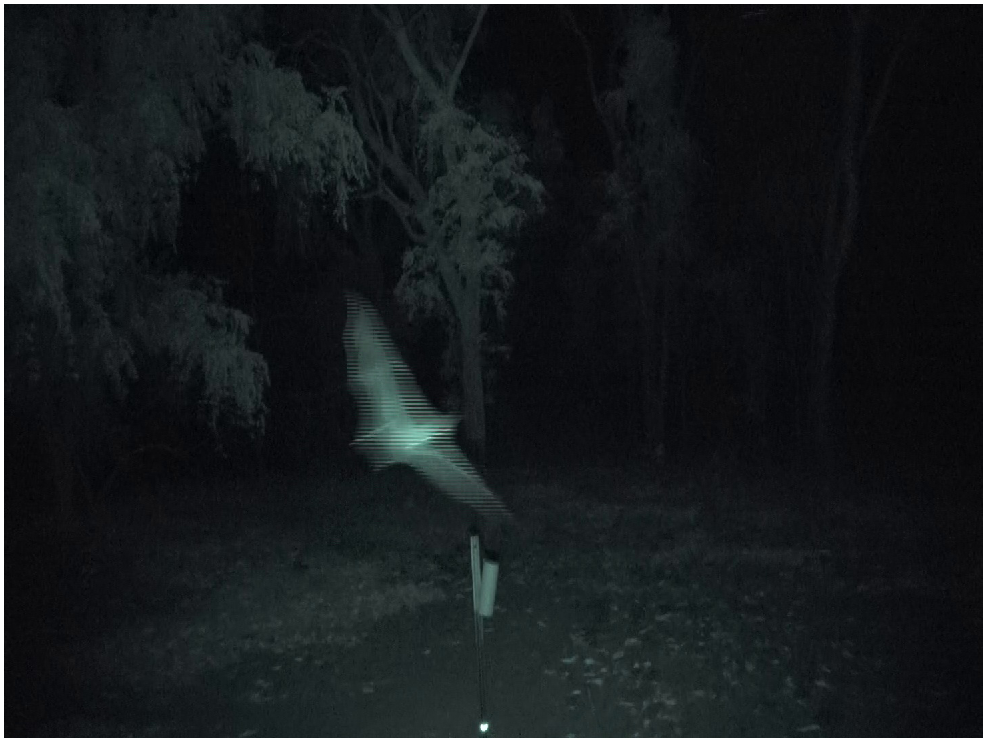
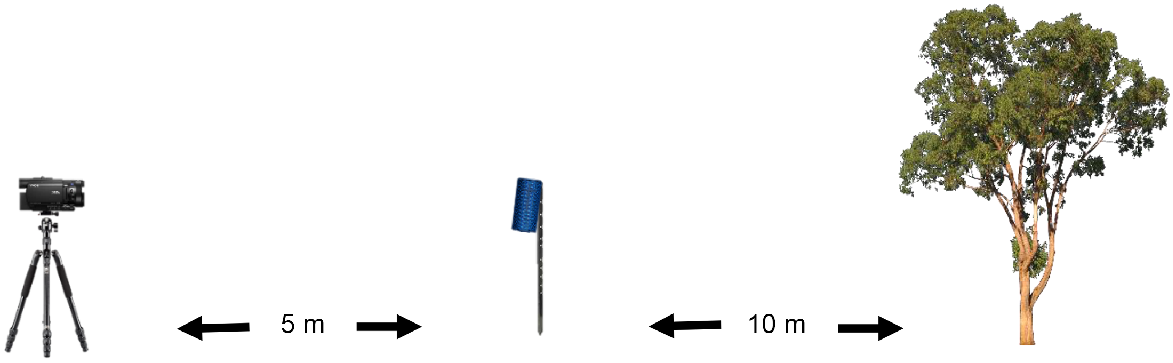
The survey sites to be run that night were set up each afternoon. At each survey site, surveyors chose a relatively open area and identified a reference tree: a relatively straight, tall, sturdy tree that would vertically fill the frame of the video camera. Surveyors determined the direction of the known roost and flattened vegetation in an area measuring approximately 15 m by 4 m in front of the reference tree, in the direction away from the roost. A fence dropper was driven into the ground 10 m from the reference tree, within the cleared area, ensuring that approximately 1 m of fence dropper length was retained above the ground. The fence dropper had a narrow, vertical stripe of reflective tape adhered at 68 cm from its top, equating to the approximate wingspan of a ghost bat (Churchill 2008). This stripe was visible in the footage from the video camera and thus used as an approximate reference to scale the sizes of various species – particularly bat species – seen in video footage (Fig. 2). A Bluetooth-enabled speaker (Ultimate Ears Boom 3) that emitted sound over 360° was attached to the top of the fence dropper. A tablet (Samsung Galaxy Tab S7) with Bluetooth connection and with the required audio files pre-loaded into a media player (VLC media player ver. 3.0.16) was placed in a waterproof container and left proximate to the speaker.
Still photograph of a ghost bat from video footage, illustrating how the reference tree, fence dropper and reflective tape were set up. It also illustrates how the number of passes past the vertical plane between the video camera and the reference tree can be counted as a measure of response.
Both the control and active treatment broadcasts were to commence 30 min after sunset. However, travel distances and constraints in personnel necessitated that equipment be set up across survey sites in the late afternoon through to just prior to the survey period. The default for the Ultimate Ears Boom 3 (and likely other) speakers is to switch off after 15 min of not playing sound. As such, an audio file (that would not disturb the natural soundscape of the survey site) was needed to prevent the speaker from switching off before the commencement of the survey. An audio file (.wav) that consisted of a recording from ghost bat roosts across the Northern Territory (but that was devoid of ghost bat vocalisations) was used for this purpose (Hanrahan 2020). If the control was being run at that survey site that night, then from 30 min after sunset, this audio file from ghost bat roosts was continued for the 120 min-long experimental time (henceforth ‘survey period’). If the active treatment was being run at that survey site that night, then from 30 min after sunset, a repeating track of 2 min of the ‘squabble’ playback followed by 2 min of silence was played for the 120-min survey period. The ‘squabble’ playback consisted of full-spectrum recordings of good-quality ‘squabbles’ recorded at roosts across the ghost bat’s distribution in the Northern Territory (Hanrahan 2020). For both the control and active treatment survey periods, a ‘beep’ file was added at the start of the playlist and played at the end of the set-up of a survey site so that it was clear to surveyors that the broadcast had commenced playing. The volumes on both the tablet and speaker were set to their respective maximums. To check consistency across survey sites, a decibel meter (Digitech Micro Sound Level Meter) was used to test the decibel level of the ‘beep’ only; this was tested immediately adjacent to the fence dropper. Amplitude reached approximately 90 dB.
Surveyors measured a further 5 m in front of the speaker and fence dropper; here, a video camera with infra-red recording capacity (Sony FDR-AX33 Handycam 4K) was set on a tripod such that the video camera was at a height of 1 m. The video camera was set so that it faced the reference tree, with the fence dropper vertically central in the field of view (Fig. 2). The reflective tape on the fence dropper was aligned such that it was just visible at the base of the video camera’s field of view. The video camera had an infrared lamp (TECHview Long Range Infrared Spotlight, model QC-3654 with 18 W maximum power) positioned directly underneath and this was attached to a 12V battery (Fig. 3). To increase the duration of the video camera’s battery at survey sites set up earlier in an afternoon, a portable 12V DC lithium battery power bank with an AC inverter (Powertech model MB-3748) was attached to the video camera. The video camera had a 128-GB secure digital (SD) card inserted, was manually focused to a distance of 0.3 (video camera setting) and had the night mode turned on. Recording commenced at the time of surveyors’ departure. To avoid drawing in ghost bats and influencing the result, surveyors left survey sites prior to the commencement of the survey time and did not retrieve equipment until after survey cessation. Immediately after retrieval, footage from the SD cards was downloaded onto an external hard drive.
To determine whether the echolocation calls of lured ghost bats could be passively detected, a bat detector (Anabat Swift, Titley Scientific, Queensland, Australia) was deployed on the reference tree at each survey site for both the control and active treatment. Detectors were deployed at chest height, with the ultrasonic omnidirectional microphone placed on the far side of the tree, away from the speaker. The microphone was angled at 45° down from vertical. Detectors were programmed with default settings, a sample rate of 500 kHz and a schedule of 7–10 pm, which accommodated the entire experimental period.
All video imagery was manually reviewed by one observer (LR). Morphologically, ghost bats can be distinguished by their relatively large size, pale colouration and large ears that are joined above the head (Churchill 2008). In the videos, an approximation of body size and estimation of wingspan was assisted by the reflective tape on the fence dropper. This was found to be a useful aid, particularly for animals flying in the proximity of the fence dropper. If animal size was unclear, the video playback could be paused when the animal was closest to the fence dropper and a visual comparison undertaken between wing length and the distance on the fence dropper. However, it should be noted that body size and wingspan were not solely relied upon for species identification, especially because an animal’s increasing proximity to the video camera can distort the reviewer’s perception of body size. Rather, a combination of factors were used to confidently differentiate ghost bats from other bats and other fauna. Specifically, together with body size and wingspan, the pale body colour, shining white eyes (particularly noticeable if an individual was flying towards the camera) and ear shape of ghost bats were identifying morphological features. Individuals were also confirmed as being ghost bats through their characteristic behaviour, which included swooping and/or hovering at the speaker, a slower flight speed and more ‘gliding’ flight trajectory than those of other species and, often, multiple passes past the fence dropper as individual(s) investigated the sound source (Appendix 1).
The total number of passes by ghost bats past the vertical plane between the video camera and the reference tree (Fig. 2) was scored as a measure of response. From this, the number of passes by ghost bats in each 10-min period within the 120-min survey period was calculated.
Automated review of video footage for the presence of ghost bats was also trialled through use of the software program ‘DeepMeerkat’ (Weinstein 2018), which combines OpenCV and TensorFlow into a single Windows application. Specifically, we compared results from manual review with outputs from ‘DeepMeerkat’. ‘DeepMeerkat’ was used in its simplest form, i.e. no TensorFlow model training was undertaken and only the data files that DeepMeerkat exports were used to manually create a decision tool for the presence/absence of ghost bats.
Acoustic files from the bat detectors were downloaded and examined manually in the software program ‘Anabat Insight’ (Titley Scientific, Queensland, Australia). Wherever possible, the species making the call was identified using characteristic call parameters described in Milne (2002), and the number of calls for each species was recorded.
The ‘zone of influence’ assessment was conducted in August 2020 in intact savanna woodland that was selected to ensure that there was no audible vehicle noise. The objective of the assessment was to estimate the humanly audible distance of the broadcast of the ghost bat’s social call in four cardinal points, as an estimate of the minimum ‘range’ of the audibility of the broadcast.
The same type of speaker as that used in the trial was erected 1 m above the ground on a fence dropper. One person remained at the speaker and was tasked with commencing the call broadcast, using the same tablet used at Pine Creek. A second person, who was using a GPS, progressively moved further from the speaker (0 m, 10 m, 25 m, 50 m, 75 m, 100 m, 125 m, 150 m) in each cardinal direction. At each distance–direction combination, the second person first recorded ambient noise (i.e. no call playback) at the site for 30 s. This was followed by recording 30 s of the broadcast of the ‘squabble’ call. Sound was recorded using a Rode NTG-2 microphone and a Roland Edirol R-09HR digital sound recorder. To determine if the broadcast was detectable by human ear at each distance, recordings were later listened to and the spectrograms examined by eye, by one reviewer (NH). The furthest distance at which call playback could be heard in each direction was noted. Ghost bats have peak hearing frequencies between 10–20 kHz and 35–43 kHz and excellent auditory perception (Guppy and Coles 1988). As such, the results are considered to be a minimum zone of influence, because the ghost bat’s hearing may be able to detect the recordings from further away.
Phase two – application
The survey method was applied around the town of Katherine, Northern Territory (Fig. 1). The town and surrounding area is underlain by the Tindall Limestone Aquifer (Fig. 1), which is fractured and thus cave- and crevice-forming (Knapton 2002; Northern Territory Government 2019). The Katherine region has a scattering of previous records of ghost bats in the Fauna Atlas NT database (Northern Territory Government 2021), mainly in and around conservation land to the north-west (Kintore Caves Conservation Reserve) and south-east (Cutta Cutta Caves Nature Park) of the town (Fig. 1).
In order to target areas in the landscape around Katherine that would be conducive for the ghost bat to roost and forage, a survey area was delineated (Fig. 1). Spatial data were overlain using the mapping program ArcGIS (ver. 10.6) and layers used were: all records (1964–2005) of ghost bats from the Fauna Atlas NT database within the survey area; the underlying Tindall Limestone Aquifer; surface-cropping Tindall Limestone; mapped sinkholes (Northern Territory Government 2014); and point locations of karst features identified and/or explored by the (now-defunct) Top End Speleological Society. A fishnet of hexagons was then overlain over the intersection of those layers, with the centroid of each hexagon being 5 km from the centroid of adjacent hexagons (Fig. 1). The spatial separation of 5 km was chosen based on the results from the trial at Pine Creek. Wherever possible, the exact location of the centroids derived through this process was used as the on-ground survey site. However, some survey sites had to be moved due to issues relating to access or the centroids not falling within areas of native vegetation. In these cases, survey sites were moved to the nearest accessible and/or vegetated location, with a maximum deviation of 750 m from the original centroid location.
The same equipment configuration as in the trial at Pine Creek was used, except that passive bat detectors were not deployed and there was no control; instead, all survey nights at all survey sites were active treatments (i.e. involved broadcast of the ‘squabble’ call). To account for imperfect detection, surveys were conducted at each survey site twice, on two non-consecutive nights. The aim of running surveys on non-consecutive nights was to reduce interference across nights; for example, ghost bats could conceivably return on night two to the location at which they heard social calls on night one. On any one night, up to four survey sites were surveyed. Surveys were scheduled such that all survey sites surveyed on one night were as far apart from each other as possible, with an absolute minimum distance of 10 km between each survey site. The objective of this was to minimise interference among survey sites – surveying adjacent (5 km apart) survey sites simultaneously may have introduced bias; for example, by adjacent sites being unknowingly located under animals’ standard flight paths. Surveys were conducted over a period of 16 nights in October–November 2020, the time of year when young are newly independent and adult males have dispersed (Hanrahan et al. 2019).
Analyses
For the trial at Pine Creek, data exploration was carried out following the protocol described in Zuur et al. (2010). This included ensuring that there were no outlying observations in the variables, no collinearity among explanatory variables and that zero inflation was checked. To model the presence/absence of ghost bats (because use of the count data would have led to pseudoreplication), Bernoulli generalised linear modelling (GLM) with a logit link function was used in the software program ‘R’ (ver. 4.1.2; R Core Team 2021). Explanatory variables were those of treatment (‘active treatment’ vs ‘control’; categorical covariate), roost (categorical covariate), distance from known roost (categorical covariate) and moon phase (continuous covariate, representing percent of the moon illuminated for each survey night; Thorsen 2023). It should be noted that the moon illumination data do not account for the time at which the moon rose and how that related to the survey period, nor for local conditions such as cloud cover. Sampling covered the full set of moon phases).
The information-theoretic approach (Burnham and Anderson 2002) was used to identify a minimum adequate model from a set of a priori models in which each model (labelled M1–M10; Table 2) was associated with a simple, biologically relevant hypothesis. Given the relatively small dataset, the number of explanatory variables in each model was restricted, and no interactions were included. Akaike’s information criteria corrected for small sample size (AICc) (Akaike 1973; Hurvich and Tsai 1989) was used to select among candidate models, where the models with the lowest AICc were determined to be the best of the set of models considered (Burnham and Anderson 2002). Model assumptions were verified by plotting residuals versus fitted values, versus each covariate in the model and versus each covariate not in the model. The residuals were also assessed for spatial dependency (Zuur et al. 2009). Two generalised linear mixed models (mixed effects models) were run: the first for survey sites nested within roosts, and the second with roosts only as the random variable. However, both mixed effects models resulted in a singular fit, indicating that any variation in survey sites or roosts is captured by the fixed effects, leading to near-zero variation in the random intercepts. Therefore, models with and without random effects have the same results, and there is no indication that inclusion of a random structure in the models is required (Appendix 2).
| Model | Expression | Hypothesis | d.f. | AICc | ΔAICc | Model likelihood | Akaike weights | |
|---|---|---|---|---|---|---|---|---|
| M1 | Treatment | Main influence on detection is call playback | 2 | 54.43 | 0.00 | >0.99 | 75.58 | |
| M2 | Treatment + Distance | Detection is influenced by call playback and distance from known roost | 4 | 58.00 | 3.57 | 0.17 | 12.72 | |
| M3 | Treatment + Roost | Detection is influenced by call playback and roost size | 5 | 58.57 | 4.14 | 0.13 | 9.54 | |
| M4 | Treatment + Distance + Roost | Detection is influenced by call playback, distance from known roost and roost size | 7 | 62.59 | 8.16 | 0.02 | 1.28 | |
| M5 | Distance | Detection is influenced by distance from known roost alone | 3 | 77.31 | 22.88 | <0.01 | 0.00 | |
| M6 | Roost | Detection is influenced by roost size alone | 4 | 78.36 | 23.93 | <0.01 | 0.00 | |
| M7 | Distance + Roost | Detection is influenced by how far bats fly from different-sized roosts | 6 | 82.56 | 28.13 | <0.01 | 0.00 | |
| M8 | Moon | Detection is influenced by moon phase | 2 | 75.74 | 21.31 | <0.01 | 0.00 | |
| M9 | Treatment + Distance + Roost + Moon | Global model | 8 | 65.12 | 10.69 | <0.01 | 0.36 | |
| M10 | Null | None of the covariates affect detection of ghost bats | 1 | 73.60 | 19.17 | <0.01 | 0.01 |
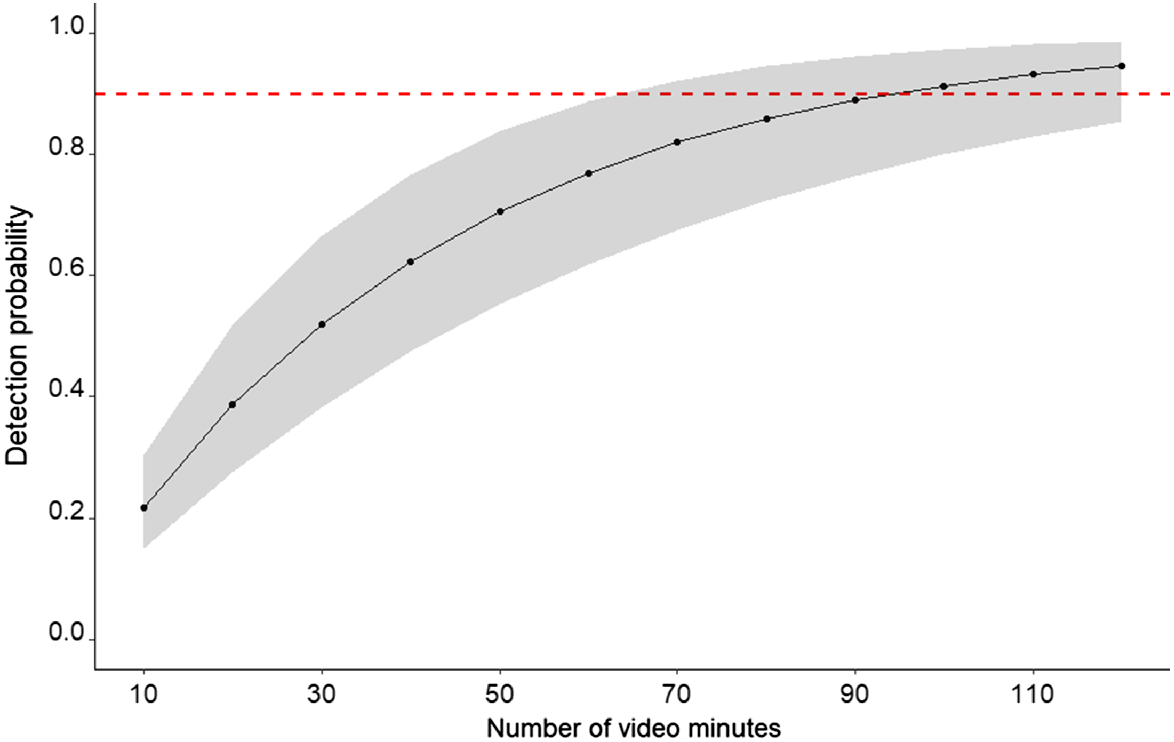
To determine the optimal number of minutes that videos should be run to detect ghost bats, a detection probability analysis was undertaken using the active treatment data only. An encounter history was derived from detection of bats in each 10-min period of the experimental time and converted to a binary value (0/1). For this, in cases where the video ended prior to the 120 min (N = 3), time increments were recorded as having no survey if the video length for that increment was less than 9 min (n = 2). A single-season occupancy analysis was run in the program R using the package ‘unmarked’ (Fiske and Chandler 2011). A global model included the variables of roost and distance from roost as coefficients in the detection function, and roost as a coefficient in the occupancy function. Model selection was undertaken using R package ‘MUMin’ (Barton 2017), and a confidence set of models was created using a 95% cumulative weight criterion. The optimal number of minutes that videos should run in order to detect ghost bats at least once during a survey period, if the species is present at a survey site, was calculated using the model-estimated detection probability per 10-min video increment. The optimal number of video increments was determined using the cumulative detection probability equation (P* = 1 – (1 – P)k) (Kéry and Royle 2016) and a false absence rate of 0.10.
For the application at Katherine, review of video camera footage was undertaken manually by one observer (LR), and the number of passes by ghost bats past the vertical plane between the video camera and the reference tree was counted. The total and average number of passes by ghost bats at each survey site across the two survey nights was calculated. Due to the timing of the survey coinciding with when ghost bats are newly independent and thus smaller in size, on some occasions there were difficulties in differentiating whether an individual in the video footage was a juvenile ghost bat or a different bat species (Appendix 3). In these circumstances, a second observer (NH) reviewed the footage and independently identified the species. If both observers had identified the detection as being that of a ghost bat, then it was confirmed as such.
To obtain an occupancy estimate and detection probability, a single-season occupancy analysis was run in the program R using the package ‘unmarked’ (Fiske and Chandler 2011). Detections at each survey site for each survey night were converted to a binary value (0/1). A null model (constant detection and occupancy probability) was compared with a model in which detection varied among surveys. Calculations of the number of surveys required for a particular detection probability were undertaken using the cumulative detection probability equation (P* = 1 – (1 – P)k) (Kéry and Royle 2016).
Results
Phase one – trial
Data exploration identified that there was no collinearity among covariates, no zero inflation or missing values and no outliers in the response or explanatory variables. The data were well-balanced for treatment (30 controls, 30 active treatments) and distance (20 at 1 km, 20 at 2.5 km, 20 at 5 km) but slightly less so for roost (12 for Claravale Station, 12 for Kohinoor, 18 for Spring Hill, 18 for Union Reefs). Model validation indicated no concerns. Mapping identified appropriate spatial dispersion, and inspection of a spatial variogram of the residuals of the model (Keitt et al. 2002) detected no spatial autocorrelation.
In the set of a priori models, model 1 (M1; Table 2), which contained only the variable of treatment, had the greatest Akaike weight (75.58), given the data and set of candidate models. The probability of detecting ghost bats increased with the active treatment when compared with the control (β = −3.50 (s.e. = 1.08), P < 0.001). No other model received strong support (i.e. ΔAICc < 2), and the next-best model (M2) was more than two AIC units (3.57 units) higher than the best model. Consistent with M8 having no significant result, plotting of the data indicated that there was no influence of moon illumination on presence/absence of the ghost bat.
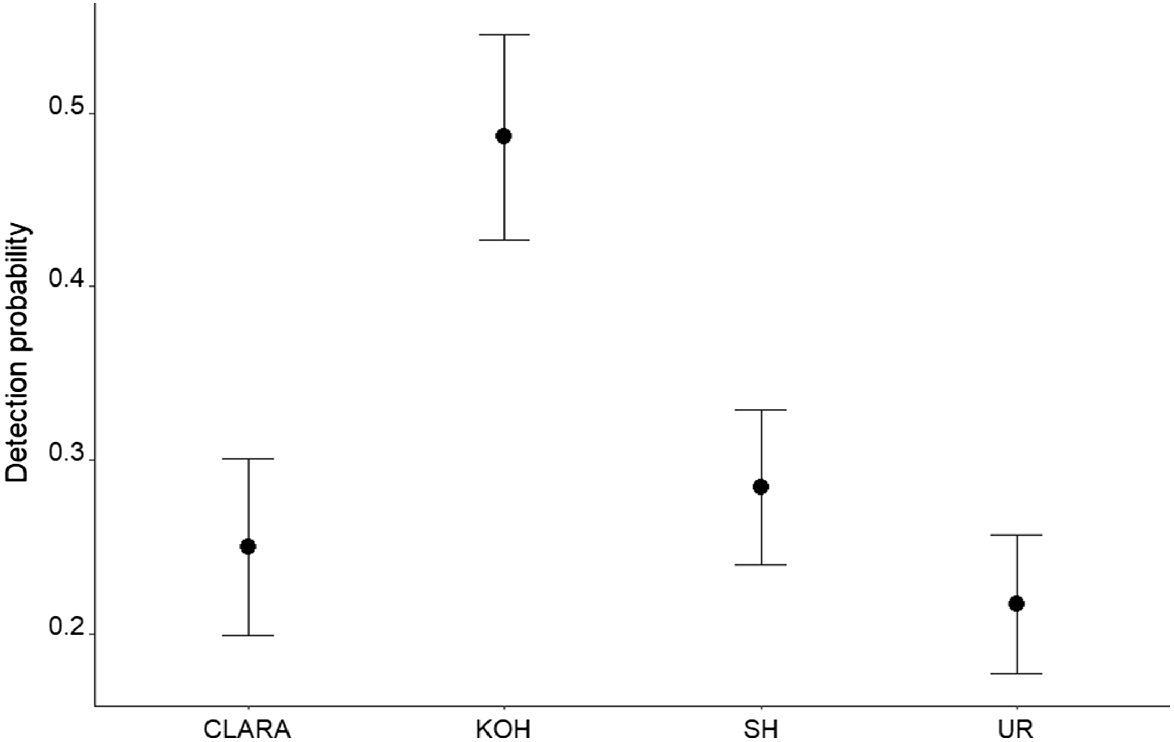
For the detection probability analysis, there was only one model in the 95% model confidence set, with 90% of the sum of model weights (Table 3). Of the variables tested, roost explained almost all of the variation in the detection data. Detection probability was greatest at sampling locations close to Kohinoor (P = 0.49), which is the largest roost, and lowest closest to Union Reefs (P = 0.22), the smallest roost (Fig. 4). Distance was not an important variable in the detection models. Based on data collected during the trial, the optimal number of video minutes to detect the ghost bat with reasonable confidence (90% probability) at least once in a survey period, if the species is present at a survey site, is 90 min (95% confidence interval: 60–140) (Fig. 5).
| Detection model | K | AIC | ΔAIC | AIC weight | |
|---|---|---|---|---|---|
| (~ Detection variable ~ Occupancy variable) | |||||
| ~ Roost ~ 1 | 5 | 425.9 | 0.00 | 0.902 | |
| ~ Roost + Distance ~ 1 | 7 | 431.2 | 5.30 | 0.064 | |
| ~ 1 ~ 1 (null model) | 2 | 433.5 | 7.56 | 0.021 | |
| ~ Roost ~ Roost | 8 | 435.7 | 9.74 | 0.007 | |
| ~ Dist ~ 1 | 4 | 435.7 | 9.74 | 0.007 |
For clarity, only models with a ΔAIC < 10 are shown.
K, number of model parameters; AIC, Akaike’s Information Criterion; ΔAIC, difference between the AIC of this model and the model with the smallest AIC.
Model-estimated detection probability for ghost bats by roost (CLARA, Claravale Station; KOH, Kohinoor adit; SH, Spring Hill; UR, Union Reefs) for the trial. Bars represent the 95% confidence interval of the estimate.
Cumulative detection probability curve for detecting the ghost bat on video during the trial, using broadcast of the ‘squabble’ social call. Shaded area represents the 95% confidence interval. Hatched red horizontal line identifies the cumulative detection probability of 0.90.
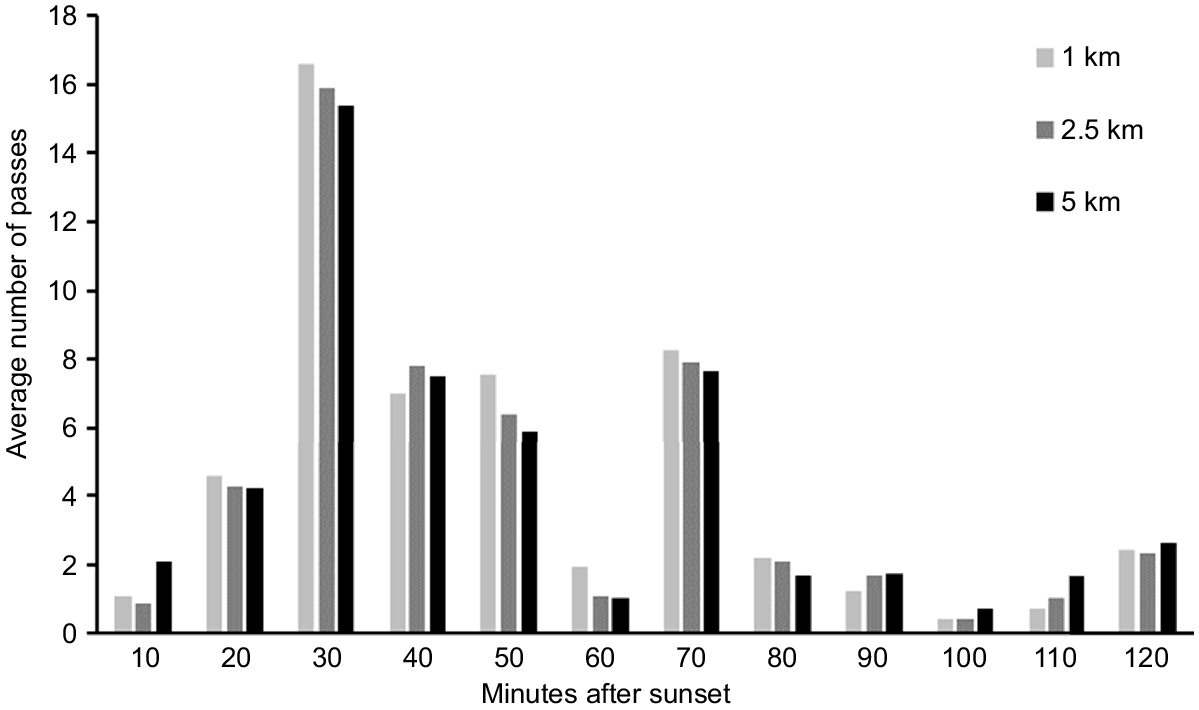
An assessment of the average number of passes by ghost bats across all active treatments in each 10-min interval indicated that there was a peak in passes 30 min after sunset. This pulse was consistent across all three survey distances. There were no discernible differences in activity based on distance from roost (Fig. 6).
Number of detections of ghost bats in 10-min intervals after sunset across the three survey distances (active treatments only) in the trial.
Manual review of videos could be comfortably undertaken at a playback speed up to 1.5 times the real time, with portions of videos re-watched at a maximum of real time speed for confirmation of species. The trial of automated review of video footage for the presence of ghost bats allowed for the output of video clips that had putative ghost bat detections separate to the full video footage from the survey site. If it had been used as the primary mechanism of review, this would have reduced the volume of video that needed to be manually reviewed.
Bat detectors recorded a total of 46 666 files (.wav), and 1647 of these were confidently allocated to species or, for species that are difficult to differentiate, to genus or species group. The playback of the ghost bat ‘squabble’ call was identifiable in some files; however, when excluding that, there were no instances in which ghost bat social or echolocation calls were identified via the recordings, even for survey sites at which there were detections of the ghost bat on video camera footage.
The ‘zone of influence’ assessment identified that, with the aid of the sound recorder, the recording of ghost bats’ social calls could be heard by the human ear clearly in all directions out to 75 m. The recording attenuated to not being heard between 125 m and >150 m, depending on the cardinal direction (Table 4).
| Direction | Distance from point of broadcast | |||||
|---|---|---|---|---|---|---|
| 0–50 m | 75 m | 100 m | 125 m | 150 m | ||
| North | Clearly | Clearly | Faintly | Faintly | Not at all | |
| East | Clearly | Clearly | Faintly | Not at all | Not at all | |
| South | Clearly | Clearly | Faintly | Faintly | Not at all | |
| West | Clearly | Clearly | Faintly | Faintly | Faintly | |
Phase two – application
Thirty survey sites were surveyed, equating to a total survey area of 65 010 ha (approximate Euclidean maximal survey area extent of 52 km east–west and 29 km north–south and a total that assumes ghost bat travel at least 5 km from roosts for foraging) or, based on the 125-m ‘zone of influence’ result, a minimal area of 147 ha. However, replicate surveys were successfully undertaken at only 28 of those 30 survey sites; two sites were each surveyed only once due to equipment failure (n = 1) and unexpected, continuous, anthropogenic noise (n = 1) during the attempted replicates.
Ghost bats were detected at 16 survey sites; these were concentrated in the north-west, east and south-east of the survey area (Fig. 1). At those sites, the total number of passes across both nights (excluding a single-replicate survey site) ranged from 1 to 119 (average 26.8). ‘Hotspots’ of activity (i.e. higher number of passes by ghost bats) were concentrated to the north, east and west of Kintore Caves Conservation Reserve and east of Cutta Cutta Caves Nature Park. There were no detections of ghost bats at the remaining 14 survey sites (including a single-replicate survey site); these were mostly around the town of Katherine.
For the occupancy modelling, a null model (constant detection and occupancy probability) was compared with a model where detection varied between surveys. The ‘survey’ covariate was not significant and ΔAIC was <2 (Table 5), so the null model was used. The occupancy estimate from the null model was 0.719 (s.e. = 0.178) and the detection probability was 0.505 (s.e. = 0.136). Based on the two surveys conducted at each survey site, cumulative detection probability (P) was 0.75. Three surveys would be required for P = 0.80 and five surveys for P = 0.95.
| Model | AIC | ΔAIC | |
|---|---|---|---|
| Ψ ~ 1 P ~ Survey (+ relationship) | 77.08088 | 0.00 | |
| Ψ ~ 1 P ~ 1 | 78.56711 | 1.49 |
AIC, Akaike’s Information Criterion; ΔAIC, difference between the AIC of this model and the model with the smallest AIC.
Discussion
To be effective, survey protocols must be robust, repeatable and account for the behaviour and ecology of the target species (Sutherland 2006). Our study established a survey method for ghost bats that can be used in a standardised way, and determined that call playback, in conjunction with an infra-red video recorder, can be used to effectively survey for the presence or occupation of ghost bats in landscape-scale assessments. Researchers and practitioners should generally be able to apply the same approach (grid cells) as that undertaken in the Katherine region to survey at the landscape-scale for the presence (and possibly activity) of the ghost bat. Further, our method includes repeat surveys across multiple sites. This is important for accounting for imperfect detection and for determining the probability of the true presence or absence of ghost bats in a survey area, thus allowing the data to be used for occupancy modelling (MacKenzie et al. 2006). In the Katherine study area, three or five surveys at each survey site would be required to obtain detection probabilities of 0.80 and 0.95 respectively, and to tighten the confidence interval around the occupancy estimate.
Our application of the method used a fishnet of grid cells with centroids spaced at 5 km to survey for ghost bats, allowing an area of approximately 65 010 ha to be surveyed over a period of 16 nights. The survey method is efficient to apply at a landscape scale because survey sites can be located up to 5 km apart (although not surveyed simultaneously); wider distances may also be possible but confirmation of this requires broader testing of the method. In our survey, up to four survey sites were surveyed on any one night, which reflected the equipment that was available. It would be possible for either more or less than four surveys to be run per night, depending on surveyors’ access to sufficient equipment. The more important consideration is to design survey schedules such that, on any one night, all survey sites are at a minimum of 10 km from each other, though a greater separation may be ideal.
The survey method was effective at detecting bats around roosts of varying size. Although detection probabilities per 10-min sampling increment varied among roosts in the trial at Pine Creek (Fig. 4), our results indicate the method is effective for detecting bats in landscapes supporting relatively small numbers of individuals. The survey method is also practical because the cumulative detection probability analysis indicated that 90 min of call playback resulted in a 90% probability of a ghost bat being detected at least once around a roost containing ≥20 individuals. This means that the survey method is relatively efficient, since reviewing videos of that duration is feasible (at least 1.5 h for a 2 h video). Further assessment of effectiveness around roosts with an even smaller population of ghost bats is desirable.
The efficiency of reviewing video could be improved by applying motion analysis (e.g. Open CV) and machine learning (e.g. TensorFlow; Abadi et al. 2015) or other artificial intelligence tools. Preliminary results from the current study showed promise, indicating that the amount of video footage that would need to be manually reviewed would be reduced to only those presences that were questionable, which mostly concerned small bats flying past in the background. Thus, further investigation of the use of motion analysis and deep machine learning is warranted. However, a key lesson from this preliminary assessment was that automation may confuse juvenile ghost bats with other, smaller bat species and will require subsequent manual evaluation. Similarly, manual review of video imagery from the application of the method in the Katherine area (conducted in October–November) was complicated by the presence of juvenile ghost bats. To minimise confusion for both manual reviewers and any automated processing, preferably surveys should not be conducted when juvenile ghost bats are likely to be present. Furthermore, the months in which females are in late gestation or carrying pups should be avoided, because call playback during this period could foreseeably disrupt females’ ability to bring pups to independence. There is variability in the timing of reproduction across the species’ distribution – including within a jurisdiction – and the currently published literature does not reflect this well. As such, where possible, practitioners should use local knowledge of the timing of reproduction to guide their decision on the most appropriate month(s) for surveying. Based on the currently published literature, in the Northern Territory, ideal timing would be from January (when juveniles are fully grown and largely independent; Hanrahan (2020)) to June (pups are born in July and August; Churchill (2008)). In Queensland and the Pilbara region of WA, published literature indicates that births occur from mid-October to late November, with young capable of flight by the end of January and weaned in March (Douglas 1967; Toop 1985; Hoyle et al. 2001). In the Kimberley region of WA, the timing of reproduction is currently undocumented.
Furthermore, in terms of survey timing, a more detailed assessment of any influence of moon illumination is warranted, because any effect is likely to be nuanced. Specifically, illumination during the call playback period, together with local conditions (e.g. cloud cover), is likely to be more relevant than ‘raw’ percentage of moon illumination, as was analysed in the current study. Previous observations suggest that ghost bats may delay emergence from roost sites by hours or nights leading up to and/or during periods of bright moonlight (as per observations in Armstrong 2010; Toop 1978); however, any such effect may not always occur (e.g. Armstrong 2010 found no detectable effect of moon phase on emergence time).
The results from the trial at Pine Creek did not support a relationship between distance from roost and number of passes by ghost bats within a certain time period (i.e. more passes when closer to a roost, accounting for roost size). In other words, there was no pattern of increasing lag time to detection at 5 km from the roost when compared with 2.5 km and 1 km. There was a peak in the number of passes by ghost bats 30 min into the survey period but this was consistent across the three survey distances. Whether there is any relationship between activity and distance from roost warrants further investigation, particularly for isolated roosts. It is possible that in the Pine Creek area, there are intermediary, currently unknown roosts among the known roosts, and that these confounded differentiation of activity by distance. However, upon emergence from a roost, ghost bats mostly disperse rapidly and commute directly to individual foraging areas (Tidemann et al. 1985). Foraging areas may range from being quite close to the roost (e.g. mean distance of 1.9 km from the roost for five individuals from Kohinoor, using VHF tracking; Tidemann et al. 1985) to further away (up to 11.8 km for four individuals from Mt Etna, Queensland, using VHF and GPS tracking; Augusteyn et al. 2018). The minimum calculated flight speed for the species is 2.8 m/s (Bullen et al. 2016), meaning that it would take an individual just under 30 min to travel 5 km. In this context, the current results of a peak in activity 30 min into the survey period (which equates to 1 h after sunset, within the known peak activity period of bats; Milne et al. 2005), and the absence of a relationship between distance from roost and activity, are unsurprising. The results are also supported by data from GPS tracking of ghost bats in the Katherine area undertaken in 2022, which indicated that individuals can travel long distances in short timeframes (authors’ unpubl. data, 2022). Thus, although the ‘zone of influence’ of the broadcast is small (~100–125 m based on the human ear), ghost bats travel a large enough distance from their roost on a nightly basis to be ‘lured in’ to the broadcast if they are present at the survey site, if appropriate survey effort (based on detection probabilities) is expended and if survey sites are set at an appropriate distance.
Management implications
The current research has established a survey method for the ghost bat that is standardised, repeatable and can account for imperfect detection when sampling is repeated at sites. Data obtained using this method can be used to ascertain the occurrence of the ghost bat in previously unsurveyed landscapes; it may also indicate areas where roosts occur, based on detection of areas of high activity. Our method is likely to be more reliable away from known roosts than the combination of approaches currently used for surveying for the ghost bat – acoustic detection and/or live capture (Hourigan 2011). Indeed, our results from Pine Creek support the suggestion that bat detectors are unreliable for detecting the ghost bat: the species was not detected acoustically even at survey sites at which numerous passes by ghost bats were confirmed in video camera footage.
Depending on a survey’s objective, call playback using grid cells could be the first step in a two-stage survey approach. Once ‘hotspots’ of activity are confirmed, the second stage could be to institute on-ground searches for potential ghost bat roost sites within the relevant survey cell(s). A similar survey approach is followed for some other species; for example, surveys for masked owls (Tyto novaehollandiae) typically combine call playback and listening for calls at multiple sites. Results can then be used to draw conclusions about relative population densities (S. Ward unpubl. data). The results for the Katherine area identified the presence of two ‘hotspots’ of activity: around Cutta Cutta Caves Nature Park and Kintore Caves Conservation Reserve. Both parks have extensive limestone outcropping and roosts that have been used by ghost bats both historically and currently (Northern Territory Government 2021). As such, the survey method allowed for an unbiased survey of the study area, yet the results matched existing knowledge of the ghost bat in the region.
Our approach is usable across the ghost bats’ range, although it should be noted that region-specific vocalisations (i.e. from the Northern Territory) were used in the current study, and their transferability is currently unknown. Dialects among geographically distant colonies (~800 km apart) in the Northern Territory have been observed (Hanrahan 2020); thus, it may be necessary to obtain ghost bat vocalisations that are specific to the target region when applying this survey method.
Further application across the species’ distribution, as well as development of automated approaches to the review of video footage, should improve the generality and functionality of this survey method. Nevertheless, it represents an advance on surveying for the ghost bat and will assist in future monitoring and management of this threatened species.
Data availability
The datasets generated and/or analysed during the current study are available as supplementary material; however, locational information for survey sites has been withheld because it constitutes sensitive data.
Declaration of funding
The project was funded by the ‘Mapping the Future’ initiative of the Northern Territory Government’s Department of Environment, Parks and Water Security.
Acknowledgements
The following are thanked for permitting access to properties for the trials around Pine Creek: Kirkland Lake Gold for Union Reefs; PC Gold for Spring Hill; and former managers Tom Hayman and Helen Reed for Claravale Station. We are also grateful to the people and/or organisations who allowed access to the properties that they own and/or manage in the Katherine area. Flora and Fauna Division staff are thanked for assistance with fieldwork in Pine Creek and Katherine, and P. McDonald is thanked for assistance with statistical analyses. We also thank D. Milne and A. Fisher for reviewing drafts of the manuscript. Accommodation was generously provided by the Katherine Research Station of the Northern Territory Government’s Department of Industry, Tourism and Trade. The study was conducted under the Charles Darwin University Animal Ethics Committee project A17021, a Permit to interfere with wildlife for commercial purposes (number 62773) from the Parks and Wildlife Commission of the Northern Territory and a Licence to use premises for teaching or research involving animals (number 011) from the Animal Welfare Authority.
References
Abadi M, Agarwal A, Barham P, Brevdo E, Chen Z, et al. (2015) TensorFlow: large-scale machine learning on heterogeneous distributed systems. Preliminary white paper, November 9, 2015. Available at https://static.googleusercontent.com/media/research.google.com/en//pubs/archive/45166.pdf [accessed 2 February 2022]
Armstrong KN (2010) Assessing the short-term effect of minerals exploration drilling on colonies of bats of conservation significance: a case study near Marble Bar, Western Australia. Journal of the Royal Society of Western Australia 93, 165-174.
| Google Scholar |
Armstrong KD, Woinarski JCZ, Hanrahan NM, Burbidge AA (2021) Macroderma gigas (amended version of 2019 assessment). The IUCN Red List of Threatened Species 2021: e.T12590A209530568. Available at https://dx.doi.org/10.2305/IUCN.UK.2021-3.RLTS.T12590A209530568.en. [accessed 16 November 2022]
Augusteyn J, Hughes J, Armstrong G, Real K, Pacioni C (2018) Tracking and tracing central Queensland’s Macroderma – determining the size of the Mount Etna ghost bat population and potential threats. Australian Mammalogy 40, 243-253.
| Crossref | Google Scholar |
Australasian Bat Society – BatMap (2022) Macroderma gigas. Available at http://ausbats.org.au/batmap. [accessed 2 September 2022]
Australian Government (2010) Survey guidelines for Australia’s threatened bats. Department of the Environment, Water, Heritage and the Arts, Canberra, Australia. Available at https://www.dcceew.gov.au/sites/default/files/documents/survey-guidelines-bats.pdf [accessed 17 November 2022]
Barden PA, Armstrong KN (2019) Union Reefs north underground project environmental impact assessment – Ghost Bat technical report. Ecological Management Services and Specialised Zoological, Coolum Beach, Queensland. Available at https://ntepa.nt.gov.au/__data/assets/pdf_file/0004/760927/draft_eis_union_reefs_north_underground_mine_appendixG_ghost_bat_technical_report.pdf [accessed 12 August 2022]
Barton K (2017) MuMIn: multi-model inference. R package version 1.40.0. Available at http://CRAN.R-project.org/package=MuMIn. [accessed 17 November 2022]
Bridge PJ (1975) Paleo-distribution of Macroderma gigas in the South-west of Western Australia. Helictite 13, 35-36.
| Google Scholar |
Bullen RD, McKenzie NL, Cruz-Neto AP (2016) Characteristic flight speeds in bats. CEAS Aeronautical Journal 7, 621-643.
| Crossref | Google Scholar |
Cramer VA, Armstrong KN, Bullen RD, Cross SL, Gibson L, Hanrahan N, Knuckey CG, Ottewell K, Reiffer S, Ruykys L, Shaw RE, Thavornkanlapachai R, Thompson SA, Wild S, van Leeuwen S (2023) Research priorities for the ghost bat (Macroderma gigas) in the Pilbara region of Western Australia. Australian Mammalogy 45(1), 1-12.
| Crossref | Google Scholar |
Douglas AM (1967) The natural history of the ghost bat, Macroderma gigas (Microchiroptera, Megadermatidae), in Western Australia. The Western Australian Naturalist 10, 125-138.
| Google Scholar |
Duffy AM, Lumsden LF, Caddle CR, Chick RR, Newell GR (2000) The efficacy of Anabat ultrasonic detectors and harp traps for surveying microchiropterans in south-eastern Australia. Acta Chiropterologica 2, 127-144.
| Google Scholar |
Fiske IJ, Chandler RB (2011) Unmarked: an R package for fitting hierarchical models of wildlife occurrence and abundance. Journal of Statistical Software 43, 1-23.
| Crossref | Google Scholar |
Guppy A, Coles RB (1988) Acoustical and neural aspects of hearing in the Australian gleaning bats, Macroderma gigas and Nyctophilus gouldi. Journal of Comparative Physiology A 162, 653-668.
| Crossref | Google Scholar |
Hanrahan N, Turbill C, Armstrong KN, Dalziell AH, Welbergen JA (2019) Ghost bats exhibit informative daily and seasonal temporal patterns in the production of social vocalisations. Australian Journal of Zoology 67, 305-315.
| Crossref | Google Scholar |
Hanrahan N, Dalziell AH, Turbill C, Armstrong KN, Welbergen JA (2022) Ethogram of ghost bat (Macroderma gigas) behaviours and associated social vocalisations. Acta Chiropterologica 24, 195-208.
| Crossref | Google Scholar |
Heller KG (1995) Echolocation and body size in insectivorous bats: the case of the giant naked bat Cheiromeles torquatus (Molossidae). Le Rhinolophe 11, 27-38.
| Google Scholar |
Hill DA, Armstrong KN, Barden PA (2015) Preliminary assessment suggests that acoustic lures can increase capture rates of Australian echolocating bats. Australian Mammalogy 37, 104-106.
| Crossref | Google Scholar |
Hourigan C (2011) Ghost bat, Macroderma gigas. Targeted species survey guidelines. Department of Environment and Science, Queensland Government, Brisbane, Queensland. Available at https://www.qld.gov.au/__data/assets/pdf_file/0018/67140/ghost-bat.pdf [accessed 17 November 2022]
Hoyle SD, Pople AR, Toop GJ (2001) Mark–recapture may reveal more about ecology than about population trends: demography of a threatened ghost bat (Macroderma gigas) population. Austral Ecology 26, 80-92.
| Crossref | Google Scholar |
Hurvich CM, Tsai C-L (1989) Regression and time series model selection in small samples. Biometrika 76, 297-307.
| Crossref | Google Scholar |
Keitt TH, Bjørnstad ON, Dixon PM, Citron-Pousty S (2002) Accounting for spatial pattern when modeling organism-environment interactions. Ecography 25, 616-625.
| Crossref | Google Scholar |
Lintott PR, Fuentes-Montemayor E, Goulson D, Park KJ (2013) Testing the effectiveness of surveying techniques in determining bat community composition within woodland. Wildlife Research 40, 675-684.
| Crossref | Google Scholar |
Michaelsen TC, Jensen KH, Högstedt G (2011) Topography is a limiting distributional factor in the soprano pipistrelle at its latitudinal extreme. Mammalian Biology 76, 295-301.
| Crossref | Google Scholar |
Milne DJ, Fisher A, Rainey I, Pavey CR (2005) Temporal patterns of bats in the Top End of the Northern Territory, Australia. Journal of Mammalogy 86, 909-920.
| Crossref | Google Scholar |
Milne DJ, Burwell CJ, Pavey CR (2016) Dietary composition of insectivorous bats of the Top End of Australia. Australian Mammalogy 38, 213-220.
| Crossref | Google Scholar |
Northern Resource Consultants (2018) Spring Hill. Appendix A: monitoring plan. South Townsville, Qld. Available at epbcnotices.environment.gov.au/_entity/annotation/34dd61fb-1715-e811-92a8-005056ba00a8/a71d58ad-4bca-48b6-8dab-f3091fc31cd5?t=1597536000335
Northern Territory Government (2014) Sinkholes of the Northern Territory. Northern Territory Government, Palmerston, Northern Territory. Dataset Available at https://nrmaps.nt.gov.au/nrmaps.html [accessed 17 November 2022]
Northern Territory Government (2019) Katherine Tindall Limestone aquifer water allocation plan 2019-2024. Department of Environment and Natural Resources, Northern Territory Government, Darwin, Australia. Available at https://denr.nt.gov.au/__data/assets/pdf_file/0017/702422/Katherine-Tindall-limestone-aquifer-water-allocation-plan-2019-2024-1.pdf [accessed 17 November 2022]
Northern Territory Government (2021) Fauna Atlas N.T. Northern Territory Government, Palmerston, Northern Territory. Dataset available at https://nrmaps.nt.gov.au/nrmaps.html [accessed 17 November 2022]
Ottewell K, Thavornkanlapachai R, McArthur S, Spencer PBS, Tedeschi J, Durrant B, Knuckey C, Armstrong K, Byrne M (2020) Development and optimisation of molecular assays for microsatellite genotyping and molecular sexing of non-invasive samples of the ghost bat, Macroderma gigas. Molecular Biology Reports 47, 5635-5641.
| Crossref | Google Scholar | PubMed |
Parker SA (1973) An annotated checklist of the native land mammals of the Northern Territory. Records of the South Australian Museum 16, 1-57.
| Google Scholar |
Pettigrew JD, Baker GB, Baker-Gabb D, Baverstock G, Coles R, Conole L, Churchill S, Fitzherbert K, Guppy A, Hall LS, Helman P, Nelson J, Priddell DM, Pulsford I, Richards GC, Schulz M, Tidemann CR (1986) The Australian ghost bat, Macroderma gigas, at Pine Creek, Northern Territory. Macroderma 2, 8-19.
| Google Scholar |
Pettigrew JD, Dreher B, Hopkins CS, McCall MJ, Brown M (1988) Peak density and distribution of ganglion cells in the retinae of microchiropteran bats: implications for visual acuity. Brain, Behavior and Evolution 32, 39-56.
| Crossref | Google Scholar | PubMed |
Preble JH, Vincenot CE, Hill DA, Ohte N (2021) Capturing endangered endemic Okinawan bats with acoustic lures. Journal for Nature Conservation 64, 126074.
| Crossref | Google Scholar |
Thorsen S (2023) Moon phases for Pine Creek, Australia. Time and Date AS 1995–2023. Available at https://www.timeanddate.com [accessed 18 August 2020].
Threatened Species Scientific Committee (2016) Conservation Advice Macroderma gigas ghost bat. Department of the Environment, Canberra, Australia. Available at http://www.environment.gov.au/biodiversity/threatened/species/pubs/174-conservation-advice-05052016.pdf. [accessed 17 November 2022]
Tidemann CR, Priddel DM, Nelson JE, Pettigrew JD (1985) Foraging behaviour of the Australian Ghost Bat, Macroderma gigas (Microchiroptera: Megadermatidae). Australian Journal of Zoology 33, 705-713.
| Crossref | Google Scholar |
Toop J (1985) Habitat requirements, survival strategies and ecology of the ghost bat Macroderma gigas Dobson (Microchiroptera, Megadermatidae) in central coastal Queensland. Macroderma 1, 37-41.
| Google Scholar |
Weinstein BG (2018) Scene-specific convolutional neural networks for video-based biodiversity detection. Methods in Ecology and Evolution 9, 1435-1441.
| Crossref | Google Scholar |
Worthington Wilmer J, Moritz C, Hall L, Toop J (1994) Extreme population structuring in the threatened ghost bat, Macroderma gigas: evidence from mitochondrial DNA. Proceedings of the Royal Society of London. Series B: Biological Sciences 257, 193-198.
| Crossref | Google Scholar |
Worthington Wilmer J, Hall L, Barratt E, Moritz C (1999) Genetic structure and male-mediated gene flow in the Ghost Bat (Macroderma gigas). Evolution 53, 1582-1591.
| Crossref | Google Scholar | PubMed |
Zuur AF, Ieno EN, Elphick CS (2010) A protocol for data exploration to avoid common statistical problems. Methods in Ecology and Evolution 1, 3-14.
| Crossref | Google Scholar |